ezfly international travel agent co. 2734 conference... · company profile industrial overview...
TRANSCRIPT

Ezfly International Travel Agent Co.(2734)

Company Profile
Industrial Overview
Product Introduction
Business Achievement
Future Strategy
Outline
1

Company Profile
2

Company Introduction
Establishment Dec., 1999
Chairman Yu wei Chou
General Manager
K.J Lee
Employees 191
Offices Headquarter: Taipei Branch: Taichung, Kaohsiung
Capital 204.5 million NTD
Main Business
•Domestic group tour and individual tour •Outbound group tour and individual tour •Domestic hotel and flight ticket booking service •Global hotel and flight ticket booking service •Inbound tourism service
3

Company History
1999 2010 2011 2012 2013
Established
The first OTA celebrated 10th anniversary in Taiwan
Transferred of management team
Cooperated with Expedia
HQ moved to Hengyang Rd.
Became listed company on Dec. 26th
4

Structure of Stock-Rights
Directors
56%
Major
shareholders
10%
Others
34%
Holding percentage
Resource : M.O.P.S. 2014/Mar.
Total Issued Shares:20,450,000
5

Holding company for China branch
Chinese tourist inbound travel
service
Related Enterprises
Ezfly International Travel Agent
100% 100%
Ezfly Travel Agent
Fresh King Enterprises
Limited
6

Industrial Overview
7

Outbound tourism market overview Resource: Tourism Bureau, ROC(Taiwan),2014
3,262 3,496
4,015 4,323
4,134
3,667
4,371 4,642
4,991 5,200(E)
7,781 8,208
8,671 8,964
8,465
8,143
9,415 9,584
10,240
11,052
-
2,000
4,000
6,000
8,000
10,000
12,000
2004 2005 2006 2007 2008 2009 2010 2011 2012 2013
Outbound tourist expenditure (unit:100 mil. NTD) Outbound tourist(unit: 1K visits)
8

Destination for outbound, 2013 Resource: Tourism Bureau, ROC(Taiwan),2014
94%
4% 1% 1%
Asia
Asia America Europe
Oceania Africa Others
China
29%
Japan
23%
HK
20%
Korea
5%
Macau
5%
Others
18%
Asia
9

Inbound tourism market overview Resource: Tourism Bureau, ROC(Taiwan),2014
1,340 1,585 1,651 1,712
1,871
2,253
2,759
3,260 3,485
3,660(E)
2,950
3,378 3,520
3,716 3,845
4,395
5,567
6,087
7,311
8,016
-
1,000
2,000
3,000
4,000
5,000
6,000
7,000
8,000
9,000
2004 2005 2006 2007 2008 2009 2010 2011 2012 2013
Inbound tourist expenditure(unit:100 mil.NTD) Inbound tourist(unit:1K visits)
10

Domestic tourism market overview Resource: Tourism Bureau, ROC(Taiwan),2014
2,181
2,478
1,926
2,243 2,193
1,842 1,828
2,381
3,103
2,699 102
109
93
108 110
96 98
124
152
142
20
40
60
80
100
120
140
160
1,500
2,000
2,500
3,000
3,500
2003 2004 2005 2006 2007 2008 2009 2010 2011 2012
Domestic tourist expenditure(unit:100mil. NTD) Domestic tourist(unit: 1mil. Visits)
11
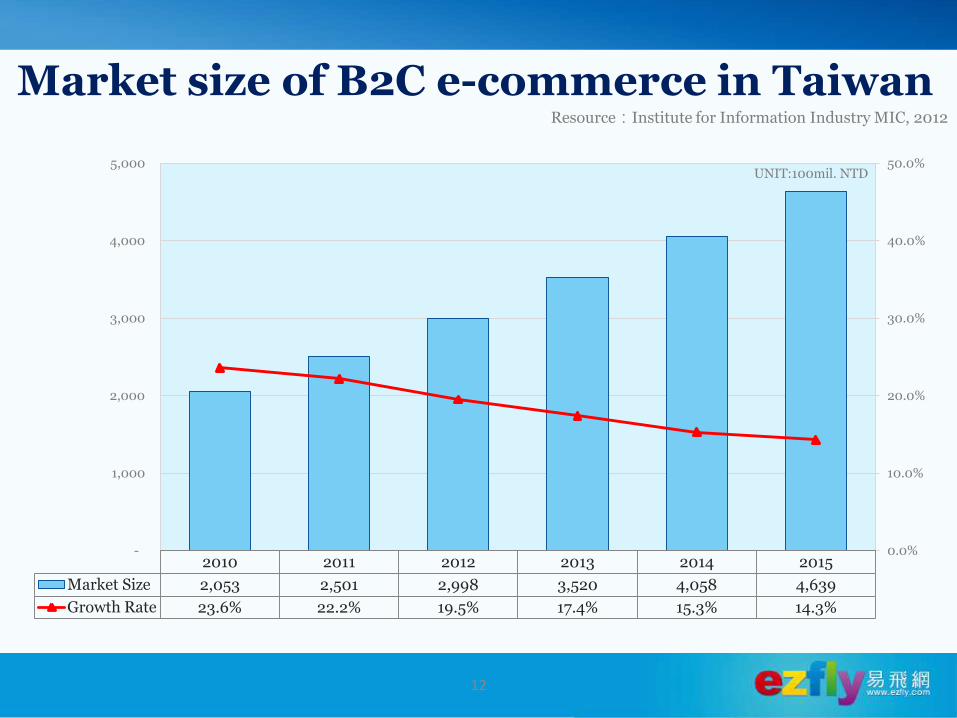
Market size of B2C e-commerce in Taiwan Resource:Institute for Information Industry MIC, 2012
2010 2011 2012 2013 2014 2015
Market Size 2,053 2,501 2,998 3,520 4,058 4,639
Growth Rate 23.6% 22.2% 19.5% 17.4% 15.3% 14.3%
0.0%
10.0%
20.0%
30.0%
40.0%
50.0%
-
1,000
2,000
3,000
4,000
5,000 UNIT:100mil. NTD
12

Product Introduction
13

Main Product
Domestic Tour •Group tour/ Package tour
•Domestic airline package
•Real-time domestic hotel and airline ticket booking service
•Group tour/ Package tour
•Airline package
•Real-time global hotel and airline ticket booking service
Outbound Tour
•China tourist inbound service
•B2E business trip
•B2B service
Other travel service
•HSR Package tour
•Passport & Visa reservation service
•Transportation ticket booking service
14

Competitive Advantage
Channel
Component Purchasing
System
Internet Platform
Customized Process
Global Component
platform
15

Business Achievement
16

Unit: Thousand NTD
704,329
945,126
1,290,552
1,489,914
2010 2011 2012 2013
CAGR ≒30%
Net Revenue from 2010 to 2013
17

Consolidated Statements of Income Unit: Thousand NTD, Except EPS
2013 2012 YoY
Amount % Amount % %
Net Revenue 1,489,914 100.00% 1,290,552 100.00% 15.45%
Gross Profit 202,586 13.60% 143,634 11.13% 41.04%
Operating Expenses (156,297) (10.49%) (133,156) (10.32%) 17.38%
Income from Operations
46,289 3.11% 10,478 0.81% 341.77%
Non-operating Income
8,779 0.59% 11,423 0.89% (23.15%)
Income before Income Tax
55,068 3.70% 21,901 1.70% 151.44%
Net Income 55,632 3.74% 20,277 1.57% 174.36%
EPS (Note) 3.01 1.21 148.76%
Note:2013 and 2012 weighted average number of ordinary shares in computation of basic EPS are 18 ,488 thousand shares and 17,625 thousand shares.
18

100
200
300
400
500
600
700
800
FIT Northeast Asia Southeast Asia HK, Macau & China
Other regions Domestic Inbound
2012 2013
Revenue YoY comparison by BU
unit: mil. NTD
+35%
+31%
+16% -12%
-32%
-1%
+140%
19

Sales proportion in 2013
FIT
5%
Northeast Asia
47%
Southeast Asia
9%
HK, Macau &
China
8%
Other regions
4%
Domestic
21%
Inbound
6%
20

Balance Sheets & Key Indices Selected Items from B/S 2013/12/31 2012/12/31
Amount % Amount %
Cash & Marketable Securities 318,383 45 195,020 35
Account Receivables 72,849 10 49,202 9
Current Assets 458,776 64 326,808 58
Net PP&E 188,282 26 187,663 34
Total Assets 712,566 100 558,665 100
Current Liabilities 202,512 29 181,980 33
Long-term Loans 99,736 14 100,000 18
Total Liabilities 303,287 43 283,523 51
Total Shareholders’ Equity 409,279 57 275,142 49
Key Indices
A/R Turnover Days 15 11
Current Ratio(%) 227 180
Debt Ratio(%) 43 51
ROE(%) 16.3 7.8
Unit: Thousand NTD
21

Future Strategy
22

Short-term Strategy
Increase market share of Outbound tourism - Diversified product -Leverage B2B & B2E -Membership management -Horizontal alliances
Increase market share of Inbound tourism - New travel act in China -Resource of bank -Domestic tourism component
23

Long-term Strategy
FIT Ticket
Domestic Market
Inbound FIT Domestic Tourism
Outbound Market
Outbound FIT
Domestic Tourism
Component
Global Tourism elements
API linkage
Hotel Distribution
System
24
