extruvis application note - how to measure residence time distribution on a continuous twin-screw...
TRANSCRIPT

ExtruVis3 Application Note: Determination of Residence Time Distribution in a Twin-Screw Granulation Process Dated from 2016-04-17 Author: Andreas Gryczke for ExtruVis Contact E-Mail: [email protected] Phone: +49 151 1794 6926
Application Note: Determination of Residence Time Distribution in a Twin-Screw Granulation Process
ExtruVis3 – Manual Version 1.0 – Contact [email protected] Measuring Residence Time Was Never Easier!
2
Application Note: Determination of Residence Time Distribution in a Twin-Screw Granulation Process Acknowledgements This application note could be realised thanks to the help of the Heinrich-Heine-University Düsseldorf, Germany, Department of Pharmaceutics, Prof. Dr. Peter Kleinebudde and his working group. Introduction The purpose of this study is to demonstrate the use of ExtruVis to determine the residence time distribution in a continuous twin-screw granulation process. Certain parameter like the influence of the feed rate on the mean residence time are investigated. Further it was investigated which amount of tracer is as a minimum necessary to allow proper measurement and which amount of tracer should be the maximum, before an influence of the tracer on the RTD can be seen. The continuous twin-screw granulation is a process by which a granulate is produced from a powder in conjunction with a liquid or liquefied binder. This process is used in several industries such as pharmaceutical industry or food industry. In general, the powder is given on two screws which can consist of conveying and mixing elements. The powder gets mixed on the turning screws. A binder is typically added dissolved via a liquid feeding port. As soon as the binder get mixed with the dry powder the agglomeration happens. The resulting particle size is determined via different parameter like ingredients in the formulation but also process parameter like screw speed, feed rate and screw configuration. As granulator a modified parallel co-rotating twin-screw compounder can be used. Materials and Methods The formulation granulated ca be found in the following table:
Lactose (Granulac 200) 80% MCC (Vivapur 101) 17% Povidon (Kollidon® 17) 3%
As granulation liquid water was used in a ratio of 0.35 liquid to solid. As granulator a Thermo Fisher 16mm parallel co-rotating twin-screw granulator TSE16 with a functional screw length of 40L/D was used.

Application Note: Determination of Residence Time Distribution in a Twin-Screw Granulation Process
ExtruVis3 – Manual Version 1.0 – Contact [email protected] Measuring Residence Time Was Never Easier!
3
To measure the residence time distribution, the ExtruVis3 system was used consisting of the camera, a 35mm video lens with a MOD of 45cm and the LED ringlight. As tracer AMARANTH 85 E 123, SICOVIT CHINOLINGELB 70 E 104 and Sicovit Grünlack were tested. Purpose was to identify which tracer is the most suitable. Setup of the experiment The ExtruVis3 camera was setup with the standard lense which has a minimum object distance (MOD) of 45cm in an approximate distance of 50cm from the exit area at twin-screw granulator. Using the UNIKLEM as base for the tripod axillary material fixing it on a separate table. The camera was mounted on a ballhead to allow easy adjustment of the direction the camera had to face to capture the scenery of the granulation exit zone. The ringlight was mounted on the lens but not fixed completely in the beginning until the camera was fully adjusted and the focus was set to see a sharp and crisp picture. The aperture was set to 4.
Figure 1 - The Twin-Screw Granulation Process Setup
Application Note: Determination of Residence Time Distribution in a Twin-Screw Granulation Process
ExtruVis3 – Manual Version 1.0 – Contact [email protected] Measuring Residence Time Was Never Easier!
4
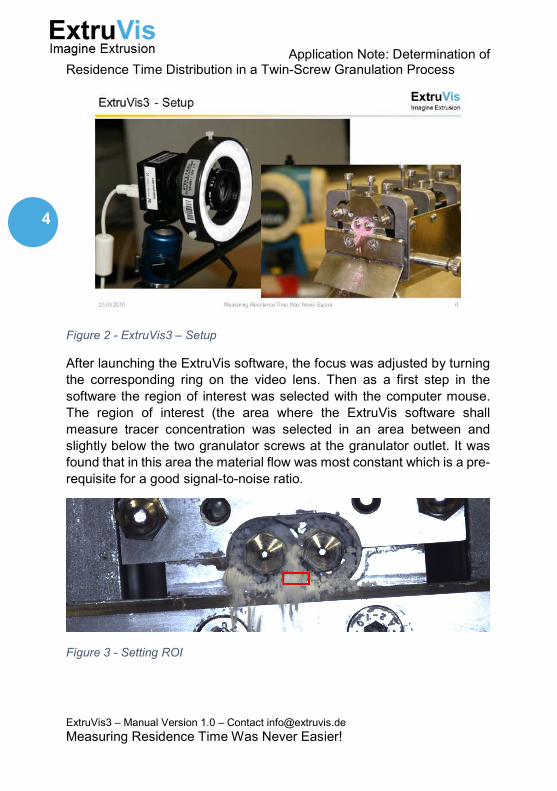
Figure 2 - ExtruVis3 – Setup After launching the ExtruVis software, the focus was adjusted by turning the corresponding ring on the video lens. Then as a first step in the software the region of interest was selected with the computer mouse. The region of interest (the area where the ExtruVis software shall measure tracer concentration was selected in an area between and slightly below the two granulator screws at the granulator outlet. It was found that in this area the material flow was most constant which is a pre-requisite for a good signal-to-noise ratio.
Figure 3 - Setting ROI
Application Note: Determination of Residence Time Distribution in a Twin-Screw Granulation Process
ExtruVis3 – Manual Version 1.0 – Contact [email protected] Measuring Residence Time Was Never Easier!
5
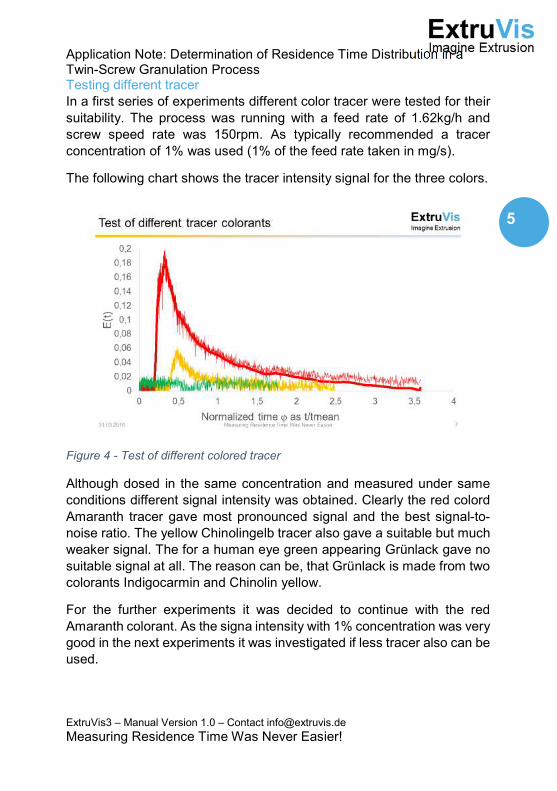
Testing different tracer In a first series of experiments different color tracer were tested for their suitability. The process was running with a feed rate of 1.62kg/h and screw speed rate was 150rpm. As typically recommended a tracer concentration of 1% was used (1% of the feed rate taken in mg/s). The following chart shows the tracer intensity signal for the three colors.
Figure 4 - Test of different colored tracer Although dosed in the same concentration and measured under same conditions different signal intensity was obtained. Clearly the red colord Amaranth tracer gave most pronounced signal and the best signal-to-noise ratio. The yellow Chinolingelb tracer also gave a suitable but much weaker signal. The for a human eye green appearing Grünlack gave no suitable signal at all. The reason can be, that Grünlack is made from two colorants Indigocarmin and Chinolin yellow. For the further experiments it was decided to continue with the red Amaranth colorant. As the signa intensity with 1% concentration was very good in the next experiments it was investigated if less tracer also can be used.
Application Note: Determination of Residence Time Distribution in a Twin-Screw Granulation Process
ExtruVis3 – Manual Version 1.0 – Contact [email protected] Measuring Residence Time Was Never Easier!
6
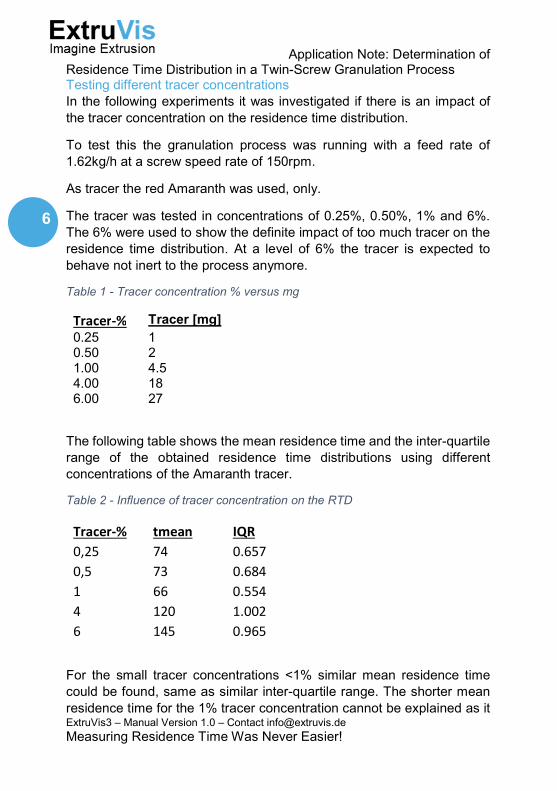
Testing different tracer concentrations In the following experiments it was investigated if there is an impact of the tracer concentration on the residence time distribution. To test this the granulation process was running with a feed rate of 1.62kg/h at a screw speed rate of 150rpm. As tracer the red Amaranth was used, only. The tracer was tested in concentrations of 0.25%, 0.50%, 1% and 6%. The 6% were used to show the definite impact of too much tracer on the residence time distribution. At a level of 6% the tracer is expected to behave not inert to the process anymore. Table 1 - Tracer concentration % versus mg
Tracer-% Tracer [mg] 0.25 1 0.50 2 1.00 4.5 4.00 18 6.00 27
The following table shows the mean residence time and the inter-quartile range of the obtained residence time distributions using different concentrations of the Amaranth tracer. Table 2 - Influence of tracer concentration on the RTD
Tracer-% tmean IQR 0,25 74 0.657 0,5 73 0.684 1 66 0.554 4 120 1.002 6 145 0.965
For the small tracer concentrations <1% similar mean residence time could be found, same as similar inter-quartile range. The shorter mean residence time for the 1% tracer concentration cannot be explained as it

Application Note: Determination of Residence Time Distribution in a Twin-Screw Granulation Process
ExtruVis3 – Manual Version 1.0 – Contact [email protected] Measuring Residence Time Was Never Easier!
7
was expected to be approx. 74s, too. All measurements were done once, only. For the higher tracer concentrations clearly an impact on the RTD can be found as the mean residence time is with 120s repectively 145se much longer than for the smaller tracer concentrations. Similar observation is made for the inter-quartile range. Here the high tracer concentration influences the mass flow in the process and is expressed as a kind of “axial smearing” over time. The 0.25% tracer can be concluded is a sufficient small enough amount of tracer for the continuous twin-screw granulation process. But tracer up to 1% would be acceptable. If large enough above 1% the tracer would be not inert to the process anymore.
Figure 5 - 0.25% of Tracer are sufficient quantity for proper determination of residence time distribution in a twin-screw granulation process, providing good signal-to-noise ratio Testing the influence of different feed rate on the residence time distribution In the next experiments we want to run different feed rate of the process (different throughput rates) and measure the residence time distribution. As tracer the Amaranth will be used in a 1% concentration.

Application Note: Determination of Residence Time Distribution in a Twin-Screw Granulation Process
ExtruVis3 – Manual Version 1.0 – Contact [email protected] Measuring Residence Time Was Never Easier!
8
Table 3 - Tracer amount at different feed rates Feed Rate Tracer [mg] 1.62 kg/h 4.5 3.24 kg/h 9 4.86 kg/h 13.5 6.48 kg/h 18 7.29 kg/h 20
A first look at the exit age function of the RTDs plotted versus time shows differences in the residence time distributions depending on the process feed rate. The feed rate is expected to have an influence on the residence time distribution. How to read the RTD, now?
Figure 6 - RTD E(t) vs. time for different process feed rates In general, it has to be stated that the comparison of different residence time distributions is allowed after normalization for AUC=1 and also for E(), only. That means that residence time distributions can be compared only if the exit age function is plotted versus the normalized time (t/tmean) as shown in the following figure.

Application Note: Determination of Residence Time Distribution in a Twin-Screw Granulation Process
ExtruVis3 – Manual Version 1.0 – Contact [email protected] Measuring Residence Time Was Never Easier!
9
Figure 7 - RTD E() vs. normalized time (t/tmean) for different process feed rates This graphs allows a visual comparison of the different residence time distributions. It appears that the RTD for the smallest feed rate of 1.62kg/h is different to the RTDs from the larger feed rates. The graphical inspection is limited in what one can read from the RTD so it is recommended to have a look on derived parameters from the RTD such as the mean residence time and the inter-quartile-range, which is a measure for the axial mixing in the process. The following graph shows the obtained mean residence time as function from the feed rate.
Application Note: Determination of Residence Time Distribution in a Twin-Screw Granulation Process
ExtruVis3 – Manual Version 1.0 – Contact [email protected] Measuring Residence Time Was Never Easier!
10
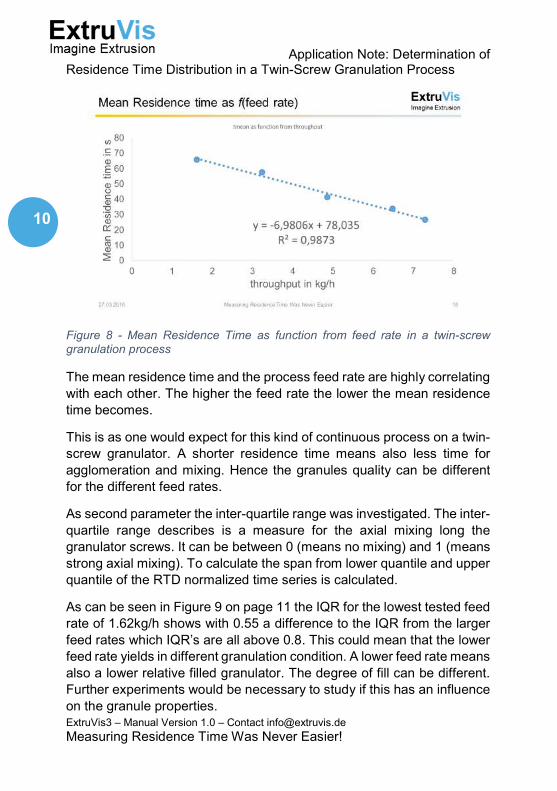
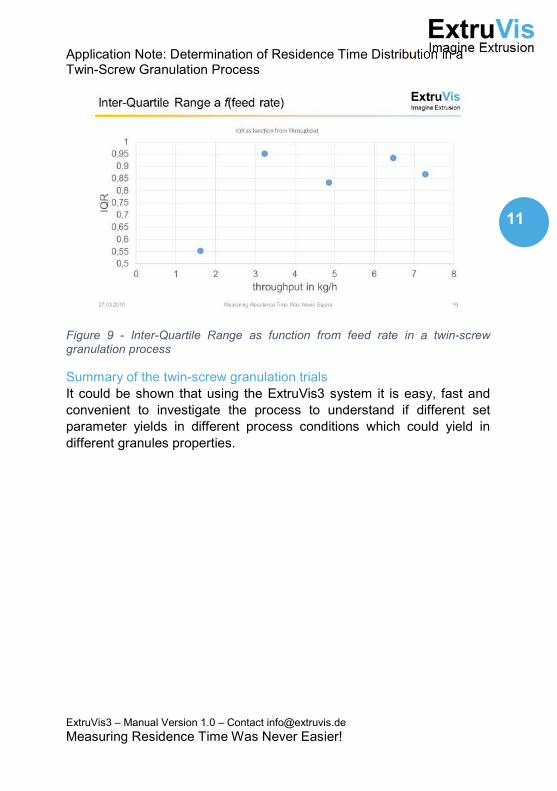
Figure 8 - Mean Residence Time as function from feed rate in a twin-screw granulation process The mean residence time and the process feed rate are highly correlating with each other. The higher the feed rate the lower the mean residence time becomes. This is as one would expect for this kind of continuous process on a twin-screw granulator. A shorter residence time means also less time for agglomeration and mixing. Hence the granules quality can be different for the different feed rates. As second parameter the inter-quartile range was investigated. The inter-quartile range describes is a measure for the axial mixing long the granulator screws. It can be between 0 (means no mixing) and 1 (means strong axial mixing). To calculate the span from lower quantile and upper quantile of the RTD normalized time series is calculated. As can be seen in Figure 9 on page 11 the IQR for the lowest tested feed rate of 1.62kg/h shows with 0.55 a difference to the IQR from the larger feed rates which IQR’s are all above 0.8. This could mean that the lower feed rate yields in different granulation condition. A lower feed rate means also a lower relative filled granulator. The degree of fill can be different. Further experiments would be necessary to study if this has an influence on the granule properties.
Application Note: Determination of Residence Time Distribution in a Twin-Screw Granulation Process
ExtruVis3 – Manual Version 1.0 – Contact [email protected] Measuring Residence Time Was Never Easier!
11
Figure 9 - Inter-Quartile Range as function from feed rate in a twin-screw granulation process Summary of the twin-screw granulation trials It could be shown that using the ExtruVis3 system it is easy, fast and convenient to investigate the process to understand if different set parameter yields in different process conditions which could yield in different granules properties.
Literature Reference
ExtruVis3 – Manual Version 1.0 – Contact [email protected] Measuring Residence Time Was Never Easier!
12
Literature Reference 2016. Advanced Chemical Reaction Kinetics. Prof. Hu's Laboratory of Electrochemistry & Advanced Materials. [Online] 03 03, 2016. http://mx.nthu.edu.tw/~cchu/course/acrk/chapter7.pdf. Ajay Kumar, Girish M. Ganjyal, David D. Jones, and Milford A. Hanna. 2007. Modeling Residence Time Distribution in a Twin-Screw Extruder as a Serias of Ideal-Steady-State Flow Reactors. DigitalCommons@University of Nebraska - Lincoln. [Online] 07 12, 2007. [Cited: 03 03, 2016.] http://digitalcommons.unl.edu/cgi/viewcontent.cgi?article=1043&context=foodsciefacpub. Chemical Engineering, IIT Bombay. 2016. Expt. MT 401 Residence Time Distribution. [Online] 03 03, 2016. http://www.che.iitb.ac.in/courses/uglab/cl431/ms401-rtd.pdf. Fogler, H. Scott. 2006. Essentials of Chemical Reaction Engineering. [Online] 2006. [Cited: 03 03, 2016.] http://umich.edu/~essen/html/byconcept/cdchap/13chap/ECRE_CD-CH13.pdf. Irucka Embry, Victor Roland, Oluropo Agbaje, Valetta Watson, Marquan Martin, Roger Painter, Tom Byl, Lonnie Sharpe. 2013. Derivation of a Multiparameter Gamma Model for Analyzing the Residence-Time Distribution Function for Nonideal Flow Systems as an Alternative to the Advection-Dispersion Equation. [Online] 2013. [Cited: 03 03, 2016.] http://citeseerx.ist.psu.edu/viewdoc/download?doi=10.1.1.466.4232&rep=rep1&type=pdf. http://dx.doi.org/10.1155/2013/539209. RIZVF, BHAJMOHAN SINGH and SYED S.H. 1998. RESIDENCE TIME DISTRIBUTION (RTD) AND GOODNESS OF MIXING (GM) DURING CO,-INJECTION IN TWIN-SCREW EXTRUSION PART I: RTD STUDIES . [Online] 1998. [Cited: 03 03, 2016.] https://www.researchgate.net/publication/227763816_Residence_time_distribution_RTD_and_goodness_of_mixing_GM_during_CO2-injection_in_twin_screw_extrusion_Part_I_RTD_studies.

Literature Reference
ExtruVis3 – Manual Version 1.0 – Contact [email protected] Measuring Residence Time Was Never Easier!
13
S.D., Kanse Nitin G. and Dawande. 2012. RTD Studies in Plug Flow Reactor and its Simulation. Research Journal of Recent Sciences. s.l. : International Science Congress Association , 2012. Vol. Vol. , SSN 2277-2502.

Conctact to ExtruVis
ExtruVis3 – Manual Version 1.0 – Contact [email protected] Measuring Residence Time Was Never Easier!
14
Conctact to ExtruVis In case you require support or an information to operate the ExtruVis3 system, or in case you have to make an enquiry service use the following contact details: Postal reachable address: ExtruVis – Andreas Gryczke Ernst-Ludwig-Strasse 19a 64560 Riedstadt Germany E-Mail: [email protected] Phone: +49 151 1794 6926 Fax: +49 6158 748 268 Web: www.extruvis.com Contact Person: Mr. Andreas Gryczke