extraction of tree crowns and heights using...
TRANSCRIPT

12/6/2012
1
extraction of tree crowns
and heights using lidar
michael swamer | pj houser | geog 4/593 | fall 2012
OVERVIEW
• introduction
o objective
• background
o previous studies
o available data
• methods
o data
o arcmap
o FUSION
• results
o visual
o individual metrics
• conclusions
• future research
12/6/2012
2
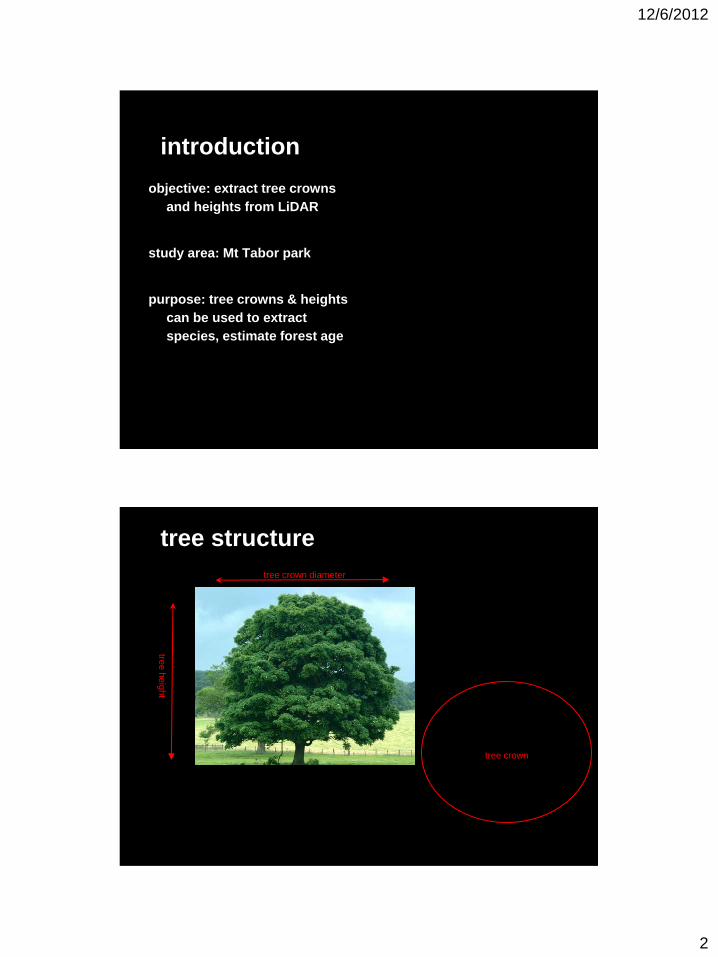
introduction
objective: extract tree crowns
and heights from LiDAR
study area: Mt Tabor park
purpose: tree crowns & heights
can be used to extract
species, estimate forest age
tree structure tre
e h
eig
ht
tree crown diameter
tree crown

12/6/2012
3
study area - Mt Tabor
reasons:
• ground survey for species
• urban area
problems:
• buildings
• reservoirs
• low lying vegetation
• roads
background - previous studies
• tree crowns & heights: o species determination
Kim, Sooyoung (2007) Individual tree species identification using
LIDAR- derived crown structures and intensity data, University of
Washington.

12/6/2012
4
previous work with tree crowns
• other reasons:
o biomass estimation
o forest age and health
o reduce fieldwork for:
forest inventory
fire damage assessment
monitoring forest regeneration
data
• PSU's geography server
o FeatureHeight - raster of Tabor area features
• Watershed Sciences
o points.las - point cloud of Tabor area all returns
o DEM - bare earth raster based on point cloud
• RLIS
o TaborPark.shp - Mt Tabor outline
o TaborHood.shp - Tabor neighborhood
• Parks and Recreation
o TaborVeg.shp - areas on Mt Tabor used for vegetation
surveys, i.e. areas covered with vegetation

12/6/2012
5
Methods
• ArcMap
o treat raster like a watershed
focal flow to determine local maxima (tree heights)
watershed delineation (tree crowns)
• FUSION
o US Forest Service program to analyze LiDAR data and derive canopy
models, tree metrics, and other
o find canopy maxima of LiDAR point cloud, derive crown sizes and tree
heights
methodology in arcmap

12/6/2012
6
step 1 - prepare feature height
raster • make data size
manageable
o clip to tabor neighborhood
• imitate a watershed
o invert surface
o tree peaks become
"ponds"
o tree branches/crowns
become watersheds
o raster calculator:
FeatureHeight * -1
step 2 - find tree peaks
• smooth inverted raster o low filter
• determine local minima o focal flow
• extract tree peaks o con tool
o VALUE = “255”
o if true, return
InvertSurface - negative
elevation of the tree peaks
• remove low lying
vegetation o con tool
o VALUE <= -10
• clip to vegetation layer

12/6/2012
7
• create mask to make tree peaks
null data o tool: RasterCalculator
o IsNull(“ConTree10”)
o 1 means NoData, 0 values are where
the tree peaks are • mask the inverted raster to
prepare to fill sinks o RasterCalculator
o SetNull(“contreemask”==0,
“InvertSurface”)
o inv_null now has noData where there
are tree peaks
step 3 - find tree crowns
step 3 - find tree crowns (cont.)
• fill sinks to prepare for
watershed delineation
• create flow direction surface o Flow Direction
• create watersheds o input Flow Direction:
NullDirection
o input pour points: TreeP10

12/6/2012
8
step 3 - find tree crowns (cont.)
• remove low lying
watersheds o con tool
o VALUE >= 10 • convert to polygons
• clip to vegetated area,
include trees that
overhang roads
• calculate area
• remove polygons less than
25 sq feet
• calculate radii
step 4 - tree crown attributes

12/6/2012
9
tree crowns
FUSION

12/6/2012
10
viewer
command line for tools
• polyclipdata.exe
• canopymodel.exe
• canopymaxima.exe
• dtm2xyz.exe
• ...

12/6/2012
11
FUSION methodology
• load raw point data
• create image from LiDAR
• run canopymodel.exe to derive
canopy.dtm
• run canopymaxima.exe to extract tree
heights and tree crown diameters o output - xy point table
• export to ArcMap
• buffer points with tree crown radius for
visual display
clip point cloud data to
vegetation and load clipped
raw data
FUSION

12/6/2012
12
create image of points
FUSION
FUSION
insert bare earth
surface (derived
from point cloud
by Watershed
Sciences)
12/6/2012
13
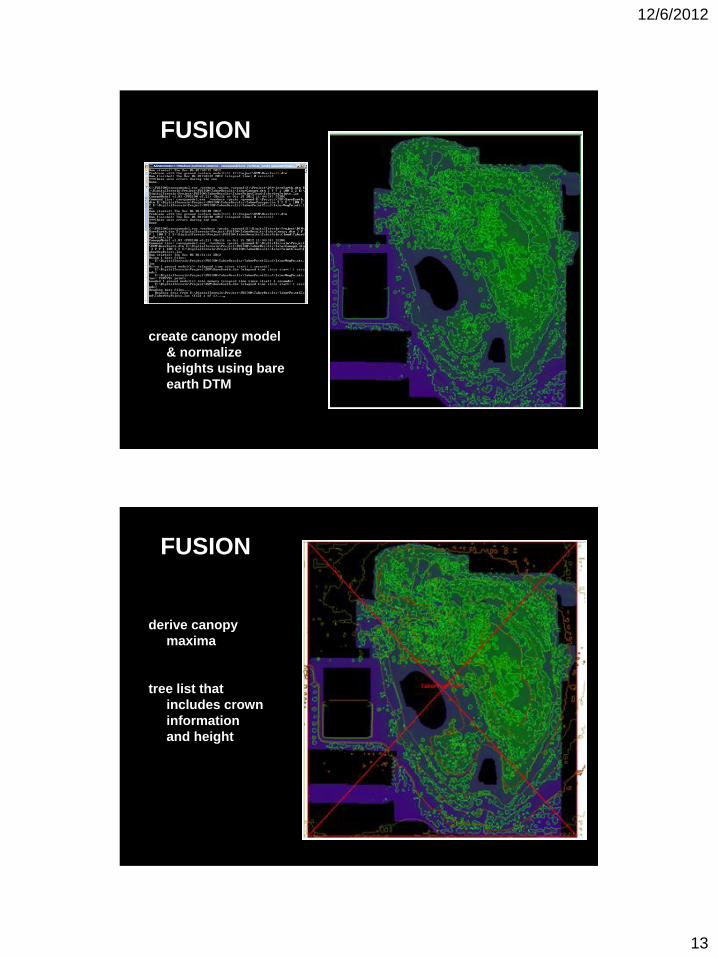
FUSION
create canopy model
& normalize
heights using bare
earth DTM
FUSION
derive canopy
maxima
tree list that
includes crown
information
and height

12/6/2012
14
FUSION
load
CanopyMaxima xy
data into ArcMap
and export as
multipoints
buffer points to
create illusion of
tree crowns
FUSION

12/6/2012
15
visual results FUSION vs ArcMap
statistical
results
ArcMap FUSION
Mean 33.32 29.20
Median 33.08 29.39
Standard Deviation 13.79 7.56
Skewness 0.26 0.34
Minimum 5.72 8.16
Maximum 87.58 82.55

12/6/2012
16
FUSION - individual tree sample
individual tree - manually measure

12/6/2012
17
FUSION results vs sample tree
individual tree vs arcmap vs
FUSION Manual tree measure
X Y Elevation Total height Ht_to_crown Crown
776031.43 1377920 621.19 33.34 4.5966 16.72
FUSION results
X Y Elevation Height Ht_to_crown Crown
776031 1377924 0 654.53 327.27 47.81
ArcMap results
X Y Elevation Height Ht_to_crown Crown
30 - 17.21486

12/6/2012
18
individual vs. group comparisons
• ideally, this would be done to
multiple random trees
• ArcMap results need x and y
values appended
• FUSION results need to show
feature height instead of just
elevation + feature height
• methodology:
o ArcMap - complicated, too many intermediate files
o FUSION - simple once the interface and command line are
understood
• results:
o similar mean, median, skew, distribution
o ArcMap
too many tree crowns
4 times as many tree crowns
o FUSION
smaller tree crowns
possibly too fewer trees
tighter distribution
• currently unknown:
o accuracy of each model
conclusions

12/6/2012
19
• compare to manual analysis of sample plots
o using point cloud data, randomly assign circular plots
o manual delineate tree crowns and tree heights
o within circular plots, compare ArcMap and FUSION tree crowns/heights to
manual delineations
• combine LiDAR intensity or multispectral imagery with tree
crown datasets to derive species
future research