extraction of soil solution for environmental analysis
TRANSCRIPT

This article was downloaded by: [University of Tennessee At Martin]On: 08 October 2014, At: 08:16Publisher: Taylor & FrancisInforma Ltd Registered in England and Wales Registered Number: 1072954 Registeredoffice: Mortimer House, 37-41 Mortimer Street, London W1T 3JH, UK
International Journal ofEnvironmental Analytical ChemistryPublication details, including instructions for authors andsubscription information:http://www.tandfonline.com/loi/geac20
Extraction of Soil Solution forEnvironmental AnalysisJulianna Csillag a , Géza Pártay a , András Lukács a , Klára Bujtása & Tamás Németh aa Research Institute for Soil Science and Agricultural Chemistryof the Hungarian Academy of Sciences , Herman Ottó u. 15,H-1022, Budapest, HungaryPublished online: 22 Sep 2006.
To cite this article: Julianna Csillag , Géza Pártay , András Lukács , Klára Bujtás & TamásNémeth (1999) Extraction of Soil Solution for Environmental Analysis, International Journal ofEnvironmental Analytical Chemistry, 74:1-4, 305-324, DOI: 10.1080/03067319908031434
To link to this article: http://dx.doi.org/10.1080/03067319908031434
PLEASE SCROLL DOWN FOR ARTICLE
Taylor & Francis makes every effort to ensure the accuracy of all the information (the“Content”) contained in the publications on our platform. However, Taylor & Francis,our agents, and our licensors make no representations or warranties whatsoever as tothe accuracy, completeness, or suitability for any purpose of the Content. Any opinionsand views expressed in this publication are the opinions and views of the authors,and are not the views of or endorsed by Taylor & Francis. The accuracy of the Contentshould not be relied upon and should be independently verified with primary sourcesof information. Taylor and Francis shall not be liable for any losses, actions, claims,proceedings, demands, costs, expenses, damages, and other liabilities whatsoeveror howsoever caused arising directly or indirectly in connection with, in relation to orarising out of the use of the Content.
This article may be used for research, teaching, and private study purposes. Anysubstantial or systematic reproduction, redistribution, reselling, loan, sub-licensing,systematic supply, or distribution in any form to anyone is expressly forbidden. Terms& Conditions of access and use can be found at http://www.tandfonline.com/page/terms-and-conditions

Intern. 1. Environ. AM/. Chem.. Vol. 74(1-4). pp. 305-324 Reprints available diratly from the publisher Photocopying prmitred by license only
Q 1999 OPA (Overseas Publishers Association) AmStc&m N.V. Published by licmpe
under the Gordon and Breach Science P u b l i s h imprint. F’rinted in Malaysia
EXTRACTION OF SOIL SOLUTION FOR ENVIRONMENTAL ANALYSIS
JULIANNA CSILLAG*, GEZA PARTAY, ANDRAS LUKACS, K L h A BUJTAS and TAMAS NEMETH
Research Institute for Soil Science and Agricultural Chemistry of the Hungarian Academy of Sciences. Herman Ottd u. 15, H-1022, Budapest, Hungary
(Received 20 April 1998: Infinal$wm 20 November 1998)
A centrifugation technique was applied to extract the soil solution regarded to be available for plants and to estimate in it the most mobile part of the soil’s metal content. Three soils having different pH. texture and water-retention characteristics were contaminated with multicomponent solutions of Cd, Cr, Ni, Pb and Zn nitrates and one of them was contaminated+acidified to different extents. The impact of the presence of sewage sludge on element concentrations in the soil solution was also assessed. The release of metals into the liquid phase was high only at excessive metal contamination and extreme acid pollution.
Keywords: Soil solution extraction; heavy metal contamination; sewage sludge; acid pollution
INTRODUCTION
Soil solution, the mobile aqueous liquid phase of soils, containing many kinds of dissolved substances, is a medium in which a large part of soil chemical reactions takes place1’,21. It is also mentioned as “blood circulation of the soil body”13]. Its chemical composition is a dynamic index of the soil status, an important parame- ter for indicating the chemical degradation of the soil. Main types of degradation are contamination, acidification, alkalization and salinizationr4-*].
Heavy metals, which are among the most harmful environmental pollutants, represent especially serious risks when they accumulate in the soil solution, since they might be leached towards the groundwater and are the most easily available for plant-uptake in water soluble forms. Generally, in agricultural lands the main sources of heavy metal contamination of soils are sewage sludge disposal and fertilizer application1639-’ ‘I. The concentration of heavy metals in the soil li- quid phase is considered as an indicator of their mobile pool[’21.
* Corresponding author. Fax: +36-1-212 1x91. E-mail: [email protected]
30.5
Dow
nloa
ded
by [
Uni
vers
ity o
f T
enne
ssee
At M
artin
] at
08:
16 0
8 O
ctob
er 2
014
TAB
LE I
Met
hods
for t
he e
xtra
ctio
n of
the
soil
liqui
d ph
ase
refe
renc
es
adva
ntag
es
limita
tions
In s
itu e
xtra
ctio
n te
chni
ques
Free
-dra
inag
e so
il so
lutio
n sa
mpl
ing
Vac
uum
suct
ion
sam
plin
g m
etho
d
Lab
orat
ory
met
hods
Dis
plac
emen
t in
col
umn
with
org
anic
sol
vent
s
Cen
trifu
gatio
n w
ith im
mis
cibl
e liq
uid
Hyd
raul
ic p
ress
ing
Pres
sure
mem
bran
e filt
ratio
n
Cen
trifu
gatio
n
2,3
, 18-
21,3
1
2,22
,31
2,6,
23,2
4
22,2
5
2.22
.31
solu
tion
can
be o
btai
ned
only
fro
m a
fai
rly w
et
soil
extra
ctio
n of
the
liqui
d ph
ase
at n
atur
al
max
imum
su
ctio
n ca
nnot
be
gr
eate
r th
an
the
stat
e fro
m u
ndis
turb
ed s
oil
atm
osph
eric
pres
sure
(-10
0 P
a). w
hile
pla
nts
can
exer
t muc
h hi
gher
suc
tions
(co
nven
tiona
l wilt
ing
poin
t: -1
500
Pa
)
extr
actio
n of
str
ongl
y re
tain
ed li
quid
pha
se
of re
lativ
ely dry
soils
is a
lso
poss
ible
th
e en
ergy
sta
tus
of t
he s
olut
ion
rem
aini
ng i
n th
e so
il af
ter e
xtra
ctio
n is
not
def
ined
th
e im
mis
cibl
e liq
uids
may
be
vola
tile
and
toxi
c
extra
ctio
n of
the
soil
solu
tion
is p
ossi
ble
even
at v
ery
low
soi
l wat
er c
onte
nt
char
acte
rizat
ion
of th
e en
ergy
sta
tus o
f th
e so
lutio
n to
be
extr
acte
d fr
om th
e so
il is
poss
ible
the
extr
eme
high
pre
ssur
es d
istu
rb th
e eq
uilib
ria
betw
een
the
soil
phas
es
the
cello
phan
e m
embr
ane
in th
e pr
essu
re fi
ltrat
ion
appa
ratu
s ads
orbs
par
t of t
he d
isso
lved
hea
vy m
et-
ais,
pro
tons
and
alu
min
ium
2.
19,2
0,22
,23.
26
-30
RIS
SAC
[291
met
hod:
for
the
ext
ract
ion
the
con-
ve
ntio
nal
uppe
r lim
it of
the
suc
tion
exer
ted
by
plan
t ro
ots
is m
odel
led
+ pl
ant
avai
labl
e so
il so
lutio
n ca
n be
ext
ract
ed
Dow
nloa
ded
by [
Uni
vers
ity o
f T
enne
ssee
At M
artin
] at
08:
16 0
8 O
ctob
er 2
014
EXTRACTION OF SOIL SOLUTION 307
Concentrations of the metals in the soil solution are influenced not only by the extent of contamination, but also by environmental changes such as soil acidifi- c a t i ~ n ~ ’ ~ - ’ ~ ~ . The decrease of the acid neutralizing capacity of the soil may lead to the so called chemical time bomb (CTB) e f f e ~ t l ’ ~ ’ ’ ~ ~ .
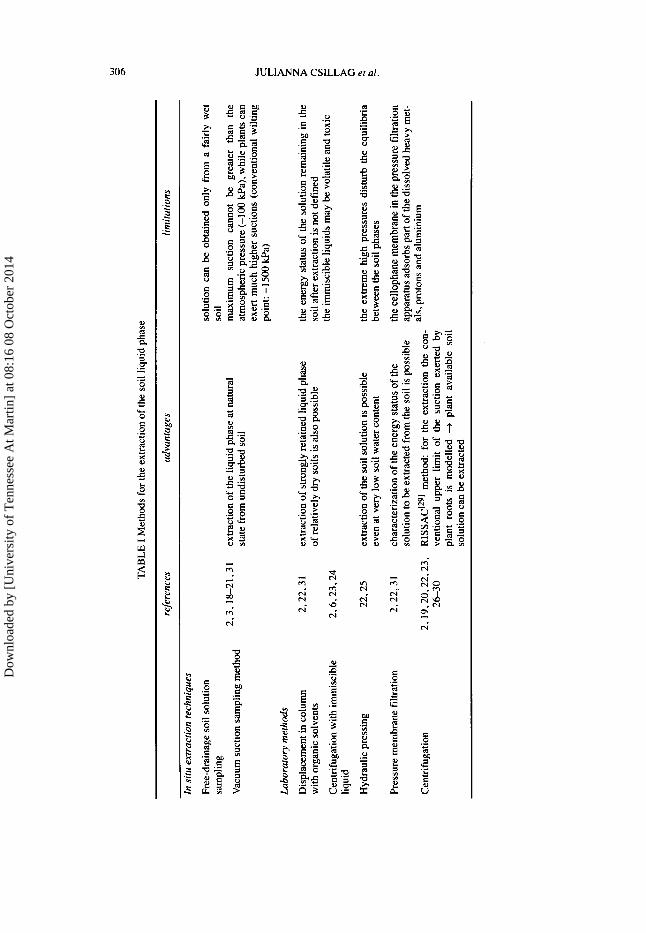
To determine the chemical composition of the soil solution, several in situ or laboratory methods exist to gain the liquid phase from wet undisturbed or bulk soils or from air-dried, ground and rewetted soil samples. The advantages and limitations of the most important soil solution extraction methods are summa- rized in Table I. Though the term “extraction” usually is reserved for a separation procedure which is based on distribution equilibrium between immiscible phases and material transport between them (e.g. displacement of the soil solution with organic solvents), it is also used in the literature related to soil solution chemistry to describe the removal of the liquid phase by such methods as centrifuga- tion120232627*301 and vacuum or free drainage filtering[’8201, when extracting agents are not applied in the separation procedure.
Since the chemical composition of the soil solution is greatly influenced by the sampling technique, in studies on soil solution chemistry an exact detailed description of the extraction method is generally given for the interpretation of data on element concentrations. Despite the limitations and drawbacks of the var- ious techniques (Table I), under standardized conditions they provide solutions which approximate better the “true” soil solution than the easily prepared aque- ous soil extracts of wide soi1:water ratios. These extracts, which are often applied in the routine soil chemical laboratory practice, cannot give adequate informa- tions on soil chemical reactions, phase interactions in the soil or element uptake by plants. Survey12. 227 3 1 1 or 20* 227 233 30i 32* 331 of different soil solution sampling techniques are the objects of several studies.
Compared to the huge number of publications dealing with soil solution chem- istry, there are relatively few studies which characterize the energy status of the soil solution to be separated. The plant-available quantity of soil moisture is influenced by the energy of water; plant water uptake is determined by the water-retention of the soil and the suction exerted by the plant.
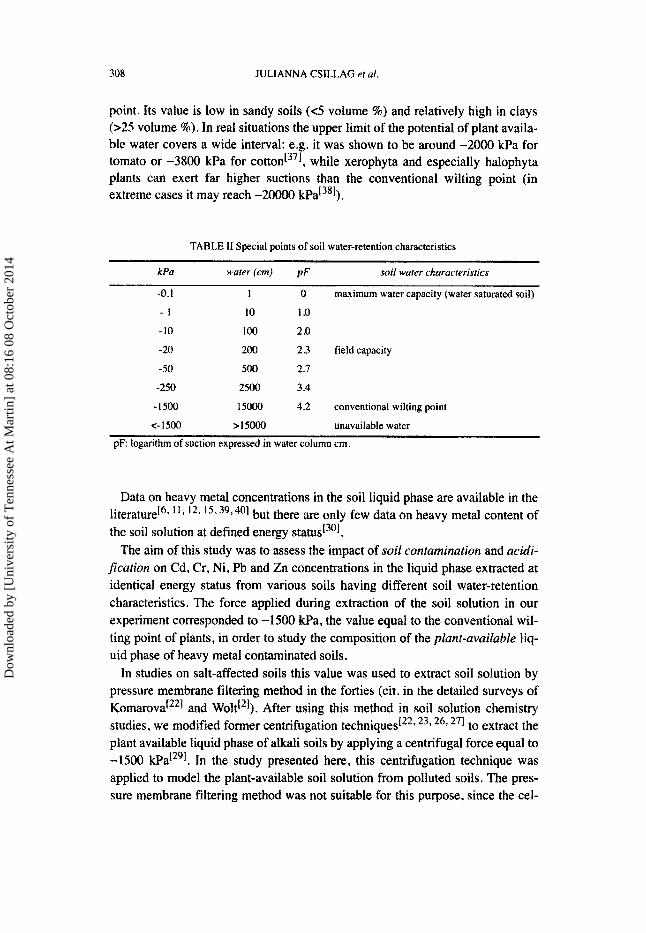
The potential of the soil liquid phase, which is the sum of different component potentials, is related to that of pure, free water[343 351. The relationship between this potential and the soil water content expressed in volume percentage is by definition the soil water-retention (Table 11, Figure 1). For a given soil, the lower is soil water content, the higher is the level of its potential. The soil water-retention curve is influenced by several soil properties, such as particle size distribution, organic matter content, bulk density, cation exchange capacity and clay mineralogy[361. By convention, -1500 Wa (pF 4.2) is the potential con- sidered as the upper limit of the potential of water accessible for plants (Table 11). The water content at this potential is called the wilting percentage or wilting
Dow
nloa
ded
by [
Uni
vers
ity o
f T
enne
ssee
At M
artin
] at
08:
16 0
8 O
ctob
er 2
014
308 JULIANNA CSILLAG era/ .
point. Its value is low in sandy soils (<5 volume %) and relatively high in clays (>25 volume %). In real situations the upper limit of the potential of plant availa- ble water covers a wide interval: e.g. it was shown to be around -2000 kPa for tomato or -3800 kPa for cotton[371, while xerophyta and especially halophyta plants can exert far higher suctions than the conventional wilting point (in extreme cases it may reach - 2 ~ kPa[381).
TABLE 11 Special points of soil water-retention characteristics
kPu wafer (emf pF soil water c~uructeristies
-0.1 1 0 maximum water capacity (water saturated soil)
- I 10 1 .o -10 100 2 .o -20 200 2.3 field capacity
-50 500 2.7
-250 2500 3.4
-1500 15000 4.2 conventional wilting point
<- 1500 >I5000 unavailable water
p F logarithm of suction expressed in water column cm.
Data on heavy metal concentrations in the soil liquid phase are available in the literature'" 12* '5*39*401 but there are only few data on heavy metal content of the soil solution at defined energy statusPo1.
The aim of this study was to assess the impact of soil c o n f u ~ ~ n a ~ j o ~ and acidi- flcution on Cd, Cr, Ni, Pb and Zn concentrations in the liquid phase extracted at identical energy status from various soils having different soil water-retention characteristics. The force applied during extraction of the soil solution in our experiment corresponded to -1500 @a, the value equal to the conventional wil- ting point of plants, in order to study the composition of the ~~u~f -uva~lubLe liq- uid phase of heavy metal contaminated soils.
In studies on salt-affected soils this value was used to extract soil solution by pressure membrane filtering method in the forties (cit. in the detailed surveys of Kom~ova[221 and Wolt[2]), After using this method in soil solution chemistry studies, we modified former cen~ifugation techniques[22. 23- 26, 271 to extract the plant available liquid phase of alkali soils by applying a centrifugal force equal to - 1500 kPa[291. In the study presented here, this centrifugation technique was applied to model the plant-available soil solution from polluted soils. The pres- sure membrane filtering method was not suitable for this purpose, since the cel-
Dow
nloa
ded
by [
Uni
vers
ity o
f T
enne
ssee
At M
artin
] at
08:
16 0
8 O
ctob
er 2
014

EXTRACTION OF SOIL SOLUTION 309
& acidic brown forest soil (No. 1 .) - -A - slightly acidic brown forest soil (No.2.) ------B---. calcareous chemozem (No.3.)
pF: see TABLE I1
wilting point (-1 500 kPa) L P
field capacity (-20 Wa)
maximum water capacity (-0.1 kPa)
0 10 20 30 40 50 60 soil water content (volume %)
FIGURE I Soil water-retention curves
lophane membrane of the pressure filtering apparatus adsorbed a great part of protons and heavy metals from test solutions (unpublished data).
EXPERIMENTAL
Preparation of soil samples
Soil solution was extracted from samples of the upper horizon of an acidic and a slightly acidic brown forest soil and of a calcareous chernozem soil (Table 111, Figure I ) . The air-dried soil samples (1-1 kg) were contaminated with aqueous multicomponent solutions of Cd, Cr, Ni, Pb and Zn nitrates (soil+Me system). The solutions were added in such quantities that the resulting water potentials of the wet soil samples corresponded to field and maximum water capacities (FC = -20 kPa and MC = -0.1 kPa. resp.). The contaminated wet soil samples were equilibrated at room temperature for one week (as proposed in the litera- ture[I5* 301), during which they were kept in air-tight plastic vessels and were mixed three times. Prior to centrifugation the exact water content of the homoge- nous wet soil samples was measured by oven-dry method at 105 "C. Expressing soil water content in volume percentage by multiplying measured gravimetric water content and bulk density data (Table III), the exact water potential in the soil samples was determined from the water-retention curves (Figure 1).
Dow
nloa
ded
by [
Uni
vers
ity o
f T
enne
ssee
At M
artin
] at
08:
16 0
8 O
ctob
er 2
014

TABLE
111 S
ome c
hem
ical
and
phy
sica
l pro
pert
ies o
f the
stu
died
soils
~
~~
PH
<0.0
2mm
<0
.002
mm
bu
lk d
ensi
ry
soils
No.
de
pth [cm]
CaC
O3 [
%I or
gani
c m
atte
r[%
] C
EC
[cm
ollk
g soil]
H20
K
Cl
[wei
ghr %I
[e/c
m31
z 1.
5-
15
4.3
3.2
0 1.
6 20
.7
40.8
27.8
1.
34
>
2.
8-16
6.
3 5.
3 0
1.2
8.5
18.9
12
.8
1.66
n
.-
3.
cL
20
7.7
7 .o
6.6
2.8
28.3
35
.8
22.1
1.
32
No.
1. a
cidi
c br
own
fore
st so
il (R
agB
y).
No.
2. s
light
ly a
cidi
c bro
wn
fore
st so
il (G
ijdol
lo).
No.
3. c
alca
reou
s che
rnoz
em (P
uszt
asza
bolc
s).
4.00
2 m
m: c
lay
frac
tion.
?
CEC
: cat
ion
exch
ange
capa
city
. 4
.02
mm: cl
ay +
silt
frac
tion.
Q
z n bu
lk d
ensi
ty: t
he ratio o
f th
e m
ass
of dry s
olid
s (d
eter
min
ed a
fter
d
in
the
soil
to c
onst
ant
wei
ght a
t 105
"C) t
o th
e bu
lk v
olum
e of
the
soil
(as t
aken
in th
e fie
ld)1
4 79
1.
Dow
nloa
ded
by [
Uni
vers
ity o
f T
enne
ssee
At M
artin
] at
08:
16 0
8 O
ctob
er 2
014
EXTRACTION OF SOIL SOLUTION 311
Extraction of the soil solution of defined energy status - modelling plant available soil solution
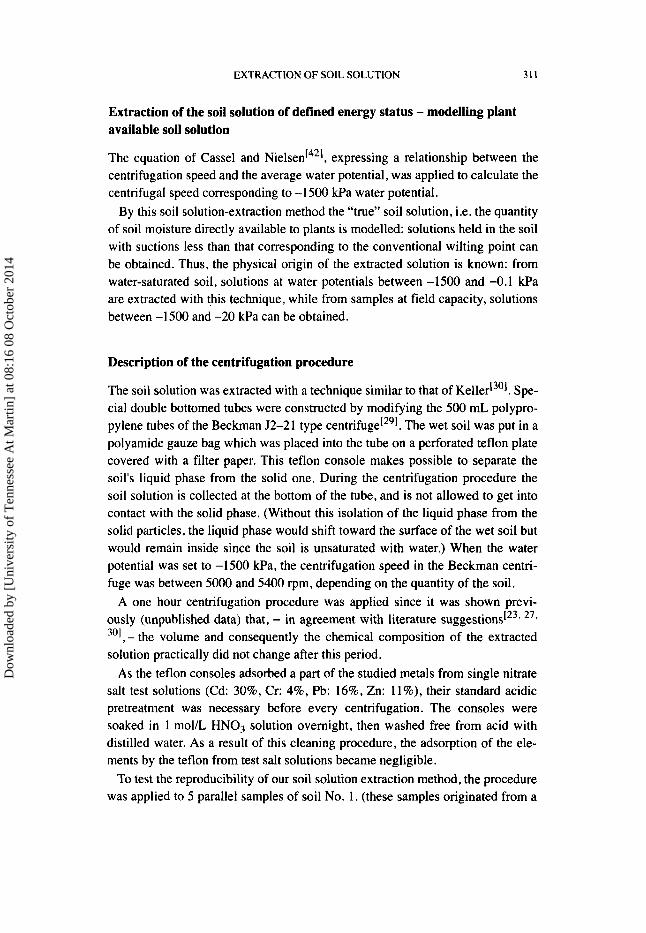
The equation of Cassel and N i e l ~ e n I ~ ~ l , expressing a relationship between the centrifugation speed and the average water potential, was applied to calculate the centrifugal speed corresponding to -1 500 Wa water potential.
By this soil solution-extraction method the “true” soil solution, i.e. the quantity of soil moisture directly available to plants is modelled: solutions held in the soil with suctions less than that corresponding to the conventional wilting point can be obtained. Thus, the physical origin of the extracted solution is known: from water-saturated soil, solutions at water potentials between -1500 and -0.1 kPa are extracted with this technique, while from samples at field capacity, solutions between -1500 and -20 kPa can be obtained.
Description of the centrifugation procedure
The soil solution was extracted with a technique similar to that of Keller’301. Spe- cial double bottomed tubes were constructed by modifying the 500 mL polypro- pylene tubes of the Beckman 52-21 type centrifuge[291. The wet soil was put in a polyamide gauze bag which was placed into the tube on a perforated teflon plate covered with a filter paper. This teflon console makes possible to separate the soil’s liquid phase from the solid one. During the centrifugation procedure the soil solution is collected at the bottom of the tube, and is not allowed to get into contact with the solid phase. (Without this isolation of the liquid phase from the solid particles, the liquid phase would shift toward the surface of the wet soil but would remain inside since the soil is unsaturated with water.) When the water potential was set to -1500 P a , the centrifugation speed in the Beckman centri- fuge was between 5000 and 5400 rpm, depending on the quantity of the soil.
A one hour centrifugation procedure was applied since it was shown previ- ously (unpublished data) that, - in agreement with literature suggestions[23’ 277
301, - the volume and consequently the chemical composition of the extracted solution practically did not change after this period.
As the teflon consoles adsorbed a part of the studied metals from single nitrate salt test solutions (Cd: 30%, Cr: 4%, Pb: 16%, Zn: ll%), their standard acidic pretreatment was necessary before every centrifugation. The consoles were soaked in 1 mol/L HNO, solution overnight, then washed free from acid with distilled water. As a result of this cleaning procedure, the adsorption of the ele- ments by the teflon from test salt solutions became negligible.
To test the reproducibility of our soil solution extraction method, the procedure was applied to 5 parallel samples of soil No. 1. (these samples originated from a
Dow
nloa
ded
by [
Uni
vers
ity o
f T
enne
ssee
At M
artin
] at
08:
16 0
8 O
ctob
er 2
014
312 JULIANNA CSILLAG era/ .
different sampling than those used in the contamination experiments). Soil sam- ples were moistened to FC and MC at lOOMe (see later) contamination level. The combined error of the sample preparation, extraction procedures and chemi- cal analyses was calculated.
Soil contamination and acidification experiments
In order to determine quantitatively the retention and mobilization of Cd, Cr, Ni, Pb and Zn in the three studied soils, different contamination levels and acid loa- dings were applied. The loading rates were based on the upper limits of permit- ted heavy metal contents of sludges to be deposited onto agricultural lands, as specified by the Hung. Techn. Dir."'], i.e. 15 mg Cd, 1000 mg Cr and Pb, 200 mg Ni and 3000 mg Zn per kg sludge dry matter. Assuming an average sludge application practice (i.e. incorporation of 500 tha sewage sludge containing 5% dry matter into a 20-cm surface soil layer), calculated soil loadings in the soil+Me system were: 0.125 mg Cd, 8.33 mg Cr and Pb, 1.67 mg Ni and 25 mg Zn per kg soil (1Me). In order to model extreme overloadings, 10 and 100 times more concentrated contaminating solutions were also applied (lOMe and lOOMe, resp.).
To assess the impact of sludge application on soil solution concentrations, the slightly acidic forest soil (No. 2.) was treated with compressed municipal sewage sludge enriched with the metal nitrates at 100 times overloading (soil+[Me+sludge] system; 100Me+Ss). Original concentrations of the selected metals in the sludge, as determined after 2 m o m HNO, extraction at 100 OC fol- lowing the method of Ander~son[~~], were: 12.3 mg Cd, 217 mg Cr, 109 mg Ni, 210 mg Pb and 3026 mg Zn per kg dry material. These values are comparable to or less than the limits specified in the Hung. Techn. Dir."'] (Dry and inorganic matter contents in the sludge were 20.6% and 48.2%, resp.). The volume of the contaminating sludge and concentrations of the added metals were chosen so that the water potential (gravimetric water content) and metal content in the soil+[Me+sludge] mixture would be FC and 100 times overloading, resp., simi- larly as in the soil+Me system. The same amounts of metal nitrates were added also to the sludge itself (sludge+Me system) to assess the sorption of the added metals on sludge constituents. The liquid phases were extracted as described above, but in the case of the sludge+Me mixture, having relatively higher water content, the original centrifuge tubes (without the separating teflon console) were used.
Impact of soil acidification on the desorption of the elements and their reco- very in the soil solution was studied on the slightly acidic forest soil (No. 2.). 0 - 10 cm layers of undisturbed large (diameter: 40 cm) columns of this soil were
Dow
nloa
ded
by [
Uni
vers
ity o
f T
enne
ssee
At M
artin
] at
08:
16 0
8 O
ctob
er 2
014
EXTRACTION OF SOIL SOLUTION 313
contaminated with the same metal-spiked sludge as in the previous experiment. Four treatments were carried out: by applying the original sludge (OMe+Ss) and lOMe+Ss, 30Me+Ss and 100Me+Ss metal enrichment levels. The sludge was added on the soil columns in the same amount in all treatments. The columns were kept in the laboratory during three months at a fairly constant water con- tent, then samples from the contaminated layers were left to air-dry. Detailed description of the experiment is given in Bujtk et a1.IU1
When measuring the impact of soil acidification on the mobilization of heavy metals in the [Me+sludge] treated soil, the air-dried soil samples were rewetted with distilled water, or 0.001, 0.1 and 1.5 mol/L HN03 solutions to MC and equilibrated for one week, similarly as previously the non-acidified samples. The soil solution was obtained as described above.
Cd, Cr, Ni, Pb and Zn concentrations in the contaminating metal salt solutions and in the liquid phase extracted from the wet uncontaminated, contaminated and contaminated+dried+acidified soil samples were measured by inductively cou- pled plasma atomic emission spectrometry (ICP-AES). The measurements were carried out with a JARREL ASH apparatus supplied with a polychromator, which enabled simultaneous analysis of the elements. This was needed because the volume of the liquid phase extracted from soils of natural moisture status was small.
RESULTS AND DISCUSSION
Test of the reproducibility of the soil solution extraction method
The numerical values of the combined error of sample preparation, extraction and chemical analysis of the soil solution are given in Table IV. From the data of 5 parallel measurements at lOOMe contamination level it can be concluded that our method is suitable to extract soil solution with good reproducibility. The coefficients of variation (CV) practically did not differ at water potentials corres- ponding to FC and MC. At such high heavy metal concentrations similar or bet- ter reproducibility was obtained than in the case of two salt affected soils, at sim- ilar water potentials, for ions present in high concentrations in the soil solution1451. (In the case of a carbonate-hydrocarbonate containing meadow solo- netz soil, for example, at -0.5 kPa water potential, CV values for Na', C032-+HC03-, SO:= and C1- were below 7.8%. For a sulphatic solonchakized solonetz soil, at -0. 1 kPa and in the range between -13 kPa and -22 kPa, CV values were less than 11.5% and 6.9%, resp., for Ca2+, Mg2+, Na+, and CI-.)
Dow
nloa
ded
by [
Uni
vers
ity o
f T
enne
ssee
At M
artin
] at
08:
16 0
8 O
ctob
er 2
014

3 14 JULIANNA CSILLAG er al.
TABLE IV Error of the soil solution extraction method: soil solution concentrations (mgiL) at field capacity (FC) and at maximum water capacity (MC) (soil No. 1 ., 100Me; n=5)
statistical index Cd Cr Ni Pb Zn
FC
X 35.5 244 49 I 352 7660
S
cv (%)
1.2 9 1 1 14 160
3.3 3.6 2.2 4 .O 2.1
h(f) 1 . 1 9 1 1 14 I55
MC
X 26.4 189 359 259 5570
S 1 . 1 7 5 9 50
cv (a) 4.3 3.5 1.3 3.5 1 .o h(f) 1 . I 6 4 9 50
n: number of data. x: mean value. s: standard deviation. C V coefficient of variation. h: confidence limit at tS% level.
Impact of contamination level
To model the impact of contamination level on the concentrations of Cd, Cr, Ni, Pb and Zn in the soil solution, at first aqueous multicomponent solutions of the metal nitrates were applied to moisten the soils.
In the uncontaminated samples of all three soils Cd, Cr, Ni, Pb and Zn concen- trations in the soil solution were small or below the detection limit (Cd: 5 , Cr: 5 , Ni: 5 , Pb: 50 and Zn: 5 F g L in single salt solutions). Zn concentrations were the highest: 0.7,0.4 and 0.3 mg/L at FC in soils No. l . , 2. and 3.. resp. When the maximum permitted quantities (1Me) were applied, only a negligible transfer to the soil solution occurred; nearly 100% of the metals present in the applied con- taminating solutions were adsorbed by the soils. Again Zn concentrations were the highest, 1.3 mgL in the liquid phase of the forest soils and 0.4 mg/L in the chernozem at FC. The element concentrations in the soil solutions were shown to be lower or near to the allowed concentrations in drinking waters and ground-, surface and river waters (Table V).
When provocative heavy metal overloadings were modelled (lOMe and IOOMe), the concentrations in the soil solution increased in all three soils, but to a different extent. The soils’ reaction, texture and cation exchange capacity
Dow
nloa
ded
by [
Uni
vers
ity o
f T
enne
ssee
At M
artin
] at
08:
16 0
8 O
ctob
er 2
014
EXTRACTION OF SOIL SOLUTION 315
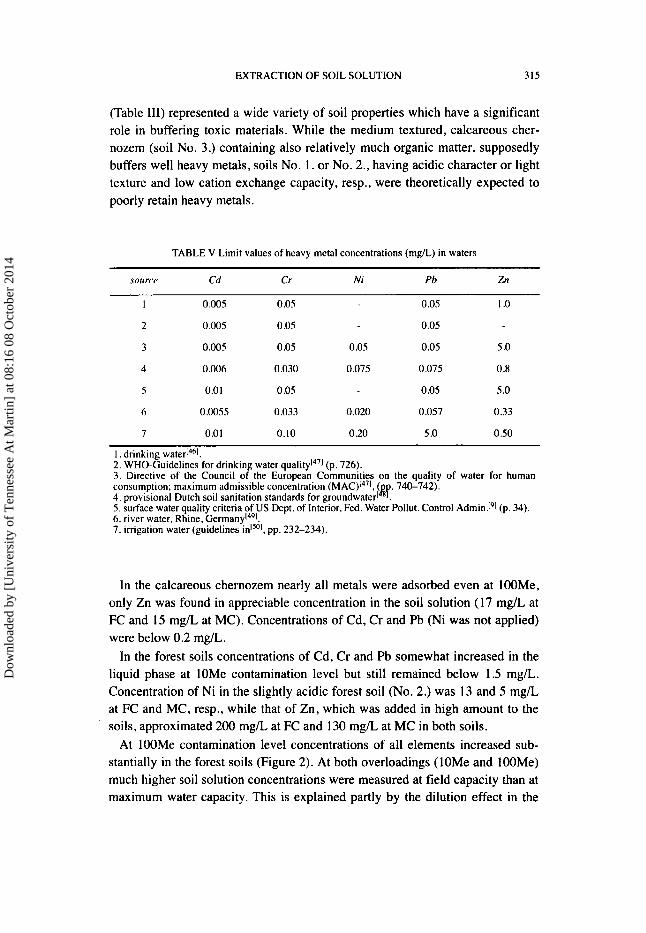
(Table 111) represented a wide variety of soil properties which have a significant role in buffering toxic materials. While the medium textured, calcareous cher- nozem (soil No. 3.) containing also relatively much organic matter, supposedly buffers well heavy metals, soils No. I . or No. 2., having acidic character or light texture and low cation exchange capacity, resp., were theoretically expected to poorly retain heavy metals.
TABLE V Limit values of heavy metal concentrations (mg/L) in waters
source Cd Cr Ni Pb Zn
I 0.005 0.05 0.05 1 .o 2 0.005 0.05 0.05
3 0.005 0.05 0.05 0.05 5 .O
4 0.006 0.030 0.075 0.075 0.8
5 0.01 0.05 0.05 5 .O
6 0.0055 0.033 0.020 0.057 0.33
7 0.01 0.10 0.20 5 .O 0.50
1. drinking ~ate l -1~ '~ . 2. WHO-Guidelines for drinking water (p. 726). 3. Directive of the Council o f the Euiopein Communities on the quality of water for human consumption; maximum admissible concentration ( 740-742).
5. surface water quality criteria of US Dept. of Interior, Fed. Water Pollut. Control Admin!'] (p. 34). 6. river water, Rhine, Ger~nany l~~] . 7 . irrigation water (guidelines in15"1. pp. 232-234).
4. provisional Dutch soil sanitation standards for groundwater1 'q'
In the calcareous chernozem nearly all metals were adsorbed even at IOOMe, only Zn was found in appreciable concentration in the soil solution (1 7 mg/L at FC and 15 m g k at MC). Concentrations of Cd, Cr and Pb (Ni was not applied) were below 0.2 mg/L.
In the forest soils concentrations of Cd, Cr and Pb somewhat increased in the liquid phase at lOMe contamination level but still remained below 1.5 mg/L. Concentration of Ni in the slightly acidic forest soil (No. 2.) was 13 and 5 mg/L at FC and MC, resp., while that of Zn, which was added in high amount to the soils, approximated 200 mg/L at FC and 130 mg/L at MC in both soils.
At I OOMe contamination level concentrations of all elements increased sub- stantially in the forest soils (Figure 2). At both overloadings (lOMe and 100Me) much higher soil solution concentrations were measured at field capacity than at maximum water capacity. This is explained partly by the dilution effect in the
Dow
nloa
ded
by [
Uni
vers
ity o
f T
enne
ssee
At M
artin
] at
08:
16 0
8 O
ctob
er 2
014
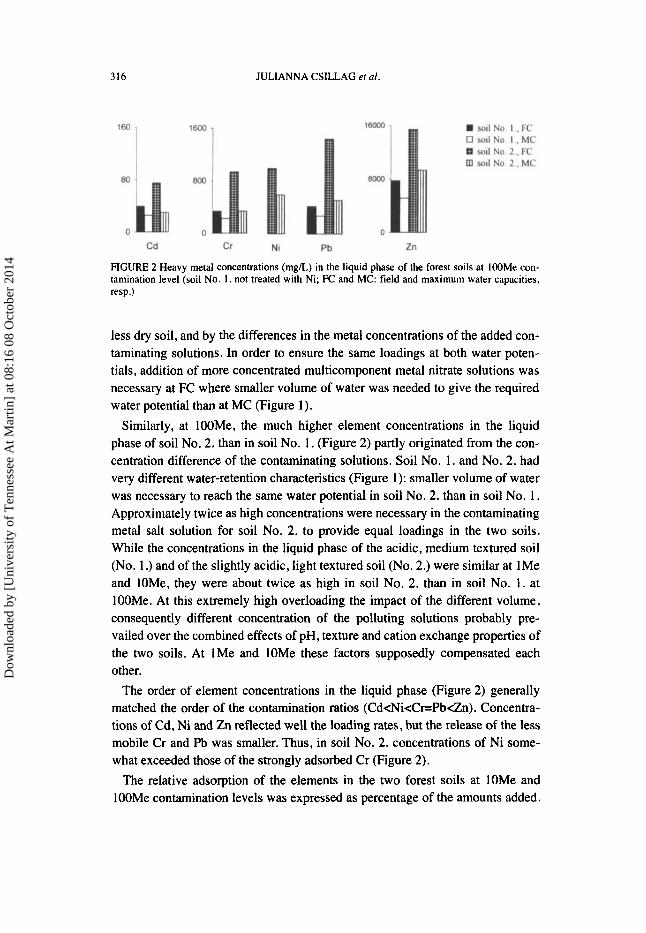
316 JULIANNA CSILLAG er al.
FIGURE 2 Heavy metal concentrations (mglL) in the liquid phase of the forest soils at lOOMe con- tamination level (soil No. I . not treated with Ni; FC and MC: field and maximum water capacities, resp.)
less dry soil, and by the differences in the metal concentrations of the added con- taminating solutions. In order to ensure the same loadings at both water poten- tials, addition of more concentrated multicomponent metal nitrate solutions was necessary at FC where smaller volume of water was needed to give the required water potential than at MC (Figure 1).
Similarly, at IOOMe, the much higher element concentrations in the liquid phase of soil No. 2, than in soil No. 1. (Figure 2) partly originated from the con- centration difference of the contaminating solutions. Soil No. 1. and No. 2. had very different water-retention characteristics (Figure 1): smaller volume of water was necessary to reach the same water potential in soil No. 2. than in soil No. 1. Approximately twice as high concentrations were necessary in the contaminating metal salt solution for soil No. 2. to provide equal loadings in the two soils. While the concentrations in the liquid phase of the acidic, medium textured soil (No. 1 .) and of the slightly acidic, light textured soil (No. 2.) were similar at 1Me and IOMe, they were about twice as high in soil No. 2. than in soil No. 1. at lOOMe. At this extremely high overloading the impact of the different volume, consequently different concentration of the polluting solutions probably pre- vailed over the combined effects of pH, texture and cation exchange properties of the two soils. At 1Me and lOMe these factors supposedly compensated each other.
The order of element concentrations in the liquid phase (Figure 2) generally matched the order of the contamination ratios (Cd<Ni<Cr=Pb<Zn). Concentra- tions of Cd, Ni and Zn reflected well the loading rates, but the release of the less mobile Cr and Pb was smaller. Thus, in soil No. 2. concentrations of Ni some- what exceeded those of the strongly adsorbed Cr (Figure 2).
The relative adsorption of the elements in the two forest soils at lOMe and lOOMe contamination levels was expressed as percentage of the amounts added.
Dow
nloa
ded
by [
Uni
vers
ity o
f T
enne
ssee
At M
artin
] at
08:
16 0
8 O
ctob
er 2
014
EXTRACTION OF SOIL SOLUTION 317
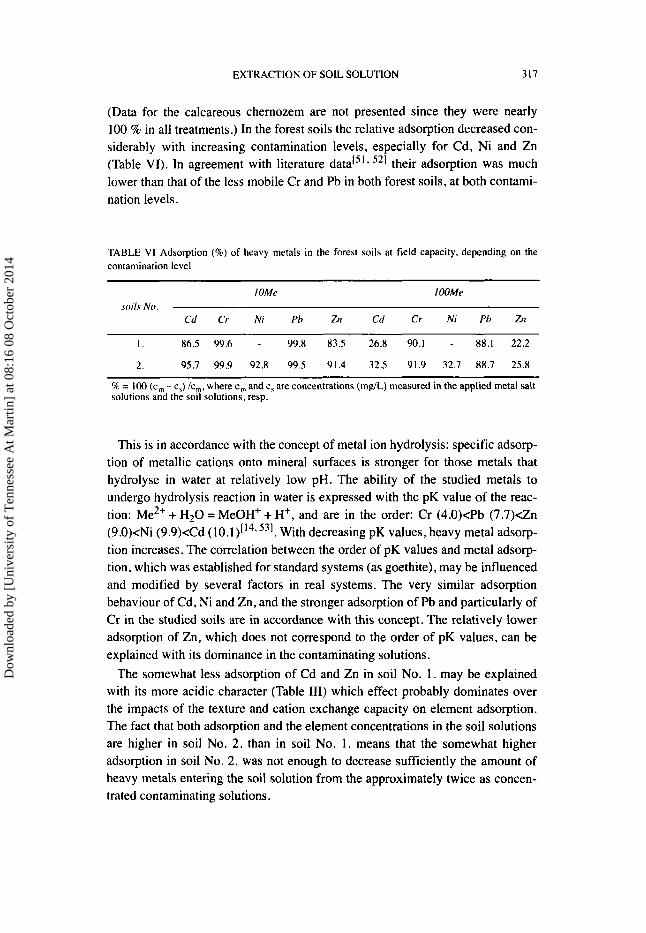
(Data for the calcareous chernozem are not presented since they were nearly 100 % in all treatments,) In the forest soils the relative adsorption decreased con- siderably with increasing contamination levels, especially for Cd, Ni and Zn (Table VI). In agreement with literature 521 their adsorption was much lower than that of the less mobile Cr and Pb in both forest soils, at both contami- nation levels.
TABLE VI Adsorption (96) of heavy metals in the forest soils at field capacity, depending on the contamination level
I OMe IOOMe
Cd Cr Ni Pb Zn Cd Cr Ni Pb Zn soils N o .
I . 86.5 99.6 - 99.8 83.5 26.8 90.1 - 88.1 22.2
2. 95.7 99.9 92.8 99.5 91.4 32.5 91.9 32.7 88.7 25.8
% = 100 (c,,, - c,) Ic,, where c, and c, are concentrations (mglL) measured in the applied metal salt solutions and the soil solutions. resp.
This is in accordance with the concept of metal ion hydrolysis: specific adsorp- tion of metallic cations onto mineral surfaces is stronger for those metals that hydrolyse in water at relatively low pH. The ability of the studied metals to undergo hydrolysis reaction in water is expressed with the pK value of the reac- tion: Me2+ + H 2 0 = MeOH' + H', and are in the order: Cr (4.O)<Pb (7.7)dn (9.O)<Ni (9.9)xCd ( 10.1)L143 531. With decreasing pK values, heavy metal adsorp- tion increases. The correlation between the order of pK values and metal adsorp- tion, which was established for standard systems (as goethite), may be influenced and modified by several factors in real systems. The very similar adsorption behaviour of Cd, Ni and Zn, and the stronger adsorption of Pb and particularly of Cr in the studied soils are in accordance with this concept. The relatively lower adsorption of Zn, which does not correspond to the order of pK values, can be explained with its dominance in the contaminating solutions.
The somewhat less adsorption of Cd and Zn in soil No. 1. may be explained with its more acidic character (Table 111) which effect probably dominates over the impacts of the texture and cation exchange capacity on element adsorption. The fact that both adsorption and the element concentrations in the soil solutions are higher in soil No. 2. than in soil No. 1. means that the somewhat higher adsorption in soil No. 2. was not enough to decrease sufficiently the amount of heavy metals entering the soil solution from the approximately twice as concen- trated contaminating solutions.
Dow
nloa
ded
by [
Uni
vers
ity o
f T
enne
ssee
At M
artin
] at
08:
16 0
8 O
ctob
er 2
014

318 JULIANNA CSILLAG er al.
Impact of sludge application
Adsorption of the elements was much more higher in the presence of communal sewage sludge which contained substantial amounts of adsorptive inorganic and organic materials. When soil No. 2. was contaminated to lOOMe with the metal-spiked sludge, the metal concentrations in the soil solution were many times, for Cr and Pb by 2-3 orders of magnitude smaller (Figure 3) than when only the multicomponent metal salt solution itself was applied onto the soil (Figure 2, soil No. 2., at FC). The concentrations of Cd, Ni and Zn in the liquid phase of soil+(lOOMe+Ss) system (Figure 3) were 5 , 43 and 30 % of their respective concentrations measured in the liquid phase of the soi1+100Me system (Figure 2). Such comparison gave only 0.08% for Cr and 0.4% for Pb.
FIGURE 3 Heavy metal concentrations (mg/L) in the liquid phases of the metal-contaminated sludge and soil+sludge (sludge+Me and soil+[Me+sludge] systems, resp.; contamination level: 100Me; for soil+Me see soil No. 2. at FC in FIGURE 2)
Generally much lower metal concentrations were found in the liquid phase of the contaminated sludge (Figure 3, sludge+Me) than in the soil solution sepa- rated from sludge-free contaminated soil (Figure 2), with the exception of Ni. For Cr and Pb the difference was about two order of magnitude or higher.
In our experiments the metal concentrations in the soil solution were much higher than many literature data. In two sandy soils (pH-H20 4.1 and 3.8), con- sidered to be fairly free of pollution (original Cd contents 0.07 and 0.46 mgkg), approximately 10 pg/L Cd was found in the soil solution extracted by centrifuga- tion method[30]. In a peaty soil (pH-H,O 4.3, organic matter content 1.1 %) resembling somewhat our soil No. 1, 0.184 mgL Zn and 0.026 mgL Cd were found, not in soil solution but in 1 5 soi1:water However, since the total concentrations in the soil were only 26 mgkg Zn and 3.7 mgkg Cd (origin and residence time unknown), the recoveries for both elements were about
Dow
nloa
ded
by [
Uni
vers
ity o
f T
enne
ssee
At M
artin
] at
08:
16 0
8 O
ctob
er 2
014

EXTRACTION OF SOIL SOLUTION 319
3.5 %. In a nonacid soil, total soluble Zn concentration, measured by anodic stripping voltammet~y[~~], was 3 . mol/L, i.e. about 2 m g L This soil was treated with sludge almost 20 years earlier. Zinc loading was 974 kgha, which corresponds to about 325 mg Zn/kg soil, (calculated from 1.5 g/cm3 soil density and supposing that Zn remained in the upper 20 cm).
However, at high soil contamination levels, much higher soil solution concen- trations can be found. For instance, pollution of a sandy soil in the vicinity of a metallurgy plant reached 60 mg Cd, 1400 mg Pb and 6800 mg Zn per kg soil['51. (These values are even higher than the l00Me level used in our experiments.) Ranges in concentration of these metals in the soil solution, centrifuged at pF from 0 to 2.5, were: Cd 22 - 265, Pb 1.4-7.6, and Zn 1000-21900 mg/L, depend- ing on the pH of the solution which varied from 4 to 6. Our results for Cd and Zn concentrations at the lOOMe loading rate are in the reported range, but Pb values are much higher (Figure 2). These high Pb values may be attributed to the appli- cation of Pb as nitrate salt, in contrast with the natural systems where other ani- ons e.g. sulphates may be present in high amounts, causing precipitation of soluble Pb-compounds.
Impact of acidic loads
As a consequence of the decrease of pH, release of heavy metals into the soil solution increased. However, extreme high acid load (1.5 m o m HNO,) was nec- essary to increase considerably the concentrations of the elements in the liquid phase. By less strong acidic treatments only Zn was released in appreciable amounts and only at 100Me+Ss loading level (Table VII and VIII). At the highest acid load the order of metal concentrations after the acidic desorption matched the contamination ratios (Cd<Ni<Cr=Pb<Zn) with the exception of the strongly adsorbed Cr (Table VII.: Cd<Cr<Ni<Pb<Zn). The increase of element concen- trations with increasing metal contamination is shown on the example of Zn in Table VIII. (The relatively high Zn concentration at OMe+Ss originated from the native Zn content of the soil plus that of the sludge, which enters the liquid phase due to the extreme high acid load.)
The relatively smaller release of Cr and Pb is shown also by the recovery va- lues expressed as percentage of the total amounts: recoveries of the mobile Cd, Ni and Zn were much higher than those of Pb and mainly of Cr (Table VII). This is in accordance with literature data related to the mobility of heavy metals in soils and/or effect of pH on their mobilization['*. 147 16* 40* 49* 531.
Dow
nloa
ded
by [
Uni
vers
ity o
f T
enne
ssee
At M
artin
] at
08:
16 0
8 O
ctob
er 2
014

320 JULIANNA CSILLAG et al.
TABLE VII Heavy metal concentrations and pH values in the liquid phase, and recovery values after acidic treatment of the previously contaminated soil (soil No. 2.; 100Me+Ss; maximum water capacity)
extractant
distilled water 0. 001 moWL HNO, 0.1 m W L HN03 1.5 moWL HNO,
PH 6.6 6.7 4.5 1.3
concentrations (mg/L and m g k g soil)
mg/L mgkg mg/L mgkg mg/L mghg mg/L m g k g
Cd 0.55 0.12 0.78 0.19 1.46 0.30 46.5 10.2
Cr 0.024 0.01 0.041 0.01 0.25 0.05 469 103
Ni 4.65 1.04 5.46 1.36 17.2 3.58 559 123
Pb 0.098 0.02 0.14 0.04 0.28 0.06 1140 250
Zn 61.0 13.7 76.8 19.2 411 85.6 8900 1950
recoveries (%)
Cd 1.08 1.69 2.66 89.1
Cr 0 0.00 I 0.008 15.0
Ni 0.69 0.91 2.38 81.7
Pb 0 0.01 0.0 1 33.9
Zn 0.65 0.92 4.09 93.5
% = 100 c&,,. where c, and c, are concentrations (mgkg soil) in the soil solution and in contaminated bulk soil, resp. c,: determined after 2 mom HN03 extraction at 1:20 soi1:extractant mgkg soil: concentrations related to the mass of the dry soil instead of the volume of the liquid phase were necessary to get equal dimensions for c, and c, to calculate recovery values: mgkg = (mg/L x gravimetric water content)/100.
TABLE VIU Zn concentrations (mg/L) in the liquid phase of the variously contaminated soil samples treated with HNO, solutions (soil No. 2.; presence of sludge; maximum water capacity)
extractant
contamination level distilled water 0.001 moWL 0.1 moWL 1.5 moWL
HNO,
OMe+ Ss I .79 0.67 242
10Me+Ss 0.70 I .57 I290
30Me+Ss 3.29 2.09 4.4 1 2160
100Me+Ss 61.0 76.8 411 8900 -: not measured.
Dow
nloa
ded
by [
Uni
vers
ity o
f T
enne
ssee
At M
artin
] at
08:
16 0
8 O
ctob
er 2
014

EXTRACTION OF SOIL SOLUTION 32 I
Evaluation of the results in comparison with other approaches
When comparing our results with literature data, we must emphasize that in our experiments metal treatments represented not only metal loadings usually applied under field conditions, but also very high, provocative overloadings. Such overloadings are rare but sometimes might occur, since beside industrial activities, the possibility of improper or illegal waste depositions or accidental contaminations cannot be excluded despite the strict environmental regulations. These local accumulations (“hot spots”) are extremely hazardous for the environ- ment, since the soil may not be able to retain the huge amount of toxic metals so these appear in high amounts in the mobile liquid phase.
Also, in our experiments, metals were either freshly added to the soil in metal salt solutions and in the form of metal-enriched sludge with a one-week-equili- bration time, or as metal-enriched sludge about 3 months prior to extraction of the soil solution when effects of acidification were studied. In contrast, in litera- ture data on the availability of metals, soil samples are often taken from such sites where metal-containing sludges were applied a long time prior to the exper- iments. Long contact periods between soil and sludge, with repeated dry- ing-rewetting cycles, may alter the solubility/availability of the Data obtained for such circumstances may not be fully comparable with our experi- mental situations.
Moreover, our results are in many cases hardly comparable with literature data because of the differences in the extraction methodology. The physical origin of the solutions obtained by the majority of the methods is uncertain. In our method the soil moisture directly available to plants is modelled: those fractions of the soil’s liquid phase are separated which were retained in the soil below the con- ventional wilting point of plants.
We must note that several authors postulatedhhowed correlations between ele- ment concentrations in the soil solution and the element uptake by the plants[2* 40. 54-561. Such correlations were often based on various soil extracts instead of separating the plant-available soil solution. Metal concentrations extracted by water or dilute salt solutions with a soi1:solution ratio of 1 5 and considered to approximate the soil solution concentrations, showed better correlation with plant uptake than total metal concentrations in the Del Castilho and C h a r d ~ n [ ~ ~ ] found that both the estimated Cd distribution factor (model-calcu- lated concentration in the soil solution / concentration in the soil) and the Cd transfer factor (concentration in plant / concentration in soil) for three plant spe- cies depended similarly on pH. This finding supported the hypothesis that the metal ion concentration in the soil solution governs metal content in crops. Con- centrations of Cd and Zn in the soil solution, obtained by the centrifugation
Dow
nloa
ded
by [
Uni
vers
ity o
f T
enne
ssee
At M
artin
] at
08:
16 0
8 O
ctob
er 2
014

322 JULIANNA CSILLAG et al.
method presented in this paper, showed better correlation with Cd and Zn con- centrations in corn shoots, than metal concentrations in 1:20 acidic ammonium acetate+EDTA soil extracts[”]. However, it should be considered that plant con- centrations measured at a specific point during the vegetation period reflect the cumulative uptake of elements, while soil solution concentrations pertain only to a specific situation (soil water content, temperature, etc.) at a specific moment.
CONCLUSIONS
The soil solution extraction method presented here allows an approximation of the actual chemical composition of the “true” soil solution. This technique is probably also suitable for the determination of the concentrations of other envi- ronmentally hazardous materials like water soluble organic pollutants in the plant-available soil solution fractions.
The easily soluble part of the total amount of the contaminating metals, which is of highest ecological importance playing significant role in their migration and bioavailability, was negligible in all three soils in a one-time maximum load model experiment. The risk of the release of toxic elements into the soil solution may increase as a consequence of environmental changes, such as soil acidifica- tion. But our results indicate that significant acidic desorption is improbable even in soils of low buffering capacity unless extreme conditions exist, that is exces- sive metal contamination and/or strong acid pollution take place.
Acknowledgements This research was supported by the Hungarian National Scientific Research Fund (OTKA T 023221) and by the Soros Foundation under grant No. 247/2/7400.
References [ I ] G. Sposito, The Chemistry of Soils (Oxford University Press, New York, 1989) pp. 66-68. [2] J. D. Wok, Soil Solution Chemisty Applications to Environmenral Science and Agriculture ( J .
Wiley & Sons, New York, 1994) pp. 345. [3] M. I. Litaor, Water Resour: Res., 24, 727-733 (1988). [4] Gy. Vhallyay, Land Degradation & Rehabilitation, 1, 17 1-188 (1989). [5] 2. Prusinkiewicz, U. Pokojska, U. Frank and A. Kwiatkowska, Ekol. Pol., 40, 401-415 (1992). [6] P. M. Bierman, C. J. Rosen, P. R. Bloom and E. A. Nater. J. Environ. Qual., 24, 279-285
( 1995). [7] V. V. Snakin, P. P. Krechetov, T. A Kuzovnikova, I. 0. Alyabina, A. F. Gurov and A. V.
Stepichev, Soil Technology, 8, 331-343 (1996). [8] R. Lal, W. H. Blum, C. Valentine and B. A. Stewart, Methods for Assessment of Soil Degrada-
tion (CRC Press, Boca Raton, 1998) pp. 349. [9] D. C. Adriano, Trace Elements in the Terrestrial Environment (Springer-Verlag. New York,
1986) pp. 533. [ 101 Hungarian Technical Directive, MI-08-1735-1990 (in Hung.).
Dow
nloa
ded
by [
Uni
vers
ity o
f T
enne
ssee
At M
artin
] at
08:
16 0
8 O
ctob
er 2
014

EXTRACTION OF SOIL SOLUTION 323
[ I I ] S. E. Lorenz, R. E. Hamon, S. P. McGrath. P. E. Holm and T. H. Christensen. European J. Soil
[ 121 A. Kabata-Pendias. in: Heavy Metals. Problems and Solutions (W. Salomons, U. Forstner and P. Mader, eds. Springer, Berlin, 1995) pp. 3-18.
[I31 G. Tyler, D. Berggren, B. Bergkvist, U. Falkengren-Grerup, L. Folkeson and A. Ruhling, in: Effects of Atmospheric Pollutants on Forests, Wetlands and Agricultural Ecosystems (T. C. Hutchinson and K. M. Meema. eds. Springer-Verlag, Berlin, 1987) pp. 347-359.
[ 141 G. W. Bruemmer, J. Gerth and U. Herms, Z. PJanzenernaehr. Bodenk., 149, 382-398 (1986). [ 151 M. Misztal and S. Ligeza, Zeszyt.v Pmhlemowe Postepciw Nauk Rolniczych, 434, 879-883
(1996), (in Polish). [ 161 W. Salomons. in: Chemical 7ime Bombs. Proceedings of the European State-ofthe-Art Con-
ference on Delayed Effects of Chemicals in Soils and Sediments. (G. R. B. ter Meulen. W. M. Stigliani, W. Salomons, E. M. Bridges and A. C. Imeson, eds. Veldhoven, The Netherlands. 1992) pp. 3 143.
I 171 L. Blake, A. E. Johnston and K. W. T. Goulding, Soil Use and Managemenl. 10,51-55 (1994). [ 181 R. C. Severson and D. F. Grigal, Water Resources Bulletin, 12, 1161-1 170 (1976). [ 191 D. Zabowski and F. C. Ugolini, Soil Sci. Soc. Am. J. , 54, 1130-1 135 (1990). [20] R. Giesler. U. S. Lundstrom and H. Grip, Eurupean J. Soil Sci., 47, 395405 (1996). (211 R. Marques, J. Ranger, D. Gelhaye, B. Pollier, Q. Ponette and 0. Gedert, European J. Soil Sci.,
47, 4 0 7 4 I7 ( 1996). [22] N. A. Komarova. in: Physico-Chemical Methods of the Study of Soils (Izd. Nauka, Moscow,
1968) pp. 7-3 1. (In Russian). [23] E. A. Elkhatib, J. L. Hem andT. E. Staley, Soil Sci. Soc. Am. J., 51, 578-583 (1987). [24] H. T. Gollany, P. R. Bloom and T. E. Schumacher, Plant Soil. 188.59-64 (1997). 1251 C. Sonneveld. J. van den Ende and S. S. de Bes, Plant Soil, 122, 169-175 (1990). 1261 G. P. Gillman, in: Div. of Soils Div. Report No. 16 (CSIRO, Australia, 1976) pp. 1-6. [27] B. Reynolds, Plant Soil, 78, 437-440 (1984). [28] D. L. Jones and A. C. Edwards, Commun. Soil Sci. Plant A n d , 24, 171-186 (1993). [29] J. Csillag, T. T6th and M. RCdly, Arid Soil Research and Rehabilitation, 9, 245-260 (1995). 1301 C. Keller, Commun. Soil Sci. Plant Anal.. 26, 1621-1636 (1995). [3 I ] P. del Castilho, Qimica Analitica, 13 Suppl., S21-S25 (1994). 1321 S. E. Bufflap and H. E. Allen, WaterRes., 29, 2051-2054 (1995). [33] P. del Castilho, R. Fassen van and R. Moerman, Fresenius J. Anal. Chem.. 354, 756-759
( 1996). [34] S. Iwata, T. Tabuchi and B. P. Warkentin, Soil- Water Interactions. Mechanisms and Applica-
tions (Marcel Dekker, New York, 1988) pp. 1-61. 1351 D. Hillel, Fundamentals ofsoil Physics (Academic Press, New York, 1980) pp. 123-165. 1361 K. Rajkai, S. Kabos, M. Th. Van Genuchten, P. E. Jansson, Soil Sci., 161, 832-845 (1996). 1371 R. 0. Slatyer, Plant-Wafer Relationships (Academic Press, London, 1967) p. 278. [38] J. F. Sutcliffe, Plants and Water (Edward Arnold Publ., London, 1979). 2nd ed. [39] D. J. Campbell and P. H. T. Beckett, J. Soil Sci., 39, 283-298 (1988). [40] A. Kabata-Pendias and H. Pendias, Trace Elements in Soils and Plunts (CRC Press, Boca
Raton, 1992),2nd ed., p. 2 3 4 3 . [41] G. R. Blake and K. H. Hartge, in: Methods of Soil Analysis, part I (A. Klute, ed. American
Society of Agronomy, Madison, Wisconsin. 1986), 2nd ed., pp. 363-375. [42] D. K. Cassel and D. R. Nielsen, in: Methods of Soil Analysis, part I (A. Klute, ed. American
Society of Agronomy, Madison, Wisconsin. 1986), 2nd ed., pp. 913-915. [43] A. Andersson, Swedish J. agric. Res., 5, 125-135 (1975). (441 K. Bujtls. A. Chlopecka, 1. KBdk and D. C. Adriano, in: Bioovailabiliry and its Potential Role
in Risk Assessment (R. Naidu, ed. John Wiley, 1999) in press. 1451 J. Csillag, T. M. Silyeva and M. RCdly, in: Genesis and Control of Fertiliry ofSalt-Affected
Soils (ISSS Subcommission on Salt-Affected Soils and V. V. Dokuchaev Soil Inst., Moscow, 1991), pp. 181-185.
1461 Hungarian Standard, MSz-450/1-1989 (in Hung.). [471 W. Fresenius, K. E. Quentin and W. Schneider (eds.), Water Analysis. A Practical Guide to
Physico-Chemical. Chemical and Microbiological Water Examination and Qualiry Assurance (Springer-Verlag. Berlin, 1988) pp. 804.
Sci.. 45, 159-165 (1994).
Dow
nloa
ded
by [
Uni
vers
ity o
f T
enne
ssee
At M
artin
] at
08:
16 0
8 O
ctob
er 2
014
324 JULIANNA CSILLAG er al.
[48] P. del Castilho. J. Bril, W. J. Chardon, P. F. A. M. Romkens and 0. Oenema, Hrvat. Vode, 4, 125-134 (1996).
[49] A. Kabata-Pendias and H. Pendias, in: New Horizons of Health Aspects of Elements ( S . B. Vohora and J. W. Dobrowolski, eds. Hamdard University, New Delhi, 1990) pp. 81-110.
[SO] K. K. Tanji (ed), Agriculfural Saliniry Assessment and Managemenr (American Society of Civil Engineers: Manuals and Reports on Engineering Practice No. 7 I , New York, 1990) pp. 619.
[5 I ] R. N. Yong, A. M. 0. Mohamed and B. P. Warkentin, Principles of Contaminant Transport in Soils (Developments in Geotechnical Engineering. 73, Elsevier, Amsterdam, 1992) pp. 327.
[52] A. Schulte, in: Biogeochemisrry of Trace Elements (D. C. Adriano, ed., Env. Geochemistry and Health 16., 1994) pp. 525-535.
[53] L. J. Evans, G. A. Spiers and G. Zhao, Intern. J . Envimn. Anal. Chem., 59, 291-302 (1995). [54] R. G. Gemtse, W. Driel van, K. W. Smilde and B. Luit van, Plant Soil, 75, 393404 (1983). [55] M. B. McBride, J . Environ. Qual., 24, 5-18 (1995). [56] P. del Castilho and W. J. Chardon, Planf Soil. 171, 263-266 (1995).
Dow
nloa
ded
by [
Uni
vers
ity o
f T
enne
ssee
At M
artin
] at
08:
16 0
8 O
ctob
er 2
014