extraction of oil from fish processing waste for fuel
TRANSCRIPT
i
Extraction of oil from fish processing waste for fuel applications: Process
development, analysis and feasibility
By
©Ibraheem Adetunji Adeoti
A thesis submitted to the school of Graduate Studies
in partial fulfilment of the requirements for the degree of
Doctor of Philosophy
Faculty of Engineering and Applied Science
Memorial University of Newfoundland
May, 2015
St. John’s, Newfoundland
Canada
ii
Abstract
The fish processing industry generates a significant amount of fish byproducts that could
either be an important source of energy, food, or industrial feedstock. Fish oils are made
up of several lipid classes. These lipids contain long-chain omega-3 polyunsaturated fatty
acids; PUFA, (mostly eicosapentaenoic acid (EPA: C20:5 n-3), and docosahexaenoic acid
(DHA: C22:6 n-3)) and other lipid classes. The traditional market for the nutritional
lipids in the fish oil has been the food industry. However, significant infrastructure for the
strict quality control systems is required for food grade oils. Therefore, the process of
extracting the high nutritional oils is energy intensive. Further, the location and
infrastructure limit the feasibility due to processing requirement, storage and/or
transportation issue. For biofuel implementation, the processes to extract and refine fish
oil are less energy intensive than the processes for nutritional quality oils and do not
require the stringent product specifications and approval process as in the food and
pharmaceutical industry. There have been significant advances in developing inexpensive
and robust methods for fuel extraction and upgrading processes.
Supercritical fluid extraction process using carbon dioxide (SC-CO2) under moderate
conditions is promising for quality fish oil production. This process produces oil with low
impurities compared to other processes. The specific research objectives include: (1)
Overview and background information on Atlantic Canada fish processing plants (2)
Review of (state of art) fish oil extraction processes including physical, chemical and
biological processes. (3) Fuel oil characterization of fish oil and fish oil blends with
petroleum distillate. This section evaluates thermal stability, rheological, and heating

iii
values, of crude fish oil and blend with heavy petroleum distillate. (4) Solubility
determination of fish oil in SC-CO2; the SFE extraction process (optimize the SFE
process conditions to maximize fish oil yield under the least intensive conditions,
pressures, temperatures and CO2 consumption); and mathematical model to predict oil
extraction rate as a function of process conditions. (5) Fuel oil quality evaluation as a
function of extraction methods. (6) Life cycle assessment (LCA) of different extraction
processes (modified fishmeal process (MFM), SC-CO2, and soxhlet processes) of fish oil
from salmon wastes. The environmental burdens and potential impacts by each extraction
process were quantified through the LCA.
In the characterization phase of this study, the thermal and rheological properties of
unrefined salmon oil, bunker fuel oil and their blends have been analyzed. The feasibility
of using unblended and/or blends of fish oil in conventional heaters/boilers/engines are
determined by these properties. The MFM oils, the bunker fuel oil and their blends
behaved as a shear thinning non-Newtonian fluid that can be described by the power-law
model.
The supercritical carbon dioxide extraction (SC-CO2) was effective at pressures of 15, 25,
and 35 MPa, temperatures of 313, 333 and 353 K, and CO2 flow rates of 0.18-0.48 kg/hr.
The process is solubility controlled and the yields at 35 MPa, temperatures of 313, 333
and 353 K, and CO2 flow rates of 0.18 kg/hr were approximately 39, 46 and 41 (wt.%).
The mathematical model (Goto et al. 1993) using the best fit of theoretical extraction
curve correlated the experimental data satisfactorily with average absolute deviation,
AAD (%) ranged from 2.4 to 10.6 %. Unlike the MFM oil, the SC-CO2 oil is more

iv
viscous homogenous oil which behaved as a Newtonian fluid. Physco-chemical,
compositional and thermal characterization indicated SC-CO2 oil contains fewer
impurities than the MFM and soxhlet process oils.
From the LCA results, the MFM method has the lowest overall environmental impact
compared to the soxhlet and SC-CO2 methods. The soxhlet extraction method, due to the
use of solvent (hexane), has the greatest impacts on all of the four damage categories
(human health, ecosystem quality, climate change and resources). The SC-CO2 requires
more energy to produce 1 kg fish oil (2 folds more than the MFM and 3 folds more than
the soxhlet methods). However, the SC-CO2 produces higher quality oil than the other
two processes and the process impact on the environment is moderate relative to the
MFM and soxhlet processes.

v
ACKNOWLEDGEMENT
Glory be to Allah (SWT) who from His infinitesimal mercy showers His bless and mercy
upon me, protect and guide me from the beginning of this project till the very end.
I am indebted to my lovely wife and daughter, Mrs. Yusrah Adeoti and Ismat Adeoti for
their perpetual support, encouragement and love. You two are a constant source of joy.
My sincere gratitude goes to my supervisor, Dr. Kelly Hawboldt and I would like to
thank Dr. Yan Zhang and Dr. Robert Helleur of my supervisory committee, and Dr.
Francesca Kerton of chemistry for their perpetual support, advice and encouragement
throughout the course of my research.
I would also like to thank the Faculty of Engineering and Applied Science, Memorial
University of Newfoundland, and acknowledge the funding provided by the Government
of Newfoundland and Labrador (Green Fund) and, NSERC (Natural Science and
Engineering Research Council of Canada).
vi
TABLE OF CONTENTS
ABSTRACT ........................................................................................................................ ii
ACKNOWLEDGEMENT .................................................................................................. v
TABLE OF CONTENTS ................................................................................................... vi
LIST OF TABLES ........................................................................................................... xiii
LIST OF FIGURES .......................................................................................................... xv
CHAPTER 1
INTRODUCTION AND OVERVIEW. ............................................................................. 1
CHAPTER 2
LITERATURE REVIEW ................................................................................................... 8
A REVIEW OF LIPID EXTRACTION FROM FISH PROCESSING BY-PRODUCT
FOR USE AS A BIOFUEL ................................................................................................ 9
2.0 INTRODUCTION ...................................................................................................... 11
2.1 EXTRACTION OF OIL FROM FISH WASTE FOR FUEL OIL APPLICATION .. 14
2.2 FISHMEAL OPERATIONS FOR MEAL AND OIL PRODUCTIONS ................... 17
2.2.1 OIL EXTRACTION PROCESSES. ..................................................................... 18
2.2.2 PHYSICAL METHOD ........................................................................................ 19
2.2.2.1 OIL PRODUCTION FROM FISHMEAL PROCESS .................................. 19
vii
2.2.3 CHEMICAL METHODS ..................................................................................... 21
2.2.3.1 SOLVENT EXTRACTION .......................................................................... 21
2.2.3.2 BLIGH AND DYER (B&D) ......................................................................... 22
2.2.3.3 SOXHLET METHOD ................................................................................... 25
2.2.3.4 ACCELERATED SOLVENT EXTRACTION (ASE) ................................. 26
2.2.3.5 MICROWAVE ASSISTED EXTRACTION (MAE) ................................... 27
2.2.3.6 ACID-ALKALI-AIDED EXTRACTION ..................................................... 28
2.2.3.7 SUPERCRITICAL FLUID EXTRACTION (SCFE) .................................... 29
2.2.3.8 MEMBRANE COUPLED SC-CO2 EXTRACTION. ................................... 34
2.2.4 BIOLOGICAL PROCESSES .............................................................................. 34
2.2.4.1 HYDROLYSIS .............................................................................................. 34
2.2.4.2 FERMENTATION ........................................................................................ 36
2.3.0 SUMMARY AND CONCLUSION. .................................................................... 39
CHAPTER 3
THERMAL AND FLOW PROPERTIES OF FISH OIL BLENDS WITH BUNKER
FUEL OIL ......................................................................................................................... 49
3.1 INTRODUCTION ...................................................................................................... 54
3.2. MATERIALS AND METHODS ............................................................................... 55
3.2.1. SAMPLE PREPARATION ................................................................................ 55
viii
3.2.2. THERMO GRAVIMETRIC ANALYSIS (TGA) .............................................. 56
3.2.3. CALORIFIC VALUE/HIGH HEATING VALUE (HHV) ................................ 56
3.2.4 FLASH POINT TESTING ................................................................................... 57
3.2.5. MELTING POINTS AND ENTHALPY ............................................................ 57
3.2.6. RHEOLOGICAL PROPERTIES ........................................................................ 58
3.3 RESULT AND DISCUSION ..................................................................................... 59
3.3.1 THERMAL ANALYSIS (TGA) .......................................................................... 59
3.3.2 CALORIFIC VALUE/HIGH HEATING VALUE (HHV) ................................. 64
3.3.3 FLASH POINT TESTING ................................................................................... 66
3.3.4. MELTING POINTS AND ENTHALPY ............................................................ 67
3.3.5. RHEOLOGICAL PROPERTIES ........................................................................ 71
3.4 SUMMARY AND CONCLUSION. .......................................................................... 77
CHAPTER 4
SOLUBILITY MEASUREMENT, EXPERIMENTAL AND MASS TRANSFER
MODELING OF SALMON PROCESSING WASTE USING SC-CO2 .......................... 82
4.1 INTRODUCTION ...................................................................................................... 87
4.2 MATHEMATICAL MODELING .............................................................................. 92
4.3 MATERIALS AND METHODS .............................................................................. 100
4.3.1 SOLUBILITY DETERMINATION .................................................................. 101
ix
4.3.2 SUPERCRITICAL FLUID EXTRACTION (SFE) ........................................... 102
4.3.3 MODEL PARAMETERS ESTIMATION ......................................................... 103
4.4 RESULTS AND DISCUSSION ............................................................................... 106
4.4.1 SOLUBILITY OF FISH OIL ............................................................................. 106
4.4.2 DYNAMIC BEHAVIOR OF EXTRACTION OF FISH OIL ........................... 110
4.4.3. GOTO ET AL. MODEL COMPARED WITH EXPERIMENTAL DATA FROM
THIS WORK. .............................................................................................................. 111
4.4.4. EFFECT OF OPERATING PARAMETERS ON EXTRACTION YIELD ..... 112
4.4.4.1. EFFECT OF TEMPERATURE ON CUMULATIVE EXTRACTION
YIELD. .................................................................................................................... 112
4.4.4.2. EFFECT OF PRESSURE ON CUMULATIVE EXTRACTION YIELD. 113
4.4.4.3. EFFECT OF SOLVENT MASS FLOW RATE ON CUMULATIVE
EXTRACTION YIELD. .......................................................................................... 116
4.4.4.4. PREDICTED EFFECT OF PARTICLE SIZE ON CUMULATIVE
EXTRACTION YIELD. .......................................................................................... 117
4.5 CONCLUSION ..................................................................................................... 118
CHAPTER 5
COMPARISON OF BIOFUEL QUALITY OF WASTE DERIVED OILS AS A FUNCT-
ION OF OIL EXTRACTION METHODS ..................................................................... 128
x
5.1 INTRODUCTION. ................................................................................................... 133
5.2 MATERIALS AND METHODS .............................................................................. 135
5.2.1 OIL RECOVERY METHODS .......................................................................... 135
5.2.2 LIPID AND FATTY ACID COMPOSITION ANALYSIS .............................. 135
5.2.3. THERMO GRAVIMETRIC ANALYSIS (TGA) ............................................ 136
5.2.4. CALORIFIC VALUE/HIGH HEATING VALUE (HHV) .............................. 137
5.2.5. MELTING POINTS AND ENTHALPY .......................................................... 137
5.2.6. DYNAMIC VISCOSITY USING THE BROOKFIELD RHEOMETER ........ 137
5.2.7. WATER AND SEDIMENTS, MOISTURE CONTENT, FFA/ACID VALUE,
PEROXIDE VALUE, AND DENSITY. ..................................................................... 138
5.3 RESULT AND DISCUSSION. ................................................................................ 139
5.3.1. PERCENTAGE RECOVERY .......................................................................... 139
5.3.2. LIPID COMPOSITION .................................................................................... 141
5.3.2.1 EFFECT OF LIPID COMPOSITIONS OIL QUALITY ............................ 143
5.3.3. FATTY ACID COMPOSITION ....................................................................... 144
5.3.4. THERMAL ANALYSIS (TGA) ....................................................................... 146
5.3.5. CALORIFIC VALUE/HIGH HEATING VALUE (HHV) .............................. 147
5.3.6. MELTING POINT ............................................................................................ 148
5.3.7. RHEOLOGICAL PROPERTIES ...................................................................... 150
xi
5.3.8 WATER AND SEDIMENT, MOISTURE, FFA, PEROXIDE VALUE,
DENSITY AND KINEMATIC
VISCOSITY ................................................................................................................ 153
5.4 CONCLUSION ......................................................................................................... 155
CHAPTER 6
LIFE CYCLE ANANLYSIS (LCA) COMPARISON OF FISH OIL EXTRACTION
METHODS ..................................................................................................................... 163
6.1 INTRODUCTION .................................................................................................... 163
6.2 SCOPE, PURPOSE AND SYSTEM BOUNDARY. ............................................... 166
6.2.1 METHODOLOGY ............................................................................................. 167
6.2.2 LIFE CYCLE INVENTORY (LCI) ................................................................... 170
6.2.3 MATERIALS AND EXPERIMENTAL METHODS ....................................... 175
6.3 ENVIRONMENTAL IMPACT ASSESSMENT ..................................................... 175
6.3.1. CHARACTERIZATION .................................................................................. 175
6.3.2. DAMAGE ASSESSMENT ............................................................................... 176
6.3.3. NORMALIZATION. ........................................................................................ 177
6.3.4. SINGLE SCORE ............................................................................................... 179
6.3.5 QUALITY ASSESSMENT ............................................................................... 180

xii
6.4 CONCLUSION ..................................................................................................... 182
CHAPTER 7
CONCLUSION AND RECOMMENDATIONS ........................................................... 189
7.1 SUMMARY AND CONCLUSION ......................................................................... 189
7.1.1 LITERATURE REVIEW ................................................................................... 190
7.1.2 CHARACTERIZATION OF FISH OIL AND BLENDS .................................. 191
7.1.3 SFE AND MASS TRANSFER MODELING .................................................... 192
7.1.4 QUALITY EVALUATION ............................................................................... 193
7.1.5 LIFE CYCLE ANALYSIS (LCA) ..................................................................... 194
7.1.2 RECOMMENDATIONS ................................................................................... 195

xiii
LIST OF TABLES
TABLE 2.1: SPECIES OF FISH CAUGHT FOR FISH OIL AND FISHMEAL
PRODUCTION ................................................................................................................. 16
TABLE 2.2: FISH TRIMMINGS (OFF-CUTS) AND OTHER NON-FISH SPECIES
USED OR COULD BE USED FOR FISH OIL AND FISHMEAL PRODUCTION ...... 17
TABLE 2.3: TOTAL, NEUTRAL, AND POLAR LIPIDS FROM HIGH-FAT BEEF
USING DIFFERENT SOLVENT EXTRACTION METHOD (G KG-1
FRESH WEIGHT
OF BEEF) MODIFIED FROM TANAMATI ET AL. [32] ............................................. 25
TABLE 2.4: COMPARISON BETWEEN SOLVENT EXTRACTION PROCESSES,
MERITS AND DEMERITS ............................................................................................. 34
TABLE 3.1: DATA SUMMARY COMPARING DECOMPOSITION TEMPERATURE
OF THE OILS ................................................................................................................... 62
TABLE 3.2: HEATING VALUE OF UNREFINED FISH OIL AND BLENDS ............ 66
TABLE 3.3A: MELTING POINTS ONSET TEMPERATURE AND ENTHALPY OF
THE OILS ......................................................................................................................... 70
TABLE 3.3B: FATTY ACID COMPOSITION OF WASTE FISH OIL AND
UNREFINED SALMON OIL .......................................................................................... 70
TABLE 3.4A: FLOW BEHAVIOR INDEX, CONSISTENCY INDEX, APPARENT
VISCOSITY, FROM POWER LAW EQUATION FITTING OF WASTE FISH OIL,
UNREFINED SALMON OIL, RFO AND COD OIL ...................................................... 74
xiv
TABLE 3.4B: FLOW BEHAVIOR INDEX, CONSISTENCY INDEX, APPARENT
VISCOSITY, FROM POWER LAW EQUATION FITTING OF BLENDS OF WASTE
FISH OIL AND UNREFINED SALMON OIL WITH RFO. .......................................... 75
TABLE 3.5: THE ACTIVATION ENERGY EA OF THE RAW OILS AND THEIR
BLENDS ........................................................................................................................... 76
TABLE 4.1: EXAMPLES OF EXPERIMENTAL AND MODELING WORK ON
SUPERCRITICAL EXTRACTION ................................................................................. 90
TABLE 4.2A: SALMON OIL SOLUBILITY AS COMPARED TO THE SOLUBILITY
OF OTHER FISH AND VEGETABLE OILS ............................................................... 108
TABLE 4.2B: CORRELATION CONSTANTS OF THIS WORK COMPARE TO
LITERATURE VALUES ............................................................................................... 109
TABLE 4.3: EXPERIMENTAL CONDITIONS AND THE MODEL PROCESS
PARAMETERS AT VARIOUS FOR FISH OIL EXTRACTION ................................ 114
TABLE 5.1: LIPID COMPOSITION IN EXTRACTED OIL AS A FUNCTION OF
EXTRACTION METHOD ............................................................................................. 143
TABLE 5.2: FATTY ACID COMPOSITIONS OF OILS EXTRACTED OIL AS A
FUNCTION OF EXTRACTION METHODS ............................................................... 145
TABLE 5.3: SOME SALMON OIL PROPERTIES AS FUNCTION OF EXTRACTION
METHODS ..................................................................................................................... 148
xv
TABLE 5.4: FLOW BEHAVIOR INDEX, CONSISTENCY INDEX, AND
ACTIVATION ENERGY OF SALMON OILS AS A FUNCTION OF EXTRACTION
METHODS ..................................................................................................................... 152
TABLE 6.1: STUDIES ON ALTERNATIVE OPTIONS FOR PETROLEUM FUELS163
TABLE 6.2: SOME STUDIES ON LCA OF BIOFUEL AND BIODIESEL PROCESSES
......................................................................................................................................... 165
TABLE 6.3A: MATERIAL (KG) INVENTORIES OF EXTRACTION PROCESSES 170
TABLE 6.3B: ENERGY (KJ) INVENTORIES OF EXTRACTION PROCESSES ..... 171
TABLE 6.4A: OIL QUALITY AS A FUNCTION OF EXTRACTION METHODS ... 181
TABLE 6.4B: PROCESS QUALITY RATING ............................................................. 182
LIST OF FIGURES
FIGURE 1.1: ATLANTIC CANADA. ............................................................................... 2
FIGURE 2.1: BASIC STAGES OF FISHMEAL AND FISH OIL PRODUCTION AT A
LARGE -SCALE FISHMEAL PLANT. MODIFIED FROM BIMBO AP [16] ............. 20

xvi
FIGURE 2.2: FLOW PROCESS FOR TYPICAL HYDROLYSIS. MODIFIED FROM
BIMBO AP [16] ................................................................................................................ 37
FIGURE 2.3: FLOW PROCESS FOR TYPICAL FERMENTATION. MODIFIED
FROM BIMBO AP [16] ................................................................................................... 39
FIGURE 3.1A: THERMAL DEGRADATION OF THE RESIDUAL FUEL OIL,
UNREFINED SALMON OIL AND WASTE FISH OIL UNDER NITROGEN AND
AIR ATMOSPHERE. ....................................................................................................... 63
FIGURE 3.1B: THERMAL DEGRADATION OF BLENDS SB20, SB50, SB80 OF
UNREFINED SALMON OIL WITH RESIDUAL FUEL OIL UNDER NITROGEN
AND AIR ATMOSPHERE. ............................................................................................. 63
FIGURE 3.1C: THERMAL DEGRADATION OF BLENDS WB20,WB50,WB80 OF
WASTE FISH OIL WITH RESIDUAL FUEL OIL UNDER NITROGEN AND AIR
ATMOSPHERE. ............................................................................................................... 64
FIGURE 3.2A: DCS THERMOGRAPH OF THE WASTE FISH FISH OIL ................. 68
FIGURE 3.2B: DCS THERMOGRAPH OF UNREFINE SALMON OIL ...................... 69
FIGURE 3.3: CHANGE IN APPARENT VISCOSITY WITH SHEAR RATE AT 60 OC
FOR WASTE FISH OIL, UNREFINED SALMON OIL, RFO AND THEIR 50% (V/V)
BLENDS. RFO-RESIDUAL FUEL OIL; WB50-50 % (V/V) WASTE FISH OIL
BLEND WITH RFO; SB50-50 % (V/V) UNREFINED SALMON OIL BLEND WITH
RFO. .................................................................................................................................. 73
xvii
FIGURE 4.3: SALMON OIL SOLUBILITY AS A FUNCTION OF TEMPERATURE
(K) AND PRESSURE (MPA) ........................................................................................ 107
FIGURE 4.4: TYPICAL EXTRACTIVE CURVE OF EXPERIMENTAL DATA AT
0.18 KG/HR., 25 MPA AND 353 K. .............................................................................. 111
FIGURE 4.5: EFFECT OF TEMPERATURE (313 – 353 K) ON EXTRACTION YIELD
AT 0.18 KG/HR AND 35 MPA. .................................................................................... 113
FIGURE 4.6: EFFECT OF PRESSURE (15 – 35 MPA) ON EXTRACTION YIELD AT
0.18 KG/HR AND 333 K................................................................................................ 115
FIGURE 4.7: EFFECT OF SOLVENT MASS FLOW RATE ON EXTRACTION
YIELD AT 313 K AND 35MPA. ................................................................................... 117
FIGURE 4.8: PREDICTED EFFECT OF PARTICLE SIZE ON EXTRACTION YIELD
AT P = 35 MPA, T = 353 K AND MASS FLOW RATE 0.18 KG/HR. ........................ 118
FIGURE 5.1: EXTRACTION YIELD AT P = 35 MPA AND T = 313 K AND
SOLVENT MASS FLOW RATE OF 0.18 – 0.48 KG/HR. ........................................... 141
FIGURE 5.3: THERMAL DEGRADATION OF THE CRUDE SALMON OIL
RECOVERED BY SC-CO2 AND MFM METHODS IN NITROGEN ATMOSPHERE.
......................................................................................................................................... 147
FIGURE 5.4: DCS THERMOGRAPH OF THE CRUDE SALMON OIL EXTRACTED
USING SC-CO2 AND MFM METHODS. ..................................................................... 149
FIGURE 5.5: CHANGE IN APPARENT VISCOSITY WITH SHEAR RATE AT 20, 40
AND 60 OC FOR SALMON OILS FROM MFM AND SC-CO2 METHODS. ............. 151

xviii
FIGURE 6.1: LCA PROCESS BOUNDARY ................................................................ 167
FIGURE 6.3A: SC-CO2 EXTRACTION PROCESS FLOW DIAGRAM ..................... 172
FIGURE 6.3B: SOXHLET EXTRACTION PROCESS FLOW DIAGRAM ................ 173
FIGURE 6.3C: MFM EXTRACTION PROCESS FLOW DIAGRAM ..................... 174

1
CHAPTER 1
1.0 INTRODUCTION AND OVERVIEW.
The Canadian fish processing industry is one of the major seafood and marine product
exporters, with approximately 75 % fish products exported to over 80 countries. Atlantic
Canada (Fig.1.1) was about 40,000 km of coastline which comprises four provinces
including Newfoundland and Labrador, New Brunswick, Prince Edward Island and Nova
Scotia. In 2011, the total sea fisheries landed in Canada was 850,533 metric tons with
703,905 metric tons (82.76%) from the Atlantic Region [1]. Before the final sale,
approximately 70% of the fish landed is processed [2] resulting in a considerable
percentage (20 – 80% wt) of fish waste depending on the processing extent and fish type
[3]. Fish discards may include the heads, frames, trimmings, fins, skin and viscera. Some
of the by-products are used while the main bulk is considered waste and dumped into the
sea or landfilled, creating both disposal and pollution problems [2]. In Atlantic Canada,
fish processing industries generate approximately 418,000 tons of fish wastes annually
[3]. Newfoundland and Labrador (NL) processing plants (excluding seal processing
plants and fish meal plants) generate fish wastes in the amount of 35,000 tons annually
[3], which are disposed into the oceans. The most commonly processed species are
capelin, herring, mackerel, seal and farmed salmanoids [4]. The disposal of fish waste in
the ocean leads to considerable oxygen shortage in the water due to activities of the
aerobic bacteria on the organic matter in the presence of oxygen.

2
Figure 1.1: Atlantic Canada. (Sourced from Goggle)
Fish waste also causes overloads of nitrogen, phosphorous and ammonia, which can lead
to pH changes and increased water turbidity, which can also lead to the decomposition of
algae [1]. Fish processing waste contains valuable by-products which may include; fish
oil (ω-3 fatty acids), proteins and amino acids, chitosan, chitin, collagen and gelatin,
cosmetics, natural pigments, enzymes, animal feed, and soil fertilizers [1,5]. In areas of
intense fish processing, these by-products are further processed into fishmeal where the
byproduct is waste fish oil.
The fish oil fatty acids (PUFA; DHA and EPA) are known for their significant roles in
human health and nutrition such as prevention and treatment of coronary heart disease,
blood platelet aggregation, hypertension, arthritis, abnormal cholesterol levels, mental
illness and autoimmune disorders [6,7]. Fish oil are also a rich source of vitamins
3
including vitamin A, D, E and K, which are soluble content of the oil and need to be
extracted for human consumption due to their significant roles in human health and
metabolism. On an annual basis, EPA demand is about 125 tonnes in Japan and demand
is much greater world-wide for nutritional supplement [6]. PUFA occurs as
triacylglycerides (TAG) in fish oil at levels between 10 and 25 % and resulting market
growth has necessitated much interest in PUFA extraction and the concentrating method
from natural sources [7].
However, due to degradation or low quality, waste derived fish oils are not suitable for
edible oils and could serve as a possible low grade fuel. The fish oils when compared to
petroleum based fuels have the advantage of lower toxicity, higher biodegradation rates
(reducing impact on soil and water if spilled), no sulfur, and a higher flash point [8, 9, 10,
11]. The extraction of fish oil (edible and non-edible) can be done through several
methods using physical, chemical and biological approaches. The properties which make
fish oil a replacement/blend option to petroleum fuel distillates include high
calorific/heating value, biodegradability, and comparable combustion efficiency.
However, using unrefined fish oil in engines can cause operational issues due to
composition/property differences between crude fish oil and conventional diesel fuel.
Crude fish oil contains a variety of impurities such as free fatty acids, primary oxidation
products, minerals, pigments, moisture, phospholipids, and insoluble impurities that
reduce the oil quality. The level of the impurities present in the oil depends on the fish oil
extraction method. A series of refining processes are normally used to remove these
impurities, such as degumming, deodorization, bleaching, and neutralization. However,
4
the operating costs associated with these refining steps and loss of oil quality during
processing added to the overall cost of the process. Careful selection of the initial
extraction process can produce oils that contain fewer impurities and thus reduce the need
for further processing of the oil. There are several challenges with this type of work,
predominantly in the heterogeneity of the waste material as fish species and degree of
fish processing varies based on location and season. Currently, most researchers focus on
refining and conversion of crude bio-oils (plant and animal) to biodiesel using chemical,
thermal, and enzymatic processes. There is limited literature comparing oil extraction
processes from fish or fish waste as a function of extraction processes. The fuel
properties of fish oil and petroleum fuel blends have not been studied in detail. In
addition, the overall feasibility of extraction processes of oil from waste has not been
studied. To address these and other issues related to fish oil extraction from fish waste,
the following studies are required; various extraction processes of lipid/oil from fish
residues, quality of oil derived as function of extraction processes, characterization of fish
oil blends with mineral base fuels, and the environmental impacts of the extraction
processes.
In this research, physical, chemical and biological extraction processes were reviewed
and based on the review three processes compared; a modified fishmeal process, the
traditional soxhlet extraction process, and supercritical extraction using carbon dioxide.
The thesis consists of a series of manuscripts either published, revised for publication, in
review processes or to be submitted for publication.
5
Chapter 2 has been published in the Biomass & Bioenergy Journal and the
manuscript provides the review of literature on the current state of art on fish oil
extraction from fish. The chapter (chapter 2) describes the oil extraction methods
available and proposed the effects of each method on lipid and protein products.
Chapter 3 describes the MFM process and characterization studies on the blend of
fish oil with mineral oil (heavy petroleum distillate). The manuscript has been re-
submitted to the Fuel Journal after revision.
Chapter 4 is divided into three sections: determination of fish oil solubility in SC-
CO2; optimization of the SFE extraction; and development of a mass transfer
model to predict oil extraction as a function of process conditions. The manuscript
from chapter 4 has been revised based on reviewers’ comments and re-submitted
to The Journal of Supercritical Fluids for publication.
Chapter 5 has been accepted to the Fuel Journal and summarizes the evaluation
of quality of the oil extracted using the three proposed extraction methods. The oil
quality was compared based on lipid compositions, physico-chemical, thermal,
rheological, and chemical properties.
Chapter 6 compares the extraction processing using life cycle analysis (LCA).
The energy, material and resources consumptions of the extraction methods were
analyzed using SimaPro 7.
Chapter 7 contains summary, conclusions, and recommendations.
6
References
[1]Ghaly AE, Ramakrishnan VV, Brooks MS, Budge SM, Dave D. Fish processing
wastes as a potential source of proteins, amino acids and oils: A critical review. Journal
of Microbial and Biochemical Technology 2013;5(4):107-129.
[2]Norziah MH, Nuraini J, Lee K.Y. Studies on the Extraction and Characterization of
Fish Oil From Wastes of Seafood Processing Industry. Asian Journal of Food and Agro-
Industry 2009;2(04):959-973.
[3]AMEC,. (2003) Management of wastes from Atlantic seafood processing operations.
AMEC Earth and Environment Limited, Dartmouth, Nova Scotia, Canada.
[4]Manuel H, Buckle K, Onodenlaore C. Inventory and Assessment of Marine sources of
feedstock for Biodiesel in Newfoundland and Labrador. St. John's, NL: Centre for
Aquaculture and Seafood Development; 2006.
[5]Arvanitoyannis IS, Kassaveti A. Fish industry waste: treatments, environmental
impacts, current and potential uses. International Journal of Food Science and
Technology 2008;43(4):726-745.
[6]Belarbi EH, Molina E, Chisti Y. A process for high yield and scaleable recovery of
high purity eicosapentaenoic acid esters from microalgae and fish oil. Enzyme Microb
Technol 2000 4;26(7):516-529.
[7]Zuta C, Simpson B, Chan H, Phillips L. Concentrating PUFA from mackerel
processing waste. J Am Oil Chem Soc 2003;80(9):933-936.

7
[8]Kalligeros S, Zannikos F, Stournas S, Lois E, Anastopoulos G, Teas C, et al. An
investigation of using biodiesel/marine diesel blends on the performance of a stationary
diesel engine. Biomass Bioenergy 2003 2;24(2):141-149.
[9]Adeoti IA, Hawboldt K. A review of lipid extraction from fish processing by-product
for use as a biofuel. Biomass Bioenergy 2014 4;63(0):330-340.
[10]Charles K Westbrook. Biofuels Combustion. Annu. Rev. Phys. Chem. 2013;64:201-
219.
[11]Ushakov S, Valland H, Æsøy V. Combustion and emissions characteristics of fish oil
fuel in a heavy-duty diesel engine. Energy Conversion and Management 2013
1;65(0):228-238.
8
CHAPTER 2
LITERATURE REVIEW
A REVIEW OF LIPID EXTRACTION FROM FISH PROCESSING
BY-PRODUCT FOR USE AS A BIOFUEL
Ibraheem A. Adeoti*, Kelly Hawboldt.
Department of Oil and Gas Engineering, Faculty of Engineering and Applied Sciences,
Memorial University of Newfoundland St.John’s, NL A1B 3X5, Canada.
Received 22 July 2013, Revised 13 September 2013, Accepted 6 February 2014.
9
Abstract
Fish processing facilities generate a significant amount of fish by-products that could be
an important source of energy, food, or industrial feedstock. While fish oil is a natural
source of omega-3 polyunsaturated fatty acids (mostly eicosapentaenoic acid (EPA), and
docosahexaenoic acid (DHA)) used in nutritional supplements, the ability to extract,
refine, and get to market of these oils may be challenging at processing facilities where
there is limited infrastructure and plants are remotely located. Under these conditions,
extraction of oil from fish by-product for use as an in-house or regional fuel may be both
economically and environmentally be a more sustainable approach. Processes to extract
and refine fish oil for fuel are less energy intensive than the processes for nutritional
quality oils and do not require the stringent product specifications and approval process
as in the food and pharmaceutical industry. Unlike food crops, extraction of oil from fish
residue does not negatively impact food production. This paper presents an overview of
developments made in fish oil extraction methodologies including physical, chemical and
biological processes.
A version of this paper has been published in the Biomass and Bioenergy Journal. The
lead author is Ibraheem Adeoti and co-author is Dr. Kelly Hawboldt. Mr. Ibraheem
Adeoti wrote the paper and performed all literature searches required for background
information while Dr. Hawboldt provided technical guidance and editing of the
manuscript.
10
Nomenclature
ASE Accelerated solvent extraction
B&D Bligh and Dyer
CO2 Carbon dioxide
DHA Docosahexaenoic acid
EPA Eicosapentaenoic acid
FAME Fatty acid methyl ester
FFA Free fatty acid
HPLC High-performance liquid chromatography
MAE Microwave assisted extraction
Mt Million tonne
PAHs Polycyclic aromatic hydrocarbons
PCBs Polychlorinated biphenyls
PUFA Polyunsaturated fatty acid
SC-CO2 Supercritical carbon-dioxide
SCFE Supercritical fluid extraction
SFA Saturated fatty acid
TAG Triacyglycerol
TG Triglycerides
11
2.0 Introduction
Fish oils are a rich source of polyunsaturated fatty acid (PUFA), in particular the n-3
series cis-5, 8, 11, 14, 17-eicosapentaenoic acid (EPA) and cis-4, 7, 10, 13, 16, 19-
docosahexaenoic acid (DHA). These fatty acids are used in the prevention and treatment
of coronary heart disease, blood platelet aggregation, hypertension, arthritis, abnormal
cholesterol levels, mental illness and autoimmune disorders [1,2]. Fish oils are also a rich
source of vitamins including vitamin A, D, E and K [3]. Polyunsaturated fatty acid
(PUFA) occurs as triglycerides (TG) in fish oil with a mass fraction between 10 % and 25
% [2].
Several methods have been used to concentrate PUFA in marine oils achieving different
levels of recovery. Without initial hydrolysis, concentration of up to 30 % EPA and DHA
can be achieved using solvent fractionation, winterization, and molecular distillation [2].
However, higher levels of concentration (65 % to 80 %) are achievable with combination
of either esterification or hydrolysis with methods such as supercritical fluid extraction,
urea complexation, and molecular distillation. Recoveries of above 90 % PUFA have
been attained using high-performance liquid chromatography (HPLC) [2]. A number of
processes have also been reported to concentrate PUFA with less or no saturated fatty
acid (SFA) such as low temperature crystallization, distillation, and enzymatic
enrichment [4].
Bio-oils from biomass are increasingly being used either as stand-alone or in blends with
petroleum based fuels. Bio-oils composition and thermal and physical properties are a
function of the feedstock and the degree of processing of the crude bio-oil. The most

12
common application is biodiesel, which when derived from animal and plant matter
consists of fatty acid methyl ester (FAME). When derived from virgin crops, the high
value of these crops requires tens of millions of liters of biodiesel to be produced
annually for an industrial plant to remain economical [5]. In addition, the food versus
energy debate and other environmental concerns over cultivation and conversions can
limit the choice of crops for energy over food [6]. Boyd et al. [5] also reported that
biodiesel manufacturing from bio-oils is not only economically more attractive than
virgin crops but also results in environmental benefits. Therefore, attention has been
shifted to recycled yellow and brown greases from foodservice establishments, fish oils
from the fish farming and processing industries, and rendered animal fats from the
agricultural industries.
Properties that make fish oil a replacement/blend option to petroleum fuel distillates are
high calorific/heating value, biodegradability, and comparable combustion efficiency.
However, using unrefined fish oil in engines can pose some problems due to poor flow
properties especially at low temperature, lower lubricity, higher viscosity, and higher
acidity compared to conventional diesel fuel [7]. This is because unrefined fish oil
contains impurities such as free fatty acids, primary oxidation products, minerals,
pigments, moisture, and phospholipids [8]. The presence and/or quantity of impurities
depend on the fish oil recovery method [8]. Hence, careful selection of the initial
extraction process can produce oils that contain fewer impurities and thus reduce the need
for further processing of the oil.
13
Several refining processes are normally required to improve fish oil quality such as
degumming, deodorization, bleaching, and neutralization. Various studies have studied
the use of fish oil as fuel oil for convectional combustors or diesel engines [9,10].
Engines that use low quality fuels are of particular interest. For instance, boilers and
furnaces that use low quality fuels such as Bunker “A” and “C” grade fuels can typically
accommodate volume fraction of 20 % -100 % blends of fish oil and therefore adding
emusifiers to the fish oil or refining through transesterification or other biodiesel
processing are not required; hence, cost of using biofuel is significantly reduced [9].
Other advantages of using fish oil include CO2 or GHG emission reduction, renewability,
non-toxic fuel, and safe handling operations.
Operations involving fish processing generate considerable quantities of edible and
inedible by-products. A percentage of the total catch of fish is discarded as processing
leftovers such as heads, frames, trimmings, fins, skin and viscera. The bulk of which is
considered residue and dumped, creating both disposal and pollution problems [11].
More complete utilization is achieved by conversion of leftovers into fishmeal and fish
oils. Fishmeal plants produce fish oil as a major by-product. [6]. Fish oil recovered from
fishmeal residue varies considerably (between a mass fraction of 1.4 % and 40.1 %)
depending on the species, tissue [2] and season. By-product oil from fish processing and
fishmeal plants could therefore be an important source of biofuel. Fish oil (edible and
non-edible) can be recovered through several methods. Typically the recovery method
selected attempts to minimize oil decomposition or denaturization of the products. The
most common process employed in fish oil production is wet reduction, which enables
14
recovery of a high volume of fish oil and may require subsequent refining steps in order
to make the fish oil edible [12]. Other conventional fish oil recovery processes include
hydraulic pressing, vacuum distillation, urea crystallization, hexane/solvent extraction,
and conventional crystallization. Each of these processes incorporate either high
temperatures and/or the use of flammable or toxic solvents, which could result in loss of
functional properties, denaturization of fish protein, and deterioration of oil quality and
nutrition value (e.g. PUFA oxidation) [13-15]. In addition, the focus of these processes is
typically recovery for edible, pharmaceutical or industrial application which must meet
regulatory standards.
2.1 Extraction of oil from fish waste for fuel oil application
The fishmeal process is the most common source of fish oil, as oil is generated as a by-
product in the fishmeal production. The fishmeal can be produced from fish caught
specifically for fishmeal and fish oil such as menhaden, anchovy, capelin and sardines;
incidental or by-catch from another fishery; and fish by-products regarded as off cuts
from edible fisheries which include cuttings from filleting operations, fish cannery
residue, roe fishery residue and, more recently, surimi processing by-product [16,17]. The
nature and volume of residue from fish processing depends on the processing procedures,
fish species and fish conditions, harvest season, nature of final products etc... [18]. Global
fish production has been reported to be about 140 Mt with 63 Mt of fish processing by-
product generated annually across the globe [19]. Pelagic fish form the core source of
fishmeal and fish oil production and are also essential ingredients in fish feed used in

15
farming carnivorous species such as salmon and trout [17]. Other types of fish operations,
such as fish filleting operations result in off cuts (offal) which are sourced from the
skeletons, heads, trimmings, and viscera, and also lead to residue which can be up to 50
% of total mass of the raw material [17,20]. The solid by-product has approximately the
same protein as the fish flesh [20]; meanwhile, the whole fish is the preference for meal
and oil production due to high ash and phosphorus content of fish processing residue
[17]. Tables 2.1 and 2.2 summarize the major fish raw materials involved in production
of marine oils and their sources.
Table 2.1: Species of Fish Caught for Fish oil and fishmeal production
Species Country
Anchovy
Peru, Chile, South Africa, Namibia, Mexico,
Morocco
Jack (Horse) Mackerel Peru, Chile, China, Vanuatu
Capelin Norway, Iceland, Russian Federation
Menhaden USA: Atlantic and Gulf of Mexico
Blue Whiting Norway, UK, Russian Federation, Ireland
Sand eel Denmark, Norway, Faroe Islands
Norway Pout Denmark, Norway, Faroe Islands
Sprat Denmark, Russian Federations
FAO statistics database [55] compiled and cited by Bimbo AP [16]
16
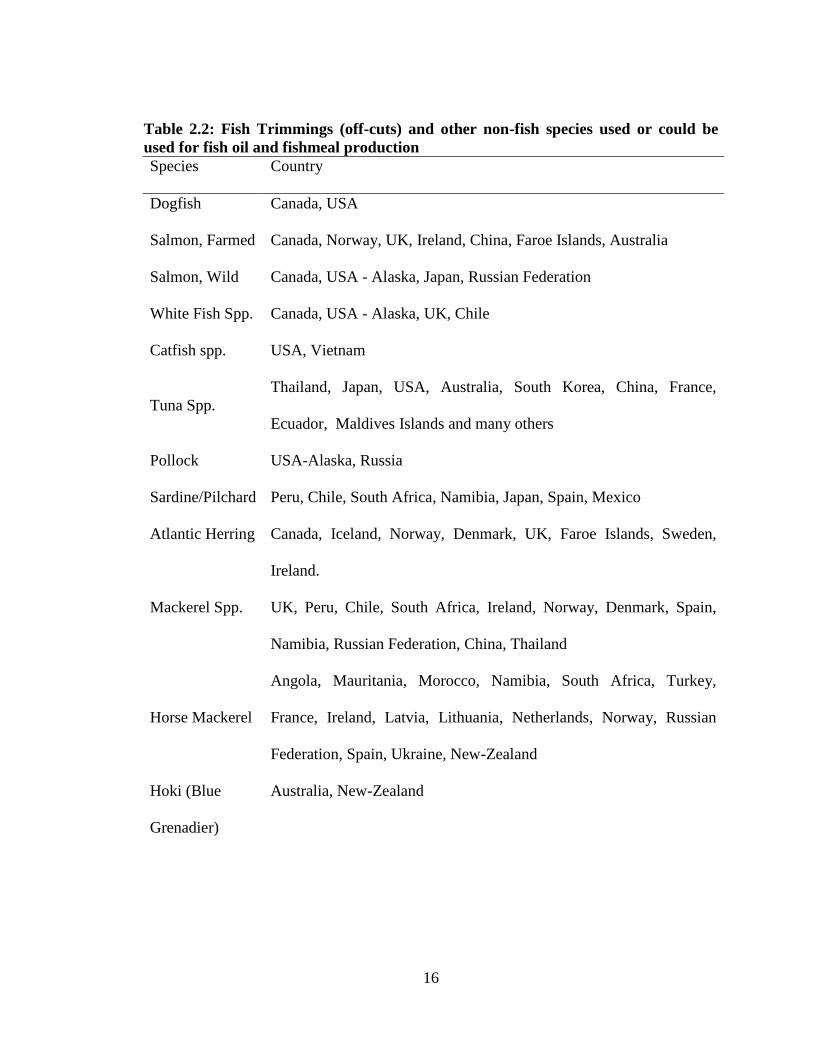
Table 2.2: Fish Trimmings (off-cuts) and other non-fish species used or could be
used for fish oil and fishmeal production Species Country
Dogfish Canada, USA
Salmon, Farmed Canada, Norway, UK, Ireland, China, Faroe Islands, Australia
Salmon, Wild Canada, USA - Alaska, Japan, Russian Federation
White Fish Spp. Canada, USA - Alaska, UK, Chile
Catfish spp. USA, Vietnam
Tuna Spp.
Thailand, Japan, USA, Australia, South Korea, China, France,
Ecuador, Maldives Islands and many others
Pollock USA-Alaska, Russia
Sardine/Pilchard Peru, Chile, South Africa, Namibia, Japan, Spain, Mexico
Atlantic Herring Canada, Iceland, Norway, Denmark, UK, Faroe Islands, Sweden,
Ireland.
Mackerel Spp. UK, Peru, Chile, South Africa, Ireland, Norway, Denmark, Spain,
Namibia, Russian Federation, China, Thailand
Horse Mackerel
Angola, Mauritania, Morocco, Namibia, South Africa, Turkey,
France, Ireland, Latvia, Lithuania, Netherlands, Norway, Russian
Federation, Spain, Ukraine, New-Zealand
Hoki (Blue
Grenadier)
Australia, New-Zealand

17
Non-Fish Species
Krill Norway, Poland, Ukraine, Japan, South Korea
Squid
Argentina, Chile, Peru, USA, Japan, China, South Korea, Russian
Federation, France, Portugal, Spain, UK, Morocco, Mexico, Hong
Kong, Taiwan, Ghana, Mauritania, South Africa, Senegal, Tunisia,
Falkaland Islands, Indonesia, Malaysia, Philippines, Thailand, New-
Zealand.
Single-Cell
Organisms
USA, Japan, Australia, Canada, USA (Hawaii), Israel, India
FAO statistics database [55] compiled and cited by Bimbo AP [16]
2.2 Fishmeal Operations for meal and oil productions
Fishmeal and fish oil are very broad generic terms often used for aquatic animal products
derived through processing whole fish and/or fish/shellfish by-product [21]. Fishmeal
plants for commercial production of edible fats and oils vary according to the type of raw
materials. The principal fishmeal and oil processing is typically wet reduction or wet
pressing [16,17]. The process starts with cooking to coagulate the fish protein and release
bound water and oil, followed by pressing to squeeze out liquids (press water) from
solids (press cake). The press water is desludged to further remove any solid particles
followed by centrifugation of the liquid (press water) to separate oil from water [16,17].
There are also several processes that can be used to convert whole fish and/or fish residue
into fishmeal and oil; they include wet rendering, hydrolysis, silage production (also

18
called autolysis), dry rendering and solvent extraction [16]. Figure 2.1 outlines the basic
stages of fishmeal and oil production in a large scale fishmeal plant.
2.2.1 Oil Extraction Processes.
Fish oil extraction processes can be classified into three categories: physical, biological
and chemical. Physical extraction processes include homogenizing, heating, pressing and
filtering [6], also regarded as wet rendering [16]. The majority of the fish oil producing
factories worldwide employs the wet rendering process as outlined in Figure 2.1.
Biological processes include enzymatic oil extractions and silage production through the
use of enzymes from fish viscera residue (autolysis) or enzymes from other sources
(hydrolysis) [16]. Chemical solvent extraction is another well-established process to
extract fish oil using organic solvents, however, the use of toxic solvents results in
protein denaturization and loss of functional properties [15,22]. Supercritical fluid
extraction technology (SCFE) has also been proposed in the extraction of compounds
from natural sources [23] including oil recovery from seeds/biomass, raw fish and/or fish
by-products [24]. SC- CO2 for oil recovery is an attractive option as it is a non-toxic, non-
flammable, inexpensive and clean solvent [15,25].
19
Homogenizing
Cooking
Pressing
Drying stage 2
Cooling
Grinding
Offal storageScreening
Press liquor
Solid removalDraining
Centrifugation/Oil-water
separation
Sticky water Crude Fish oil
Evaporation
Carbon treatment
(Optional)
Water washing
Addition of antioxidant
Drying stage 1
FishmealF
ish
oil
sto
rag
e
Dry Conveying
Water to discharge
Wet conveying
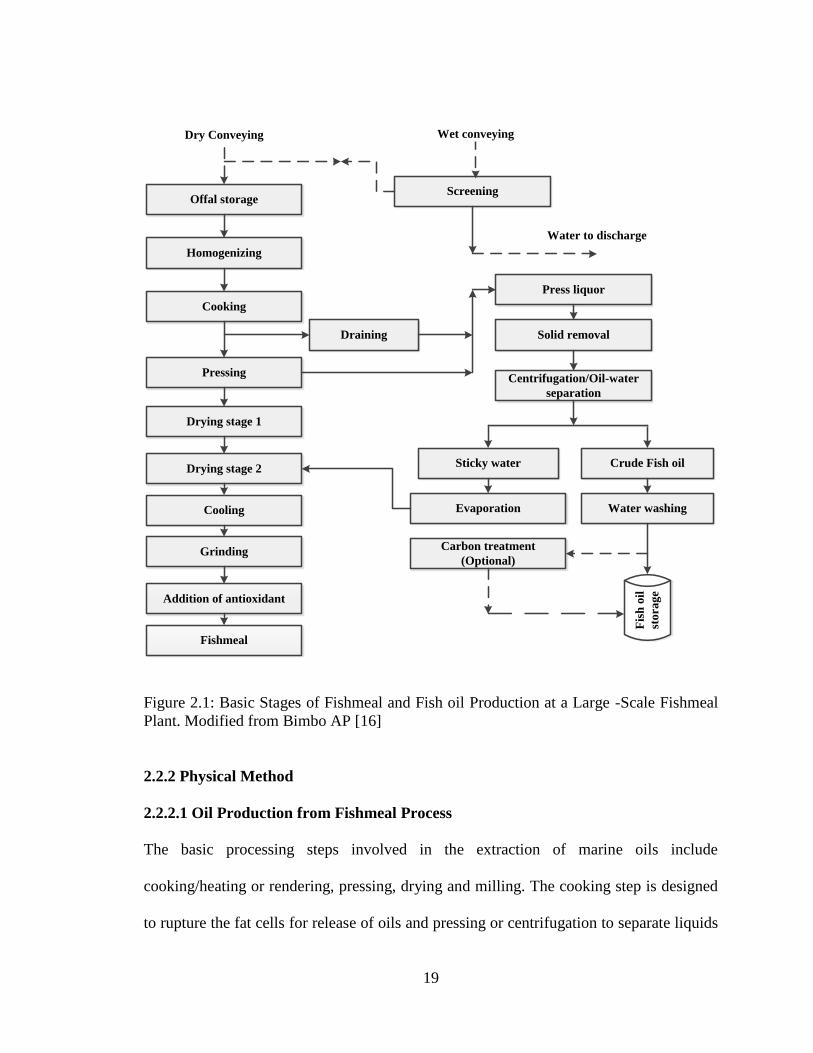
Figure 2.1: Basic Stages of Fishmeal and Fish oil Production at a Large -Scale Fishmeal
Plant. Modified from Bimbo AP [16]
2.2.2 Physical Method
2.2.2.1 Oil Production from Fishmeal Process
The basic processing steps involved in the extraction of marine oils include
cooking/heating or rendering, pressing, drying and milling. The cooking step is designed
to rupture the fat cells for release of oils and pressing or centrifugation to separate liquids

20
(water, soluble protein and oil) from mass (solid cake) [6,21,26-28]. The raw materials,
referred to as ''offal'', are gradually collected in pits/tank until there is a sufficient quantity
for the fishmeal operation. The offal with large pieces is crushed (hashed) by machine
prior to cooking [29]. Cooking coagulates the protein, ruptures the fat deposits and
liberates oil and physico-chemically bound water. The cooking step also prepares
materials for subsequent operations in various processing units. Most conventional
heating methods use a steam cooker with a heated rotary screw, which conveys materials
for continuous heating operation. Fish protein coagulation occurs at about 75 but
cooking is typically in the temperature range of 95 - 100 for duration of (15 - 20)
minutes [28]. Direct and indirect cookers (steam heated jacket, e.g. jacketed kettle) are
also used.
The pressing operation removes as much liquid (''press liquor'') as possible from the solid
(''press cake''). The press cake is dried and milled to produce fishmeal. The pressing stage
is also important for oil yield improvement, and chemicals such as formaldehyde or
calcium chloride are sometimes used in pressing operation. However the addition can
either reduce the oil nutrition value and/or increase residual chloride in the meal
[6,26,28]. Press liquor consists of water, oil and solid particles. Oil content is in direct
proportion to lipid content of the raw materials and separation of the three different
fractions is accomplished through centrifuges. Separation efficiency depends on both
centrifuge design and its mode of operation. Adequate temperature control is also
required for effective centrifugation (about 60 ). The fishmeal and fish oil continues in
separate lines after this process step.

21
Edible oils for human consumption require a refining/polishing step, which may include
degumming, alkali refining, bleaching and deodorization as well as antioxidant addition.
Impurities and other degraded/denaturized materials such as protein, suspended
mucilaginous and colloid-like matters, oxidation products of fatty acids, vitamins, sterols,
hydrocarbons, pigments, phospholipids, mono- and di-acylglycerols, and free fatty acids
are removed from the oil. Polishing is also usually facilitated using hot water to extract
impurities from the oils to ensure stability during storage. Marine oils processing steps
are basically similar to those of vegetable oils; however, vegetable oil is more uniform
with respect to composition than that of marine oils [26,28].
2.2.3 Chemical Methods
2.2.3.1 Solvent Extraction
Solvent extraction is the traditional lipid extraction method. Oils are highly soluble in
organic solvents such as hexane, benzene, cyclohexane, acetone and chloroform. Organic
solvents rupture plant cell walls [30] or disrupt the interaction forces between lipids and
tissue matrix [31] and extract the oil. Factors to be considered in choosing an organic
solvent include preferential solubility of the compound of interest, low boiling point for
easy recovery, economics, toxicity, availability, and re-usability. Hexane is one of the
few solvents with such qualities and used in large scale extraction [30]. There are various
forms of lipids in tissue matrix. The simple lipids exist as part of large aggregates in
storage and are readily extractable. The complex lipids usually exist as a constituent of
membranes in close association with protein and polysaccharides therefore, due to
interaction with these compounds; it is not extracted as easily [31].
22
Lipid solubility depends on the relative strength of interactions between the solvent and
either the hydrophobic or hydrophilic constituents of the molecules. Low polarity lipid
groups such as triacylglycerol (TAG) or cholesterol esters are readily soluble in organic
solvents such as hexane, cyclohexane or toluene and higher polarity solvents like
chloroform or ethers. In contrast, TAG and cholesterol esters tend to be insoluble in polar
solvents such as alcohols (particularly methanol) [31]. Efficient lipid extraction requires
total solvent penetration into lipid storage and matching polarity of the targeted
compounds. It is therefore imperative that the solvents make physical contact with lipids
and as such, mechanical disruption of the cell is required prior to solvent addition through
grinding/homogenization in case of animal tissue.
2.2.3.2 Bligh and Dyer (B&D)
The traditional Bligh and Dyer (B&D) method is considered one of the best for polar
lipid extraction from fish tissue and serves as a benchmark for comparison between other
solvent extraction methods [11,30,31]. The B&D method is an adaptation (in terms of
solvent volumes) of the Folch procedures [31] and procedures for optimum lipid
extraction as reported in the literature [11,31]. The B&D method uses polar and non-
polar solvents (e.g. chloroform, methanol and water) mixtures in specific ratios for total
lipid extraction from muscles such as fish tissue. Norziah et al. [11] reported that the
mixture ratios of chloroform/methanol/water of 4:2:1 and 2:4:1 gave higher total lipid
yield. In a study by Tanamati et al. [32] nine methods were used to extract fat from
ground beef and the authors determined that B&D methods provided the best yields. The
solvents are required to penetrate into the fat cells and extract the lipid from the cell
23
membrane and muscles including the phospholipids materials [11,31]. Drawbacks of this
method include the generation of large quantities of waste solvents in case of large scale
application, making solvent recycling costly and raising safety concerns about handling
organic solvents. Product contamination with the organic solvent has limited this
application in food processing [30] and EU regulations in the use of chlorinated solvent
have increased the cost of solvent disposal. As such, attempts have been made to modify
the B&D method using non-chlorinated solvents but this has proved to be less successful
compared to B&D method which is still widely used [31]. Table 2.3 illustrates different
modifications to B&D method for lipid extraction.

24
Table 2.3: Total, Neutral, and Polar Lipids from High-Fat Beef using different solvent extraction
method (g kg-1
fresh weight of beef) modified from Tanamati et al. [32]
Method Solvents
Total
Lipids TAG Other
Polar
lipids
Folch et al. [56] Chloroform/methanol 208±9 186.8±0.4 15.3±0.4 5.3±0.3
Bligh and Dyer [57] Chloroform/methanol 201±4 181.7±9 13.9±0.3 5.2±0.3
Undeland et al. [58] Chloroform/methanol 197.3±0.2 180±0.3 12.2±0.2 5.1±0.2
Smedes [59] Cyclohexane/propan-2-ol 184±5 167.3±0.2 12.2±0.3 4.2±0.2
Hara and Radin [60] n-Hexane/ propan-2-ol 185.4±0.5 169.3±0.3 11.4±0.4 4.6±0.2
Croon and Wallim
[61]
Hydrochloric acid/diethylether/
petroleum-ether 185±3 166.8±0.3 13.4±0.4 4.8±0.2
Cunniff [62] Ammonia/methanol/
diethylether/ petroleum ether 182.2±0.2 165.1±0.2 12.8±0.1 4.2±0.3
Burton et al. [63] n-Hexane/ethanol/n-heptane 165.4±0.2 151.0±0.2 10.8±0.1 3.6±0.3
Cunniff [62] Petroleum ether 161±7 151.4±0.2 7.1±0.2 2.4±0.2

25
2.2.3.3 Soxhlet Method
The principle is based on solid - liquid extraction (leaching), and has been the standard
method for over a century [33]. Non polar solvents such as hexane, ethyl acetate or
petroleum ether are used for lipid extraction. Extraction is through repeated washing or
percolation of fresh organic solvent under reflux from a distillation flask. Extraction
efficiency for different compound classes is highly dependent on the properties of organic
solvent. This method under normal circumstances effectively determines TAG content
but the extraction of phospholipids is incomplete. The advantages of the conventional
soxhlet method include: sample phase is repeatedly brought into contact with fresh
solvent ensuring complete extraction; heat applied to distillation flask is extended to the
extraction cavity to some extent, hence, keeping the system's temperature relatively high,
filtration of the extract is not required after extraction; and sample throughput can be
increased by performing several parallel extractions simultaneously [31,33,34]. However,
drawbacks include time required for extraction, environmental concerns over the
generation of large amounts of organic wastes, which are costly to dispose of, and this
method is not readily automated [31,33,34].
Furthermore, the method is appropriate for small scale extractions and has not been used
in commercial or industrial scale application. Modifications to this method have focused
on shortening the extraction time, the use of auxiliary forms of energy and automating the
extraction apparatus [33] and include: high pressure soxhlet extraction, microwave-
assited soxhlet extraction, ultrasound-assisted soxhlet extraction, automated soxhlet
extraction, and focused microwave-assisted soxhlet extraction [33,34]. Automated and
26
microwave assisted soxhlet extraction has been applied commercially to environmental
and food applications [33]. Rubio-Rodriguez et al. [25] compares soxhlet extraction to
supercritical CO2 extraction of lipids (Table 2.4). The overall total fatty acid extracted by
supercritical CO2 extraction is higher than that extracted by soxhlet extraction method,
and since large scale application of this process (soxhlet extraction) for high volume of
oil recovery is limited, supercritical CO2 extraction may be a feasible alternative for
biofuel production.
2.2.3.4 Accelerated Solvent Extraction (ASE)
Many organic solvents used for extraction boil at a relatively low temperature. This limits
soxhlet extraction or automated soxhlet extraction, as the maximum temperature would
be the solvent's boiling point. At higher pressures, the higher temperature can be achieved
without boiling off solvent [30]. Accelerated Solvent Extraction (ASE) does not require
the manual steps involved in preparing samples for analysis, has an increased
reproducibility, and accelerates the process significantly. ASE was developed for the
extraction of polychlorinated biphenyls (PCBs) and polycyclic aromatic hydrocarbons
(PAHs) from solids [35]. Compared to other methods, there are fewer reported studies.
However, in the last decade, ASE was used in lipid isolation from plant and animal
tissue, egg-containing foods and dairy products [36]. Dodds et al. [36] also demonstrated
the application of ASE for lipid extraction from fish tissue on a small scale using various
organic solvents for extraction. Although, these studies have established ASE as a viable
lipid recovery method, research and development in large scale recovery and feasibility is
still required. High volume lipid recovery has been rarely reported with this process and

27
therefore, oil quality for biofuel application remains to be pursued. Also, environmental
concern as per high volume of residual solvent will most likely be among the major
constraints.
2.2.3.5 Microwave assisted extraction (MAE)
Microwave assisted extraction (MAE) utilizes microwave energy to heat solvents in
contact with the solid matrix to extract compounds of interest from sample into solvent.
Literature on MAE applied to lipid extractions are limited, but indicate improved lipid
yields and reproducibility; however, this process is still required to be tested on a wide
range of sample matrices [37]. MAE is considered superior to traditional solvent
extraction with advantages of lower temperature, higher extraction rates, automation, and
possibility of simultaneously extracting different types of samples [38].
MAE is based on the principle that the microwave heating system is very selective, and
loses very little heat to the surroundings. The direct heating affects polar solvents and/or
materials, so when used on samples, the moisture content of cells is reduced. This results
in the generation of a significant amount of pressure which ruptures tissue cell
membranes (animal cell) or walls (plant cell) releasing the cellular material [30]. A
laboratory scale study by Ramalhsa et al. [37] for fish fat extraction extracted total lipid
content similar to or higher than that of traditional extraction methods with
reproducibility.
Ultrasonic-assisted solvent extraction has also been used for accelerated extraction of
phenolic compounds from plant matrices. This process is considered effective compared
to other conventional extraction methods as it allows cell disruption to permit phenolic

28
molecule interactions with solvents at a reasonably low temperature [39]. Since the
microwave heat energy directly affects and reduces the polar and/or water content of fat
cells, the overall effect on oil recovery might be a lower water content which would favor
biofuel applications.
2.2.3.6 Acid-Alkali-aided Extraction
Fish protein isolate and fish oil are produced when using alkali or acid to digest the
muscle protein. This method was suggested as a replacement for the surimi process (fish-
paste making process) but it is now used for protein recovery from fish by-products. If
the oil content of the fish residue is high, fish oil would also be produced [16]. The acid
digestion method involves hydrolysis of muscle sample to release complex and/or bound
fatty materials, thereby permitting total fat extraction using appropriate solvents [31]. As
described by Xiao [31], the sample is hydrolyzed, fat is extracted using diethyl and
petroleum ether solvents, the solvent is evaporated off, followed by the methylation of
extracted fats. The drawback of this method is that non-lipid compounds are extracted
along with lipids, leading to over-estimation of total fat in food samples. Acid hydrolysis
is also considered an extremely aggressive method, which produce chemically degraded
extracts unsuitable for fatty acid profiling [31]. This method might not be suitable for oil
extraction for biofuel purposes as non-lipid compounds are extracted along with lipids.
The implication on biofuel applications might be poor flow and combustion properties
coupled with an increased knocking tendency while used in combustion engines.

29
2.2.3.7 Supercritical Fluid Extraction (SCFE)
Supercritical fluid extraction (SCFE) has been used to extract high-value products from
plant tissue (e.g. micro algae) [13,30], and from animal tissue (e.g. fish by-products)
[12,14,15,25,40]. SCFE also offers the benefits of being free of potentially toxic solvents,
faster extraction and separation, and a safe/low thermal process for thermal sensitive
products [30]. At supercritical conditions, fluids have gas-like viscosities and liquid-like
densities, enhancing the solvation and flow properties [30]. SCFE also has the advantage
of process flexibility due to the ability to modify solvent power or selectivity of the
supercritical fluid. Several compounds have been studied for SCFE application such as
carbon dioxide, hexane, pentane, butane, nitrous oxide, sulphur-hexafloride and
florinated hydrocarbons [23].
Carbon dioxide (CO2) is the most popular SCFE solvent as it is: readily available at low
cost, low toxicity, non-flammable, high diffusivity with tune-able solvent power, and
offers a potential use of greenhouse gas. In addition, CO2 is a gas at ambient conditions
making it very simple to separate solvent from the solute. CO2 also has mild critical
conditions (Tc = 303.9 K, Pc = 7.38 MPa) relative to other solvents [12,13,23-25,41].
Four major factors controlling supercritical CO2 extraction (SC-CO2) are pressure,
temperature, CO2 flow rate, and extraction time [30]. Esquivel et al. [42] extracted
Sardine oil at 12.6 MPa and 18 MPa, and 313 K and 321 K using SC-CO2. The rate of
sardine extraction was sensitive to temperature and pressure, and the sardine oil loading
in CO2 increased with increasing pressure and decreased with increasing temperature.
30
In general, the main limitation of supercritical CO2 extraction is its low polarity.
Supercritical CO2 is a good solvent for non-polar (lipophilic) compounds; hence, it has
low affinity for polar compounds. Heavy metal extraction along with oil is also
reportedly almost impossible [12]. This property is beneficial for using oil product in
biofuel application. In order to extend the solvent polarity, employing polar modifiers
(co-solvents) to change the solvent polarity and to increase its solvation power towards
the compound of interest has been suggested. The addition of a relatively small
percentage of alcohol, e.g. (mass fraction of 1 % - 10 %) methanol to carbon dioxide, has
reportedly expanded the solvents extraction range to include more polar analytes
[14,23,24]. The addition of ethanol to supercritical CO2 (mass fraction of 10 % - 15 %)
has also been reported by Mercer and Armenta [30] to increase its polarity and to change
its viscosity. The resulting effect is an increase in solvating power of CO2, and the
extraction requires low temperature and pressure. Catchpole et al. [43] determined that
fish oil solubility increased exponentially with the addition of a mass fraction of 12 % of
ethanol to CO2 leading to better recovery as compared to pure CO2 at the same
temperature and pressure. In this regard, more polar lipids would have been extracted
along with the oil.
In the context of using the raw extracted oil as biofuel or blend of oil, the presence of
polar lipids such as phospholipids and glycolipids could decrease the oil quality and/or
flow properties, hence, addition of co-solvents may not be desired. In addition, the co-
solvent is liquid at room temperature and atmospheric pressure and would be extracted
31
along with compound of interest; therefore, subsequent processing for solvent removal
will be required [23].
Supercritical CO2 extraction is sensitive to the water bound in the sample matrix. The
water in a sample matrix reduces contact time between solvent and solute. The moisture
acts as a barrier against CO2 diffusion into the sample, and the diffusion of lipids out of
the cells, hence, freeze drying of the sample is required prior to SCFE [30]. Dunford et al.
[14] investigated the effect of water presence in the sample on extraction of Atlantic
mackerel oil using supercritical CO2. Feedstock with a mass fraction of 10.2 % water
content treated with SC-CO2 resulted in higher oil yields (2.7 g) compared to those with a
mass fraction of 26.0 % and 64.0 % water content with 2.5 g and 0.3 g yields
respectively. Given that fish processing by-products will contain high water levels this
will impact the recovery of the oil and therefore pretreatment process may be required.
SCFE has been widely used in food and natural products extraction, for process
development, and to extract targeted (bioactive or valuable) compounds from different
matrices [12,14,15,24,25]. There is little data on the feasibility of the industrial scale
application of the SCFE process. Sahena et al. [15] (Table 3) compares fatty acid profiles
of fish oil extracted using SC-CO2 with different modifications and soxhlet extraction.
The variation of fatty acid profiles with regards to different extraction process can be
deduced therein. Due to the high selectivity SC-CO2 extraction preferentially extracting
more saturated fatty acids (a mass fraction of 21.09 %) compared to the modified SC-
CO2 and soxhlet extraction processes (extracted a mass fraction of between 18.20 % and
32
18.87 %). In contrast, the modified SC-CO2 and soxhlet extraction processes extract more
polyunsaturated fatty acids (a mass fraction of between 59.59 % and 60.53 %) than the
SC-CO2 extraction (extracted a mass fraction of 56.32 %). High content of
polyunsaturated fatty acid species could be advantageous to thermal and cold flow
properties of fuel oil, as oil with a high degree of unsaturated fatty acid has a low melting
point compared to oil with higher degree of saturated fatty acid which melts at a higher
temperature [44,45]. The disadvantage of having more polyunsaturated fatty acids in fuel
oils is the increased rate of oxidation when compared to the saturated species. Lin and Li
[46] reported that biodiesel with polyunsaturated fatty acids with double bonds of more
than three are susceptible to deterioration, thus causing precipitation in the combustion
chamber of the combustion engine.
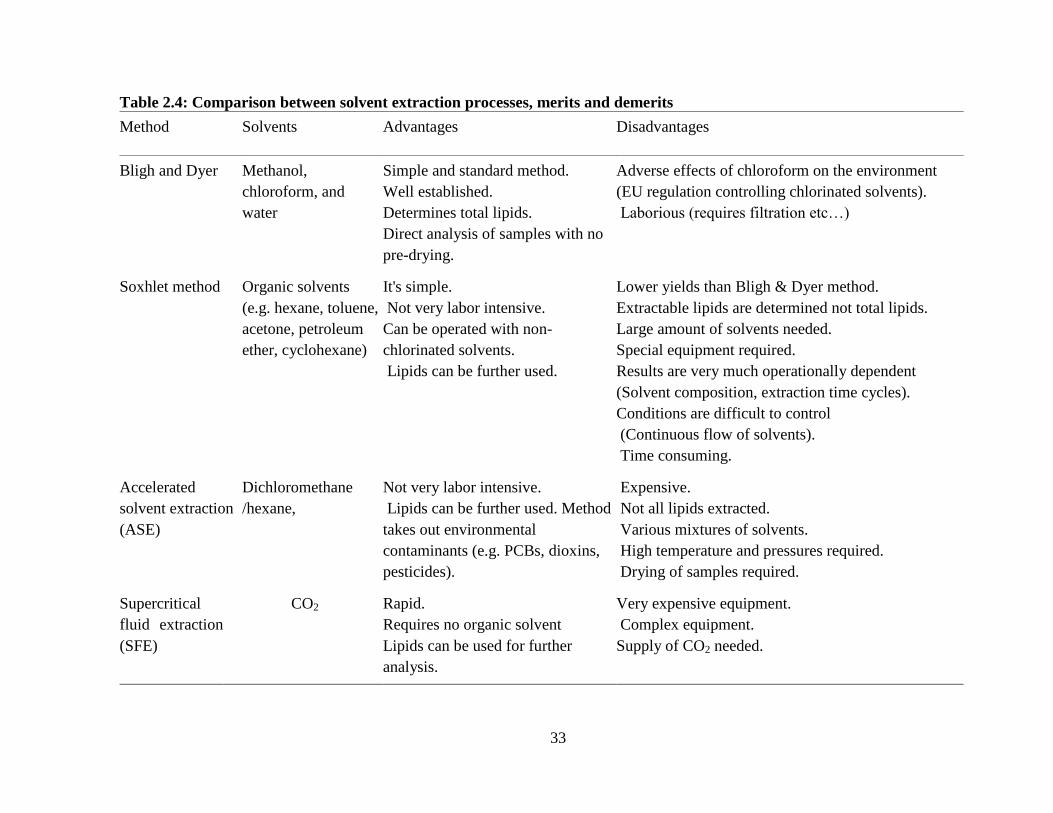
SC-CO2 is highly selective towards non-polar compounds, therefore, heavy metal
extraction (e.g Cd, Hg, Pb and As) along with fish oil will be negligible compared to
other processes. This fact is corroborated by Rubio-Rodriguez et al. [12]. Table 2.4
summarizes the advantages and disadvantages of various solvent extraction methods.
Selection of any of the processes will be based on cost consideration, environmental
impact, and analyte selectivity.
33
Table 2.4: Comparison between solvent extraction processes, merits and demerits
Method Solvents Advantages Disadvantages
Bligh and Dyer Methanol,
chloroform, and
water
Simple and standard method.
Well established.
Determines total lipids.
Direct analysis of samples with no
pre-drying.
Adverse effects of chloroform on the environment
(EU regulation controlling chlorinated solvents).
Laborious (requires filtration etc…)
Soxhlet method Organic solvents
(e.g. hexane, toluene,
acetone, petroleum
ether, cyclohexane)
It's simple.
Not very labor intensive.
Can be operated with non-
chlorinated solvents.
Lipids can be further used.
Lower yields than Bligh & Dyer method.
Extractable lipids are determined not total lipids.
Large amount of solvents needed.
Special equipment required.
Results are very much operationally dependent
(Solvent composition, extraction time cycles).
Conditions are difficult to control
(Continuous flow of solvents).
Time consuming.
Accelerated
solvent extraction
(ASE)
Dichloromethane
/hexane,
Not very labor intensive.
Lipids can be further used. Method
takes out environmental
contaminants (e.g. PCBs, dioxins,
pesticides).
Expensive.
Not all lipids extracted.
Various mixtures of solvents.
High temperature and pressures required.
Drying of samples required.
Supercritical
fluid extraction
(SFE)
CO2 Rapid.
Requires no organic solvent
Lipids can be used for further
analysis.
Very expensive equipment.
Complex equipment.
Supply of CO2 needed.
34
2.2.3.8 Membrane coupled SC-CO2 extraction.
Sarrade et al. [47] attempted coupling an SC-CO2 extraction process with a membrane
system (nanofiltration) for separation of CO2 from the resulting mixture. In 1998, the
authors [48] coupled nanofiltration tubular membranes resistant enough to endure the
supercritical conditions. The goal of coupled process is to extract triglycerides directly
from fish oil. The process further separated the product into two parts: the short-chained
(lowest molecular weight) triglycerides as permeate and the long chained (heaviest
molecular weight) triglycerides as the retentate i.e. EPA and DHA. A modification of this
process was proposed in 2002 to enhance the extraction process in lowering the energy
required for CO2 recycling and to purify the low molecular weight compounds [49].
Considering the fact that resulting products from this innovation are of high level of
purity and separation, its application would be required in areas where high purity
products and high level of separation is required, such as food processing, biotechnology,
cosmetic and pharmaceutical industries. Hence, for the purpose of biofuel application
where fractionation of triglycerides is not required, this process might not be useful.
2.2.4 Biological Processes
2.2.4.1 Hydrolysis
Fish protein concentrate is produced in the fish processing industry using enzymatic
hydrolysis (Figure 2.2). Silage is the autolysate or fish digest recovered using internal
enzymes (enzymes from fish viscera) and acid for stability. This process is referred to as
autolysis. If exogenous enzymes are used (enzymes from other sources) the process is
35
called hydrolysis. Acid addition inhibits and destroys the bacteria enabling internal (fish)
enzymes to digest the fish muscle [16,50]. Hydrolysis can also be carried out chemically
under alkaline or acidic conditions. Raw materials with low lipid content result in a
process where no oil is produced as by-products [50], whereas, lipid-protein emulsions
can be formed with high lipid content feedstock and thus reduce the oil yield [6] and
quality. Generally, autolysis of fish muscle is usually performed to produce fish silage.
The process forms an aqueous solution rich in small peptides and amino acids, and the
enzymes promote the release of oil [22]. The disadvantage of autolysis is time
consumption, which reduces hydrolysates quality and it is difficult to control the process
since internal digestive enzymes are required [6,22,51].
The use of exogenous enzymes (enzymes from other sources) makes hydrolysis process
highly controllable with reduced residence time [22,51]. Enzymes can be sourced from
either animal, vegetable or microbial to accelerate the breakdown of proteins into smaller
units (peptides) [16,52]. Enzymatic hydrolysis using commercial low cost and food grade
protease provides an attractive alternative as the process is carried out under mild
conditions for short period of time. Commercial protease has been used to produce oil
from marine by-products, resulting in improved yields as compared to yields achieved
from cooking processes [4]. However, product deteriorates due to favorable conditions
for hydrolysis of free fatty acid (FFA) and oil-water emulsion resulting in high FFA
content which might not be suitable for biofuel application.
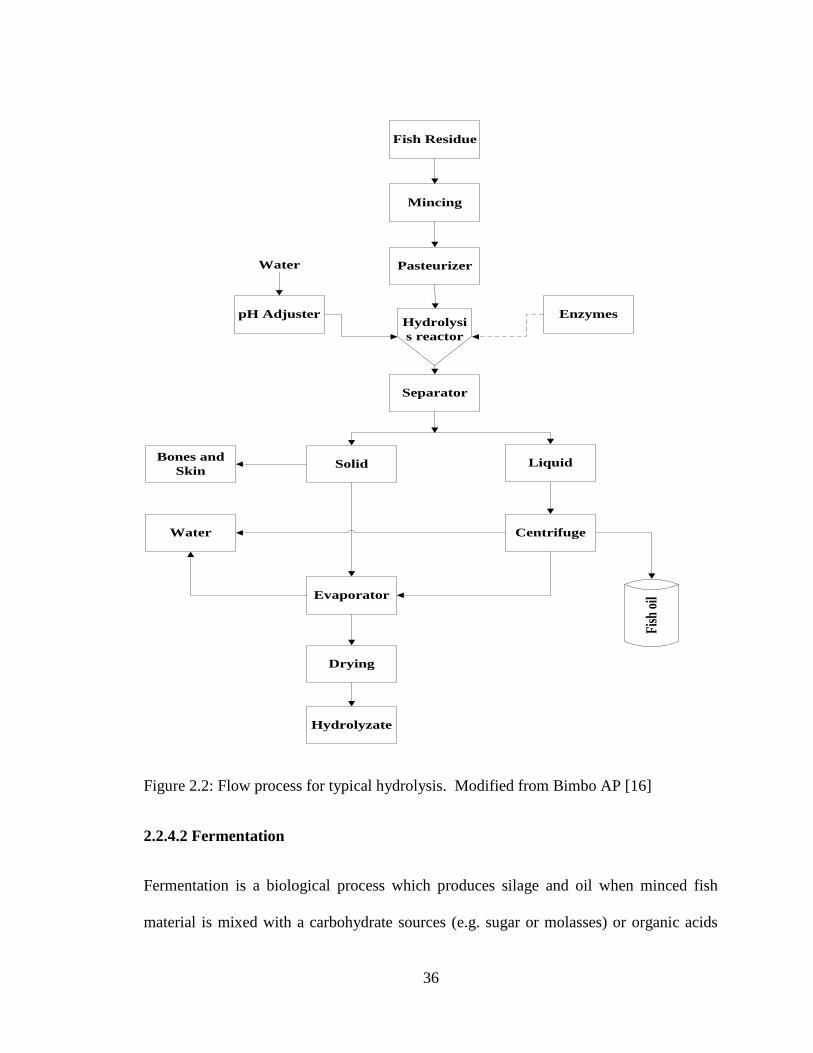
36
Fish Residue
Mincing
Pasteurizer
EnzymespH Adjuster
Separator
Solid Liquid
CentrifugeWater
Bones and
Skin
Evaporator
Drying
Hydrolyzate
Fis
h oi
l
Water
Hydrolysi
s reactor
Figure 2.2: Flow process for typical hydrolysis. Modified from Bimbo AP [16]
2.2.4.2 Fermentation
Fermentation is a biological process which produces silage and oil when minced fish
material is mixed with a carbohydrate sources (e.g. sugar or molasses) or organic acids
37
(e.g. lactic acid) and bacteria [6,50]. Biological fish ensilage has been shown to have a
good nutritional value relative to acid fish silage [53]. Biological ensilage is preferable;
especially in tropical regions due to adequate supply of carbohydrate sources and low
cost [53]. The success of the fermentation process depends on lactic acid generated by
micro-organisms, which must be sufficient enough to lower the process pH to around 4.5
[6,53], and remain stable during storage to prevent growth of bacteria [53]. The lipid
oxidation of oil produced during fermentation was studied by de Lurdes et al. [53] and it
was determined that oils obtained from silage with added formaldehydes had a
substantially higher peroxide value than oils from biological silage. Figure 2.3 is an
outline of a typical biological fermentation process. Oil released from the fish materials
during fermentation is separated by centrifugation [6]. Oil with high levels of
polyunsaturated fatty acids (PUFA) makes the silage prone to oxidation, rendering the
feed unpalatable and/or unsafe for livestock. Fermentation using lactic acid has beneficial
effects on lipids in fish silage as it stabilizes the oil and improves quality for animal feed
[53] Fermentation is a promising recovery process due to its possible energy saving, low
cost and recovery of better nutritional value products.

38
Mincing
Fermenta
tion tank
Fish/Fish
Residue
WaterStarter Culture/
Lactic Acid Starter
Pasteurization
Water
Solid
Bone, Skin, and
Coarse solid
Liquid
EvaporationCrude
SilageCentrifuge
Drying
Silage
Concentrate
Sieving
Fis
h O
il
Figure 2.3: Flow process for typical fermentation. Modified from Bimbo AP [16]
39
2.3.0 Summary and conclusions.
The recovery of oil from fish by-product for use as a fuel can be a sustainable cost
effective strategy for conventional combustors, boiler engines, or in-house use. The oil
product does not need to meet high purity standards associated with edible oils but must
balance fuel quality with costs, process complexity and be robust enough to handle
different types and quality of fish residue. This review focuses on various extraction
processes for lipid/oil from fish residues which could be used for bio-fuel application.
The fishmeal and physical processes are typically used to produce fishmeal with crude
fish oil as a by-product. The quality of oil by-product from these processes can be good
enough for biofuel application, for instance, fuel oil for convectional combustors or diesel
engines that use low quality fuels (e.g boilers and furnaces). The oil may also require
subsequent refining steps in order to make it edible. However, the intensity of the process
with respect to temperature (prolonged or repeated heating or cooking period) can
degrade oil quality. High energy input required for cooking, pressing and centrifugation
may lead to high production costs for this process.
The chemical processes result in high yields of total lipid. However, solvent extraction
systems may also extract non lipid material which can negatively impact oil quality. The
commercial scale application of these processes can be problematic due to large volumes
of residual solvent, and degraded product quality due to toxic solvent. The majority of
solvent extraction processes (for example B&D, Soxhlet, MAE, and ASE processes) were

40
developed for lipid analysis and therefore impractical for extraction of fuel grade quality
oils.
SC-CO2, although limited in large scale application, can reduce the environmental
impacts and safety issues involved in conventional solvent extraction processes.
Theoretically, it can achieve a high quality product recovery as the process would
produce a high quality fuel oil with minimal impurities; however, the viability of large
scale production is limited. The costs and infrastructure associated with the required high
pressures and pre-treatment (drying) have not been assessed. The quality of oil recovered
by SC-CO2 for use as a stand-alone low grade fuel oil and/or blends of bio-fuel for
combustion engine applications is an area requiring further investigation.
Biological processes are used on a larger scale for protein concentrate and can lead to
high volume oil production. The processes are environmentally friendly and safe; they
require low temperature and/or low or reduced energy input. However the product
deteriorate due to long residence times, and favorable conditions for hydrolysis of FFA
and oil-water emulsion therefore further downstream processing is also required. Costly
enzymes and limited process control are among other factors that hinders its application.
Acknowledgements
The authors would like to acknowledge the funding provided by the Government of
Newfoundland and Labradors (Green Fund) and, NSERC (Natural Science and
Engineering Research Council of Canada).
41
References
[1] Belarbi EH, Molina E, Chisti Y. A process for high yield and scaleable recovery of
high purity eicosapentaenoic acid esters from microalgae and fish oil. Enzyme Microb
Tech 2000; 26(7):516-29.
[2] Zuta C, Simpson B, Chan H, Phillips L. Concentrating PUFA from mackerel
processing waste. J Am Oil Chem Soc 2003; 80(9):933-36.
[3] Boran G. Seasonal Changes in Proximate Composition of Some Fish Species from the
Black Sea. Turk J Fish Aquat Sci 2011;11(1):1-5.
[4] Mbatia B, Adlercreutz D, Adlercreutz P, Mahadhy A, Mulaa F, Mattiasson B.
Enzymatic oil extraction and positional analysis of omega-3 fatty acids in Nile perch and
salmon heads. Process Biochem 2010; 45(5):815-9
[5] Boyd M, Murray-Hill A, Schaddelee K. Biodiesel in British Columbia Feasibility
Study Report. WISE Energy Co-op / Eco- Literacy Canada. 2004 April. 126 p.
[6] Jayasinghe P, Hawboldt K. A review of bio-oils from waste biomass: Focus on fish
processing waste. Renew Sust Energ Rev 2012 ;16(1):798-821.
[7] Ushakov S, Valland H, Æsøy V. Combustion and emissions characteristics of fish oil
fuel in a heavy-duty diesel engine. Energ Convers Manage 2013 ; 65(0):228-38.
[8] Yin H, Solval K, Huang J, Bechtel P, Sathivel S. Effects of Oil Extraction Methods
on Physical and Chemical Properties of Red Salmon Oils (Oncorhynchus nerka). J Am
Oil Chem Soc 2011;88(10):1641- 48.
[9] Preto F, Zhang F, Wang J. A study on using fish oil as an alternative fuel for
conventional combustors. Fuel 2008 ;87(10–11):2258- 68.

42
[10] Kalligeros S, Zannikos F, Stournas S, Lois E, Anastopoulos G, Teas C, et al. An
investigation of using biodiesel/marine diesel blends on the performance of a stationary
diesel engine. Biomass Bioenerg 2003 ;24(2):141- 49.
[11] Norziah MH, Nuraini J, Lee K.Y. Studies on the Extraction and Characterization of
Fish Oil From Wastes of Seafood Processing Industry. Asian J Food Agro-Indust
2009;2(04):959-73.
[12] Rubio-Rodríguez N. Supercritical fluid extraction of fish oil from fish by-products:
A comparison with other extraction methods. J Food Eng 2012 ;109(2):238 - 48.
[13] Cheng C, Du T, Pi H, Jang S, Lin Y, Lee H. Comparative study of lipid extraction
from microalgae by organic solvent and supercritical CO2. Bioresource Technol
2011;102(21):10151-53.
[14] Dunford NT, Temelli F, Leblanc E. Supercritical CO2 Extraction of Oil and
Residual Proteins from Atlantic Mackerel (Scomber scombrus) as Affected by Moisture
Content. J Food Sci 1997;62(2):289-94.
[15] Sahena F, Zaidul ISM, Jinap S, Jahurul MHA, Khatib A, Norulaini NAN. Extraction
of fish oil from the skin of Indian mackerel using supercritical fluids. J Food Eng 2010
7;99(1):63- 9.
[16] Bimbo AP. Marine Oils [monograph on the Internet]. Urbana (IL): AOCS [date
unknown] - AOCS Lipid Library, Edible Oil Processing, Production of animal oils and
fats, 1.1.1 Marine Oils [updated 2011 May 19; cited 2013 Sep 12]; Available from
http//:lipidlibrary.aocs.org/index.

43
[17] Tuominen T, Esmark M. Food For Thought: The Use of Marine Resources in Fish
Feed. WWF- Norway. Norwegian Industrial and Regional Development Funds (SND).
2003 Feb. 53 p.
[18] Civit EM, Parín MA, Lupín HM. Recovery of protein and oil from fishery
bloodwater waste: Effect of pH and temperature. Water Resour 1982;16(6):809-14.
[19] Rai AK, Swapna HC, Bhaskar N, Baskaran V. Potential Of Seafood Industry
Byproducts As Sources Of Recoverable Lipids: Fatty Acid Composition Of Meat And
Nonmeat Component Of Selected Indian Marine Fishes. J Food Biochem
2012;36(4):441- 8.
[20] Batista I. Recovery of proteins from fish waste products by alkaline extraction. Eur
Food Res Technol 1999;210(2):84-9.
[21] Tacon GJ, Hasan MR, Subasinghe RP. Use of Fishery Resources as Feed Inputs to
Aquaculture Development: Trends and Policy Implications. Food and Agriculture
Organization of the United Nations (FAO): Rome; 2006. 99 p.
[22] Mbatia BN. Valorisation of Fish Waste Biomass through Recovery of Nutrition
Lipids and Biogas.[Doctoral Thesis]. [Lund]: Lund University, Sweden; 2011.
[23] Reverchon E, De Marco I. Supercritical fluid extraction and fractionation of natural
matter. J Supercrit Fluid 2006 ;38(2):146-66.
[24] Herrero M, Mendiola JA, Cifuentes A, Ibáñez E. Supercritical fluid extraction:
Recent advances and applications. J Chromatogr A 2010;1217(16):2495- 511.
[25] Rubio-Rodríguez N, de Diego SM, Beltrán S, Jaime I, Sanz MT, Rovira J.
Supercritical fluid extraction of the omega-3 rich oil contained in hake (Merluccius
44
capensis–Merluccius paradoxus) by-products: Study of the influence of process
parameters on the extraction yield and oil quality. J Supercrit Fluid 2008 ;47(2):215-26.
[26] Shahidi F. Bailey's Industrial Oil and Fat Products. 6th ed. New Jersey: John Wiley
and Sons Inc; 2005.
[27] Bimbo AP. Rendering. In: Shahidi F, editor. Bailey's Industrial Oil and Fat Products.
Volume 6 (6th ed.) New Jersey: John Wiley and Sons Inc; 2005. P. 57-102.
[28] Aursand M, Mozuraityte R, Hamre K, Knutsen H, Maage A, Arukwe A. Description
of the Processes in the Value Chain and Risk Assessment of Decomposition Substances
and Oxidation Products in Fish Oils. Norway: Norwegian Scientific Committee for Food
safety (VKM). 2011 Oct. 147 p.
[29] Grant MT, Corkum J, Morry C. Management Of Wastes From Atlantic Seafood
Processing Operations. Dartmouth: AMEC Earth & Environmental Limited TE23016.
2003Dec. 135 p.
[30] Mercer P, Armenta RE. Developments in oil extraction from microalgae. Eur J lipid
Sci Tech 2011;113(5) 539- 47.
[31] Xiao L. Evaluation of Extraction Methods for Recovery of Fatty Acids from Marine
Products. [Masters Thesis]. [Bjørn Grung]: University of Bergen. 2010.
[32] Tanamati A, Oliveira C, Visentainer J, Matsushita M, Souza N. Comparative study
of total lipids in beef using chlorinated solvent and low-toxicity solvent methods. J Am
Oil Chem Soc 2005;82(6):393-7.
[33] Luque de Castro MD, Priego-Capote F. Soxhlet extraction: Past and present
panacea. J Chromatogr A 2010;1217(16):2383-9.
45
[34] Luque-Garcia JL, Luque de Castro MD. Focused microwave-assisted Soxhlet
extraction: devices and applications. Talanta 2004;64(3):571-7.
[35] Macnaughton SJ, Jenkins TL, Wimpee MH, Cormiér MR, White DC. Rapid
extraction of lipid biomarkers from pure culture and environmental samples using
pressurized accelerated hot solvent extraction. J Microbiol Meth 1997;31(1–2):19-27.
[36] Dodds E, McCoy M, Geldenhuys A, Rea L, Kennish J. Microscale recovery of total
lipids from fish tissue by accelerated solvent extraction. J Am Oil Chem Soc
2004;81(9):835-40.
[37] Ramalhosa MJ. Lipid content of frozen fish: Comparison of different extraction
methods and variability during freezing storage. Food Chem 2012;131(1):328-36.
[38] Wang P, Zhang Q, Wang Y, Wang T, Li X, Ding L, et al. Evaluation of Soxhlet
extraction, accelerated solvent extraction and microwave-assisted extraction for the
determination of polychlorinated biphenyls and polybrominated diphenyl ethers in soil
and fish samples. Anal Chim Acta 2010;663(1):43-8.
[39] Vasantha Rupasinghe HP, Kathirvel P, Huber GM. Ultra-sonication-assisted solvent
extraction of quercetin glycosides from 'Idared' apple peels. Molecules
2011;16(12):9783-91.
[40] Hardardottir I, Kinsella JE. Extraction of Lipid and Cholesterol from Fish Muscle
with Supercritical Fluids. J Food Sci 1988;53(6):1656-8.
[41] Yeddes N, Cherif JK, Jrad A, Barth D, Trabelsi-Ayadi M. Supercritical SC-CO2 and
Soxhlet n-Hexane Extract of Tunisian Opuntia ficus indica Seeds and Fatty Acids
Analysis. J Lipids 2012: 1-6.
46
[42] Esquível MM, Bandarra NM, Fontan I, Bernardo-Gil MG, Batista I, Nunes ML, et
al. Supercritical Carbon Dioxide Extraction of Sardine Sardina pilchardus Oil . Lebensm
Wiss Technol, 1997 ; 30,(7): 715-20.
[43] Catchpole OJ, Grey JB, Noermark KA. Fractionation of fish oils using supercritical
CO2 and CO2+ethanol mixtures. J Supercrit Fluid 2000;19(1):25-37.
[44] Huang J, Sathivel S. Purifying salmon oil using adsorption, neutralization, and a
combined neutralization and adsorption process. J Food Eng 2010 ;96(1):51-8.
[45] Sathivel S. Thermal and flow properties of oils from salmon heads. J Am Oil Chem
Soc 2005;82(2):147-52.
[46] Lin C, Li R. Fuel properties of biodiesel produced from the crude fish oil from the
soapstock of marine fish. Fuel Process Technol 2009 ;90(1):130-6.
[47] Sarrade S, Rios GM, Carlés M. Nanofiltration membrane behavior in a supercritical
medium. J Membrane Sci 1996;114(1):81-91.
[48] Sarrade SJ. Supercritical CO2 extraction coupled with nanofiltration
separationApplications to natural products. Sep Purif Technol 1998;14(1-3):19-25.
[49] Sarrade S, Guizard C, Rios GM. Membrane technology and supercritical fluids:
chemical engineering for coupled processes. Desalination 2002;144(1–3):137-42.
[50] Bimbo AP. Alaska Seafood By-products: Potential Products, Markets and
Competing Products. Anchorage (AK): Alaska Fisheries Development Foundation. 2009
Jan. 227 p.
47
[51] Hathwar S, Bijinu B, Rai A, Narayan B. Simultaneous Recovery of Lipids and
Proteins by Enzymatic Hydrolysis of Fish Industry Waste Using Different Commercial
Proteases. Appl Biochem Biotech 2011;164(1):115-24.
[52] Ovissipour M, Taghiof M, Motamedzadegan A, Rasco B, Molla AE. Optimization
of enzymatic hydrolysis of visceral waste proteins of beluga sturgeon Huso huso using
Alcalase. Int Aquat Res 2009;1:31 - 8.
[53] de Lurdes M, Dapkevičius E, Batista I, Nout MJR, Rombouts FM, Houben JH. Lipid
and protein changes during the ensilage of blue whiting (Micromesistius poutassou
Risso) by acid and biological methods. Food Chem 1998 ;63(1):97-102.
[54] Hassan B. Fermentation of Fish Silage Using Lactobacillus pentosus. J Natur
Indonesia 2003;6(1):11 - 15.
[55] Fisheries and Aquaculture Department: Online Query Panels [Internet]. [Place
unknown]: Food and Agriculture Organization of the United Nations; c2013 - [cited 2013
Sep 12]. Available from: http://www.fao.org/fishery/topic/16140/en.
[56] Folch J, Lees M, Stanley SGH. A Simple Method for the Isolation and Purification
of Total Lipids from Animal Tissues. J Biol Chem 1957; 226(1):497–509
[57] Bligh EG, Dyer WJ, A Rapid Method of Total Lipid Extraction and Purification.
Can J Biochem Phys 1959; 37(8):911-7.
[58] Undeland I, Harrod M, Lingnert H. Comparison between Methods Using Low-
Toxicity Solvents for the Extraction of Lipids from Herring (Clupea harengus). Food
Chem 1998; 61(3):355–65.

48
[59] Smedes F. Determination of Total Lipid Using Non-chlorinated Solvents. Analyst
1999; 124(11):1711–8.
[60] Hara AC, Radin NS. Lipid Extractions of Tissues with a Low-Toxicity Solvent. Anal
Biochem 1978; 90(1):420–6.
[61] Croon LB, Wallim HC. Determination of Total Fat in Meat and Meat Products by
Solvent Extraction after Hydrochloric Acid Hydrolysis—NMKL Inter-laboratory Study. J
AOAC Int 1992; 75(6):1011–5.
[62] Cunniff PA. Official Methods of Analysis of the Association of Official Analytical
Chemists. 16th ed. Arlington: AOAC. 1998.
[63] Burton GW, Webb A, Ingold KU. A Mild, Rapid and Efficient Method of Lipid
Extraction for Use in Determining Vitamin E/Lipid Ratios. Lipids 1985; 20(1):29–39.
49
CHAPTER 3
THERMAL AND FLOW PROPERTIES OF FISH OIL BLENDS
WITH BUNKER FUEL OIL
Ibraheem A. Adeotia*, Kelly Hawboldt
a, Marina R. Santos
b.
a. Department of Process Engineering, Faculty of Engineering and Applied Sciences,
Memorial University of Newfoundland St.John’s, NL A1B 3X5, Canada.
b. Universidade Estadual de Mato Grosso do Sul, Cidade Universitária de Dourados -
MS - 351 - CEP: 79804-970, Brazil.

50
Abstract
The thermal, flow, and heating properties of unrefined fish oils (anchovy-sardine oil
derived from fish processing waste, and unrefined salmon oil derived from salmon
discards) blended with bunker ‘A’ oil (a common heating oil) were investigated. The
rheological properties of the blends were examined and modeled using an Arrhenius
equation approach. The onset of thermal degradation of waste fish oil, salmon oil and
bunker ‘A’ oil were 187 , 229 and 75 respectively and complete decomposition
of the oils occurred between 500 and 550 The flow behavior index of the oil/blend
samples was less than one, which indicated that the fish oil/blend exhibited non-
Newtonian fluid behavior. More so, all samples showed decreasing viscosity with
increasing shear rate indicating that the samples and their blends exhibited a shear-
thinning non-Newtonian behavior. The average heating value of anchovy-sardine oil,
unrefined salmon oil and bunker fuel oil were 38.69, 39.51 and 43.36 MJkg-1
respectively. The energy barrier to flow and viscosity of the blends decreased with
increasing quantity of fish oils in fish-bunker mixture.
This paper has been published in the Fuel journal. Ibraheem Adeoti is the lead author and
the co-authors are Marina Santos and Dr. Kelly Hawboldt. Mr. Adeoti's contributions to
this paper include the following:
Wrote the paper
Lead in performing all the laboratory testing and analyses (except where noted)
51
Conducted all data processing and interpretation of results
Performed all literature searches required for background information
Ms. Marina Santos helped during laboratory experiment and testing such as TGA
analysis, DCS analysis, Extraction of fish oil, blending of the oil with petroleum fraction
and flash point testing of the oil and blends. Dr. Hawboldt provided technical guidance
and editing of the manuscript.

52
Nomenclature
A frequency factor (Pa.s)
B100 100% biodiesel
CO carbon monoxide emission
DHA docosahexaenoic acid
DSC differential scanning calorimeter
Ea activation energy (kJ mol-1
)
EPA eicosapentaenoic acid
GHG Greenhouse gas
HHV higher heating values (MJ/kg)
K consistency index (Pa.sn)
k reaction rate constant
MUFA monounsaturated
n flow behavior index (dimensionless unit)
OCN ocean nutrition Canada
PUFA polyunsaturated fatty acid
R gas constant (8.314 J mol-1
K-1
)
RFO residual fuel oil (bunker fuel oil)
SB20 20% (v/v) unrefined salmon oil in 80% (v/v) bunker fuel oil
SB50 50% (v/v) unrefined salmon oil in 50% (v/v) bunker fuel oil
SB80 80% (v/v) unrefined salmon oil in 20% (v/v) bunker fuel oil

53
SFA saturated fatty acid
SSE sum of square errors
T temperature (K)
TGA thermogravimetric analysis
WB20 20% (v/v) waste fish oil in 80% (v/v) bunker fuel oil
WB50 50% (v/v) waste fish oil in 50% (v/v) bunker fuel oil
WB80 80% (v/v) waste fish oil in 20% (v/v) bunker fuel oil
H enthalpy (kJ/kg)
Shear stress (Pa.s)
Shear rate (s-1
)
ω-3 omega -3
54
3.1 Introduction
Fish processing facilities generate a significant amount of fish by-products that could be
source of energy, food, or industrial chemicals. While fish oil is a natural source of
omega-3 polyunsaturated fatty acids (mostly eicosapentaenoic acid (EPA), and
docosahexaenoic acid (DHA)) used in nutritional supplements, monetizing these oils may
be challenging at processing facilities where there is limited infrastructure and plants are
remotely located. Under these conditions, extraction of oil from fish by-product for use as
an in-house or regional fuel may be both an economically and environmentally more
sustainable approach. Processes to extract and refine fish oil for fuel are less energy
intensive than those used for nutritional quality oil extraction/refining due to higher
product quality standards required to meet nutritional regulations. Further, extraction of
oil from waste (fish residue) for biofuels does not negatively impact food production [1].
Biofuels are gaining more attention due to availability, renewability and other advantages
such as, net greenhouse gas (GHG) reduction, improved combustion, biodegradability
and low toxicity [2]. Studies have proposed using fish oil and/or blending with petroleum
based fuels as an alternative fuel oil for convectional combustors or diesel engines [3,4].
Fish oil has been used as fuel oil in power/heat generation as these systems can tolerate
lower fuel quality than diesel engines [4]. Bunker fuel oils (No.2 to No.6) [5,6] are heavy
petroleum distillates and are viscous, lower-grade fuel oil used to produce electricity, to
fire boilers and blast furnaces in industry (notably the pulp and paper industry), and to
power large marine and other vessels. Bunker fuels contain sulphur resulting in sulphur
55
dioxide as well as other contaminant emissions (due to the high molecular weight of the
fuel) [7]. Blending fuel oils with unrefined fish oils could reduce emissions associated
with this equipment particularly sulphur dioxide. An investigation by Preto et al., [4]
reported that fish oil blends with No.6 and No.2 fuel oils burn well in conventional
furnaces resulting in lower overall pollutant emission. The fish oil also reduced the
viscosity of the fuels through blending [3]. While this work is promising, in order to use
blends of fish oil and petroleum effectively, knowledge of thermal stability, rheological
properties, enthalpy and other cold flow properties of the blends is required. There is
limited literature on the properties of heavy oil-fish oil blends. A comparison of the
quality of fish oil compared to the petroleum based fuels was done using
thermogravimetric analysis (TGA) and differential scanning calorimeter (DSC) among
other methods [8-10]. Operations related to the mass transfer and liquid flow, such as
pumping, storage and handling, are addressed with rheological knowledge of the fluid
[8]. There are few published studies on the thermal stability and rheological properties of
fish oil [8-10] and less on blends of fish oil and/waste fish oils with heavy petroleum oils.
The objective of this work is to evaluate thermal stability, rheological, and heating value,
of unrefined salmon oil, waste fish oil, and blends with bunker fuel oil.
3.2. Materials and Methods
3.2.1. Sample preparation
Fresh salmon waste (head, gut, trimming and frame) were obtained from the Centre for
Aquaculture and Seafood Development (CASD), Memorial University of Newfoundland
(MUN). The waste was stored at -40 oC. As part of the oil removal process, the waste was

56
thawed, ground to 1-4 mm and heated in a hot water bath at 80 oC for 10 to 15 minutes.
The heated waste was transferred into eight 50mL centrifuge tubes and centrifuged in an
Eppendorf centrifuge 5810 (Eppendorf AG 22331, Hamburg-Germany) at 3850rpm for 9
minutes. The fish oil was separated by decantation and stored again at -40 . The same
oil recovery method was used to recover oil from Atlantic cod, herring and mackerel.
Bunker fuel oil and waste fish oil were supplied by St. Francis Xavier University, Nova
Scotia. The waste fish oil is a by-product of Ocean Nutrition Canada Ltd. (ONC).
Omega-3 fatty acids are extracted/concentrated from anchovy (95 – 99 %) and sardine (1-
5 %) oil imported from Peru, off the coast of South America. The waste fish oil ‘as is’
was stored in the freezer at -40 until used while the bunker fuel oil kept in cold room
at temperature between 0 and 4
3.2.2. Thermogravimetric analysis (TGA)
The thermal stability of the unrefined salmon oil, and waste fish oil and their blends with
the bunker fuel was conducted using the Thermo-gravimetric Analyzer (Model Q500, TA
Instruments Inc.). Approximately 0.8 - 1.2 mg of oil/blend sample was loaded into the
furnace. The TA instrument was manually programmed to heat up the sample from
ambient temperature condition to 800 under N2/air atmosphere at the ramping rate of
5 /min. Sample weight change was automatically acquired every second and the data
were analyzed and plotted using the TA Universal Analyzer Software.
3.2.3. Calorific value/High heating value (HHV)
The calorific value of a fuel is the thermal energy liberated per unit mass of fuel during a
complete combustion reaction till the products of combustion are cooled back to the
57
initial temperature of the combustible materials [11]. Calorific value is a measure of the
energy content in a fuel. The 1108 oxygen bomb calorimeter (Parr Instrument Company)
was used to determine the HHV of the unrefined salmon and waste fish oils and the
blends of each with bunker fuel oil according to ASTM D2015 standard method. Oxygen
– bomb vessel was pressurized to approximately 3 MPa with an oxygen container. The
bomb was ignited automatically after the jacket and a bucket temperature equilibrated to
the desired temperature.
3.2.4 Flash point testing
The flash point of a fuel oil is the lowest temperature, corrected to atmospheric pressure,
at which application of a naked/test flame cause the fuel-vapor to ignite under specific
conditions of test [11]. The flash point of the oils and their blends were measured by
Pensky-Martens closed cup apparatus (K16200 – Koehler Instrument Company Inc.). The
flashpoints were determined in accordance with ASTM D93. The apparatus is equipped
with closed cup to which the sample is fed and heated at a controlled rate. An ignition
source was introduced and the temperature at which the heated oil flashes was recorded
as the flash point.
3.2.5. Melting points and enthalpy
Melting points were determined in a METTLER TOLEDO DSC-1 (Differential Scanning
Calorimeter) with Julabo intercooler and TA Universal Analyzer Software.
Approximately 5-10 mg of sample was cooled to -60 oC and heating to 40
oC at 5
oC/min.
The thermogram plots containing normalized heat flow with temperature were integrated
to obtain peak onset and areas. The average melting points of unrefined salmon oil and
58
waste fish oil were analyzed and recorded. The thermograph peak was used to determine
the enthalpy ( H) of the samples using the TA Universal Analyzer Software.
3.2.6. Rheological properties
The apparent viscosity of the fish oils and their blends with bunker fuel oil were
measured using a Brookfield DV-III Ultra Programmable rheometer equipped with a
small sample adapter and spindle (SC4-18/13RP). The temperature of the sample was
kept constant by connecting a circulating water bath (NESLAB EX series) to a water
jacket of the small sample adapter. Measurements were taken at 20, 30, 40, 50 and 60
in (Pa.s) by changing the spindle rotation speed from 10 rpm at intervals of 10 until the
torque exceeded 100%. The power law (Eq.1) was used to analyze the flow behavior of
all raw samples and their blends.
(1)
Where = shear stress (Pa.s), = shear rate (s-1
), K = consistency index (Pa.sn) and n is
the flow behavior index (dimensionless unit) [8,10,12]. Taking the logarithm of both
sides of Eq.(1) yields a straight line plot of log versus log with intercept (log K) and
slope n. The effect of temperature on apparent viscosity is outlined in Eq. (2) [8,10,13].
k = A exp(-Ea/RT)
(2)
Where k is the reaction rate constant, A is the frequency factor, Ea is the activation energy
(J/mol), R is the gas constant (8.314 J/mol.K), and T is the temperature (K). The natural
logarithm (ln) of apparent viscosity versus inverse of temperature (1/T) was plotted for
each data set and with the slope of the straight line used to calculate Ea, and A as the
intercept.

59
Statistical Analysis
The experiments were conducted in triplicates. Mean and standard deviation were
calculated using Microsoft Excel 2007 (Window 8 Edition, Microsoft Corporation,
USA). Analysis of variance (ANOVA) at alpha level of 0.05 was performed using the
statistical tool in Microsoft Excel. Average of three measurements plus/minus standard
deviation was given in tables where applicable.
3.3 Result and discusion
3.3.1 Thermal analysis (TGA)
Table 3.1 outlines the TGA results of raw fish oils and blends from this study and
published studies. Included in this table are species data obtained in previous studies in
our lab (herring and mackerel and Northern cod). The TGA analyzes the thermal stability
by relating changes to its physicochemical properties to weight changes as a function of
temperature [14]. The thermal behavior of bunker fuel oil, unrefined salmon oil and
waste fish oil were studied under a nitrogen atmosphere between 0 °C and 800 °C (Fig.
3.1a). The weight of the bunker fuel oil starts to decrease from 50 °C – 100 °C which is
likely due to vaporization of lighter fractions of the bunker fuel oil. The rate of weight
loss is rapid between 100°C - 250 °C likely a result of decomposition of lighter
components of the oil [8]. From 250 °C to approximately 350 °C, the weight loss rate
decreases may be due impurities such as waxes, pigments and complex metallic
compounds etc., which can be present in heavier fuel oil fractions [15]. The second rapid
decomposition occurs between 375 °C and 450 °C. The oil was not completely
decomposed at 500 °C and soot, ash, and other thermally recalcitrant substances
60
remained. The weight fraction of the soot/ash mixture was 12.3 wt. %. The onset weight
loss temperature of waste fish oil and unrefined salmon oil starts at 187 °C and 229 °C
respectively. Between 200 °C and 450 °C, the rate of weight loss of the waste fish oil
increased rapidly with temperature (Fig. 3.1a). The total weight loss in this region is
approximately 95 wt. %. Unrefined salmon oil did not decompose as rapidly in this
range. Sathivel et al., Wiedermann and Chiou et al., [10,16,17], determined unprocessed
salmon oil contains phospholipids, metals, minerals, free fatty acids, peroxides and their
degraded products in the oil. These impurities absorb heat, slowing the decomposition of
the oil [10,16] as such refined edible oils (waste fish oil) undergo more weight loss than
unrefined edible oils [10]. In the temperature range from 350 °C-450 °C the salmon oil
degrades rapidly (approximately 90 wt. %) and approximately 0.6 wt. % recalcitrant
materials remained.
The waste fish oil exhibited higher volatility than the unrefined salmon oil. This is likely
due to the removal of edible components of the oil (such as omega-3, omega-6, EPA,
DHA etc…) by ONC prior to testing. The unrefined salmon oil composition is richer in
long chain polyunsaturated fatty acids that are more susceptible to oxidation. Thermal
polymerization reactions occur in edible oils in temperature range from 200 °C to 300 °C
in inert or nitrogen environment [18,19], which was observed in the TG curve of
unrefined salmon oil (Fig.3.1a). The average boiling point of edible oils ranges from 200
-250 °C depending on the type of oil as such weight loss at approximately 250 °C and
below is considered vaporization.
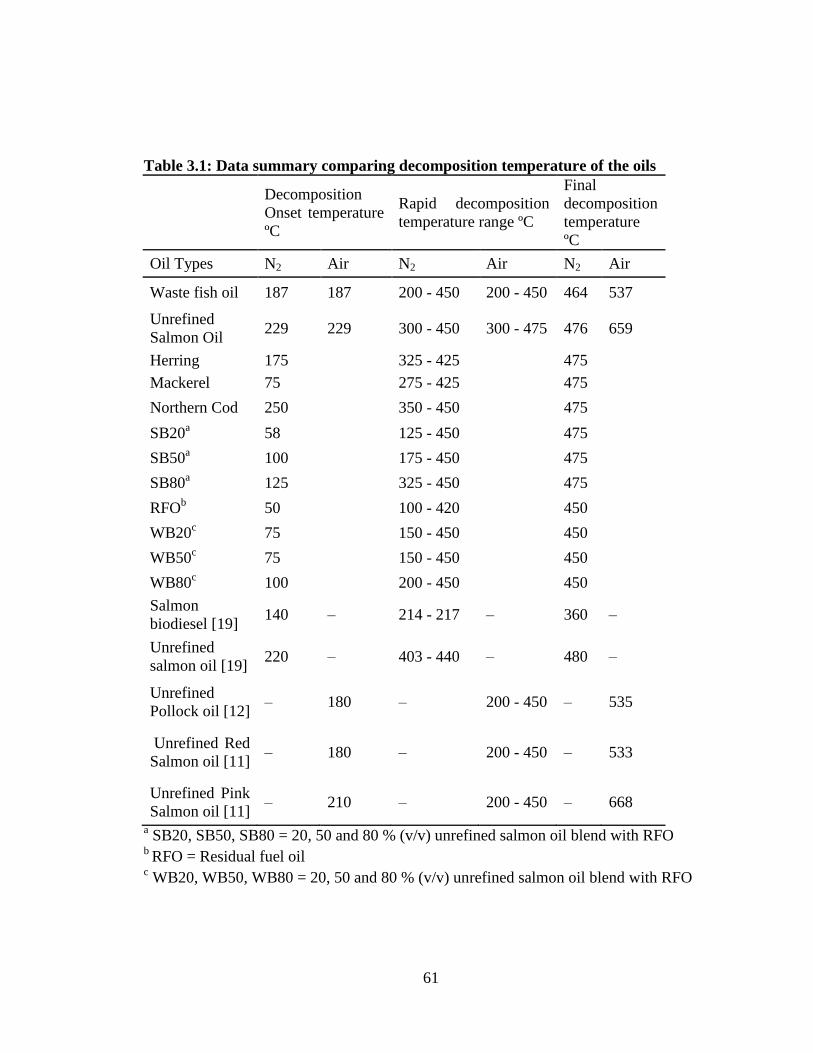
61
Table 3.1: Data summary comparing decomposition temperature of the oils
Decomposition
Onset temperature
ºC
Rapid decomposition
temperature range ºC
Final
decomposition
temperature
ºC
Oil Types N2 Air N2 Air N2 Air
Waste fish oil 187 187 200 - 450 200 - 450 464 537
Unrefined
Salmon Oil 229 229 300 - 450 300 - 475 476 659
Herring 175
325 - 425
475
Mackerel 75
275 - 425
475
Northern Cod 250
350 - 450
475
SB20a 58
125 - 450
475
SB50a 100
175 - 450
475
SB80a 125
325 - 450
475
RFOb 50
100 - 420
450
WB20c 75
150 - 450
450
WB50c 75
150 - 450
450
WB80c 100
200 - 450
450
Salmon
biodiesel [19] 140 – 214 - 217 – 360 –
Unrefined
salmon oil [19] 220 – 403 - 440 – 480 –
Unrefined
Pollock oil [12] – 180 – 200 - 450 – 535
Unrefined Red
Salmon oil [11] – 180 – 200 - 450 – 533
Unrefined Pink
Salmon oil [11] – 210 – 200 - 450 – 668
a SB20, SB50, SB80 = 20, 50 and 80 % (v/v) unrefined salmon oil blend with RFO
b RFO = Residual fuel oil
c WB20, WB50, WB80 = 20, 50 and 80 % (v/v) unrefined salmon oil blend with RFO

62
Figure 3.1a: Thermal degradation of the residual fuel oil, unrefined Salmon oil and waste
fish oil under nitrogen and air atmosphere.
0
10
20
30
40
50
60
70
80
90
100
0 200 400 600 800
Wei
gh
t (%
)
Temperature (ºC)
Unrefined salmon oil %
Waste fish oil
RFO
0
10
20
30
40
50
60
70
80
90
100
0 200 400 600 800
Wei
gh
t (%
)
Temperature (ºC)
Unrefined salmon oil
SB80
SB50
SB20
RFO
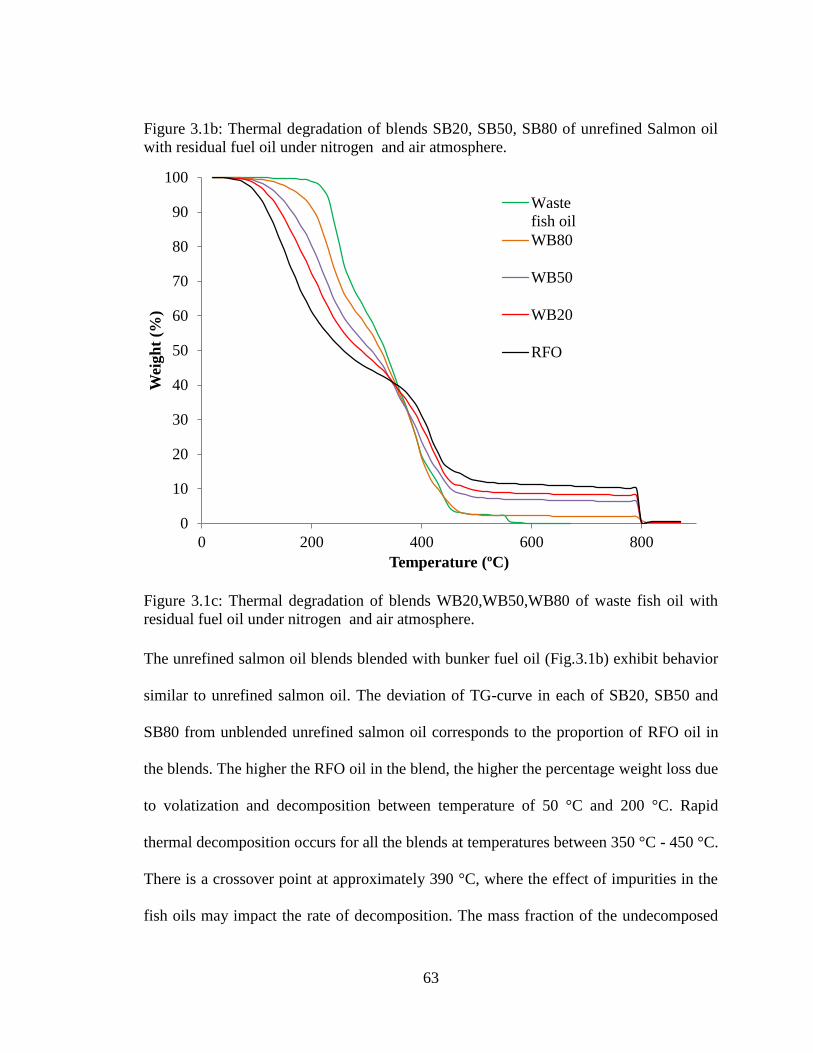
63
Figure 3.1b: Thermal degradation of blends SB20, SB50, SB80 of unrefined Salmon oil
with residual fuel oil under nitrogen and air atmosphere.
Figure 3.1c: Thermal degradation of blends WB20,WB50,WB80 of waste fish oil with
residual fuel oil under nitrogen and air atmosphere.
The unrefined salmon oil blends blended with bunker fuel oil (Fig.3.1b) exhibit behavior
similar to unrefined salmon oil. The deviation of TG-curve in each of SB20, SB50 and
SB80 from unblended unrefined salmon oil corresponds to the proportion of RFO oil in
the blends. The higher the RFO oil in the blend, the higher the percentage weight loss due
to volatization and decomposition between temperature of 50 °C and 200 °C. Rapid
thermal decomposition occurs for all the blends at temperatures between 350 °C - 450 °C.
There is a crossover point at approximately 390 °C, where the effect of impurities in the
fish oils may impact the rate of decomposition. The mass fraction of the undecomposed
0
10
20
30
40
50
60
70
80
90
100
0 200 400 600 800
Wei
gh
t (%
)
Temperature (ºC)
Waste
fish oil
WB80
WB50
WB20
RFO
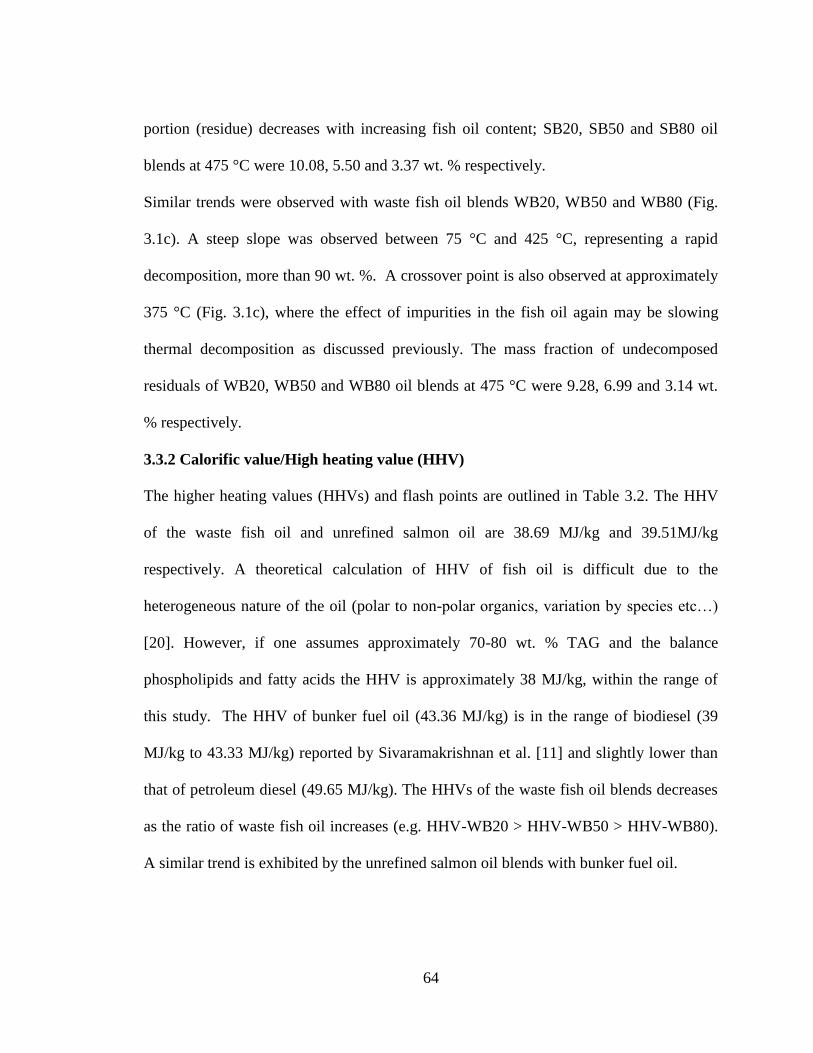
64
portion (residue) decreases with increasing fish oil content; SB20, SB50 and SB80 oil
blends at 475 °C were 10.08, 5.50 and 3.37 wt. % respectively.
Similar trends were observed with waste fish oil blends WB20, WB50 and WB80 (Fig.
3.1c). A steep slope was observed between 75 °C and 425 °C, representing a rapid
decomposition, more than 90 wt. %. A crossover point is also observed at approximately
375 °C (Fig. 3.1c), where the effect of impurities in the fish oil again may be slowing
thermal decomposition as discussed previously. The mass fraction of undecomposed
residuals of WB20, WB50 and WB80 oil blends at 475 °C were 9.28, 6.99 and 3.14 wt.
% respectively.
3.3.2 Calorific value/High heating value (HHV)
The higher heating values (HHVs) and flash points are outlined in Table 3.2. The HHV
of the waste fish oil and unrefined salmon oil are 38.69 MJ/kg and 39.51MJ/kg
respectively. A theoretical calculation of HHV of fish oil is difficult due to the
heterogeneous nature of the oil (polar to non-polar organics, variation by species etc…)
[20]. However, if one assumes approximately 70-80 wt. % TAG and the balance
phospholipids and fatty acids the HHV is approximately 38 MJ/kg, within the range of
this study. The HHV of bunker fuel oil (43.36 MJ/kg) is in the range of biodiesel (39
MJ/kg to 43.33 MJ/kg) reported by Sivaramakrishnan et al. [11] and slightly lower than
that of petroleum diesel (49.65 MJ/kg). The HHVs of the waste fish oil blends decreases
as the ratio of waste fish oil increases (e.g. HHV-WB20 > HHV-WB50 > HHV-WB80).
A similar trend is exhibited by the unrefined salmon oil blends with bunker fuel oil.
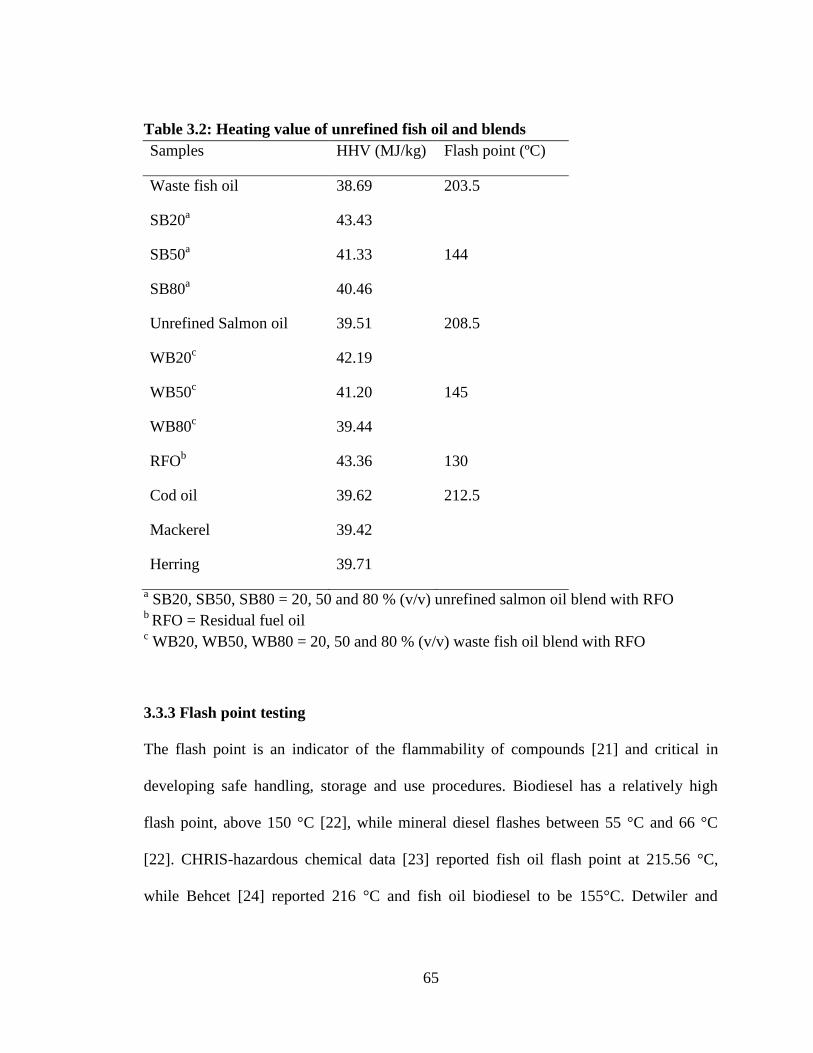
65
Table 3.2: Heating value of unrefined fish oil and blends
Samples HHV (MJ/kg) Flash point (ºC)
Waste fish oil 38.69 203.5
SB20a
43.43
SB50a
41.33 144
SB80a
40.46
Unrefined Salmon oil 39.51 208.5
WB20c
42.19
WB50c
41.20 145
WB80c
39.44
RFOb
43.36 130
Cod oil 39.62 212.5
Mackerel 39.42
Herring 39.71
a SB20, SB50, SB80 = 20, 50 and 80 % (v/v) unrefined salmon oil blend with RFO
b RFO = Residual fuel oil
c WB20, WB50, WB80 = 20, 50 and 80 % (v/v) waste fish oil blend with RFO
3.3.3 Flash point testing
The flash point is an indicator of the flammability of compounds [21] and critical in
developing safe handling, storage and use procedures. Biodiesel has a relatively high
flash point, above 150 °C [22], while mineral diesel flashes between 55 °C and 66 °C
[22]. CHRIS-hazardous chemical data [23] reported fish oil flash point at 215.56 °C,
while Behcet [24] reported 216 °C and fish oil biodiesel to be 155°C. Detwiler and
66
Markley [25] determined that the flash, smoke and fire point of biological oils (e.g.
soybean oil) varied considerably with the degree of refining, especially the removal of
free fatty acids, and also with the mode of extraction. The flash point of the bunker fuel
oil in this work is 130 °C, well below the flash point of the waste fish oil and the
unrefined salmon oil of 203.5 °C and 208.5 °C respectively (Table 3.2). Detwiler and
Markley [25] tested lightly processed Menhaden, light-deodorized fish oil, and kettle-
refined-deodorized fish oil tested and obtained flash points of 302 °C, 298 °C, and 279 °C
respectively. The flash points of the blends WB50 and SB50 are 145 °C and 144 °C
respectively, lower than the flash points of unblended waste fish oil and unrefined salmon
oil but slightly higher than the unblended RFO oil flash point. The blends flash points are
of lower values than that of pure (B100) biodiesel but high enough from a safety
perspective to be safely stored and transported at ambient temperatures in temperate
regions. The lower flash points reported in this work may be due to the presence of free
fatty acids in both fish oil (i.e 14.5 % and 6.6 % FFA of waste fish oil and unrefined
salmon oil respectively). This is in agreement with Detwiler and Markley [25].
3.3.4. Melting points and enthalpy
The DSC thermograms (Figure 3.2a and 3.2b) show two broad endothermic peaks for the
waste fish oil and the unrefined salmon oil respectively. The melting point of waste fish
oil ranged from -21.07 to 20.25 o
C, whereas the melting point of unrefined salmon oil
ranged from -34.69 to 16.95 °C (Table 3.3a). The negative melting points of the oils were
attributed to the presence of triacylglycerol which contain unsaturated fatty acids
[8,10,26]. The higher degree of unsaturated fatty acids in fish oil result in melting at

67
lower temperatures, conversely, a higher degree of saturated fatty acids in fish oil result
in high melting temperatures [8]. The ratios of polyunsaturated to saturated fatty acids in
both waste fish oil and unrefined salmon oil are greater than unity (Table 3.3b).
Figure 3.2a: DCS thermograph of the waste fish fish oil
-0.4
-0.35
-0.3
-0.25
-0.2
-0.15
-0.1
-0.05
0
-40 -30 -20 -10 0 10 20 30 40
Hea
t fl
ow
(W
/g)
Temperature (°C)
Waste fish…

68
Figure 3.2b: DCS thermograph of unrefined salmon oil
The thermogram peaks for all the oils were not sharp due to the presence of impurities
such as phospholipids, free fatty acids, aldehydes, particulate matters, ketones, water, and
pigments. These impurities result in a melting behaviour typical of pure fatty acids [8,26].
Table 3.3a summarizes the enthalpy of the waste fish oil and unrefined salmon oil. The
enthalpy of the waste fish oil is higher (51.80 kJ/kg) than that of unrefined salmon oil
(33.43 kJ/kg). This indicated that for same amount of oil, more energy would be required
for phase transition of the waste fish oil compared to unrefined salmon oil from solid to
liquid state. The enthalpy of unrefined herring, mackerel and northern cod oil are 52.92,
53.60, and 41.45 kJ/kg respectively.
-0.35
-0.3
-0.25
-0.2
-0.15
-0.1
-0.05
0
-40 -30 -20 -10 0 10 20 30 40
Hea
t F
low
(W
/g)
Temperature (°C)
Unrefined salmon oil
thermogram

69
Ton = Onset melting temperature; Toff = Offset melting temperature
Table 3.3b: Fatty acid composition of waste fish oil and unrefined salmon oil
(wt %) from total
Component Waste fish oil Unrefined salmon oil
Bacterial 1.82 ± 0.05 1.11 ± 0.04
Saturated fatty acids 21.76 ± 1.55 20.58 ± 0.08
MUFAd
21.64 ± 0.20 49.51 ± 0.02
PUFAe
55.57 ± 1.35 29.41 ± 0.07
PUFA/SFAf
2.56 ± 0.25 1.43 ± 0.01
ω-3g ratio 47.57 ± 1.07 11.58 ± 0.01
DHA/EPAh ratio 0.76 ± 0.02 0.71 ± 0.01
dMUFA = monounsaturated;
ePUFA = polyunsaturated fatty acid;
fSFA = saturated fatty acid;
hDHA = docosahexaenoic acid;
hEPA = eicosapentaenoic acid;
gω-3 = omega -3
The value of enthalpy reported for unrefined salmon in this work is lower compared to
the 58.7 kJ/kg reported by [10], and 40 kJ/kg and 39 kJ/kg for red and pink salmon
Table 3.3a: Melting points onset temperature and enthalpy of the oils
Sample Ton (oC) Toff (
oC) Peak(
oC) Enthalpy(kJ/kg)
Waste Oil -21.07 ± 2.21 20.25 ± 0.44 -9.98 ± 0.60 51.80 ± 2.53
Unrefined
salmon Oil -34.69 ± 0.46 16.06 ± 0.54 - 6.0 ± 0.08 33.43 ± 2.16
Herring -18.37 ± 1.17 16.25 ± 0.40 -3.48 ± 2.63 52.92 ± 2.54
Mackerel -29.31 ± 1.97 20.07 ± 0.15 -9.98 ± 0.45 53.6 ± 2.77
Northern Cod -21.85 ± 1.51 12.16 ± 0.11 -15.58 ± 1.02 41.45 ± 1.12

70
respectively reported by [9]. The value disparities could be attributed to different in
origin, harvesting season, and extraction method and quality of raw materials.
3.3.5. Rheological properties
The change in apparent viscosity with the shear rate with temperature was investigated.
Results are summarized for unrefined salmon oil and the waste fish oil at the maximum
temperature studied (60 oC), in Fig.3.3. At 60
oC the waste fish oil viscosity decreased
from 0.059 Pa.s to approximately 0.0154 Pa.s when the shear rate was increased from 13
s-1
to 106 s-1
and remained constant after. At 60 oC the drop was from 0.0605 Pa.s to
0.0197 Pa.s for unrefined salmon oil when the shear rate was increased from 13 s-1
to 106
s-1
and then stabilized. Bunker fuel oil viscosity decreased from 0.1268 Pa.s to 0.0639
Pa.s and remained stable when the shear rate was increased from 13 s-1
to 92.4 s-1
. In the
case of blends WB50 and WB50, the viscosity decreased from 0.082 Pa.s and 0.099 Pa.s
to approximately 0.0303 Pa.s and 0.0352 Pa.s respectively, when the shear stress was
increased from 13 s-1
to 66 s-1
and then stabilized. The effect of both waste fish oil and
the unrefined salmon at 50 % (v/v) lowered the viscosity at 60 oC (Fig.3.3).
The decrease in viscosity with increasing shear rate indicated that the samples and their
blends exhibited a shear-thinning non-Newtonian behavior which is in agreement with
our previous work [20].
The flow behavior index (n) shows that the raw samples behave pseudoplastically (i.e
n<1). The power law parameters are given in Table 3.4a and 3.4b. The flow behavior
index (n) of waste fish oil and unrefined salmon oil at 20 o
C are approximately 0.8 and
0.9 respectively, indicating non-Newtonian behavior [8,10]. These values are similar to
71
those reported for unpurified salmon oil by [8], and unrefined pollock oil by [10]. The n
values were less than unity indicating that these products are pseudoplastic materials at
all temperatures and blend concentrations studied. The coefficients (R2) obtained were
very close to unity, confirming that the power law model is suitable in describing flow. In
practice, specific additives are added to viscous material to achieve pseudoplastic flow
behavior. This behavior is beneficial to fuel flow through pipes and hoses as stress forces
applied through pumps reduce fuel viscosity. The stronger the shear force applied to the
pseudoplastic material, the greater the thinning effect and reduction in viscosity [27]. The
pseudoplasticity of the raw samples and blends increases with temperature and
concentration of fish oil in bunker fuel oil (Table 3.4a and 3.4b). The consistency
coefficient, k, decreases with increases in temperature over the range of waste fish oil and
unrefined salmon oil concentrations. This shows consistency with viscosity behavior and
indicated that viscosity values decrease with increase in temperature at all fish oil
concentrations in bunker fuel oil.
In eq. (2) the activation energy, Ea, (kJ/mol) represents the energy barrier to flow
[8,10,13,28]. The frequency factor or viscosity coefficient at a reference temperature, A,
(Pa.s) and Ea values were determined using a best fit line equation with least sum of
square errors (SSE). The magnitude of the temperature effect on bunker fuel oil varied
with fish oil concentration as shown by the Ea values in Table 3.5. In general, the higher
the activation energy, the more sensitive the viscosity will be to temperature [28]. As
shown in Table 3.5, the Ea decreased from 47.18 kJ/mol at 20 % (v/v) waste fish oil
blend to 44.68 kJ/mol at 50 % (v/v) waste fish oil blend and to 35.75 kJ/mol of waste fish
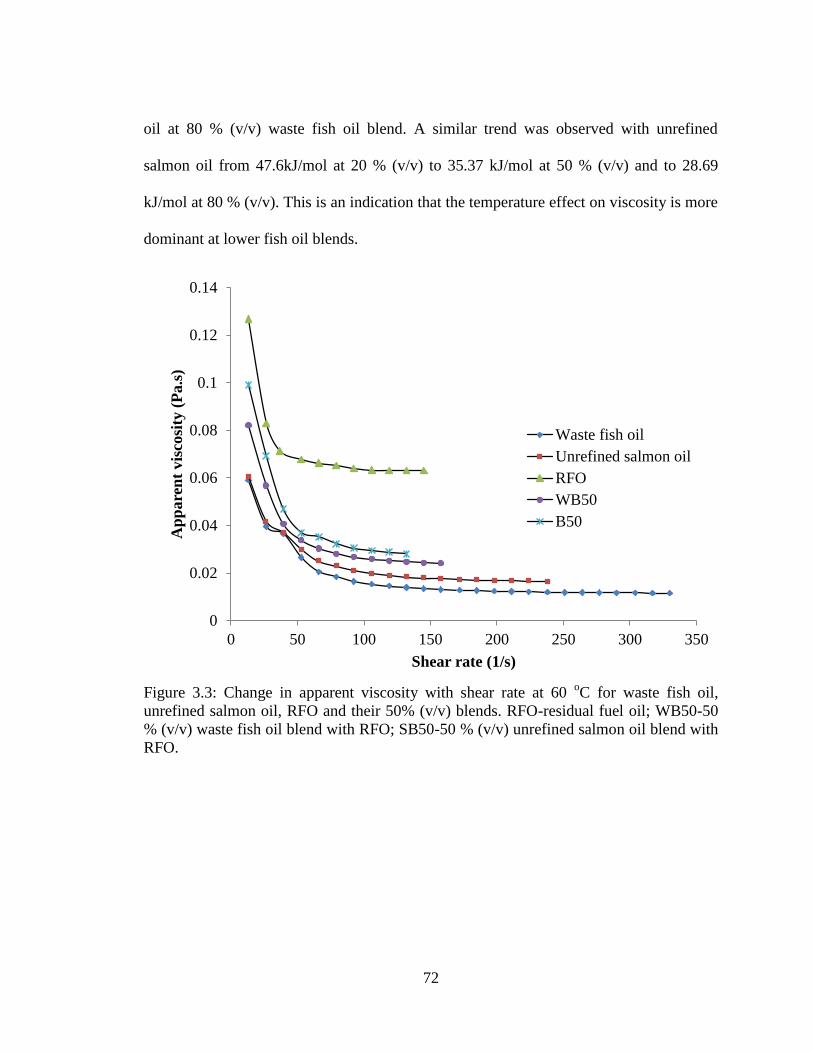
72
oil at 80 % (v/v) waste fish oil blend. A similar trend was observed with unrefined
salmon oil from 47.6kJ/mol at 20 % (v/v) to 35.37 kJ/mol at 50 % (v/v) and to 28.69
kJ/mol at 80 % (v/v). This is an indication that the temperature effect on viscosity is more
dominant at lower fish oil blends.
Figure 3.3: Change in apparent viscosity with shear rate at 60 oC for waste fish oil,
unrefined salmon oil, RFO and their 50% (v/v) blends. RFO-residual fuel oil; WB50-50
% (v/v) waste fish oil blend with RFO; SB50-50 % (v/v) unrefined salmon oil blend with
RFO.
0
0.02
0.04
0.06
0.08
0.1
0.12
0.14
0 50 100 150 200 250 300 350
Ap
pare
nt
vis
cosi
ty (
Pa.s
)
Shear rate (1/s)
Waste fish oil
Unrefined salmon oil
RFO
WB50
B50
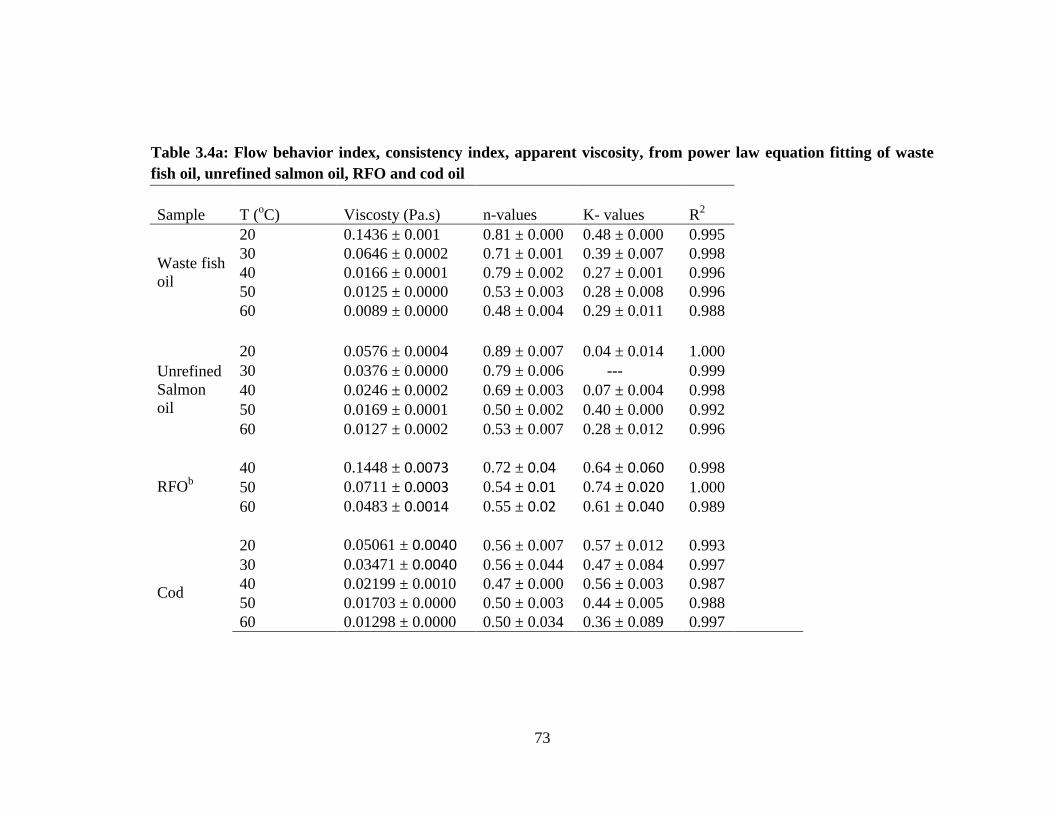
73
Table 3.4a: Flow behavior index, consistency index, apparent viscosity, from power law equation fitting of waste
fish oil, unrefined salmon oil, RFO and cod oil
Sample T (oC) Viscosty (Pa.s) n-values K- values R
2
Waste fish
oil
20 0.1436 ± 0.001 0.81 ± 0.000 0.48 ± 0.000 0.995
30 0.0646 ± 0.0002 0.71 ± 0.001 0.39 ± 0.007 0.998
40 0.0166 ± 0.0001 0.79 ± 0.002 0.27 ± 0.001 0.996
50 0.0125 ± 0.0000 0.53 ± 0.003 0.28 ± 0.008 0.996
60 0.0089 ± 0.0000 0.48 ± 0.004 0.29 ± 0.011 0.988
Unrefined
Salmon
oil
20 0.0576 ± 0.0004 0.89 ± 0.007 0.04 ± 0.014 1.000 30 0.0376 ± 0.0000 0.79 ± 0.006 --- 0.999 40 0.0246 ± 0.0002 0.69 ± 0.003 0.07 ± 0.004 0.998 50 0.0169 ± 0.0001 0.50 ± 0.002 0.40 ± 0.000 0.992 60 0.0127 ± 0.0002 0.53 ± 0.007 0.28 ± 0.012 0.996
RFOb
40 0.1448 ± 0.0073 0.72 ± 0.04 0.64 ± 0.060 0.998
50 0.0711 ± 0.0003 0.54 ± 0.01 0.74 ± 0.020 1.000
60 0.0483 ± 0.0014 0.55 ± 0.02 0.61 ± 0.040 0.989
Cod
20 0.05061 ± 0.0040 0.56 ± 0.007 0.57 ± 0.012 0.993
30 0.03471 ± 0.0040 0.56 ± 0.044 0.47 ± 0.084 0.997
40 0.02199 ± 0.0010 0.47 ± 0.000 0.56 ± 0.003 0.987
50 0.01703 ± 0.0000 0.50 ± 0.003 0.44 ± 0.005 0.988
60 0.01298 ± 0.0000 0.50 ± 0.034 0.36 ± 0.089 0.997
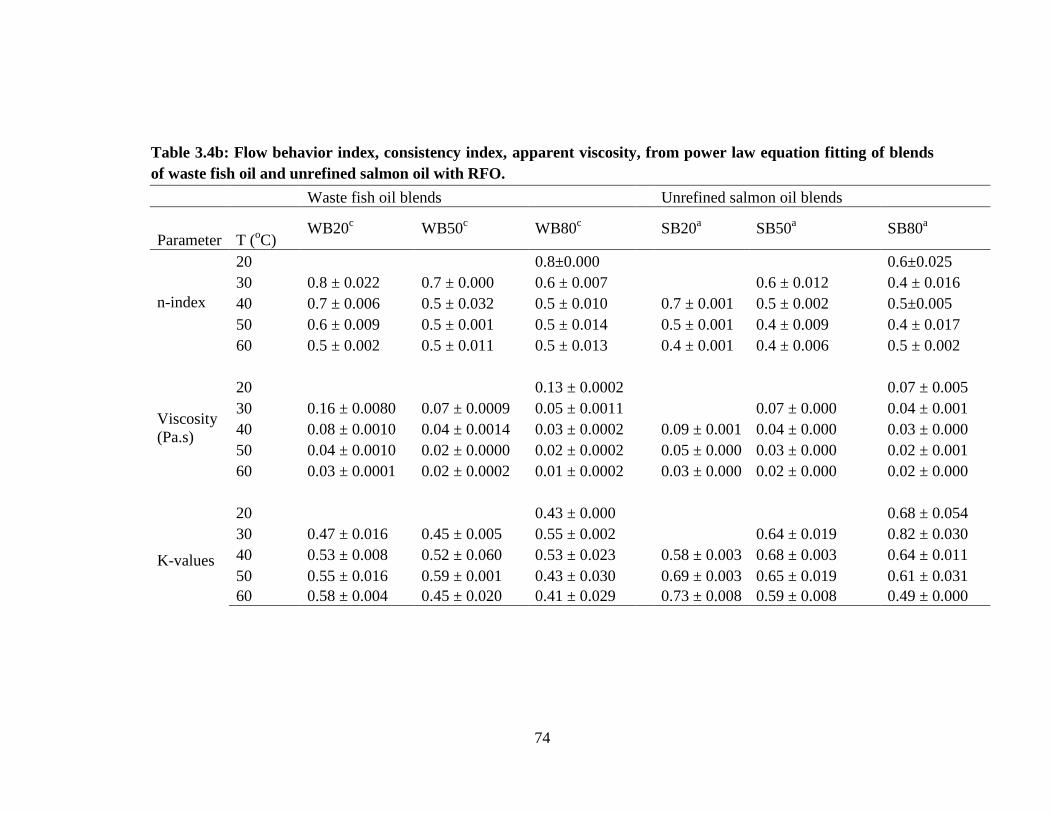
74
Table 3.4b: Flow behavior index, consistency index, apparent viscosity, from power law equation fitting of blends
of waste fish oil and unrefined salmon oil with RFO.
Waste fish oil blends Unrefined salmon oil blends
Parameter T (oC)
WB20c
WB50c
WB80c
SB20
a SB50
a SB80
a
n-index
20
0.8±0.000
0.6±0.025
30 0.8 ± 0.022 0.7 ± 0.000 0.6 ± 0.007
0.6 ± 0.012 0.4 ± 0.016
40 0.7 ± 0.006 0.5 ± 0.032 0.5 ± 0.010
0.7 ± 0.001 0.5 ± 0.002 0.5±0.005
50 0.6 ± 0.009 0.5 ± 0.001 0.5 ± 0.014
0.5 ± 0.001 0.4 ± 0.009 0.4 ± 0.017
60 0.5 ± 0.002 0.5 ± 0.011 0.5 ± 0.013
0.4 ± 0.001 0.4 ± 0.006 0.5 ± 0.002
Viscosity
(Pa.s)
20
0.13 ± 0.0002
0.07 ± 0.005
30 0.16 ± 0.0080 0.07 ± 0.0009 0.05 ± 0.0011
0.07 ± 0.000 0.04 ± 0.001
40 0.08 ± 0.0010 0.04 ± 0.0014 0.03 ± 0.0002
0.09 ± 0.001 0.04 ± 0.000 0.03 ± 0.000
50 0.04 ± 0.0010 0.02 ± 0.0000 0.02 ± 0.0002
0.05 ± 0.000 0.03 ± 0.000 0.02 ± 0.001
60 0.03 ± 0.0001 0.02 ± 0.0002 0.01 ± 0.0002
0.03 ± 0.000 0.02 ± 0.000 0.02 ± 0.000
K-values
20
0.43 ± 0.000
0.68 ± 0.054
30 0.47 ± 0.016 0.45 ± 0.005 0.55 ± 0.002
0.64 ± 0.019 0.82 ± 0.030
40 0.53 ± 0.008 0.52 ± 0.060 0.53 ± 0.023
0.58 ± 0.003 0.68 ± 0.003 0.64 ± 0.011
50 0.55 ± 0.016 0.59 ± 0.001 0.43 ± 0.030
0.69 ± 0.003 0.65 ± 0.019 0.61 ± 0.031
60 0.58 ± 0.004 0.45 ± 0.020 0.41 ± 0.029
0.73 ± 0.008 0.59 ± 0.008 0.49 ± 0.000

75
Table 3.5: The activation energy Ea of the raw oils and their blends
Sample Ea (kJ mol-1
) A(Pa.S)
Waste fish oil 58.884 ± 0.4497 4.01x10⁻¹²
Unrefined salmon oil 31.036 ± 0.5661 1.69 x10⁻⁷
Cod oil 31.421 ± 1.3886 1.49x10⁻⁷
SB20a
47.592 ± 2.0188 1.14 x10⁻⁹
SB50a
35.372 ± 0.0682 5.28 x10⁻⁸
SB80a
28.688 ± 2.6761 6.14 x10⁻⁷
RFOb
47.662 ± 2.0358 1.7x 10⁻⁹
WB20c
47.178 ± 2.3633 1.29 x10⁻⁹
WB50c
44.667 ± 0.1581 1.2 x10⁻⁹
WB80c
35.749 ± 0.7977 4.3 x10⁻⁸
76
3.4 Summary and conclusion.
In this work the thermal and rheological properties of waste fish oil, unrefined salmon oil,
bunker fuel oil and their blends have been analyzed. The feasibility of using unblended
and/or blends of fish oil in conventional heaters/boilers/engines are determined by these
properties. The fish oil, bunker fuel oil and their blends behaved as a shear thinning fluid
and could be described by the power-law model. For bunker fuel oil /fish oil blends an
increase in fish oil resulted in an increase in pseudo-plasticity of the blend. The activation
energy decreased with increasing concentration of fish oil in blends.
Based on these results and previous studies in our lab [20], the blending of fish oil and
bunker fuel oil fuel could potentially be used in home heating oil, steam/hot water -
boilers, and marine fuels. The flash point of the blends is high enough for safe handling,
transportation and storage. The fish oil/ bunker fuel oil blends have a lower heating value
than the petroleum based fuel and therefore the ratio of fish oil: petroleum fuel must be
considered. At high concentration of waste fish oils in the blends, the activation energy
(flow barrier), Ea, becomes smaller and therefore exhibits good flow properties, which
may be beneficial to applications in colder regions. The data on the rheological properties
of the blends could be used as a tool in determining applications, storage and handling
methods of the blends. Blending fish oils (biofuel) with the bunker fuel oil (petroleum
based fuel oil) also minimize CO emission [3,29]; hence, this application may lessen the
environmental concerns over emission properties of bunker fuel oil as fuel.

77
References
[1] Adeoti IA, Hawboldt K A review of lipid extraction from fish processing by-product
for use as a biofuel. Biomass Bioenergy 2014;63(0):330-40.
[2] West AH, Posarac D, Ellis N Assessment of four biodiesel production processes using
HYSYS.Plant. Bioresour Technol 2008;99(14):6587-601.
[3] Kalligeros S, Zannikos F, Stournas S, Lois E, Anastopoulos G, Teas C, et al. An
investigation of using biodiesel/marine diesel blends on the performance of a stationary
diesel engine. Biomass Bioenergy 2003;24(2):141-9.
[4] Preto F, Zhang F, Wang J A study on using fish oil as an alternative fuel for
conventional combustors. Fuel 2008;87(10–11):2258-68.
[5] Wikipedia. Fuel Oil. [Internet]. Anonymous. [Cited 2014 Mar 12]. Available at:
http://en.wikipedia.org/wiki/Fuel_oil.
[6] CyberShipping Corporation. Fuel Oil (ASTM D396-86). [Internet] Pusan, Korea.
[Cited 2014 Feb 23]. Available at: http://www.bunkering.co.kr/table/dtls-
fuel.htm#ASTM%20Grade
[7] McPhie P. and Caouette A. Analysis in brief: Heavy Fuel oil Consumption in
Canada and Statistics Canada. Ottawa (ON): Manufacturing, Construction and Energy
Division; 2007 Sept. Report No.: 11-621-MIE2007-062. Sponsored by the Department of
Energy.
[8] Huang J, Sathivel S Thermal and rheological properties and the effects of temperature
on the viscosity and oxidation rate of unpurified salmon oil. J Food Eng 2008;89(2):105-
11.
78
[9] Sathivel S Thermal and flow properties of oils from salmon heads. J Am Oil Chem
Soc 2005;82(2):147-52.
[10] Sathivel S, Huang J, Prinyawiwatkul W Thermal properties and applications of the
Arrhenius equation for evaluating viscosity and oxidation rates of unrefined pollock oil. J
Food Eng 2008;84(2):187-93.
[11] Sivaramakrishnan K Determination of higher heating value of biodiesels.
International Journal of Engineering Science and Technology (IJEST) 2011;Vol.3
no.11:7981 - 87.
[12] Brookfield Engineering Laboratories Incoporation. More Solutions to Sticky
Problems: A Guide to Getting More from Your Brookfield Viscometer. Brookfield
Engineering Laboratories, Inc.c2000, Middleboro, (MA). ISO 9001, p.1-54
[13] Rao MA. Rheology of fluid and semisolid foods : principles and applications. 2nd
ed. New York: Springer: c2007.
[14] Patil P Biodiesel Production from Waste Cooking Oil Using Sulfuric Acid and
Microwave Irradiation Processes. Journal of environmental protection (Irvine, Calif.)
2012;3(1):107-113.
[15] Schmidt F P Fuel Oil Manual. New York: Industrial Press Inc., 1969.
[16] Wiedermann LH Degumming, refining and bleaching soybean oil. J Am Oil Chem
Soc 1981;58(3):159; 159,166; 66.
[17] B.‐S. Chiou, H. M. El‐Mashad, R. J. Avena‐Bustillos, R. O. Dunn, P. J. Bechtel, T.
H. McHugh, S. H. Imam, G. M. Glenn, W. J. Orts, R. Zhang Biodiesel from waste
79
salmon oil. American Society of Agricultural and Biological Engineers 2008;51(3):797-
802.
[18] Hellı´n LC CM Incidence of frying in the composition of the lipid fraction of several
snacks of generalized consumption in our country. Anal. Bromatol. 1984;36:5-31.
[19] Araujo KLGV, Epaminondas PS, Silva MCD, Lima AEA, Rosenhaim R, Maia AS,
et al. Influence of thermal degradation in the physicochemical properties of fish oil.
Journal of Thermal Analysis and Calorimetry 2011;106(2):557-61.
[20] Jayasinghe P, Adeoti I, Hawboldt K A Study of Process Optimization of Extraction
of Oil from Fish Waste for Use as A Low-Grade Fuel. J Am Oil Chem Soc
2013;90(12):1903-15.
[21] Lance RC, Barnard Jr. AJ, Hooyman JE Measurement of flash points: Apparatus,
methodology, applications. J Hazard Mater 1979;3(1):107-19.
[22] Sanford SD, White JM, Shah PS, Wee C, Valverde MA, and Meier GR. Feedstock
and Biodiesel Characteristics. Ames ( IA): Renewable Energy Group Inc.,
www.regfuel.com. 2009 Nov.
[23] U.S. Coast Guard, Department of Transportation. CHRIS - Hazardous chemical
data. Volume 2. Washington, D.C.: U.S. Government Printing Office, c1984.
[24] Behcet R A comparative study on anchovy fish oil, anchovy fish oil methyl ester
and diesel fuels in a diesel engine. Energy education science and technology part a-
energy science and research 2011;27(2):313-22.
[25] Detwiler Jr.SB, Markley KS Smoke, flash, and fire points of soybean and other
vegetable oils. Oil & Soap. 1940;17(2):39-40.

80
[26] Huang J, Sathivel S Purifying salmon oil using adsorption, neutralization, and a
combined neutralization and adsorption process. J Food Eng 2010;96(1):51-8.
[27] BYK Additives and Instruments. Anonymous Rheology Additives: Increasing
viscosity - Pseudoplastic rheology additives ; Accessed on February 26th 20142014
[28] Karazhiyan H, Razavi SMA, Phillips GO, Fang Y, Al-Assaf S, Nishinari K, et al.
Rheological properties of Lepidium sativum seed extract as a function of concentration,
temperature and time. Food Hydrocoll 2009;23(8):2062-8.
[29] Ushakov S, Valland H, Æsøy V Combustion and emissions characteristics of fish oil
fuel in a heavy-duty diesel engine. Energy Conversion and Management 2013;65(0):228-
38
[32] ASTM Standard D93, 2008. Standard Test Methods for Flash Point by Pensky-
Martens Closed Cup Tester. ASTM International, West Conshohocken (PA) 2008.
[33] ASTM Standard D2015, 1996. Standard Test Method for Gross Calorific Value of
Solid Fuel by the Adiabatic Bomb Calorimeter. ASTM International, Washington (DC)
1996.

81
CHAPTER 4
SOLUBILITY MEASUREMENT, EXPERIMENTAL AND MASS
TRANSFER MODELING OF SALMON PROCESSING WASTE
USING SC-CO2
Ibraheem A. Adeoti*, Kelly Hawboldt.
Department of Oil and Gas Engineering, Faculty of Engineering and Applied Sciences,
Memorial University of Newfoundland St.John’s, NL A1B 3X5, Canada.

82
Abstract
The method of extraction of oil for fuel from fish waste will determine the quality and
applicability of the fuel. In this study, supercritical carbon dioxide extraction (SC-CO2)
was studied as a method to recover oil from salmon waste. Experiments at pressures of
15, 25, and 35 MPa, temperatures of 313, 333 and 353 K, and CO2 flow rates of 0.18–
0.48 kg/hr were conducted and the yield compared. The yields at 35 MPa, temperatures
of 313, 333 and 353 K, and CO2 flow rates of 0.18 kg/hr were approximately 39, 46 and
41 (wt.%). A process model based on intra-particle diffusion (De) and external mass
transfer of fish oil (kf) is presented for the supercritical extraction process. The adsorption
equilibrium constant (K) is determined by fitting the theoretical extraction curve to the
experimental data. The model using the best fit of theoretical extraction curve correlated
the experimental data satisfactorily with AAD (%) ranged from 2.4 to 10.6 %.
The experimental and the mathematical model of SC-CO2 extraction has been published
in the journal of Supercritical Fluids. Mr. Ibraheem Adeoti is the lead author and Dr.
Kelly Hawboldt is co-author. Mr. Adeoti's contributions to this paper include the
following:
Wrote the paper
Performed all the laboratory testing and analyses (except where noted)
Conducted all data processing and interpretation of results
Performed all literature searches required for background information
Dr. Hawboldt provided technical guidance and editing of the manuscript.
83
Nomenclature
Abbreviations
AAD Average absolute deviation
CASD Center for aquaculture and seafood development
CO2 Carbon dioxide
DHA Docosahexaenoic acid
EPA Eicosapentaenoic acid
EOS equation of states
SCE Supercritical carbondioxide extraction
SC-CO2 Supercritical carbondioxide
SFE Supercritical fluid extraction
Symbols
pa Specific surface area (m-1
)
A constant defined by eq. (25) (-)
b constant defined by eq. (26) (-)
Ab bed cross sectional area (m2)
c constant defined by eq. (27) (-)
fc solute concentration in the solvent phase (kg/m3)
pc solute concentration within the particle pore (kg/m3) cp
psc solute concentration in pore space at the particle surface (kg/m3)
sc solute concentration in the particle (kg/m3)
84
0c solute concentration in the pore phase at t = 0 (kg/m3)
0sc solute concentration in the solid phase at t = 0 (kg/m3)
0fc total solute concentration (kg/m3)
pd particle diameter or thickness of the slab (m)
Dab binary diffusion coefficient (m2/s)
De effective intraparticle diffusion coefficient (m2/s)
F cumulative fraction of solute extracted (-)
ka adsorption rate constant (1/s)
fk external mass transfer coefficient (m/s)
kg global mass transfer coefficient (m/s)
K adsorption equilibrium constant (-)
L length of the bed (m)
2QCO CO2 volumetric flow rate (m
3/s)
r radial position in spherical particle (m)
R radius of spherical particle (m)
t time (s)
Us superficial velocity (m/s)
x dimensionless solute concentration in effluent (-)
x0 initial solute mass ratio in the solid phase (-)
xp dimensionless solute concentration in pore (-)
xs dimensionless solute concentration in solid phase (-)

85
y solute mass ratio in the fluid phase (kg/kg)
z bed length coordinate (m)
bed void fraction (-)
particle porosity (-)
dimensionless mass transfer coefficient (-)
dimensionless time (-)
s solid density without void fraction of the solid matrix (kg/m3)
2CO CO2 density (kg/m3)
total bed volume (m3)/volumetric flow rate (s)
particle geometry factor
particle geometry parameter
86
4.1 Introduction
Supercritical fluid extraction (SFE) is an alternative to conventional separation processes
in the recovery of essential oils from plants and animal tissue. SFE using CO2 (SC-CO2)
typically results in a high purity product and free of toxic solvent compared to
conventional solvent extraction processes [1-3]. SC-CO2 has a high organic diffusivity, is
a relatively inexpensive solvent, and is nonflammable. In the SFE process the fluid is at
its critical temperature and pressure, where it exhibits gas like viscosities and liquid like
densities. Several investigators have explored SFE using carbon dioxide (CO2) for the
extraction of edible/nutraceutical oils from plant and animal products (e.g. peach almond
seed [4,5], sunflower seed [6,7], canola [8], spearmint leaf [9], sesame seed [10],
peppermint [11], aromatic plant [12], vetiver root [13], hazelnut [3], ginger [14], and fish
[15-21]).
Fish processing facilities generate a significant amount of fish by-products that could be
an important source of energy, food, or industrial feedstock. While fish oil is a natural
source of omega-3 polyunsaturated fatty acids (mostly eicosapentaenoic acid (EPA), and
docosahexaenoic acid (DHA)) used in nutritional supplements, the ability to extract,
refine, and get to market may be challenging at processing facilities where there is
limited infrastructure and plants are remotely located. Further, regulatory roadblocks of
using oil from waste in food/drugs may be an issue. Under these conditions, extraction of
oil from fish by-product for use as an in-house or as a regional fuel may be more
sustainable. Processes to extract and refine fish oil for fuel are less energy intensive than
the processes for nutritional quality oils and do not require the stringent product
87
specifications and approval process as in the food and pharmaceutical industry [22].
Unlike food crops, extraction of oil from fish residue does not negatively impact food
production [22]. Fish oils from fish wastes are increasingly being used either as stand-
alone or in blends with petroleum based fuels. The bio-oil composition and thermal and
physical properties are a function of the feedstock and the degree of processing of the
crude bio-oil.
Mathematical modelling of separation processes is critical in predicting process behavior,
design of the process, and subsequent scale up [16,23]. In large scale SFE processes the
solute concentration profiles in the solid and fluid phase are difficult to measure due to
cost and the issues associated with sampling continuously in a high pressure system [23].
A process model based on experimental data could be used as a tool in scale-up and
optimization of a SC-CO2 process. Several models have been proposed for the SFE of
fixed bed of solid substrate based on empirical kinetic equations [24-26]. The advantages
of kinetic models are their simplicity and ability to describe the kinetics of an extraction
profile very precisely. Kinetic studies have been used in the SFE of biomass [8,27-29].
del Valle et al., [24] presented a review of kinetic and equilibrium models of SFE
processes. For scale up and design purposes, the kinetic models are not adequate as they
fail to provide the description of underlying mass transfer phenomena and in these cases
mass balance models can be used [24,26,30]. Many researchers have investigated mass
balance models for SFE of a solute from fixed bed of solid substrate and del Valle et al.,
[24] provides a comprehensive review. Studies relevant to this work are summarized in
Table 4.1. As Table 4.1 shows, there is little work on the extraction of oil and lipids from

88
animal muscle. In our laboratory, we are investigating SFE using CO2 to extract fish oil
from fish processing waste. There are several challenges with this type of work,
predominantly in the heterogeneity of the waste material as fish species and degree of
fish processing varies based on location and season. In Newfoundland and Labrador,
salmon (Salmo salar Linnaeus) is harvested and processed. The high oil content and
proximity to waste feedstock made this an ideal feedstock for our study. Offal (heads,
trimmings and frames) discarded during peeling; cutting and evisceration processes were
obtained from local industries. This study is part of an ongoing research on alternative
fish oil extraction methods beneficial for biofuel application [22], low grade biofuel
process optimization [51], comparison of biofuel quality as a function of oil extraction
methods (currently under review - Fuel Journal), characterization of biofuel blends with
petroleum fractions (currently under review - Fuel Journal), and life cycle analysis (LCA)
of various extraction processes studied (currently being done).
This research study is divided into three folds: (1) fish oil solubility in SC-CO2 was
determined in the equilibrium experiment; (2) the SFE extraction process using CO2
(optimize the SFE process conditions to maximize oil yield under the least intensive
conditions; pressures, temperatures and CO2 consumption); and (3) we developed a
model predicting oil extraction as a function of process conditions.

89
Table 4.1: Examples of experimental and modeling work on supercritical extraction
Reference Substrate Solute Model name
[12] Aromatic plants volatile oil
Grosso et al., and Coelho et al,
model
[11] Peppermint leave Peppermint oil Goto model
[31] Black Pepper Piperine aIE mass transfer model
[32] Black Pepper Piperine Sovova model
[33] Black Pepper Piperine Sovova model
[9] Spearmint leaf Carvone and Limonene bIBC-Diff model
[34] Neem seeds Nimbin Goto Model
[35] Nutmeg seed Nutmeg oil cBIC model
[36] Nutmeg seed Nutmeg oil dSC/ADPF model
[37] Carqueja plant Essential oil Sovova model
[8] Canola seed Canola oil
Unsteady state mass transfer
model
[38]
Sage seed, Celery seed, Coriander
seed Essential oils eIMTC model
[39] Sage seed, Essential oils gLDF/PMMS model
[14] Ginger root Ginger oil fSC model
[40] Lavender flower Essential oil fSC/PF model
[41] Clove buds Essential oil gh
LDF/ADPF model
[42] Clove buds and Vetiver root Essential oil Sovova model
[43] Orange flower Orange flower extract jLDF/PF model
[7] Sunflower seed Essential oil Kinetic model
[44] Sunflower seed Essential oil Desorption model
[45] pennyroyal leaves Essential oil gh
LDF/ADPF

90
[46] Marigold, fennel and chamomile Essential oil Micro scale model
[47] Plane tree leaf Mannitol
Axial dispersion/ Freundlich
isotherm
[13] Vetiver root Essential oil Axial dispersion
Animal/animal products
[48] Egg yolk Lipids Goto model
[16] Mackerel Fish oil aIE/diffusion model
[19] Trout powder Fatty acids Diffusion model
[49] Cow brain Cholesterol Fick's diffusion model
[17] Sardine Lipids N/A
[21] Mackerel Essential oil N/A
[50] Pigskin Fat N/A aIE-internal +external mass transfer;
bIBC-Diff-intact and broken cell diffusion;
cBIC-broken and intact cell;
dSC/ADPF-
shrinking core/adsorption-desorption plug flow; eIMTC-internal mass transfer control;
fSC/PF-shrinking core/plug flow;
gLDF/PMMS-linear driving force/perfectly mixed multi-stages;
hADPF-Adsorption-desorption plug flow;
jLDF/PF-linear
driving force/plug flow.

91
4.2 Mathematical modeling
Freeze-dried salmon offal is made up of protein, bone meal, and moisture and a lipid-oil
mixture. The lipid-oil mixtures are the extractable components and can be treated as a
single (pseudo-solute) substance. The general mass transfer equations for the SFE
processes proposed by Akgerman et al. [52], de Valle et al., [24] and de Valle et al. [53]
are similar to mass transport operations involving solid-fluid processes, such as
adsorption, desorption, and leaching. The models comprise of two differential solute
mass balances on the solvent and solid phases. It also incorporates local equilibrium
adsorption that describes the relationship between solute and solid [34]. The extraction
model in this work is based on the model first developed by Goto et al. [11] for the
prediction of essential oil extraction from peppermint leaves. Duford et al. [16] used the
Goto et al. model to determine the cumulative fraction of edible oil from Atlantic
mackerel at different moisture content and Mongkholkhajornsilp et al. [34] also used the
model proposed by Goto et al. for the correlation of nimbin extraction from neem seeds.
Rai et al. [25] compared Goto et al. model with models proposed by Reverchon, Marrone,
Sovova and Goodarznia. The local adsorption equilibrium model proposed by Goto et al.
[8] was found most suitable for our process as it addresses intra-particle diffusion and
external mass transfer of SFE in a fixed solid bed.
The fixed bed of salmon offal particle containing the oil is defined as the stationary
(solid) phase with flowing SC-CO2 as the mobile (fluid) phase, with assumptions that:
(i) the solid particle is porous,
(ii) axial and radial dispersions are negligible,

92
(iii) the process is isobaric and isothermal,
(iv) local equilibrium adsorption exists between solute and solid in pores of fish
particle,
(v) solute interaction in the fluid or solid phase is negligible,
(vi) the SC-CO2 physical properties (such as viscosity and density) are constant.
The solute concentration, cf, in the fluid phase in a packed bed depends on the rate of
mass transfer from particles along the length of the bed, the fluid flow rate, and extent of
mixing. Eq. (1) is obtained by taking a mass balance around an element of bed length
as shown in Fig.4.1 [24]. The differential solute mass balance for the SC-CO2
surrounding the fish particle in the packed bed is given as:
(1 ) ( )f f
p f ps f
t
c cU a k c c
z
(1)
Where fc and psc are solute (oil) concentration in the bulk SC-CO2 phase and in the pore
at the particle surface respectively and fk is the external mass transfer coefficient of the
particle, pa is the specific surface area of the particle and is defined as the elemental, the
bed packing characteristics, and solid substrate particle internal structure.
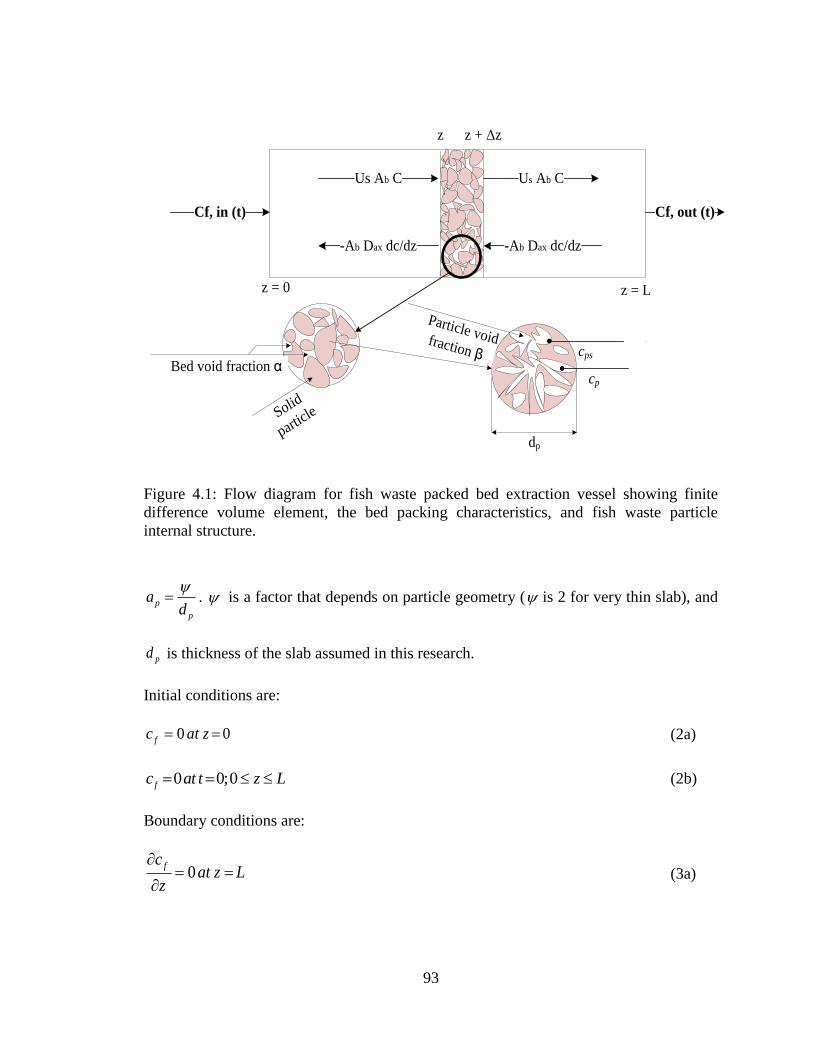
93
z z + Δz
z = 0 z = L
Bed void fraction α
Solid
particl
e
Particle void fraction β
dp
cps
cp
Cf, in (t) Cf, out (t)
Us Ab C Us Ab C
-Ab Dax dc/dz -Ab Dax dc/dz
Figure 4.1: Flow diagram for fish waste packed bed extraction vessel showing finite
difference volume element, the bed packing characteristics, and fish waste particle
internal structure.
p
p
ad
. is a factor that depends on particle geometry ( is 2 for very thin slab), and
pd is thickness of the slab assumed in this research.
Initial conditions are:
0 0fc at z (2a)
0 0;0fc at t z L (2b)
Boundary conditions are:
0fc
at z Lz
(3a)

94
; 0f
ax f
cD Uc at z for all t
z
(3b)
The differential solute mass balance in the solid phase is:
2
2(1 )
p p sc c c
Det r t
(4)
Where pc and sc are the solute concentration in pores within particle and at the solid
phase of particle respectively.
Initial conditions are:
0 0,0pc c at t r R (5a)
0 0,0s sc c at t r R (5b)
Boundary conditions are:
(c ),p
f f ps
cDe k c at r R for all t
r
(6a)
0, 0pc
at r for all tr
(6b)
0 0 0(1 )f p sc c c (6c)
Where De is the effective intra-particle diffusion coefficient and dp is the thickness of
thin slab particle. The linear driving force (LDF) approximation for mass transfer from
substrate to the SC-CO2 is assumed to be valid when the residual solute concentration
profile in the partially extracted solid substrate is approximately parabolic. The LDF
approximation (Eq. 7a) was then used to combine internal and external mass process as
[25,34,52]:
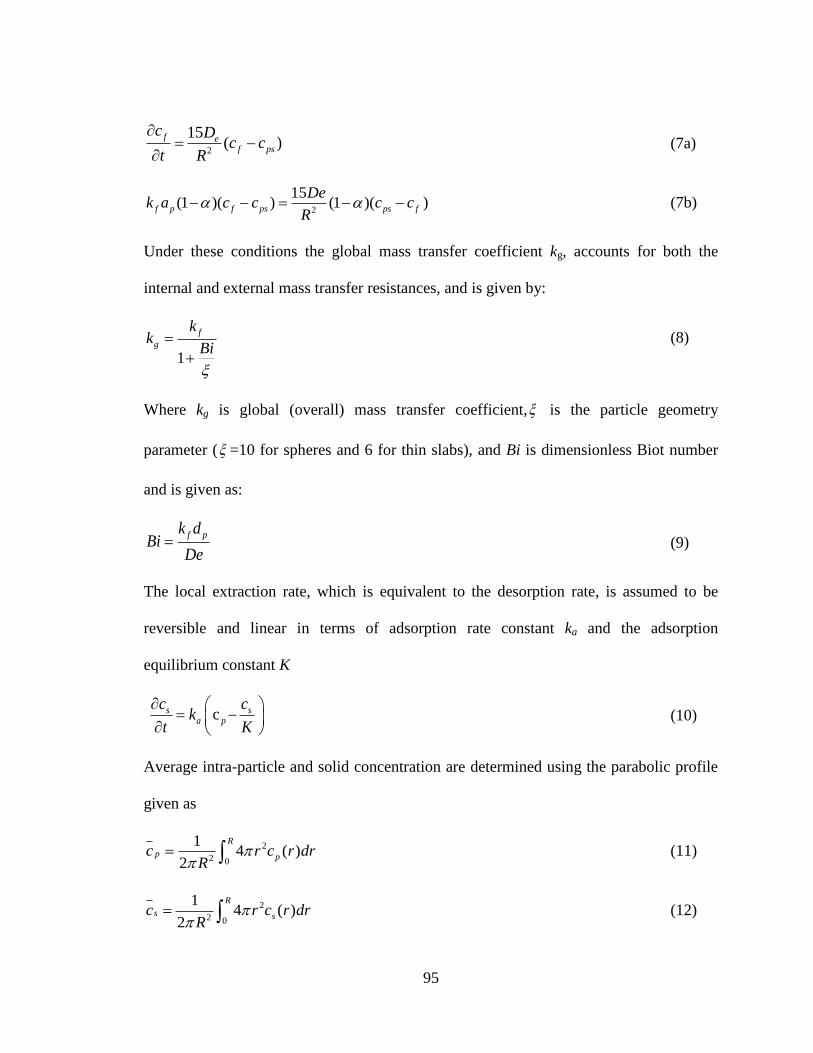
95
2
15( )
f ef ps
c Dc c
t R
(7a)
2
15(1 )( ) (1 )(f p f ps ps f
Dek a c c c c
R ) (7b)
Under these conditions the global mass transfer coefficient kg, accounts for both the
internal and external mass transfer resistances, and is given by:
1
f
g
kk
Bi
(8)
Where kg is global (overall) mass transfer coefficient, is the particle geometry
parameter ( =10 for spheres and 6 for thin slabs), and Bi is dimensionless Biot number
and is given as:
f pk dBi
De (9)
The local extraction rate, which is equivalent to the desorption rate, is assumed to be
reversible and linear in terms of adsorption rate constant ka and the adsorption
equilibrium constant K
cs sa p
c ck
t K
(10)
Average intra-particle and solid concentration are determined using the parabolic profile
given as
2
2 0
14 ( )
2
R
p pc r c r drR
(11)
2
2 0
14 ( )
2
R
s sc r c r drR
(12)
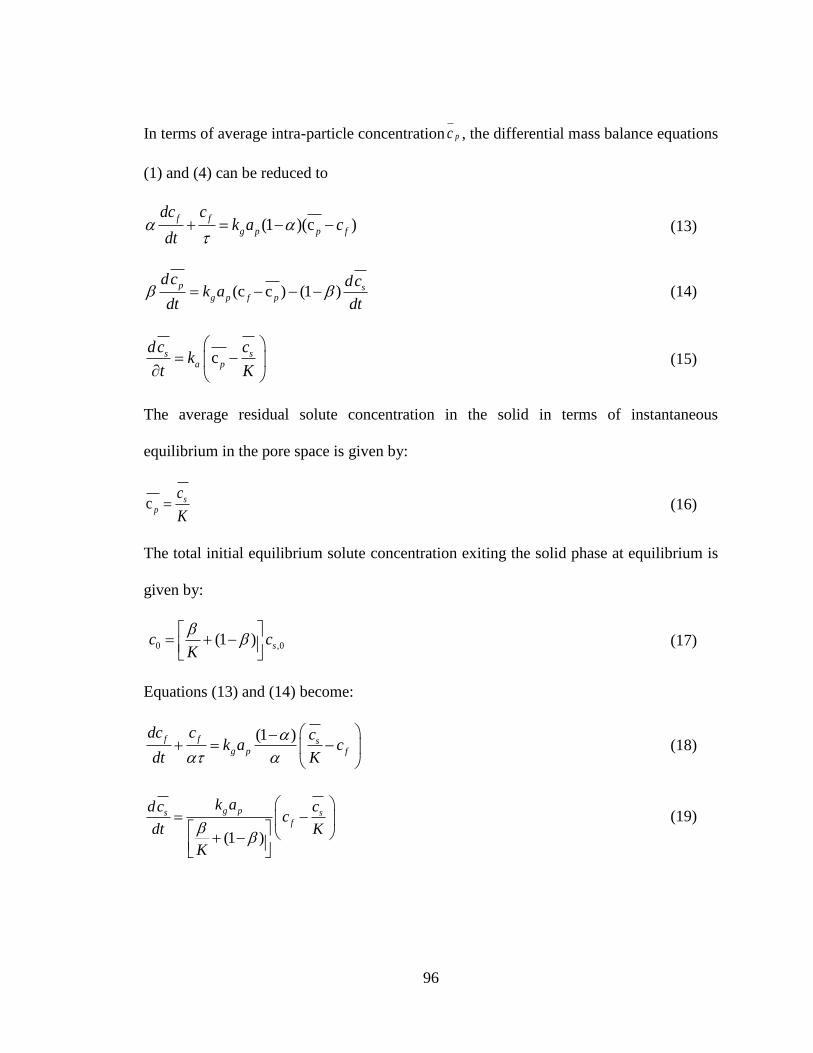
96
In terms of average intra-particle concentration pc , the differential mass balance equations
(1) and (4) can be reduced to
(1 )(c )f f
g p p f
dc ck a c
dt
(13)
(c c ) (1 )p s
g p f p
dc dck a
dt dt (14)
cs sa p
dc ck
t K
(15)
The average residual solute concentration in the solid in terms of instantaneous
equilibrium in the pore space is given by:
c sp
c
K (16)
The total initial equilibrium solute concentration exiting the solid phase at equilibrium is
given by:
0 ,0(1 ) sc cK
(17)
Equations (13) and (14) become:
(1 )f f sg p f
dc c ck a c
dt K
(18)
(1 )
g ps sf
k adc cc
dt K
K
(19)
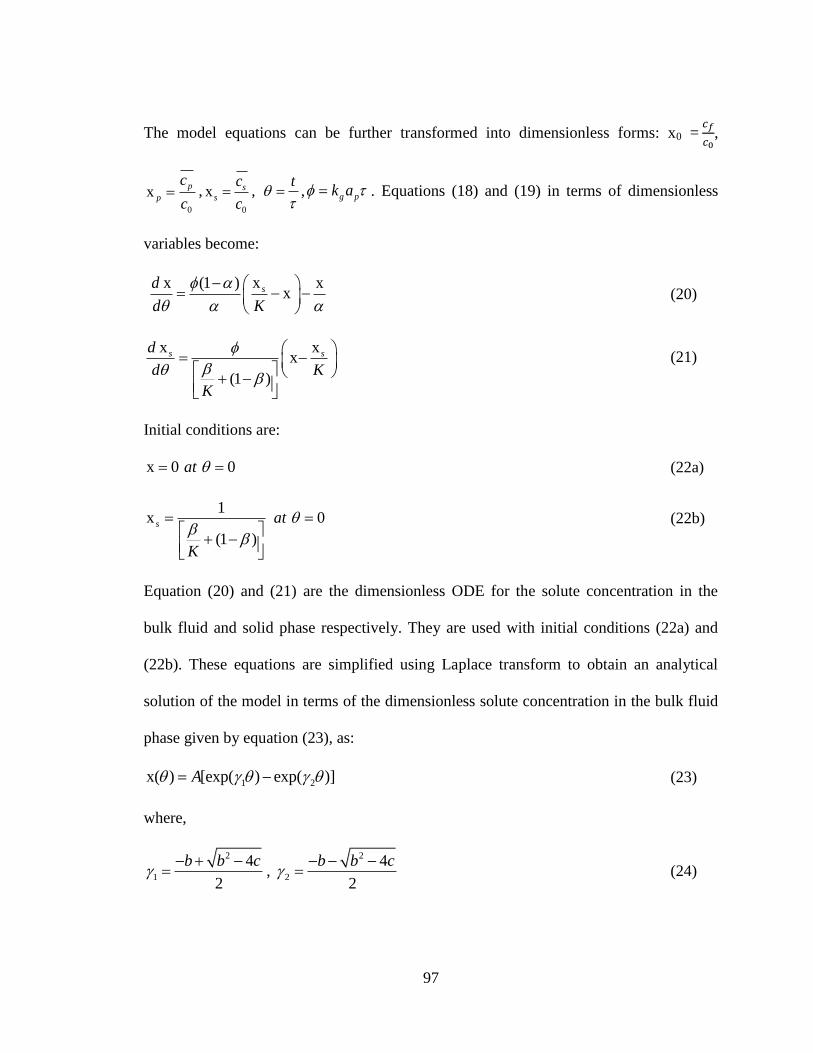
97
The model equations can be further transformed into dimensionless forms: x0 =
,
0
xp
p
c
c ,
0
x ss
c
c ,
t
, g pk a . Equations (18) and (19) in terms of dimensionless
variables become:
xx (1 ) x
xsd
d K
(20)
x xx
(1 )
s sd
d K
K
(21)
Initial conditions are:
x 0 0at (22a)
1x 0
(1 )s at
K
(22b)
Equation (20) and (21) are the dimensionless ODE for the solute concentration in the
bulk fluid and solid phase respectively. They are used with initial conditions (22a) and
(22b). These equations are simplified using Laplace transform to obtain an analytical
solution of the model in terms of the dimensionless solute concentration in the bulk fluid
phase given by equation (23), as:
1 2x( ) [exp( ) exp( )]A (23)
where,
2
1
4
2
b b c
,
2
2
4
2
b b c
(24)

98
1 2
(1 )
[ (1 ) K] ( )A
(25)
(1 ) 1
(1 )b
K
(26)
[ (1 ) ]c
K
(27)
The cumulative fraction of solute extracted up to dimensionless time is given by:
1 2
01 2
exp( ) 1 exp( ) 11( ) x
(1 ) (1 )
AF d
(28)
Equation (28) gives the extraction yield and combined with experimental data to
determine the constants defined by equations (24), (25), (26), and (27). When the mass
transfer resistance is negligible, that is, = , equation (28) reduces to:
( ) 1 exp
(1 ) (1 )F
K
(29)
The mass ratio of the solute in the fluid phase as a function of time can be determined by:
2
1 2
x( ) (1 ) exp expi s
CO
t ty t A
K
(30)
where 2
0
xCO i
i
y
c
The mass of extract at the bed outlet at any time t can be determined by:
2 20( ) (t)Q
t
CO COm t y dt (31)
Combining equations (24) and (25) into equation (31) becomes
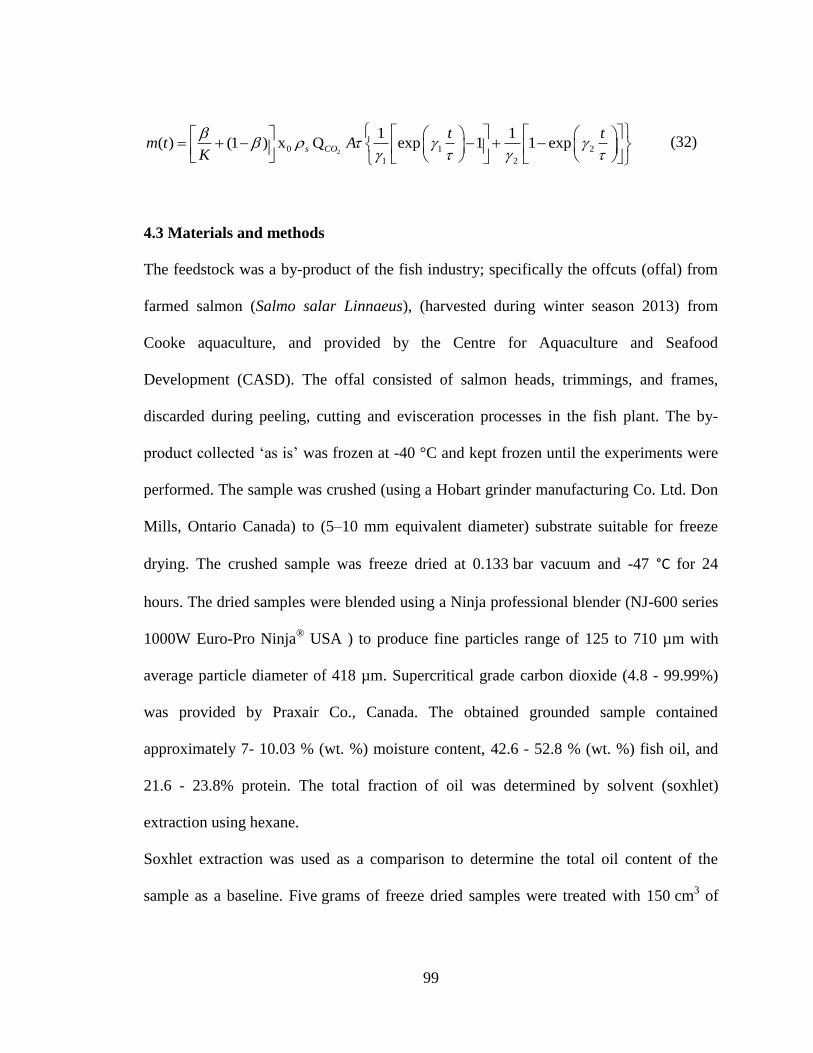
99
20 1 2
1 2
1 1( ) (1 ) x Q exp 1 1 exps CO
t tm t A
K
(32)
4.3 Materials and methods
The feedstock was a by-product of the fish industry; specifically the offcuts (offal) from
farmed salmon (Salmo salar Linnaeus), (harvested during winter season 2013) from
Cooke aquaculture, and provided by the Centre for Aquaculture and Seafood
Development (CASD). The offal consisted of salmon heads, trimmings, and frames,
discarded during peeling, cutting and evisceration processes in the fish plant. The by-
product collected ‘as is’ was frozen at -40 °C and kept frozen until the experiments were
performed. The sample was crushed (using a Hobart grinder manufacturing Co. Ltd. Don
Mills, Ontario Canada) to (5–10 mm equivalent diameter) substrate suitable for freeze
drying. The crushed sample was freeze dried at 0.133 bar vacuum and -47 °C for 24
hours. The dried samples were blended using a Ninja professional blender (NJ-600 series
1000W Euro-Pro Ninja®
USA ) to produce fine particles range of 125 to 710 µm with
average particle diameter of 418 µm. Supercritical grade carbon dioxide (4.8 - 99.99%)
was provided by Praxair Co., Canada. The obtained grounded sample contained
approximately 7- 10.03 % (wt. %) moisture content, 42.6 - 52.8 % (wt. %) fish oil, and
21.6 - 23.8% protein. The total fraction of oil was determined by solvent (soxhlet)
extraction using hexane.
Soxhlet extraction was used as a comparison to determine the total oil content of the
sample as a baseline. Five grams of freeze dried samples were treated with 150 cm3 of
100
hexane for 8 hours using (Pyrex glass soxhlet apparatus). The extracted oil was
evaporated under vacuum at 65 °C using a rotary evaporator and then dried in the oven at
40 °C for 1.5 hours and cooled in desiccators before reweighing.
The experimental setup for the solubility and the supercritical fluid extraction (SFE)
process is shown in Fig. 4.2. The SFE apparatus consisted of Teledyne Isco Syringe
pump D-series (model 260D, Teledyne Isco Inc., USA) fitted with a cooling jacket to
cool the CO2 and equipped with a reservoir to store or deliver liquid CO2. The CO2 was
cooled with a cooling jacket attached to the syringe pump.
4.3.1 Solubility determination
The solubility of fish oil in SC-CO2 was measured by loading crude fish oil adhered to
silica beads (with an average diameter of 3 mm) into the extraction vessel (Penn
Manufacturing Inc., 10,000 Psig @194℉, USA), and the vessel connected to SFE fluid
delivery system (Fig.4.2). The extraction vessel and delivery tubes were wrapped with
heating tape (Omega Engineering, Inc., USA; model HTWC101-010) to keep the system
at the specified temperature. The solubility was performed at temperatures ranging from
313 to 353 K and pressures from 15 to 35 MPa. The liquid CO2 was compressed to the
desired pressure and then pumped to the extractor. Once the specified temperature and
pressure were achieved, the heated flow-restriction valve was closed and this marked the
start of solubility. All experiments were performed in triplicate and conducted with an
equilibrium time of 2 hours, as determined in the preliminary tests. After 2 hours the
flow-restriction was opened and oil was recovered in a collector. The cumulative mass of
101
CO2 used in extraction was determined by the gas flow meter and totalizer. The solubility
was determined in each case from the slope of weight of oil collected (g) versus total
weight (g) of CO2 that passed through the pressure column. The same approach was used
to determine the solubility of waste-based oil except that the freeze dried waste was
loaded into the vessel instead of crude oil and silica beads.
4.3.2 Supercritical fluid extraction (SFE)
In each experimental run, 5-8 g of sample (dry basis) was loaded into a 13.6 cm3
extraction vessel (I.D. - 1.974 x 10⁻²
m, height – 4.46 x 10⁻²
m, Penn Manufacturing Inc.,
10,000 Psig @194℉, USA), and the vessel connected to SFE fluid delivery system. The
extraction vessel and delivery tubes were wrapped with heating tape (Omega
Engineering, Inc., USA; model HTWC101-010) to keep the system at the specified
temperature. The extractions were performed at temperatures ranging from 40 to 80 °C
and pressures from 15 to 35 MPa. The liquid CO2 was compressed to the desired pressure
and then continuously pumped to the extractor at the specified flow (0.18-0.48 kg/hr).
Once the specified temperature and pressure were achieved, the heated flow-restriction
valve was opened and this marked the start of extraction. The exiting fluid stream with
fish oil flowed at a constant flow rate, and was depressurized in a collector. The tubing
and separator were washed with hexane at the end of each run to collect all extracted oil
not recovered during the experiment. The cumulative mass of CO2 used in extraction was
determined by the gas flow meter and totalizer – XFM series (Aalborg Instruments &
Controls, Inc. USA). The collected extracts were weighed at the end of each experiment,
and stored in a freezer at -30 °C. Each experiment was carried out for 120 minutes and
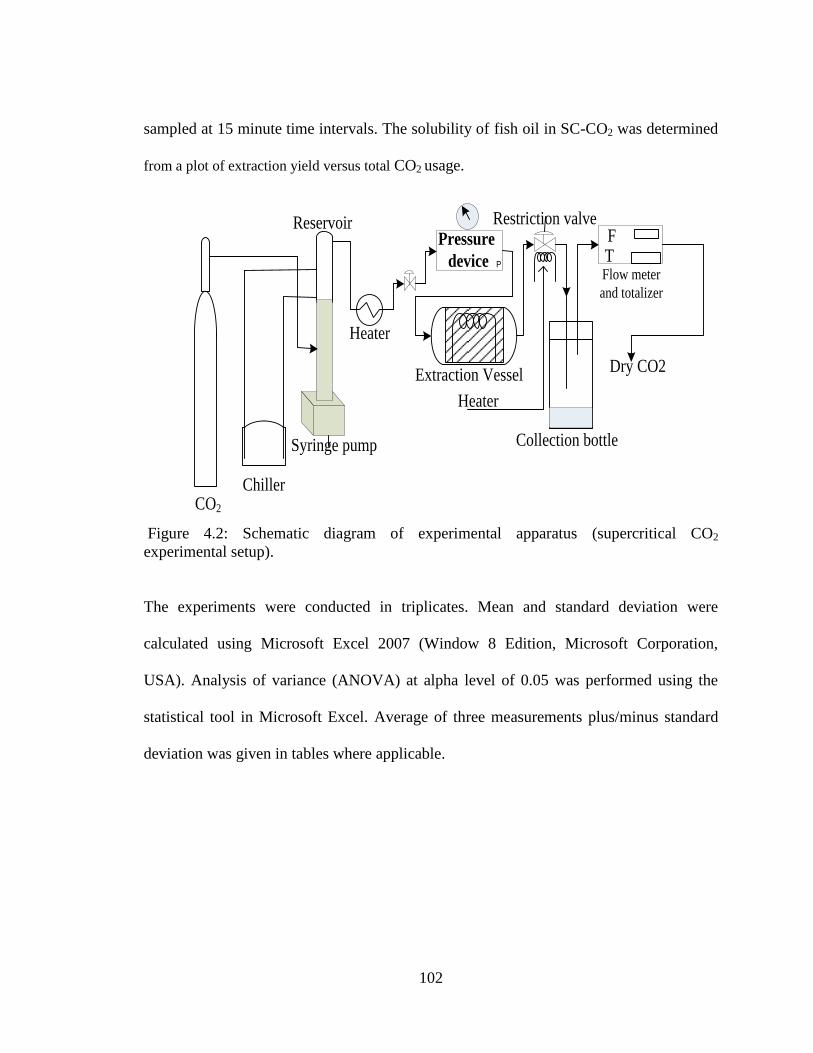
102
sampled at 15 minute time intervals. The solubility of fish oil in SC-CO2 was determined
from a plot of extraction yield versus total CO2 usage.
CO2
Chiller
Extraction Vessel
Reservoir
P
Pressure
device
Collection bottle
F
Flow meter
and totalizer
TF
Heater
Syringe pump
Restriction valve
Dry CO2
Heater
Figure 4.2: Schematic diagram of experimental apparatus (supercritical CO2
experimental setup).
The experiments were conducted in triplicates. Mean and standard deviation were
calculated using Microsoft Excel 2007 (Window 8 Edition, Microsoft Corporation,
USA). Analysis of variance (ANOVA) at alpha level of 0.05 was performed using the
statistical tool in Microsoft Excel. Average of three measurements plus/minus standard
deviation was given in tables where applicable.
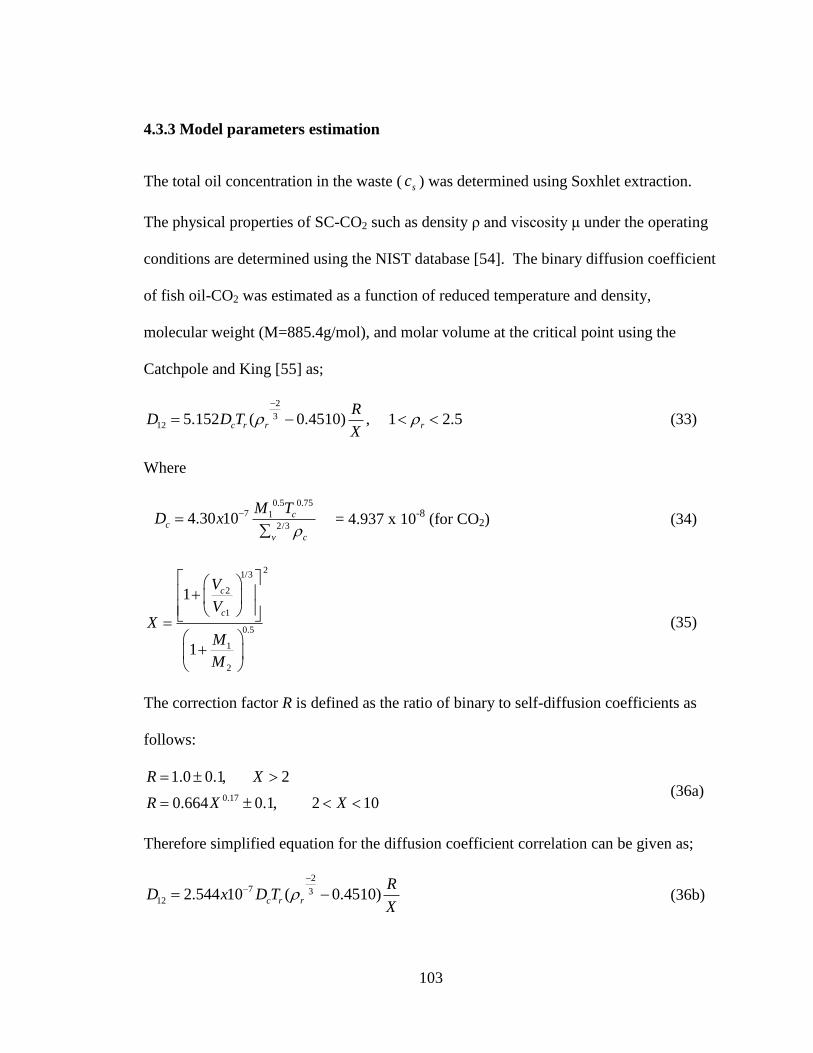
103
4.3.3 Model parameters estimation
The total oil concentration in the waste ( sc ) was determined using Soxhlet extraction.
The physical properties of SC-CO2 such as density ρ and viscosity μ under the operating
conditions are determined using the NIST database [54]. The binary diffusion coefficient
of fish oil-CO2 was estimated as a function of reduced temperature and density,
molecular weight (M=885.4g/mol), and molar volume at the critical point using the
Catchpole and King [55] as;
2
312 5.152 ( 0.4510) , 1 2.5c r r r
RD D T
X
(33)
Where
0.5 0.757 1
2/34.30 10 c
c
v c
M TD x
= 4.937 x 10⁻⁸
(for CO2) (34)
21/3
2
1
0.5
1
2
1
1
c
c
V
VX
M
M
(35)
The correction factor R is defined as the ratio of binary to self-diffusion coefficients as
follows:
0.17
1.0 0.1, 2
0.664 0.1, 2 10
R X
R X X
(36a)
Therefore simplified equation for the diffusion coefficient correlation can be given as;
2
7 312 2.544 10 ( 0.4510)c r r
RD x D T
X
(36b)
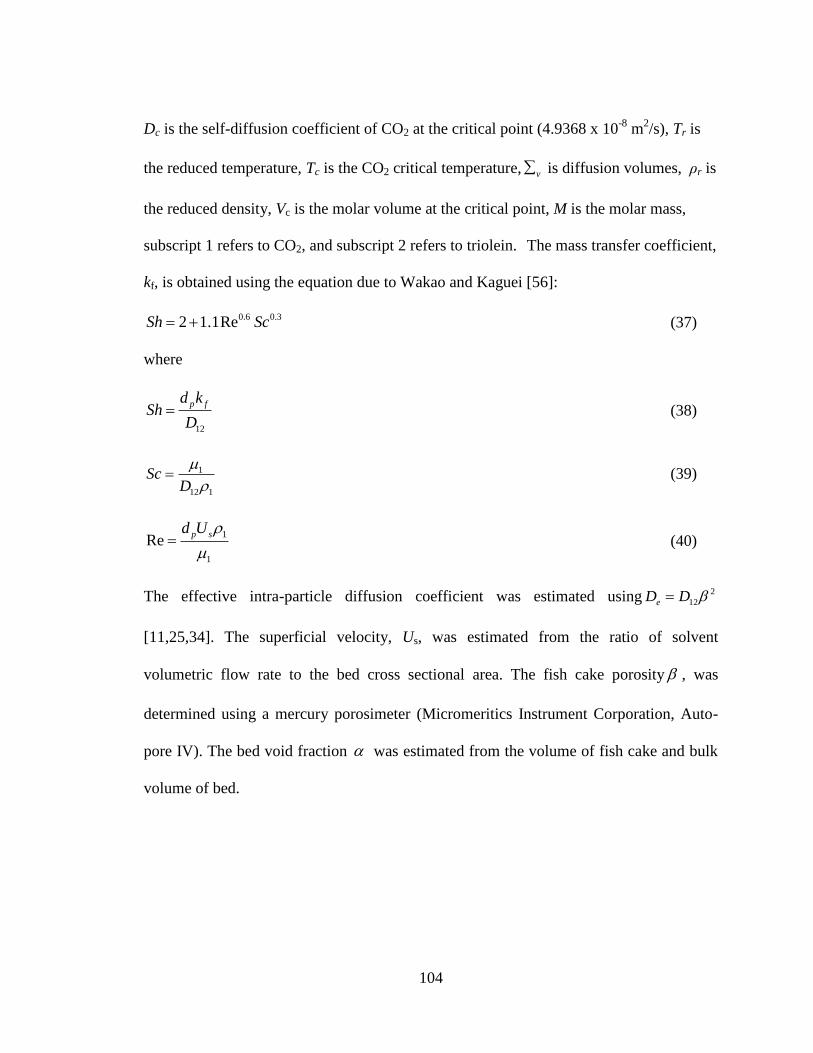
104
Dc is the self-diffusion coefficient of CO2 at the critical point (4.9368 x 10⁻⁸
m2/s), Tr is
the reduced temperature, Tc is the CO2 critical temperature, v is diffusion volumes, ρr is
the reduced density, Vc is the molar volume at the critical point, M is the molar mass,
subscript 1 refers to CO2, and subscript 2 refers to triolein. The mass transfer coefficient,
kf, is obtained using the equation due to Wakao and Kaguei [56]:
0.6 0.32 1.1ReSh Sc (37)
where
12
p fd kSh
D (38)
1
12 1
ScD
(39)
1
1
Rep sd U
(40)
The effective intra-particle diffusion coefficient was estimated using 2
12eD D
[11,25,34]. The superficial velocity, Us, was estimated from the ratio of solvent
volumetric flow rate to the bed cross sectional area. The fish cake porosity , was
determined using a mercury porosimeter (Micromeritics Instrument Corporation, Auto-
pore IV). The bed void fraction was estimated from the volume of fish cake and bulk
volume of bed.

105
4.4 Results and discussion
4.4.1 Solubility of fish oil
The solubility data of salmon oil in carbon dioxide measured at 313 – 353 K and 15 – 35
MPa were presented in Table 4.2a in comparison with the solubility of other fish and
vegetable oils. The results show that the solubility of the fish oil increased with
increasing pressure at constant temperature (Fig. 4.3) and the effect of temperature on
fish oil solubility is less significant than the effect of pressure. For example, increase in
pressure from 25 to 35 MPa increased the solubility by 10 %, 67% and 210 % at 313, 333
and 353 K respectively. At lower pressure (P ≤ 20MPa) the effect of solvent density
dominated the fish oil solubility (Table 4.2a). When the temperature was increased from
313 to 353 K at 15 MPa, the fish oil solubility decreased from 17 to 8 g oil/kg CO2. At
pressure above 20 MPa, the effect of pressure dominated the effect of solvent density.
The highest value for salmon solubility found in this study was 48.0 g oil/kg CO2 at 35
MPa and 353 K. Catchpole et al. [57] reported the same value for squalene oil at 30 MPa
and 333 K, and Suares et al. [58] reported 51 g oil/kg CO2 for seed oil at 35 MPa and
333K (Table 4.2a).
The solubility values recorded in this study are in agreement with trend reported for
squalene by Catchpole et al. [57], and for seed oil reported by Suares et al. [58]. The
solubility data were correlated using Chrastil [59] equation as follows;
lnS = k ln +
+ b (41)
Where S is the solute solubility (g oil/kg CO2), T is temperature (K), is the density of
pure SC-CO2 (kg/m3), and b and k are adjustable constants that can be evaluated from

106
experimental data. The linear regression of the experimental data yields the equation (42)
as follows;
lnS = 3.142 ln -
– 7.18 (42)
Equation (42) is consistent with those correlated by Catchpole et al. [57], Soares et al.
[58], and Gucülu -Ustundagˇ and Temelli [60] (Table 4.2b).
Figure 4.3: Salmon oil solubility as a function of temperature (K) and pressure (MPa)
0
10
20
30
40
50
60
12 17 22 27 32 37
Solu
bil
ity (
g o
il/k
g C
O2)
Pressure (Mpa)
313K
333K
353K
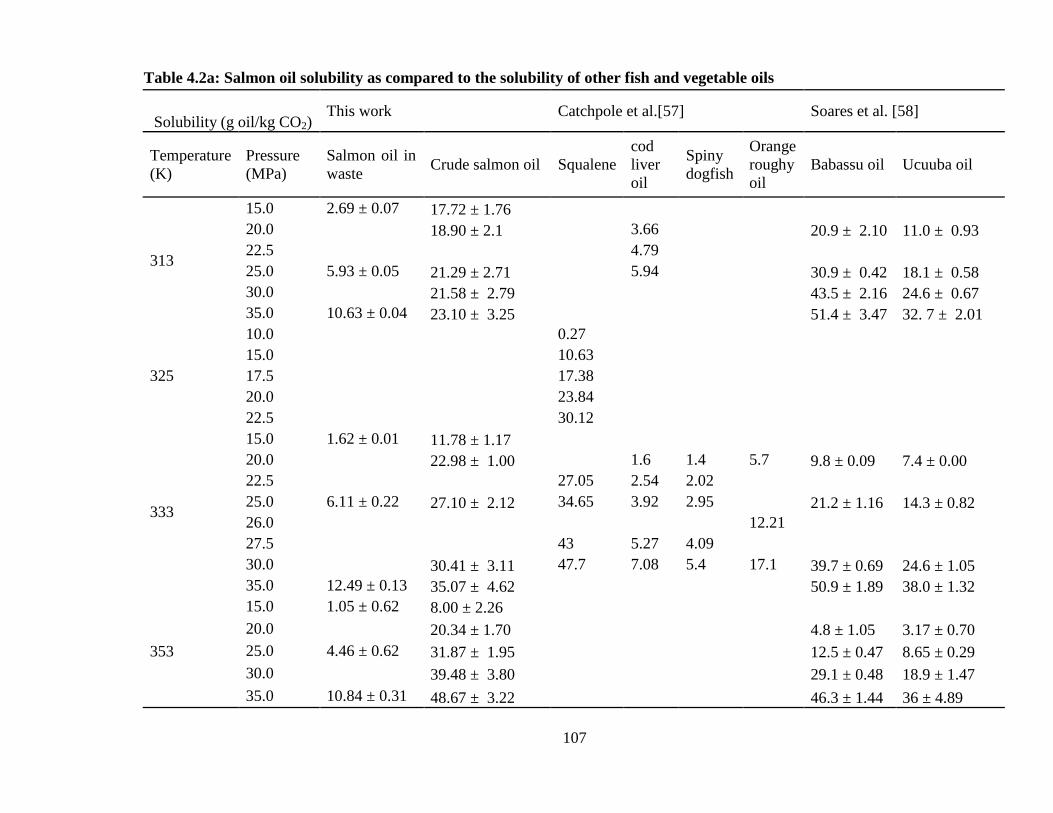
107
Table 4.2a: Salmon oil solubility as compared to the solubility of other fish and vegetable oils
This work Catchpole et al.[57] Soares et al. [58]
Solubility (g oil/kg CO2)
Temperature
(K)
Pressure
(MPa)
Salmon oil in
waste Crude salmon oil Squalene
cod
liver
oil
Spiny
dogfish
Orange
roughy
oil
Babassu oil Ucuuba oil
313
15.0 2.69 ± 0.07 17.72 ± 1.76
20.0
18.90 ± 2.1
3.66
20.9 ± 2.10 11.0 ± 0.93
22.5
4.79
25.0 5.93 ± 0.05 21.29 ± 2.71
5.94
30.9 ± 0.42 18.1 ± 0.58
30.0
21.58 ± 2.79
43.5 ± 2.16 24.6 ± 0.67
35.0 10.63 ± 0.04 23.10 ± 3.25
51.4 ± 3.47 32. 7 ± 2.01
325
10.0
0.27
15.0
10.63
17.5
17.38
20.0
23.84
22.5
30.12
333
15.0 1.62 ± 0.01 11.78 ± 1.17
20.0
22.98 ± 1.00
1.6 1.4 5.7 9.8 ± 0.09 7.4 ± 0.00
22.5
27.05 2.54 2.02
25.0 6.11 ± 0.22 27.10 ± 2.12 34.65 3.92 2.95
21.2 ± 1.16 14.3 ± 0.82
26.0
12.21
27.5
43 5.27 4.09
30.0
30.41 ± 3.11 47.7 7.08 5.4 17.1 39.7 ± 0.69 24.6 ± 1.05
35.0 12.49 ± 0.13 35.07 ± 4.62
50.9 ± 1.89 38.0 ± 1.32
353
15.0 1.05 ± 0.62 8.00 ± 2.26
20.0
20.34 ± 1.70
4.8 ± 1.05 3.17 ± 0.70
25.0 4.46 ± 0.62 31.87 ± 1.95
12.5 ± 0.47 8.65 ± 0.29
30.0
39.48 ± 3.80
29.1 ± 0.48 18.9 ± 1.47
35.0 10.84 ± 0.31 48.67 ± 3.22 46.3 ± 1.44 36 ± 4.89

108
Table 4.2b: Correlation constants of this work compare to literature values
Solute T (K) K± Standard
error
a± Standard
error
b± Standard
error R2 Reference
Samon oil 313-353 3.142 ± 0.2 -3520.2 -7.1839 0.998 This work
Squalene 314 - 333 7.3 ± 0.2 -4131.0 -33.0 0.9996 [60]
(Babbasu) 313-353 8.4049 -3419.8 -49.546
[58]
Squalene 313 - 333 6.54 -3936.6 -28.28 [57]
109
4.4.2 Dynamic behavior of extraction of fish oil
Fig.4.4 outlines the typical extractive curve (total extracted fish oil (g) versus total SC-
CO2 passed through the column (g)). The initial straight line indicates a constant rate of
fish oil extraction. During the constant rate period, the external surfaces of the solid
particles are likely covered with oil and the SC-CO2 is close to saturation; therefore, fish
oil extraction at this initial period is solubility controlled. This is followed by a transition
period, during which the rate of extraction falls rapidly likely due to depletion of the layer
of oil on the fish particle surface. At this point, the oil extraction rate is mass transfer
controlled. The oil diffusion rate from the interior to the surface of the particles is low
compared to the initial mass transfer rate. Lee et al. [8] reported similar trend for seeds oil
at all extraction conditions tested where the initial constant extraction rate is
characterized by solvent saturation, and is followed by a transition period, during which
the extraction rate falls rapidly.

110
Figure 4.4: Typical extractive curve of experimental data at 0.18 kg/hr., 25 MPa and 353
K.
4.4.3. Goto et al. model compared with experimental data from this work.
Experimental data was compared with predictions from the tuned Goto et al. model. The
errors were quantified by average absolute deviation, (AAD) % as defined below.
AAD (%) =
∑
x 100 (43)
Where N is the number of data points, and are the data obtained
from experiments and model equations respectively. The AAD between the estimated
cumulative extraction yields and experimental data are presented in Table 4.3. The AAD
0.00
0.50
1.00
1.50
2.00
2.50
0.00 100.00 200.00 300.00 400.00 500.00 600.00
Tota
l oil
extr
act
ed (
g)
Total CO2 passed through the extractor (g)
313 K
333 K
353 K
111
for the fit ranged between 2.40 to 10.60 % indicating good match. The model was tested
using a regression analysis of the data. The regression coefficient was 0.99. The
probability was tested at 95 % confidence level and P-value <0.005 in both cumulative
fraction and % yield, which indicate an insignificant deviation between the Goto et al.
model and experimental results.
4.4.4. Effect of operating parameters on extraction yield
The effects of temperature, pressure and solvent flow rate on the calculated cumulative
extraction yield as compared with experimental data are investigated in this section.
4.4.4.1. Effect of temperature on cumulative extraction yield.
Fig. 4.5 summarizes extraction at 313 - 353 K, 35 MPa and 0.18 kg/hr. At constant
pressure, the cumulative extraction yield (F) increases with increasing temperature up to
333 k and drops thereafter. The plot of cumulative extraction yield (F) against time (t)
represents the yield of fish oil at these conditions. As temperature increases, the solubility
of oil in SC-CO2 increases (Table 4.2 and Fig 4.3) due to the increase in oil vapour
pressure. Güçlü-Üstündag and Temelli [61] reported at constant pressure, any increase in
the temperature decreases the solvent density and increases the solute vapor pressure.
From the analysis of Table 4.3, the estimated mass transfer coefficient (kf) increases
slightly with temperature (from 3.68 x 10⁻⁵
m/s at 313K to 5.56 x 10⁻⁵
m/s at 353K) as a
result of increase in molecular diffusivity, as also reported by Rai et al. [25]. Similarly,
the effective diffusivity (De) and the adsorption equilibrium (K) increase with increasing
temperature. Thus the rate of mass transfer of solute to bulk solvent phase increases with
increase in temperature.
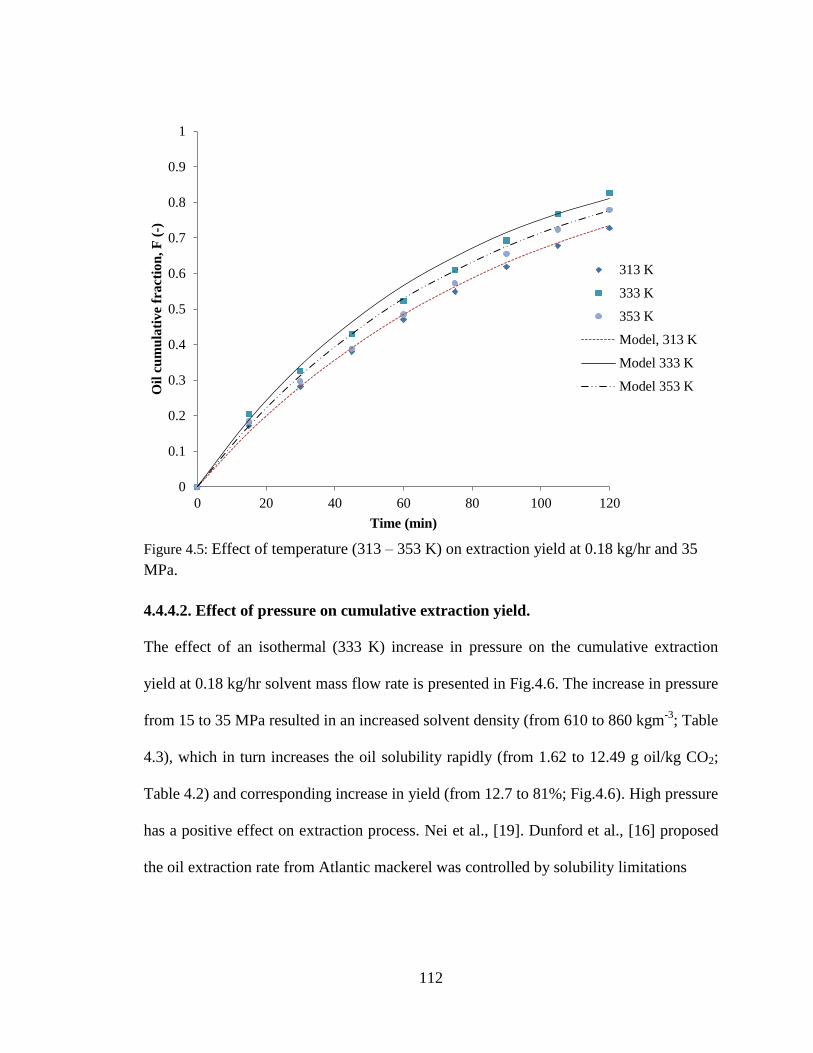
112
Figure 4.5: Effect of temperature (313 – 353 K) on extraction yield at 0.18 kg/hr and 35
MPa.
4.4.4.2. Effect of pressure on cumulative extraction yield.
The effect of an isothermal (333 K) increase in pressure on the cumulative extraction
yield at 0.18 kg/hr solvent mass flow rate is presented in Fig.4.6. The increase in pressure
from 15 to 35 MPa resulted in an increased solvent density (from 610 to 860 kgm-3
; Table
4.3), which in turn increases the oil solubility rapidly (from 1.62 to 12.49 g oil/kg CO2;
Table 4.2) and corresponding increase in yield (from 12.7 to 81%; Fig.4.6). High pressure
has a positive effect on extraction process. Nei et al., [19]. Dunford et al., [16] proposed
the oil extraction rate from Atlantic mackerel was controlled by solubility limitations
0
0.1
0.2
0.3
0.4
0.5
0.6
0.7
0.8
0.9
1
0 20 40 60 80 100 120
Oil
cu
mu
lati
ve
fra
ctio
n, F
(-)
Time (min)
313 K
333 K
353 K
Model, 313 K
Model 333 K
Model 353 K

113
Table 4.3: Experimental conditions and the model process parameters at various for fish oil extraction
x10-9
x10-5
x 10-7
x10-5
x10-6
T (K)
P
(MPa)
ρ
(kg/m3)
De
(m2/s) μ (Pa.S)
Q
(m3/s)
Re
(-) kf
(m/s) Bi (-) kg (m/s) (s) K (-) (-)
AAD
(%) dp (mm)
Effect of temperature
313 35 905 0.677 10.0 0.552 0.68 3.68 22.65 6.66 246.16 192.4 7.83 3.01 0.4175
333 35 860 0.803 8.4 0.581 0.81 4.39 23.82 7.89 233.92 257 8.84 5.13 0.4175
353 35 785 1.02 7.0 0.637 0.97 5.56 22.74 9.99 213.52 306.2 10.22 5.52 0.4175
Effect of pressure
333 15 610 1.44 4.7 0.82 1.45 8.24 23.84 14.29 165.92 3448 11.35 10.60 0.4175
333 25 785 0.96 6.9 0.637 0.99 5.31 23.11 9.44 213.52 895 9.66 6.60 0.4175
333 35 860 0.803 8.4 0.581 0.81 4.39 23.82 7.89 233.92 257 8.84 5.10 0.4175
Effect of flow rate
313 35 905 0.677 10.0 0.552 0.68 3.68 22.65 6.66 246.16 192.4 7.83 3.20 0.4175
313 35 905 0.677 10.0 1.105 1.36 4.80 29.51 6.96 123.08 192.4 4.09 2.40 0.4175
313 35 905 0.677 10.0 1.470 1.81 5.42 33.32 7.07 92.31 192.4 3.12 3.10 0.4175
Effect of particle size
353 35 785 1.02 7.0 0.637 0.23 15.28 15.03 38.14 213.52 306.2 162.88
0.100
353 35 785 1.02 7.0 0.637 0.97 5.56 22.74 9.99 213.52 306.2 10.22 4.41 0.4175
353 35 785 1.02 7.0 0.637 1.66 3.98 27.80 6.07 213.52 306.2 3.65
0.710
353 35 785 1.02 7.0 0.637 2.33 3.26 32.07 4.40 213.52 306.2 1.88
1.000
= 4790.42 m-1
, average particle diameter dp = 0.418 mm, β = 0.463, α = 0.62, and c0 = 0.487 g/g of fish cake.

114
rather than intra-particle diffusion resistance. However, as the pressure increases from 15
to 35 MPa (Table 4.3), the mass transfer coefficient (kf), the effective diffusivity (De) and
the adsorption equilibrium (K) decreased. Rai et al. [25] reported a decrease in the mass
transfer coefficients and the effective diffusivity with increased pressure. The authors
proposed this was due to an increase in the mass transfer resistance with increasing
pressure which shows a negative effect of pressure on extraction. Hence, the increased
cumulative yield observed can be attributed to solubility dominance on the extraction rate
as the pressure increases at constant temperature.
Figure 4.6: Effect of pressure (15 – 35 MPa) on extraction yield at 0.18 kg/hr and 333 k.
0.0
0.1
0.2
0.3
0.4
0.5
0.6
0.7
0.8
0.9
0 20 40 60 80 100 120
Oil
cu
mu
lati
ve
fract
ion
, F
(-)
Time (min)
35 MPa
25 MPa
15 MPa
Model 35 MPa
Model, 25 MPa
Model, 15MPa

115
4.4.4.3. Effect of solvent mass flow rate on cumulative extraction yield.
Fig.4.7 shows the effect of solvent mass flow rate on extraction yield at 35 MPa and 313
K. The cumulative extraction yield, F, increases with an increase in solvent mass flow
rate. As demonstrated in the extraction curves, the extraction rate increases with solvent
surface velocity within the fixed bed (Fig.4.7). The extraction curves moves to the left
along with solvent flow rate, which means that the overall extraction is faster. This is a
result of a higher mass transfer coefficient which dominates over the reduced residence
time. This observation can also be explained by the fact that the mass transfer coefficient
increases with increasing solvent flow rate and thus the solute transferred per unit time to
bulk liquid phase increases, leading to high extraction yield. The analysis of the estimated
model parameters presented in Table 4.3 also shows that despite the decreased resident
time ( ) from 246.16 s to 96.31 s as the CO2 mass flow rate increased from 0.18 to 0.48
kg/hr, the mass transfer slightly increases from 3.68x10⁻⁵
to 5.42 x10⁻⁵
m/s. This is also
true for the dimensionless Reynolds number (Re) which also increased from 0.68 to 1.81.
The increased mass transfer is likely due to better mixing due to increased turbulence.

116
Figure 4.7: Effect of solvent mass flow rate on extraction yield at 313 K and 35MPa.
4.4.4.4. Predicted effect of particle size on cumulative extraction yield.
The effect of particle size (1.0, 0.71, 0.418, and 0.125 mm) on cumulative extraction
yield is shown in Fig.4.8. As particle size increases the cumulative extraction yield
decreases. The grinding process increases surface area and may disrupt the fat cell
membrane, reducing mass transfer resistance, leaving the oil more accessible to the
solvent. Furthermore, the intra-particle diffusion path and diffusion time become shorter
for smaller particle sizes, causing an increase in the rate of diffusion, thus increase oil
extraction yield. This effect may be stronger with smaller particle sizes as observed in
0
0.1
0.2
0.3
0.4
0.5
0.6
0.7
0.8
0.9
1
0 20 40 60 80 100 120
Oil
cu
mu
lati
ve
fra
ctio
n, F
(-)
Time (min)
Experiment 0.18 kg/hr
Experiment 0.36 kg/hr
Experiment 0.48 kg/hr
Model 0.18kh/hr
Model 0.36 kg/hr
Model 0.48 kg/hr
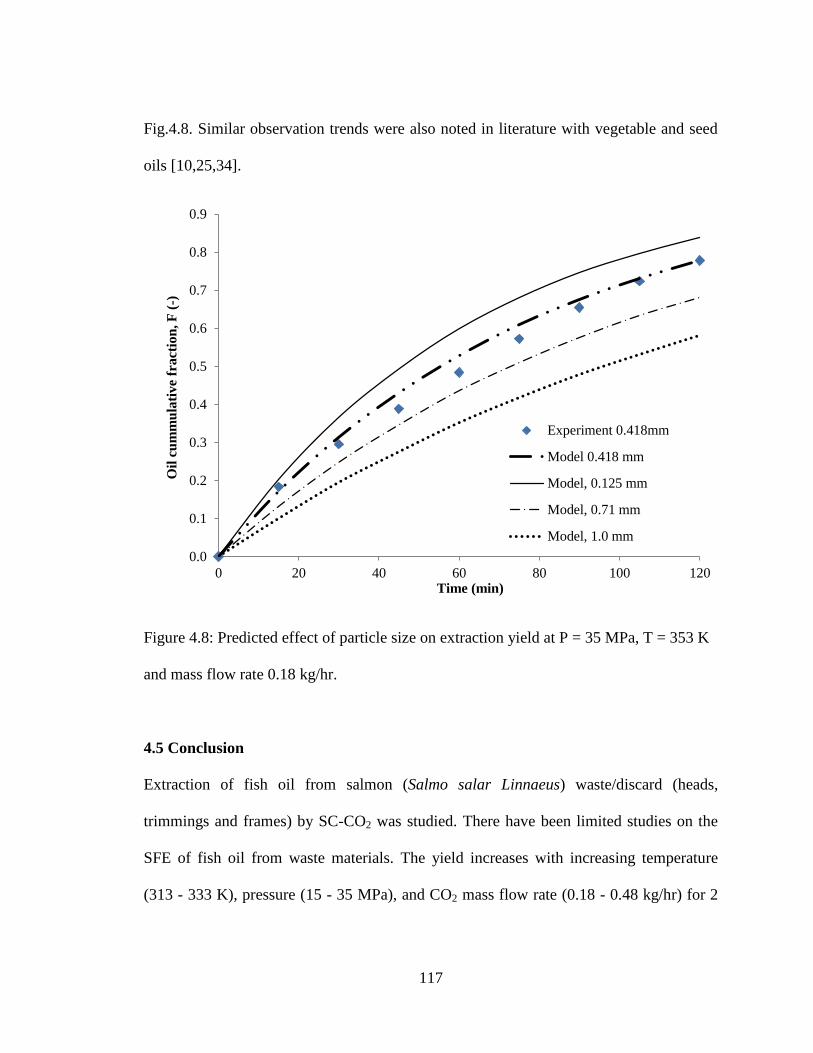
117
Fig.4.8. Similar observation trends were also noted in literature with vegetable and seed
oils [10,25,34].
Figure 4.8: Predicted effect of particle size on extraction yield at P = 35 MPa, T = 353 K
and mass flow rate 0.18 kg/hr.
4.5 Conclusion
Extraction of fish oil from salmon (Salmo salar Linnaeus) waste/discard (heads,
trimmings and frames) by SC-CO2 was studied. There have been limited studies on the
SFE of fish oil from waste materials. The yield increases with increasing temperature
(313 - 333 K), pressure (15 - 35 MPa), and CO2 mass flow rate (0.18 - 0.48 kg/hr) for 2
0.0
0.1
0.2
0.3
0.4
0.5
0.6
0.7
0.8
0.9
0 20 40 60 80 100 120
Oil
cu
mm
ula
tive
fra
ctio
n, F
(-)
Time (min)
Experiment 0.418mm
Model 0.418 mm
Model, 0.125 mm
Model, 0.71 mm
Model, 1.0 mm

118
hours experimental runs. The effect of pressure has a more significant increase in
extraction yield compared to temperature and solvent flow rate. Decreasing particle size
increases extraction yield. Comparison between experimental data and Goto et al. model
produced a good match with AAD (%) ranged from 2.4 to 10.6 % indicating the model
could be used for scale-up and design. Extraction of oil from fish waste could provide the
fish plants or region with a source of locally produced bio-fuel. If the SFE process was
paired with a process (such as a power plant or fish harvester) producing waste CO2 this
could enhance the economics of the process. This is the first stage of a study; the overall
goal of the work is to determine the sustainability of SFE of fish oil from waste using a
life cycle assessment approach. In particular we will evaluate the balance between high
pressures and temperatures (which favor oil extraction) and the costs associated with
these processes. For instance, extracting an extra 1% of oil may not be justified if there
are significant costs associated with a high pressure or temperature.
Acknowledgements
The authors would like to acknowledge the funding provided by the Government of
Newfoundland and Labradors (Green Fund) and, NSERC (Natural Science and
Engineering Research Council of Canada).

119
References
[1] J. Shi, Y. Kakuda, X. Zhou, G. Mittal, Q. Pan, Correlation of mass transfer coefficient
in the extraction of plant oil in a fixed bed for supercritical CO2, J. Food Engineering. 78
(2007) 33-40.
[2] S.G. Özkal, M.E. Yener, L. Bayındırlı, Mass transfer modeling of apricot kernel oil
extraction with supercritical carbon dioxide, J. Supercritical Fluids. 35 (2005) 119-127.
[3] S.G. Özkal, U. Salgın, M.E. Yener, Supercritical carbon dioxide extraction of
hazelnut oil, J. Food Engineering. 69 (2005) 217-223.
[4] N. Mezzomo, J. Martínez, R.S. F. Sandra, Supercritical fluid extraction of peach
(Prunus persica) almond oil: Kinetics, mathematical modeling and scale-up, J.
Supercritical Fluids. 51 (2009) 10-16.
[5] Y. Sánchez-Vicente, A. Cabañas, J.A.R. Renuncio, C. Pando, Supercritical fluid
extraction of peach (Prunus persica) seed oil using carbon dioxide and ethanol, J.
Supercritical Fluids. 49 (2009) 167-173.
[6] G. Andrich, Supercritical fluid extraction in sunflower seed technology, European J.
Lipid Science and Technology. 103 (2001) 151-157.
[7] M. Perrut, J.Y. Clavier, M. Poletto, E. Reverchon, Mathematical Modeling of
Sunflower Seed Extraction by Supercritical CO2, Industrial & Engineering Chemistry
Research. 36 (1997) 430-435.
[8] A.K.K. Lee, N.R. Bulley, M. Fattori, A. Meisen, Modelling of supercritical carbon
dioxide extraction of canola oilseed in fixed beds, J. American Oil Chemists Society 63
(1986) 921; 921-925; 925.

120
[9] K.H. Kim, J. Hong, A mass transfer model for super- and near-critical CO2 extraction
of spearmint leaf oil, Separation Science and Technology. 37 (2002) 2271-2288.
[10] O. Döker, U. Salgin, N. Yildiz, M. Aydoğmuş, A. Çalimli, Extraction of sesame
seed oil using supercritical CO2 and mathematical modeling, J. Food Engineering. 97
(2010) 360-366.
[11] M. Goto, M. Sato, T. Hirose, Extraction of Peppermint Oil by Supercritical Carbon
Dioxide, J. Chemical Engineering of Japan. 26 (1993) 401-407.
[12] C. Grosso, J.P. Coelho, F.L.P. Pessoa, J.M.N.A. Fareleira, J.G. Barroso, J.S. Urieta,
A.F. Palavra, H. Sovová, Mathematical modelling of supercritical CO2 extraction of
volatile oils from aromatic plants, Chemical Engineering Science. 65 (2010) 3579-3590.
[13] M.A.A. Meireles, G. Zahedi, T. Hatami, Mathematical modeling of supercritical
fluid extraction for obtaining extracts from vetiver root, J. Supercritical Fluids. 49 (2009)
23-31.
[14] B.C. Roy, M. Goto, T. Hirose, Extraction of Ginger Oil with Supercritical Carbon
Dioxide: Experiments and Modeling, Industrial & Engineering Chemistry Research. 35
(1996) 607-612.
[15] N.T. Dunford, F. Temelli, E. Le Blanc, Supercritical CO2 Extraction of Oil and
Residual Proteins from Atlantic Mackerel (Scomber scombrus) as Affected by Moisture
Content, J. Food Science. 62 (1997) 289-294.
[16] N.T. Dunford, M. Goto, F. Temelli, Modeling of oil extraction with supercritical
CO2 from Atlantic mackerel (Scomber scombrus) at different moisture contents, J.
Supercritical Fluids. 13 (1998) 303-309.

121
[17] M. M. Esquı vel, N. M. Bandarra, I. ontan, M. G. Bernardo-Gil, I. Batista, M. L.
Nunes, J. A. Empis, Supercritical Carbon Dioxide Extraction of Sardine Sardina
pilchardus Oil, Lebensmittel-Wissenschaft und-Technologie,. Volume 30, (1997) 715-
720.
[18] I. Hardardottir, Extraction of Lipid and Cholesterol from Fish Muscle with
Supercritical Fluids, J. Food Science. 53 (1988)1656-1658.
[19] H.Z.N. Nei, S. Fatemi, M.R. Mehrnia, A. Salimi, Mathematical modeling and study
of mass transfer parameters in supercritical fluid extraction of fatty acids from Trout
powder, Biochemical Engineering J. 40 (2008) 72-78.
[20] N. Rubio-Rodríguez, S.M. de Diego, S. Beltrán, I. Jaime, M.T. Sanz, J. Rovira,
Supercritical fluid extraction of the omega-3 rich oil contained in hake (Merluccius
capensis–Merluccius paradoxus) by-products: Study of the influence of process
parameters on the extraction yield and oil quality, J. Supercritical Fluids. 47 (2008) 215-
226.
[21] F. Sahena, I.S.M. Zaidul, S. Jinap, M.H.A. Jahurul, A. Khatib, N.A.N. Norulaini,
Extraction of fish oil from the skin of Indian mackerel using supercritical fluids, J. Food
Engineering. 99 (2010) 63-69.
[22] I.A. Adeoti, K. Hawboldt, A review of lipid extraction from fish processing by-
product for use as a biofuel, Biomass and Bioenergy J. 63 (2014) 330-340.
[23] S. Lucas, M.P. Calvo, J. García-Serna, C. Palencia, M.J. Cocero, Two-parameter
model for mass transfer processes between solid matrixes and supercritical fluids:
Analytical solution, J. Supercritical Fluids. 41 (2007) 257-266.
122
[24] J. M. Del Valle, J.C. De La Fuente, Supercritical CO2 Extraction of Oilseeds:
Review of Kinetic and Equilibrium Models, Critical Reviews in Food Science and
Nutrition. 46 (2006) 131-160.
[25] A. Rai, K.D. Punase, B. Mohanty, R. Bhargava, Evaluation of models for
supercritical fluid extraction, Int. J. Heat Mass Transfer. 72 (2014) 274-287.
[26] C. Pronyk, G. Mazza, Design and scale-up of pressurized fluid extractors for food
and bioproducts, J. Food Engineering. 95 (2009) 215-226.
[27] M.M. Esquı vel, M.G. Bernardo-Gil, M.B. King, Mathematical models for
supercritical extraction of olive husk oil, J. Supercritical Fluids. 16 (1999) 43-58.
[28] S.N. Naik, H. Lentz, R.C. Maheshwari, Extraction of perfumes and flavours from
plant materials with liquid carbon dioxide under liquid—vapor equilibrium conditions,
Fluid Phase Equilibria. 49 (1989) 115-126.
[29] M. Spiro, M. Kandiah, Extraction of ginger rhizome: Partition constants and other
equilibrium properties in organic solvents and in supercritical carbon dioxide.
International J. Food Science & Technology. 25 (2003) 566-575.
[30] E. Reverchon, I. De Marco, Supercritical fluid extraction and fractionation of natural
matter, J. Supercritical Fluids. 38 (2006) 146-166.
[31] T.M. Lin, T. S. Ping, A. Saptoro, P. Freddie, Mass Transfer Coefficients and
Correlation of Supercritical Carbon Dioxide Extraction of Sarawak Black Pepper.
International J. Food Engineering. 10(1) (2014) 1-15.
[32] S.R.S. Ferreira, M.A.A. Meireles, Modeling the supercritical fluid extraction of
black pepper (Piper nigrum L.) essential oil, J. Food Engineering. 54 (2002) 263-269.

123
[33] C. Perakis, V. Louli, K. Magoulas, Supercritical fluid extraction of black pepper oil,
J. Food Engineering. 71 (2005) 386-393.
[34] D. Mongkholkhajornsilp, S. Douglas, P.L. Douglas, A. Elkamel, W. Teppaitoon, S.
Pongamphai, Supercritical CO2 extraction of nimbin from neem seeds - a modelling
study, J. Food Engineering. 71 (2005) 331-340.
[35] S. Machmudah, A. Sulaswatty, M. Sasaki, M. Goto, T. Hirose, Supercritical CO2
extraction of nutmeg oil: Experiments and modeling, J. Supercritical Fluids. 39 (2006)
30-39.
[36] C. Spricigo, A. Bolzan, L. Pinto, A mathematical model based on the shrinking core
approach was proposed to represent the nutmeg essential oil extraction with liquid carbon
dioxide. Latin American Applied Research. 31(5) (2001) 397-401.
[37] R. M. F.Vargas, E.Cassel, G. M. F. Gomes, L. G. S. Longhi, L. Atti-Serafini, A.C.
Atti-Santos, Supercritical extraction of carqueja essential oil: experiments and modeling,
Brazilian J. Chemical Engineering. 23 (2006) 375.
[38] O.J. Catchpole, J.B. Grey, B.M. Smallfield, Near-critical extraction of sage, celery,
and coriander seed, J. Supercritical Fluids. 9 (1996) 273-279.
[39] E. Reverchon, Mathematical modeling of supercritical extraction of sage oil,
American Institute of Chemical Engineers J. 42 (1996) 1765-1771.
[40] M. Akgün, N. A. Akgün, S. Dinçer, Extraction and Modeling of Lavender Flower
Essential Oil Using Supercritical Carbon Dioxide, Industrial Engineering and Chemical
Resources. 39 (2000) 473-477.

124
[41] E. Reverchon, Supercritical fluid extraction and fractionation of essential oils and
related products, J. Supercritical Fluids. 10 (1997) 1-37.
[42] J. Martínez, P. T.V. Rosa, M. A. A. Meireles, Extraction of Clove and Vetiver Oils
with Supercritical Carbon Dioxide: Modeling and Simulation. The Open Chemical
Engineering J. 1 (2007) 1-7.
[43] E. Reverchon, G. Della Porta, G. Lamberti, Modelling of orange flower concrete
fractionation by supercritical CO2, J. Supercritical Fluids. 14 (1999) 115-121.
[44] M.J. Cocero, J. Garcı a, Mathematical model of supercritical extraction applied to oil
seed extraction by CO2+saturated alcohol — I. Desorption model, J. Supercritical Fluids.
20 (2001) 229-243.
[45] E.M.C. Reis-Vasco, J.A.P. Coelho, A.M.F. Palavra, C. Marrone, E. Reverchon,
Mathematical modelling and simulation of pennyroyal essential oil supercritical
extraction, Chemical Engineering Science. 55 (2000) 2917-2922.
[46] I. Zizovic, M. Stamenic, A. Orlovic, D. Skala, Supercritical carbon dioxide
extraction of essential oils from plants with secretory ducts: Mathematical modelling on
the micro-scale, J. Supercritical Fluids. 39 (2007) 338-346.
[47] S.M. Ghoreishi, S. Sharifi, Modeling of supercritical extraction of mannitol from
plane tree leaf, J. Pharmaceutical and Biomedical Analysis. 24 (2001) 1037-1048.
[48] W. Wu, Y. Hou, Mathematical modeling of extraction of egg yolk oil with
supercritical CO2, J. Supercritical Fluids. 19 (2001) 149-159.
125
[49] N. Vedaraman, C. Srinivasakannan, G. Brunner, B.V. Ramabrahmam, P.G. Rao,
Experimental and modeling studies on extraction of cholesterol from cow brain using
supercritical carbon dioxide, J. Supercritical Fluids. 34 (2005) 27-34.
[50] E.M. Vaquero, S. Beltrán, M.T. Sanz, Extraction of fat from pigskin with
supercritical carbon dioxide, J. Supercritical Fluids. 37 (2006) 142-150.
[51] P. Jayasinghe, I. Adeoti, K. Hawboldt, A Study of Process Optimization of
Extraction of Oil from Fish Waste for Use as A Low-Grade Fuel, J. of the American Oil
Chemists' Society. 90 (2013) 1903-1915.
[52] A. Akgerman, G. Madras, Fundamentals of Solids Extraction by Supercritical
Fluids, 273 (1994) 669-695.
[53] J. M. Del Valle, J.C. De La Fuente, E. Uquiche, C. Zetzl, G. Brunner, Mass Transfer
and Equilibrium Parameters on High-Pressure CO2 Extraction of Plant Essential Oils, in:
J.M. Aguilera et al. (eds.), Food Engineering Interfaces, Food Engineering Series,
Springer Science & Business Media LLC, DOI 10.1007/978-1-4419-7475-4_17, 2011,
pp. 393-470.
[54] NIST (2000) database, Fluid Thermodynamic and Transport Properties (version 5.0).
Available at http://webbook.nist.gov/chemistry/fluid/. Accessed on April 7th 2015.
[55] O.J. Catchpole, M.B. King, Measurement and Correlation of Binary Diffusion
Coefficients in Near Critical Fluids, Industrial & Engineering Chemistry Research. 33
(1994) 1828-1837.
[56] N. Wakao, S. Kagei, Heat and Mass Transfer in Packed Beds, Gordon and Breach
Science Publishers, New York, 1982, pp.138-158.
126
[57] OJ Catchpole, JB Grey, KA Noermark, Solubility of Fish Oil Components in
Supercritical CO2 and CO2 + Ethanol Mixtures. Journal of Chemical & Engineering
Data 1998;43(6):1091-1095.
[58] BMC Soares, FMC Gamarra, LC Paviani, LAG Gonçalves, FA Cabral, Solubility of
triacylglycerols in supercritical carbon dioxide. The Journal of Supercritical Fluids 2007
11;43(1):25-31.
[59] J Chrastil, Solubility of solids and liquids in supercritical gases. J Phys Chem
1982;86(15):3016-3021.
[60] Ö Güçlü-Üstündağ, F Temelli, Correlating the solubility behavior of minor lipid
components in supercritical carbon dioxide. The Journal of Supercritical Fluids 2004
11;31(3):235-253.
[61] Ö Güçlü-Üstündag, F Temelli, Correlating the Solubility Behavior of Fatty Acids,
Mono-, Di-, and Triglycerides, and Fatty Acid Esters in Supercritical Carbon Dioxide,
Industrial Engineering and Chemical Resources. 2000; 36:4756-4766.
127
CHAPTER 5
COMPARISON OF BIOFUEL QUALITY OF WASTE DERIVED
OILS AS A FUNCTION OF OIL EXTRACTION METHODS
Ibraheem A. Adeoti*, Kelly Hawboldt.
Department of Oil and Gas Engineering, Faculty of Engineering and Applied Sciences,
Memorial University of Newfoundland St.John’s, NL A1B 3X5, Canada.
Received 13 March 2015, Revised 12 May 2015, Accepted 15 May 2015.

128
Abstract
Fish derived bio-oils have similar properties to petroleum-derived fuel oils and therefore
the potential to be an alternative energy source. The quality of bio-oil as a fuel is
determined by the quality of the feedstock and processing conditions. Fish oil may have
poor cold flow properties due to the heterogeneity of the lipid composition. Different oil
extraction methods produce different levels of homogeneity with respect to lipids. In this
study, oil was extracted from fish waste via three different processes; modified fishmeal
(MFM), supercritical extraction using carbon dioxide (SC-CO2), and soxhlet extraction.
The quality of oils extracted (composition, thermal degradation, physicochemical, and
flow properties) were compared. The SC-CO2 extracted 91% and the MFM extracted 71
% of the total oil contained in the fish waste. The SC-CO2 oil is more than 86 wt %
triglycerides, representing more homogeneous oil than the MFM at 70wt% and soxhlet at
66 wt %. The free fatty acid (FFA) of SC-CO2 oil is lower than MFM and soxhlet oil,
making it a better feedstock for biodiesel production. Polar lipids were most abundant in
the soxhlet oil at 22.98 wt %, followed by the MFM oil at 18.35 wt % and SC-CO2 oil at
7.39 wt %. The MFM oil exhibited a shear-thinning non-Newtonian behavior, while the
SC-CO2 oil was Newtonian. Overall, the oil from SC-CO2 showed better fuel properties,
particularly as a blend and/or replacement for heating oil, than the MFM and soxhlet oil
and the process has the potential for a lower environmental footprint.

129
This chapter has been published in the Fuel Journal Mr. Ibraheem Adeoti is the lead
author and Dr. Kelly Hawboldt is co-author. Mr. Adeoti's contributions to this paper
include the following:
Wrote the paper
Performed all the laboratory testing and analyses (except where noted)
Conducted all data processing and interpretation of results
Performed all literature searches required for background information
Dr. Hawboldt provided technical guidance and editing of the manuscript.
130
Nomenclature
ALC Alcohol(s)
ASTM American Society for Testing and Materials
AMPL Acetone mobile polar lipid(s)
ANOVA Analysis of variance
AOCS American Oil Chemists' Society
CASD Centre for Aquaculture and Seafood Development
DAG Diacylglycerol(s)
DHA Docosahexaenoic acid(s)
DSC Differential scanning calorimeter
EE Ethyl ester(s)
EPA Eicosapentaenoic acid(s)
GC-FID Gas chromatography with flame ionization detection
GE Glycerol ether(s)
EK Ethyl ketone(s)
FAME Fatty acid methyl ester(s)
FFA Free fatty acid(s)
HC Hydrocarbon(s)
HHV High heating value
HPLC High performance liquid chromatography
ID Internal diameter
ME Methyl esters(s)
131
MFM Modified fishmeal
MK Methyl ketone(s)
MUFA Monounsaturated fatty acid(s)
MUN Memorial University of Newfoundland
PL Phospholipid(s)
PUFA Polyunsaturated fatty acid(s)
SC-CO2 Supercritical carbon dioxide
SFA Saturated fatty acid(s)
SFE Supercritical fluid extraction
SE Steryl ester(s)
ST Sterol(s)
TAG Triacylglycerol
TGA Thermo-gravimetric analysis
TLC-FID Thin-layer chromatography with flame ionization detection

132
5.1 Introduction.
Fish processing operations generate considerable quantities of edible and inedible by-
products. Approximately 45 wt % of the total catch of fish is discarded as processing
byproduct including heads, frames, trimmings, fins, skin and viscera (gut, liver, etc…)
[1]. Fish oil recovered from fish residue varies considerably (between a mass fraction of
1.4 % and 40.1 %) depending on the species, tissue [2] and season. There is an
increasing interest in obtaining edible fish oil from fish by-products in order to satisfy the
demand of omega-3 enriched products. However, waste fish oils can have a low-value
application (fuel oil/ biodiesel) when the content of omega 3 fatty acids (EPA and/or
DHA) or when the yield after the refining process are low [3]. Various studies have
investigated waste fish oil as fuel for conventional combustors or diesel engines [4-7].
Fish oils have similar properties to petroleum-derived fuel oils such as calorific/heating
value and combustion efficiency [5,8-10]. When compared to petroleum based fuels,
biofuels have the advantage of lower toxicity, higher biodegradation rates (reducing
impact in soil and water if spilled), no sulfur, and a higher flash point [5,8,11,12]. The
quality of bio-oil as a fuel is determined by the quality of the feedstock and the
processing conditions, which need to be carefully managed to obtain a high quality fuel
[8,13]. Atabani et al. [14] showed biodiesel quality is a function of feedstock fatty acid
composition, production, and refining method(s). Studies have demonstrated crude fish
oil has poor cold flow properties such as lower lubricity and viscosity, and higher acidity
compared to conventional diesel fuel [12]. This is because unrefined fish oil contains
impurities such as free fatty acids (FFA), primary oxidation products, minerals, pigments,
133
moisture, and phospholipids [15]. High FFA and/or phospholipid levels reduce fish oil
fuel quality and additional refining processes are required such as neutralization and
degumming. Phospholipids polymerize due to heat and form deposits that clog injectors,
valves, build up on the combustion chamber walls and cylinder surfaces in engines
[13,16]. Sediments may clog fuel filters and pumps [13,17]. As a result of poor storage
conditions of feedstock, the hydrolysis of triglycerides in the presence of water leads to
high FFA and results in low oil stability during storage [18] and corrosion during use
[13,18]. Water in fuel oil decreases the heating value, impedes ignition and slows down
flame propagation [13].
The presence and/or quantity of impurities are highly dependent on the fish oil extraction
method [15]. Fish oil (edible and non-edible) can be recovered through several methods.
The wet reduction process is one of most common process employed in high volume fish
oil production but may require subsequent refining steps in order to improve the fish oil
quality [19]. Other conventional fish oil recovery processes use either high temperatures
and/or flammable or toxic solvents, which could result in loss of functional properties and
deterioration of oil quality [8,20-22]. Supercritical fluid extraction (SFE) has been
proposed in the extraction of high quality compounds from natural sources [23] including
oil recovery from seeds/biomass, whole fish and/or fish by-products [24]. SC-CO2 for oil
recovery is an attractive option as it is a non-toxic, non-flammable, inexpensive and clean
solvent [8,22-25].
The objective of this study is to investigate the quality of oil extracted from fish waste
using SC-CO2 process compared to conventional processes. Salmon oil extracted from
134
fish processing waste via three different methods; SC-CO2, soxhlet, and modified
fishmeal (MFM) was compared. Chemical composition, rheological or flow properties
and thermal stability were compared to determine their feasibility as a fuel oil.
5.2 Materials and methods
The materials were previously discussed in section 2.0 of chapter 3 and section 3.0 of
chapter 4.
5.2.1 Oil recovery methods
The detailed methodology for modified fishmeal extraction method (MFM) was
described in section 2.0 of chapter 3, soxhlet extraction method in section 3.0 of chapter 4
and the supercritical carbon dioxide extraction method (SC-CO2) in section 3.2 of
chapter 4.
5.2.2 Lipid and fatty acid composition analysis
The lipid composition of oil was determined by thin-layer chromatography with flame
ionization detection analysis (TLC/FID) as described in Parrish [27] and Deibel et al.
[28]. Approximately 1 g of oil was extracted with 8 mL of chloroform, 4 mL of
methanol, 4 mL of 2:1 chloroform: methanol, and 2 mL of chloroform extracted water in
the first wash, and 6 mL of chloroform in 2-3 additional washes. The extracted lipids
were diluted in chloroform and the solutions were analyzed for composition of fourteen
lipid classes in the TLC/FID (Mark VI Iatroscan with silica coated chromarods). The
lipid classes were straight chain hydrocarbons (HC), steryl esters (SE), ethyl esters (EE),
methyl esters (ME), ethyl ketones (EK), methyl ketones (MK), glycerol ethers (GE),
triacylglycerols (TAG), free fatty acids (FFA), alcohols (ALC), sterols (ST),

135
diacylglycerols (DAG), acetone mobile polar lipids (AMPL), and phospholipids (PL).
The results were expressed in percentage weight of each lipid class in the extracted
solution by including the dilution factor.
Fatty acid composition analysis:
To derivatise the lipid, 250 μL extracted lipid from each samples injected into cleaned
glass vials and 0.5 mL of hexane and 1mL of 14% BF3/ methanol were added. Glass
vials were sealed with teflon tapes, vortexed for 30 s, sonicated for 4 min and oven
heated for 1.5 hours at 85 °C. After heating, 0.5 mL of chloroform extracted water and
1.5 mL of hexane were added. The upper organic layer (FAME) was transferred to glass
vials and concentrated to 1 mL. Fatty acids were analyzed on a GC/FID (HP 6890)
equipped with an autosampler (7683) and a column ZB wax+ (length = 30 m, ID = 0.32
μm, Phenomenex, U.S.A). The final column temperature set at 220 °C and H2 carrier gas
flowing at 2 mL/min. Peaks were identified using retention times from standards
purchased from Supelco, 37 component FAME mix (product number 47885-U), bacterial
fatty acid ester mix (product number 47080-U), polyunsaturated fatty acid (PUFA) 1
(product number 47033) and PUFA 3 (product number 47085-U). The quantitative
standard (product number GLC490) was purchased from Nu-Chek Prep, Inc.
Chromatogram peaks were integrated using the Varian Galaxie Chromatography Data
System (version 1.9.3.2).
5.2.3. Thermo Gravimetric Analysis (TGA)
The thermal stability of the salmon oils was determined using Thermo-gravimetric
Analysis – TGA (Model Q500, TA Instruments Inc.). Approximately 0.8 - 1.2 mg of oil
136
sample was loaded into the furnace. The TGA was manually programmed to heat up the
sample from ambient to 800 under N2/air atmosphere at a ramping rate of 5 /min.
Sample weight change was automatically acquired every second and the data were
analyzed and plotted using the TA Universal Analyzer Software.
5.2.4. Calorific value/High heating value (HHV)
Calorific value is a measure of the energy content in a fuel. The 1108 oxygen bomb
calorimeter (Parr Instrument Company) was used to determine the HHV of the salmon
oils according to ASTM D2015 standard method. Oxygen – bomb vessel was pressurized
to approximately 3 MPa with an oxygen container. The bomb was ignited automatically
after the jacket and a bucket temperature equilibrates to the desired values.
5.2.5. Melting points and enthalpy
Melting points were determined in a METTLER TOLEDO DSC-1 (Differential Scanning
Calorimeter) with Julabo intercooler and TA Universal Analyzer Software.
Approximately 5-10 mg of sample was cooled to -60 o and heating to 40
oC at 5
oC/min.
The thermogram plots containing normalized heat flow with temperature were integrated
to obtain peak onset and areas. The average melting points of the salmon oils was
analyzed and recorded
5.2.6. Dynamic viscosity using the Brookfield Rheometer
The apparent viscosity of the salmon oils were measured using a Brookfield DV-III Ultra
Programmable rheometer equipped with a small sample adapter and spindle (SC4-
18/13RP). The temperature of the sample was kept constant by connecting a circulating
water bath (NESLAB EX series) to a water jacket of the small sample adapter.

137
Measurements were taken at 20, 40, and 60 in (Pa.s) by changing the spindle rotation
speed from 10 rpm at intervals of 10 until the torque exceeded 100%. Kinematic viscosity
values of the oil samples are estimated using ν = μ / density, where, ν is kinematic
viscosity of product or oil (cSt), μ is dynamic viscosity of product or oil samples (cP).
The power law (Eq.1) was used to analyze the flow behavior of all the raw samples and
their blends.
(1)
Where = shear stress (Pa.s), = shear rate (s-1
), K = consistency index (Pa.sn) and n is
the flow behavior index (dimensionless unit) [29-31]. Taking the logarithm of both sides
of Eq.(1) yielded a straight line plot of log versus log with intercept (log K) and slope
n. The use of Arrhenius relationship to describe the effect of temperature on apparent
viscosity was through the use of Eq. (2) [30-32].
k = A.exp.(-Ea/RT)
(2)
Where k is the reaction rate constant, A is the frequency factor, Ea is the activation
energy (J/mol), R is the gas constant (8.314 J/mol.K), and T is the temperature (K). A plot
of natural logarithm (ln) of apparent viscosity versus inverse of temperature (1/T) was
constructed for each of unrefined salmon oil, waste fish oil, and their blends. The slope of
the straight line, the intercept and the regression coefficient were determined using the
trend line of the plot. Ea was also calculated from the slope.
138
5.2.7. Water and sediments, moisture content, FFA/acid value, peroxide value, and
density.
AOCS official standard method Ca 3d-02 was used to determine water content on the fish
waste and measures the free water relative to the waste overall mass (gross mass
including water). AOCS official standard method Ca 2e-84 for moisture content was used
to determine residual moisture in the freeze dried waste. AOCS official standard method
Ca 5a-40 was used to determine % FFA, AOCS official standard method Cd 8b-53 for
peroxide value, and ASTM standard test method D1217-93 using pycnometer for density.
Statistical Analysis
The experiments were conducted in triplicates. Mean and standard deviation were
calculated using Microsoft Excel 2007 (Window 8 Edition, Microsoft Corporation,
USA). Analysis of variance (ANOVA) at alpha level of 0.05 was performed using the
statistical tool in Microsoft Excel. Average of three measurements plus/minus standard
deviation was given in tables where applicable.
5.3 Result and discussion.
5.3.1. Percentage recovery
The soxhlet method is standard for oil extraction and was used as a baseline to determine
the effectiveness of both the MFM and SC-CO2 methods. Previous work [22,33] indicates
moisture content for SC-CO2 extraction should be less than 10 wt %. If the water content
is too high it can decrease the extraction efficiency and therefore the ground fish waste
was freeze dried to 8.50 wt % (dry basis). The freeze dried waste was used for the SC-

139
CO2 experiments and as a comparison a freeze dried sample was processed using soxhlet.
In the MFM process, the oil is extracted from water laden waste through a series of
heating and centrifuging. In this comparison, the fresh ground fish waste moisture content
was 59.32 wt % (wet basis). A second set of soxhlet experiments were performed on this
“wet” waste to determine the maximum oil extraction possible under “wet” conditions.
The Soxhlet method extracted 53 g of oil ± 0.73/100 g of dry fish waste while the SC-
CO2 process extracted 48.14 g of oil ± 1.06/100 g of dry fish waste or 91 wt% of the
maximum oil. For the fresh ground fish waste, the Soxhlet extracted 28.37 g of oil
± 1.20/100 g of fish waste (wet basis), while the MFM extracted 20.70 g of oil
± 2.76/100 g of fish waste (wet basis), or 71 wt%. On a percentage basis, the SC-CO2 is
able to recover more of the oil compared to the MFM. The maximum recovery was
achieved at CO2 mass flow rate of 0.36 kg/hr, 333 K, and 35 MPa (Fig. 5.1). The SC-
CO2 oil recovery is in agreement with Rubio-Rodríguez et al. [25] who reported 96 wt %
recovery of oil from hake offcuts.

140
Figure 5.1: Extraction yield at P = 35 MPa and T = 313 K and solvent mass flow rate of
0.18 – 0.48 kg/hr.
5.3.2. Lipid composition
The lipid class compositions as a percentage of total lipids, for the oils extracted are
summarized in Table 5.1. The major lipid classes are TAG, AMPL, PL, and FFA. TAG is
the dominant lipid at 86.16 wt % in SC-CO2 oil, 70.5 wt% in the MFM oil, and 65 wt%
in the soxhlet oil. SC-CO2 leads to higher purity oil due to the use of a non-oxidation
(inert) atmosphere and mild temperatures involved, which prevent the oxidation of the
polyunsaturated fatty acids [19]. SC-CO2 is highly selective towards low polarity lipid
compounds (TAG) while the co-extraction of polar impurities is limited [8,19]. This
resulted in more homogeneous chemical composition in SC-CO2 oil compared to MFM
and soxhlet oils (Table 5.1). The high level of polar lipid classes in the MFM oil was
0
10
20
30
40
50
60
0 20 40 60 80 100 120
Oil
yie
ld (
%)
Time (mins)
0.18 kg/hr
0.36 kg/hr
0.48 kg/hr

141
attributed to mixing of the aqueous phase (phase containing high polarity lipids) with oil
at high temperature. Since phospholipids are soluble in oil at high temperature [13], polar
lipids dissolved in the oil. In the soxhlet extraction method, the sample is repeatedly
brought into contact with fresh solvent ensuring complete extraction [8] leading to the
recovery of all lipids (polar and nonpolar lipids).
The highest FFA (8.43 ± 0.95 wt %) was measured in MFM derived oil, followed by
soxhlet (7.60 ± 0.06 wt %) and the SC-CO2 methods (2.17 ± 0.94 wt %). The hydrolysis
of TAG in presence of excess water and high temperature in the MFM process may lead
to high FFA content [13,34]. The FFA is produced due to hydrolysis of TAG. The
oxidation of PUFA led to hydro-peroxides, secondary (aldehydes, etc.) and tertiary
(acids, etc.) oxidation products. The low FFA yield by SC-CO2 could be due to extraction
conditions (i.e. inert atmosphere, low moisture, and mild temperature), which prevent the
oxidation and/or hydrolysis of the TAG containing polyunsaturated fatty acids. This
impacts further processing the oil to a biodiesel, as high FFA (>5%) require pre-treatment
prior to transesterification [18].
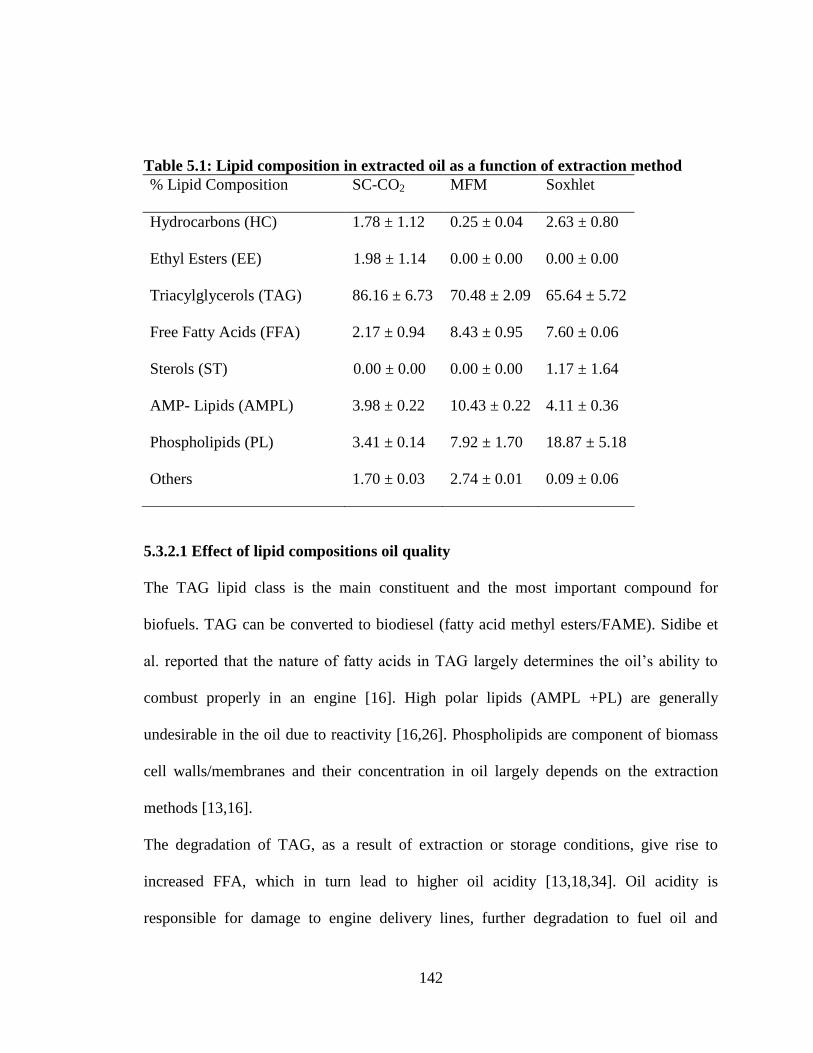
142
Table 5.1: Lipid composition in extracted oil as a function of extraction method
5.3.2.1 Effect of lipid compositions oil quality
The TAG lipid class is the main constituent and the most important compound for
biofuels. TAG can be converted to biodiesel (fatty acid methyl esters/FAME). Sidibe et
al. reported that the nature of fatty acids in TAG largely determines the oil’s ability to
combust properly in an engine [16]. High polar lipids (AMPL +PL) are generally
undesirable in the oil due to reactivity [16,26]. Phospholipids are component of biomass
cell walls/membranes and their concentration in oil largely depends on the extraction
methods [13,16].
The degradation of TAG, as a result of extraction or storage conditions, give rise to
increased FFA, which in turn lead to higher oil acidity [13,18,34]. Oil acidity is
responsible for damage to engine delivery lines, further degradation to fuel oil and
% Lipid Composition SC-CO2 MFM Soxhlet
Hydrocarbons (HC) 1.78 ± 1.12 0.25 ± 0.04 2.63 ± 0.80
Ethyl Esters (EE)
1.98 ± 1.14 0.00 ± 0.00 0.00 ± 0.00
Triacylglycerols (TAG) 86.16 ± 6.73 70.48 ± 2.09 65.64 ± 5.72
Free Fatty Acids (FFA) 2.17 ± 0.94 8.43 ± 0.95 7.60 ± 0.06
Sterols (ST)
0.00 ± 0.00 0.00 ± 0.00 1.17 ± 1.64
AMP- Lipids (AMPL) 3.98 ± 0.22 10.43 ± 0.22 4.11 ± 0.36
Phospholipids (PL) 3.41 ± 0.14 7.92 ± 1.70 18.87 ± 5.18
Others 1.70 ± 0.03 2.74 ± 0.01 0.09 ± 0.06
143
corrosion. The SC-CO2 method recovered the highest TAG content and minimal amounts
of PL, AMPL, and FFA. As such, this oil would likely have fewer performance problems
when used in conventional boilers/engines. In addition, in conversion to biodiesel, the
TAG should be maximized to maximize FAME.
5.3.3. Fatty acid composition
Fatty acid compositions of lipids are summarized in Table 5.2. The major fatty extracted
by each methods were palmitic acid (C16:0), palmitoleic acid (C16:1), stearic acid
(C18:0), oleic acid (C18:1n-9), vaccenic acid (C18:1n-7), linoleic acid (C18:2n-6), EPA
(C20:5n-3) and DHA (C22:6n-3). The fatty acid class compositions were in good
agreement with composition for farmed Atlantic salmon effluents reported by Jayasinghe
and Hawboldt [35], and there was no significant compositional difference between
methods (P > 0.05).
The degree of saturated fatty acids (SFA) versus unsaturated fatty acids determined oil
specific qualities. For example, Sidibe et al. [16] determined saturated oils (high SFA
content) show better combustion properties such as shorter evaporation time, shorter
ignition delay, and fewer deposits than the unsaturated oils and combustion quality
increases with degree of saturation. However, saturated oils are more viscous at elevated
temperatures than the unsaturated counterpart [8,16,36,37], which could result in poor
flow properties.
Unsaturated fatty acids have a higher tendency to oxidize during storage resulting in
impurities and poor combustion quality. Polyunsaturated fatty acids (PUFA) can
polymerize and/or oxidize into gums, sediments or other deposits. The double bonds in

144
PUFA make oils more liquid than saturated fatty acids and lowers the oil melting
temperature [8,16,36].
Table 5.2: Fatty acid compositions of oils extracted oil as a function of extraction
methods
This work (Salmon oil) [20] [20]
Fatty acids SC-CO2 MFM Soxhlet SC-CO2 Hexanes
14:0 1.99 ± 0.01 2.68 ± 0.06 2.09 ± 0.11 4.28 3.66
16:0 14.65 ± 0.08 14.02 ± 0.77 14.88 ± 0.09 11.73 10.98
16:1n-7 5.52 ± 0.04 6.92 ± 0.11 5.63 ± 0.14 0.06 0.33
18:0 4.05 ± 0.01 4.07 ± 0.13 3.81 ± 0.14 2.93 2.04
18:1n-9 35.26 ± 0.12 31.44 ± 1.64 35.35 ± 1.49 4.62 4.38
18:1n-7 2.87 ±0 .04 3.48 ± 0.06 2.36 ± 0.28 0.83 0.78
18:2n-6 16.14 ± 0.04 15.36 ± 0.51 15.81 ± 0.28 13.55 13.61
18:3n-6 0.55 ± 0.01 0.26 ± 0.05 0.55 ± 0.03
18:3n-3 1.82 ± 0.01 1.22 ± 0.06 1.80 ± 0.11 1.59 1.72
18:4n-3 0.66 ± 0.01 0.56 ± 0.09 0.64 ± 0.06
20:1n-9 1.98 ± 0.01 2.11 ± 0.25 1.98 ± 0.14 0.04 0.12
20:2n-6 0.85 ± 0.01 0.77 ± 0.05 0.80 ± 0.01
20:3n-6 0.70 ± 0.12 0.37 ± 0.05 0.60 ± 0.01
20:4n-6 0.60 ± 0.01 0.72 ± 0.05 0.61 ± 0.05 2.15 3.22
20:5n-3 2.98 ± 0.02 4.52 ± 0.73 2.82 ± 0.25 11.91 12.22
22:1n-11 1.03 ± 0.02 1.42 ± 0.29 1.09 ± 0.12
22:1n-9 0.27 ± 0.02 0.29 ± 0.06 0.22 ± 0.03
22:4n-6 0.08 ± 0.07 0.16 ± 0.02 0.19 ± 0.07 2.15 3.22
22:5n-3 1.15 ± 0.01 1.66 ± 0.09 1.16 ± 0.12 2.01 2.21
22:6n-3 2.98 ± 0.02 3.49 ± 0.67 2.94 ± 0.30 13.15 13.86
24:1 0.12 ± 0.01 0.20 ± 0.02 0.25 ± 0.02
Sums 96.22 ± 0.68 95.18 ± 5.82 95.58 ± 3.88
Other 3.78 ± 0.08 5.81 ± 0.43 4.42 ± 0.17
SFA 21.20 ± 0.08 21.43 ± 0.86 19.96 ± 2.31 21.09 18.87
MUFA 48.14 ± 0.10 47.36 ± 1.95 49.78 ± 3.72 7.70 7.80
PUFA 30.33 ± 0.17 31.71 ± 1.31 29.88 ± 1.41 56.32 59.59
P/S ratio 1.43 1.48 1.50
SFA-saturated fatty acid; MUFA-monounsaturated fatty acid; PUFA-polyunsaturated
fatty acid; MFM – Modified fishmeal method, P/S – ration of PUFA to SFA.
145
5.3.4. Thermal analysis (TGA)
TGA analyzes the thermal stability by relating oil physicochemical properties to weight
changes as a function of temperature [38]. The thermal behavior of salmon oil was
studied under nitrogen atmosphere between 0 °C and 800 °C (Fig.5.3). The onset weight
loss temperature of fish oils from both methods starts at approximately 225 °C which is
in agreement with 220 °C reported by Araujo et al. [39]. Between 367 °C and 497°C, the
rate of weight loss increased rapidly with temperature. The MFM oil shows some
resistance to thermal degradation compared SC-CO2 oil, this is due to
impurities/undesired products levels in the MFM oil compared to the SC-CO2 oil.
Sathivel et al., Wiedermann and Chiou et al. [30,40,41], proposed the impurities in crude
fish or vegetable oils absorb heat, slowing the decomposition of the oil [30,40]. The total
weight loss between 367 °C and 497 °C is approximately 90 wt. %. After 500 °C, 0.07
and 0.36 wt. % recalcitrant materials remained as residue in the SC-CO2 and MFM oil
respectively, verifying the higher purity of the SC-CO2 compared to the MFM oil.
Thermal polymerization reactions in edible oils occur in temperature between 200 °C and
300 °C in inert or nitrogen environment [39,42] but was not detected in this work
(Fig.5.3).

146
Figure 5.3: Thermal degradation of the crude Salmon oil recovered by SC-CO2 and MFM
methods in nitrogen atmosphere.
5.3.5. Calorific value/High heating value (HHV)
The high heating values (HHVs) of the oil are outlined in Table 5.3. The HHV are
approximately 40, 39 and 38 MJ/kg for the SC-CO2, soxhlet, and MFM extracted oil
respectively. The difference in HHV of the SC-CO2 and MFM oil may be due to lower
moisture content of SC-CO2 oil. The HHV of the salmon oil is in the range of seed oil
based biodiesel (39 MJ/kg to 43.33 MJ/kg) reported by Sivaramakrishnan et al. [43] and
lower than that of petroleum diesel (49.65 MJ/kg). The values from this study are also
very close to HHV for vegetable oils between 36 and 40 MJ/kg reported by Blin et al.
[13].
0
10
20
30
40
50
60
70
80
90
100
0 100 200 300 400 500 600 700 800
Wei
gh
t (%
)
Temperature (ºC)
SC-CO2
MFM

147
Table 5.3: Some salmon oil properties as function of extraction methods
Method SC-CO2 MFM Soxhlet
Recovery (%) 48.14 ± 1.06 20.70 ± 2.76 52.84 ± 1.26
HHV (MJ/kg) 39.58 ± 0.03 38.41 ± 0.10 39.49 ± 0.12
FFA (%) 0.83 ± 0.05 7.32 ± 1.9
Peroxide Value 4.34 ± 0.56 5.60 ± 0.38
Sediment (%) 0.00 0.95 ± 0.1
Free water (%) 0.00 1.02 ± 0.1
Moisture (%) 0.134 ± 0.002 0.24 ± 0.02 0.005 ± 0.003
Temperature ( ) Kinematic viscosity (cSt)
20 6.72 ± 0.03 5.90 ± 0.04
40 3.22 ± 0.00 2.53 ± 0.02
60 1.80 ± 0.00 1.31 ± 0.02
Density (kg/m3)
20 919 996
40 905 991
60 892 985
5.3.6. Melting point
The DSC thermograms (Fig. 5.4) show two broad endothermic peaks for the crude
salmon oil extracted using SC-CO2 and MFM processes. The melting point of salmon oil
in both methods ranged from -48.10 2.21 to 17.25 1.87 °C and both freeze at
approximately -12.36 °C. The negative melting points of the oils were attributed to the

148
presence of triacylglycerol which contain unsaturated fatty acids [30,31,36]. The higher
degree of unsaturated fatty acids in fish oil results in melting at lower temperatures [31].
The thermogram peaks for the oils were not sharp due to the presence of impurities such
as phospholipids, free fatty acids, aldehydes, particulate matters, ketones, water, and
pigments. These impurities result in a melting behavior typical of pure fatty acids [31,36].
The similarity in melting points of oils from both methods is a reflection of their
comparable fatty acid composition (i.e. similar proportions of SFA, MUFA, and PUFA
between the oils from the three methods) (Table 5.2).
Figure 5.4: DCS thermograph of the crude salmon oil extracted using SC-CO2 and MFM
methods.
-1.1
-0.9
-0.7
-0.5
-0.3
-0.1
0.1
0.3
0.5
0.7
-60 -50 -40 -30 -20 -10 0 10 20 30 40
Hea
t fl
ow
(W
/g)
Temperature (°C)
SC-CO2 extracted oil
Mofidfied fishmeal extracted oil
149
5.3.7. Rheological properties
The apparent viscosity as a function of shear rate and temperature was investigated (Fig.
5.5). At 60 oC the MFM derived oil viscosity decreased from 65.1 cP to approximately
17.1 cP as shear rate was increased from 13 s-1
to 172 s-1
and remained constant after.
The same trend was observed for MFM derived oil at 40 and 20 (Fig.5.5). At 60 oC,
the shear rate had little impact on the SC-CO2 oil viscosity. A similar trend was observed
at 40 and 20 . The decrease in viscosity with increasing shear rate indicates that the
MFM oil exhibited shear-thinning non-Newtonian behavior which is in agreement with
our previous work [26]. Sathivel et al. [44] determined crude fish oils contain soluble
impurities such as phospholipids, FFA, peroxides and their degraded products that are
highly interactive with oils and lead to formation of an aggregated colloidal, which often
shows shear-thinning behavior [44]. In the case of SC-CO2 extracted salmon oil, the
viscosity is almost constant at all temperatures studied indicating Newtonian behavior.
Sathivel et al. [44] showed the change in catfish oil from shear-thinning Newtonian
behavior (before refining) to Newtonian behavior (after refining e.g. degumming,
neutralization, bleaching, and deodorization). Each refining stages removes impurities,
minerals complexed by phospholipids, and other unwanted polar compounds. The SC-
CO2 oil contains less than 10 % impurities and over 85 wt % TAG (Table 5.1).
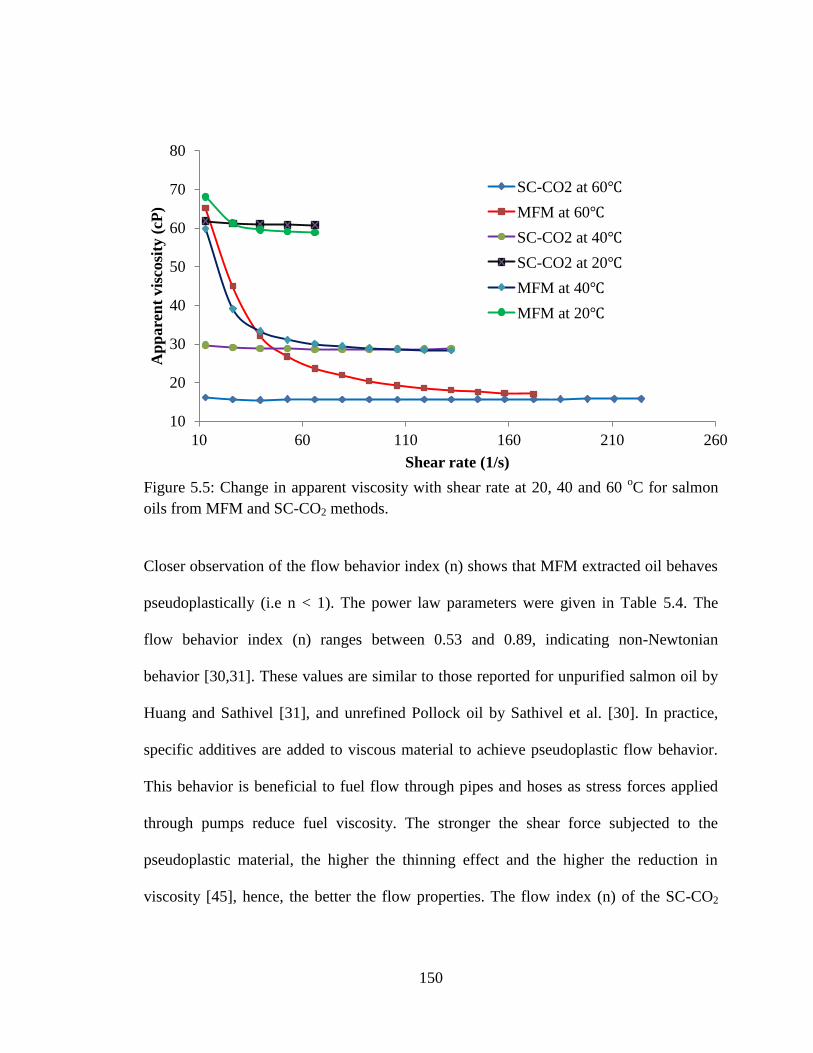
150
Figure 5.5: Change in apparent viscosity with shear rate at 20, 40 and 60
oC for salmon
oils from MFM and SC-CO2 methods.
Closer observation of the flow behavior index (n) shows that MFM extracted oil behaves
pseudoplastically (i.e n < 1). The power law parameters were given in Table 5.4. The
flow behavior index (n) ranges between 0.53 and 0.89, indicating non-Newtonian
behavior [30,31]. These values are similar to those reported for unpurified salmon oil by
Huang and Sathivel [31], and unrefined Pollock oil by Sathivel et al. [30]. In practice,
specific additives are added to viscous material to achieve pseudoplastic flow behavior.
This behavior is beneficial to fuel flow through pipes and hoses as stress forces applied
through pumps reduce fuel viscosity. The stronger the shear force subjected to the
pseudoplastic material, the higher the thinning effect and the higher the reduction in
viscosity [45], hence, the better the flow properties. The flow index (n) of the SC-CO2
10
20
30
40
50
60
70
80
10 60 110 160 210 260
Ap
pare
nt
vis
cosi
ty (
cP)
Shear rate (1/s)
SC-CO2 at 60
MFM at 60
SC-CO2 at 40
SC-CO2 at 20
MFM at 40
MFM at 20

151
extracted salmon oil is very close to unity (i.e. n > 0.90), indicating that the oil, like diesel
fuel oil and other mineral oils, is Newtonian in nature.
Table 5.4: Flow behavior index, consistency index, and activation energy of salmon
oils as a function of extraction methods
SC-CO2 oil MFM oil
T ( Flow index (n) K R2
Flow index (n) K R2
20 0.9915 ± 0.00 0.6284 ± 0.01 1.0000 0.89 ± 0.01 0.04 ± 0.01 1
40 0.9914 ± 0.01 0.2980 ± 0.01 1.0000 0.69 ± 0.00 0.07 ± 0.00 0.998
60 0.9977 ± 0.00 0.1589 ± 0.00 0.9999 0.53 ± 0.01 0.28 ± 0.01 0.996
SC-CO2 oil R2 MFM oil R
2
Ea (kJ/mol) 27.4 ± 0.1 0.998 31.04 ± 0.6 0.998
A (x 10-8
) 8.21 ± 0.3 0.998 1.69 ± 0.4 0.998
In eq. (2) the activation energy, Ea, (kJ/mol) represents the energy barrier to flow [30-
32,46]. The frequency factor or viscosity coefficient at a reference temperature, A, (Pa.s)
and Ea values were determined. In general, the higher the activation energy, the more
sensitive the viscosity will be to temperature [46]. As shown in table 4, the Ea for the SC-
CO2 oil is lower (27.40 kJ/mol) compared to the MFM oil (31 kJ/mol). This indicated
that the temperature effect on viscosity is more dominant in MFM extracted oil than SC-
CO2 extracted oil. This property reflects the heterogeneous nature of MFM oil compared
to SC-CO2 oil.

152
5.3.8 Water and sediment, moisture, FFA, peroxide value, density and kinematic
viscosity
The free water, sediment and moisture content of oil are presented in Table 5.3. Free
water and sediment were not detected in the SC-CO2 oil. Approximately 1.0 and 1.2 wt %
free water and sediment respectively were detected in the MFM oil. The moisture content
is lower (0.13 wt %) in the SC-CO2 oil compared to the MFM oil (0.24 wt %). The water
removal through freeze-drying is a contributing factor for the low moisture in the SC-
CO2 oil. As the SC-CO2 process is solubility driven the resulting oil is sediment free.
Generally, the MFM process largely depends on centrifuge efficiency for good separation
between the oil, water and sediment. Water in the oil can hydrolyze the TAG leading to
acidic oil. Water also impacts fuel filter cartridges and during combustion can cause
cavitation at the piston head [13].
The SC-CO2 oil FFA and PV levels were lower compared to the MFM oil. Lower values
of FFA and PV indicate less degradation. High FFA and PV value of oil lowers its
quality as a fuel oil. The oil densities at 20, 40, and 60 oC are outlined in Table 5.3. The
SC-CO2 oil density is lower than the MFM extracted oil at all temperatures studied. The
higher percentage impurities in the MFM oil may be responsible for denser oil. The
density of SC-CO2 oil agrees with red (900 kg/m3) and pink salmon (810 kg/m
3) oils [37].
Compared to petroleum fuel oil distillates, the densities are close to No.6 fuel oil (985
kg/m3), DMC marine distillate fuel (920 kg/m
3) and marine residual fuels (960-1010
kg/m3) [4]. The kinematic viscosity of the oil extracted from both SC-CO2 and MFM

153
processes ranges between 1.3 and 6.7 cSt. These values are within diesel fuel standard
ASTM D396, 2–3.6 cSt and 5.8–26.4 cSt at 38 °C for grade No. 2-D (diesel) and grade
No. 4-D (medium distillate) respectively [13].
5.4 Conclusion
154
This study has demonstrated the effect of extraction methods on chemical composition,
thermal, physicochemical, and flow properties of salmon waste derived oil. A comparison
of the oil by SC-CO2 to oil from the MFM and soxhlet methods shows that SC-CO2
produces higher purity oil. The SC-CO2 recovered more oil (91 wt %) from the waste
compared to MFM (71wt %). There is significant difference (P<0.05) in TAG recovery
between SC-CO2 oil (86 wt %), MFM (70 wt %), and soxhlet (66 wt %) oils. The SC-
CO2 limits the extraction of high polar compounds (PL and AMPL) which are
undesirable in crude bio-oil when used as a as fuel or biodiesel feedstock. In addition, the
SC-CO2 oil is lower in FFA compared to MFM and soxhlet. High FFA content in fuel oil
results in high acidity that leads to corrosion and engine inefficiency and intensifies the
biodiesel conversion process.
The MFM oil exhibited a shear-thinning non-Newtonian flow behavior, hence, has better
flow properties than SC-CO2 oil which exhibited Newtonian behavior. However, the flow
behavior is as a result of impurities such as FFA, primary oxidation products, minerals,
pigments, moisture, and phospholipids.
The SC-CO2 oil quality would require minimal or no further refining steps for fuel use
however the process is energy intensive therefore energy costs must be balanced against
higher oil quality and other environmental benefits. The MFM and soxhlet oils are of
lower quality due to impurities and further refining steps (such as degumming,
neutralization, bleaching, and deodorization) will be required to improve the oil’s quality
leading to additional cost. This will be of particular concern when for any upgrading to

155
biodiesel, as impurities in the oils require pretreatment prior to the transesterification
process.
Acknowledgements
The authors would like to acknowledge the funding provided by the Government of
Newfoundland and Labradors (Green Fund) and, NSERC (Natural Science and
Engineering Research Council of Canada).
156
References
[1]Rai AK, Swapna HC, Bhaskar N, Baskaran V. Potential Of Seafood Industry
Byproducts As Sources Of Recoverable Lipids: Fatty Acid Composition Of Meat and
Nonmeat Component Of Selected Indian Marine Fishes. J Food Biochem
2012;36(4):441-8.
[2]Zuta C, Simpson B, Chan H, Phillips L. Concentrating PUFA from mackerel
processing waste. J Am Oil Chem Soc 2003;80(9):933-936.
[3]de Almeida VF, García-Moreno PJ, Guadix A, Guadix EM. Biodiesel production from
mixtures of waste fish oil, palm oil and waste frying oil: Optimization of fuel properties.
Fuel Process Technol 2015 5;133(0):152-160.
[4]Preto F, Zhang F, Wang J. A study on using fish oil as an alternative fuel for
conventional combustors. Fuel 2008;87(10–11):2258-68.
[5]Kalligeros S, Zannikos F, Stournas S, Lois E, Anastopoulos G, Teas C, et al. An
investigation of using biodiesel/marine diesel blends on the performance of a stationary
diesel engine. Biomass Bioenergy 2003;24(2):141-9.
[6]Yahyaee R, Ghobadian B, Najafi G. Waste fish oil biodiesel as a source of renewable
fuel in Iran. Renewable and Sustainable Energy Reviews 2013;17(0):312-19.
[7]Wiggers VR, Wisniewski Jr. A, Madureira LAS, Barros AAC, Meier HF. Biofuels
from waste fish oil pyrolysis: Continuous production in a pilot plant. Fuel
2009;88(11):2135-41.
[8]Adeoti IA, Hawboldt K. A review of lipid extraction from fish processing by-product
for use as a biofuel. Biomass Bioenergy 2014;63(0):330-40.
157
[9]Behçet R. Performance and emission study of waste anchovy fish biodiesel in a diesel
engine. Fuel Process Technol 2011;92(6):1187-94.
[10] Preto F, Zhang F, Wang J. A study on using fish oil as an alternative fuel for
conventional combustors. Fuel 2008;87(10–11):2258-68.
[11]Westbrook CK. Biofuels Combustion. Annu. Rev. Phys. Chem. 2013;64:201-19.
[12]Ushakov S, Valland H, Æsøy V. Combustion and emissions characteristics of fish oil
fuel in a heavy-duty diesel engine. Energy Conversion and Management 2013;65(0):228-
38.
[13]Blin J, Brunschwig C, Chapuis A, Changotade O, Sidibe SS, Noumi ES, et al.
Characteristics of vegetable oils for use as fuel in stationary diesel engines—Towards
specifications for a standard in West Africa. Renewable and Sustainable Energy Reviews
2013;22(0):580-97.
[14]Atabani AE, Silitonga AS, Ong HC, Mahlia TMI, Masjuki HH, Badruddin IA, et al.
Non-edible vegetable oils: A critical evaluation of oil extraction, fatty acid compositions,
biodiesel production, characteristics, engine performance and emissions production.
Renewable and Sustainable Energy Reviews 2013;18(0):211-45.
[15]Yin H, Solval K, Huang J, Bechtel P, Sathivel S. Effects of Oil Extraction Methods
on Physical and Chemical Properties of Red Salmon Oils (Oncorhynchus nerka). J Am
Oil Chem Soc 2011;88(10):1641-8.
[16]Sidibé SS, Blin J, Vaitilingom G, Azoumah Y. Use of crude filtered vegetable oil as
a fuel in diesel engines state of the art: Literature review. Renewable and Sustainable
Energy Reviews 2010;14(9):2748-59.
158
[17]Esteban B, Riba J, Baquero G, Rius A, Puig R. Temperature dependence of density
and viscosity of vegetable oils. Biomass Bioenergy 2012;42:164-71.
[18]Jayasinghe P, Hawboldt K. A review of bio-oils from waste biomass: Focus on fish
processing waste. Renewable and Sustainable Energy Reviews 2012;16(1):798-821.
[19]Rubio-Rodríguez N, de Diego SM, Beltrán S, Jaime I, Sanz MT, Rovira J.
Supercritical fluid extraction of fish oil from fish by-products: A comparison with other
extraction methods. J Food Eng 2012;109(2):238-48.
[20]Cheng C, Du T, Pi H, Jang S, Lin Y, Lee H. Comparative study of lipid extraction
from microalgae by organic solvent and supercritical CO2. Bioresour Technol
2011;102(21):10151-3.
[21]Dunford NT, Temelli F, LeBlanc E. Supercritical CO2 Extraction of Oil and
Residual Proteins from Atlantic Mackerel (Scomber scombrus) as Affected by Moisture
Content. J Food Sci 1997;62(2):289-94.
[22]Sahena F, Zaidul ISM, Jinap S, Jahurul MHA, Khatib A, Norulaini NAN. Extraction
of fish oil from the skin of Indian mackerel using supercritical fluids. J Food Eng
2010;99(1):63-9.
[23]Reverchon E, De Marco I. Supercritical fluid extraction and fractionation of natural
matter. The Journal of Supercritical Fluids 2006;38(2):146-66.
[24]Herrero M, Mendiola JA, Cifuentes A, Ibáñez E. Supercritical fluid extraction:
Recent advances and applications. Journal of Chromatography A 2010;1217(16):2495-
2511.

159
[25]Rubio-Rodríguez N, de Diego SM, Beltrán S, Jaime I, Sanz MT, Rovira J.
Supercritical fluid extraction of the omega-3 rich oil contained in hake (Merluccius
capensis–Merluccius paradoxus) by-products: Study of the influence of process
parameters on the extraction yield and oil quality. The Journal of Supercritical Fluids
2008;47(2):215-26.
[26]Jayasinghe P, Adeoti I, Hawboldt K. A Study of Process Optimization of Extraction
of Oil from Fish Waste for Use as A Low-Grade Fuel. J Am Oil Chem Soc
2013;90(12):1903-15.
[27]Parrish C editor. Determination of total lipid, lipid classes, and fatty acids in aquatic
samples. In: Arts MT, Wainman B (eds) Lipids in freshwater ecosystems, New York:
Springer-Verlag; 1999. pp 4–20.
[28]Deibel D, Parrish CC, Grønkjæ P, Munk P, Nielsen TG. Lipid Class and Fatty Acid
Content of the Leptocephalus Larva of Tropical Eels. Lipids 2012;47(6):623-34.
[29] Brookfield Engineering Laboratories Incoporation. More Solutions to Sticky
Problems: A Guide to Getting More from Your Brookfield Viscometer. Brookfield
Engineering Laboratories, Inc.c2000, Middleboro, (MA). ISO 9001, p.1-54.
[30]Sathivel S, Huang J, Prinyawiwatkul W. Thermal properties and applications of the
Arrhenius equation for evaluating viscosity and oxidation rates of unrefined pollock oil. J
Food Eng 2008;84(2):187-93.
[31]Huang J, Sathivel S. Thermal and rheological properties and the effects of
temperature on the viscosity and oxidation rate of unpurified salmon oil. J Food Eng
2008;89(2):105-11.
160
[32] Rao MA. Rheology of fluid and semisolid foods: principles and applications. 2nd ed.
New York: Springer: c2007.
[33]Devittori C, Gumy D, Kusy A, Colarow L, Bertoli C, Lambelet P. Supercritical fluid
extraction of oil from millet bran. J Am Oil Chem Soc 2000;77(6):573-9.
[34]Kartika AI, Pontalier PY, Rigal L. Extraction of sunflower oil by twin screw
extruder: Screw configuration and operating condition effects. Bioresour Technol
2006;97(18):2302-10.
[35]Jayasinghe P, Hawboldt K. Biofuels from fish processing plant effluents – waste
characterization and oil extraction and quality. Sustainable Energy Technologies and
Assessments 2013;4(0):36-44.
[36]Huang J, Sathivel S. Purifying salmon oil using adsorption, neutralization, and a
combined neutralization and adsorption process. J Food Eng 2010;96(1):51-8.
[37]Sathivel S. Thermal and flow properties of oils from salmon heads. J Am Oil Chem
Soc 2005;82(2):147-52.
[38]Patil PD, Gude VG, Reddy HK, Muppaneni T, Deng S. Biodiesel Production from
Waste Cooking Oil Using Sulfuric Acid and Microwave Irradiation Processes. Journal of
environmental protection (Irvine, Calif.) 2012;3(1):107-13.
[39] Araújo KLGV, Epaminondas PS, Silva MCD, deLima AEA, Rosenhaim R, Maia
AS, et al. Influence of thermal degradation in the physicochemical properties of fish oil.
Journal of Thermal Analysis and Calorimetry 2011;106(2):557-61.
[40]Wiedermann LH. Degumming, refining and bleaching soybean oil. J Am Oil Chem
Soc 1981;58(3):159-66.

161
[41]Chiou BS, El‐Mashad HM, Avena‐Bustillos RJ, Dunn RO, Bechtel PJ, McHugh TH,
Imam SH, et al. Biodiesel From Waste Salmon Oil. American Society of Agricultural and
Biological Engineers 2008;51(3):797-802.
[42]Hellı´n LCCM. Incidence of frying in the composition of the lipid fraction of several
snacks of generalized consumption in our country. Anal. Bromatol. 1984;36:5-31.
[43]Sivaramakrishnan K. Determination of Higher Heating Value of Biodiesels.
International Journal of Engineering Science and Technology (IJEST) 2011;3(11):7981-
7.
[44]Sathivel S, Prinyawiwatkul W, Negulescu I, King J, Basnayake BFA. Effects of
purification process on rheological properties of catfish oil. J Am Oil Chem Soc
2003;80(8):829-32.
[45]BYK Additives and Instruments. Rheology Additives: Increasing viscosity -
Pseudoplastic rheology additives ; Accessed on February 26th 2014.
[46]Karazhiyan H, Razavi SMA, Phillips GO, Fang Y, Al-Assaf S, Nishinari K, et al.
Rheological properties of Lepidium sativum seed extract as a function of concentration,
temperature and time. Food Hydrocoll 2009;23(8):2062-8.
CHAPTER 6
LIFE CYCLE ANANLYSIS (LCA) COMPARISON OF FISH OIL
EXTRACTION METHODS
6.1 Introduction

162
In the area of sustainable energy substitutes, biofuel has been proposed as a replacement
for fossil fuels. A number of biomass sources have been proposed as feedstock for
biofuels and a brief summary is outlined in Table 6.1.
Table 6.1: Studies on alternative options for petroleum fuels
Feedstock Study Reference
Salmon oil Biodiesel production [9]
Fish oil and fish oil
biodiesel
Comparative study with
mineral fuel [10]
Fish oil biodiesel Performance and emission
evaluation [11]
Vegetable oil Biodiesel production [12]
Fish oil Alternative Fuel for
Conventional Combustors [13]
Fish oil Low-Grade Fuel [14]
Marine oils
Biodiesel/marine diesel
blends on stationary
diesel engine
[15]
Soap stock of marine fish Fuel properties of
biodiesel [16]
Marine fish wastes
Engine performance and
emission characteristics of
fish-oil biodiesel
[17]
Waste cooking oil Biodiesel Production [18]
Rubber seed oil Biodiesel production from [19]
Waste fish oil Renewable fuel in Iran [20]
The quality of the biofuel are influenced by the quality of the feedstock, the method of
extraction [1-3] and the processing conditions, which need to be carefully managed to
obtain a high quality fuel. Atabani et al. [4] showed that biodiesel quality is a function of
feedstock fatty acid composition, production, and refining method(s). Biofuels from fish
waste has been proposed as a possible low quality fuel oil or as a source for biodiesel
163
production [9, 10, 14, 15 and 20]. Fish oil is also extracted for edible oils. In remote
locations or fish plants with limited infrastructure the extraction of edible oils may not be
possible due to distance to market, regulatory requirements for storage and transport,
among other factors. Fish oil extraction methods can be physical, biological and chemical
and various methods are summarized in a previous review [3]. Physical extraction, also
known as wet reduction, is the most widely used fish oil recovery process and includes
basic unit operations such as grinding, heating, pressing, and separation [3,5]. The
enzymes are employed to accelerate the process of breaking the proteins into smaller
groups, enhancing oil extraction in biological extraction, while solvent extraction uses
chemicals or solvents for oil extraction. Supercritical fluid extraction (SFE) process using
carbon dioxide (SC-CO2) is advantageous compared to conventional extraction processes
due to high quality of oils, reduced environmental impacts, mild extracting temperature,
etc. This method minimizes the oxidation of the oil (which reduces fuel quality and
ability to refine to biodiesel) and extracts low polar lipid substances [6]. However, an
environmental assessment of this process for extraction of oil for fuel from fish waste
relative to conventional methods has not been done.
Life cycle assessments (LCA) are an environmental assessment tool used in the
quantification of environmental burdens and potential impacts associated with the whole
life cycle of a product, process, or activity [7,8]. A LCA can assess the efficiency,
environmental impacts and cost benefits of products and processes. Many researchers
have studied LCA of biofuel products and processes (Table 6.2), however, the LCA on
oil extraction/recovery processes is less well studied. The purpose of this work is to carry
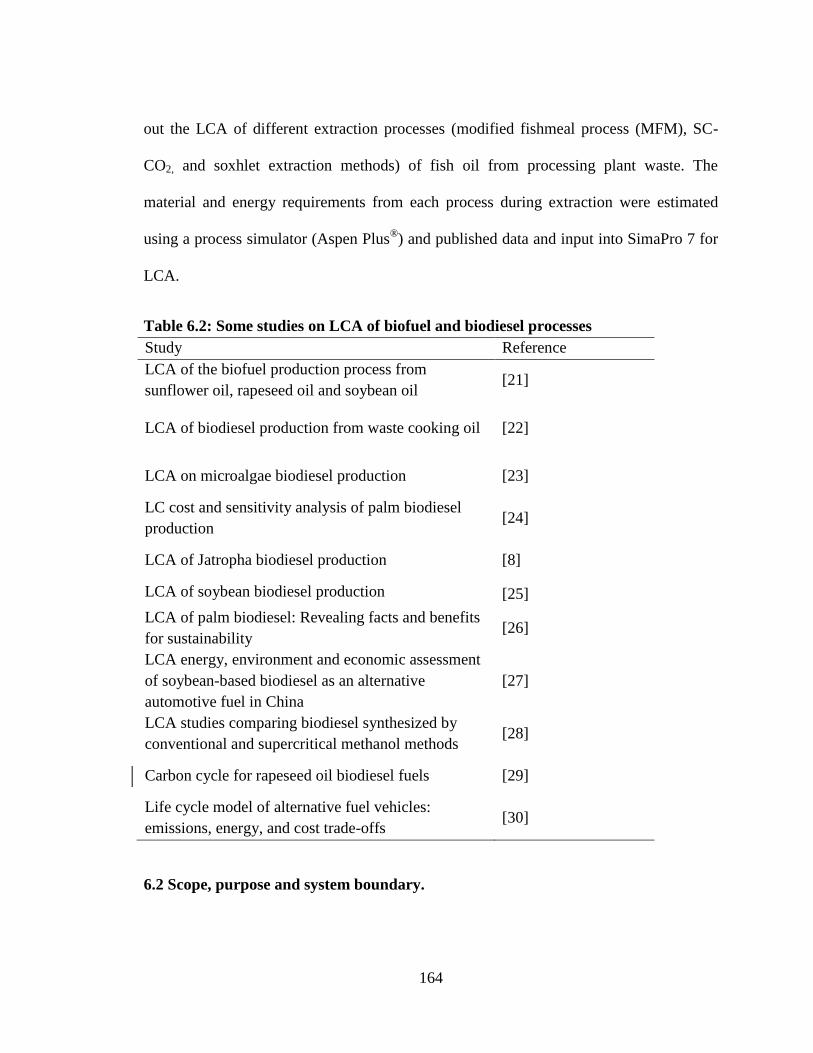
164
out the LCA of different extraction processes (modified fishmeal process (MFM), SC-
CO2, and soxhlet extraction methods) of fish oil from processing plant waste. The
material and energy requirements from each process during extraction were estimated
using a process simulator (Aspen Plus®) and published data and input into SimaPro 7 for
LCA.
Table 6.2: Some studies on LCA of biofuel and biodiesel processes
Study Reference
LCA of the biofuel production process from
sunflower oil, rapeseed oil and soybean oil [21]
LCA of biodiesel production from waste cooking oil [22]
LCA on microalgae biodiesel production [23]
LC cost and sensitivity analysis of palm biodiesel
production [24]
LCA of Jatropha biodiesel production [8]
LCA of soybean biodiesel production [25]
LCA of palm biodiesel: Revealing facts and benefits
for sustainability [26]
LCA energy, environment and economic assessment
of soybean-based biodiesel as an alternative
automotive fuel in China
[27]
LCA studies comparing biodiesel synthesized by
conventional and supercritical methanol methods [28]
Carbon cycle for rapeseed oil biodiesel fuels [29]
Life cycle model of alternative fuel vehicles:
emissions, energy, and cost trade-offs [30]
6.2 Scope, purpose and system boundary.

165
The scope of the LCA includes the energy consumption and material emissions (Fig.6.1)
of the proposed fish oil extraction processes. Fish waste can vary; in the study we
considered a comprehensive waste composition (heads, guts, trimmings, and frames). The
crude fish oil extracted is the final product. As the study is focused on comparing
extraction methods, the emissions associated with fish oil as a fuel were not included;
however the quality of the oil for fuel use as a function extraction method will be
evaluated. The LCA of un-recycled fish waste has been previously studied in our lab [34]
therefore, not included in the current research. The process boundary included the
materials, energy, and process effluents (Fig.6.1). The functional unit used for inventory
analysis is per 1 kg of crude fish oil (product).

166
Fish processing plant
waste (Feedstock)
+ Water
Heat energy
(Electricity)
Chemical (Hexane)
Carbon dioxide
Oil extraction
or
recovery processes
CO2
recycled
Chemical
residue to
landfill and
atmosphere
Waste water to
landfill
Crude fish oil
Stationary
engines
Blends for transportation,
power generation
Boiler and
home heating
Solid
(fish cake)
Fishmeal, compost, landfill
Figure 6.1: LCA process boundary
6.2.1 Methodology
LCAs are used to link life cycle inventory (LCI) results to environmental impacts. In
Sigma Pro the method used to link LCI results is ''IMPACT 2002+''. In this method, the
LCI results are first linked to 14 midpoint categories, which are in turn linked to four
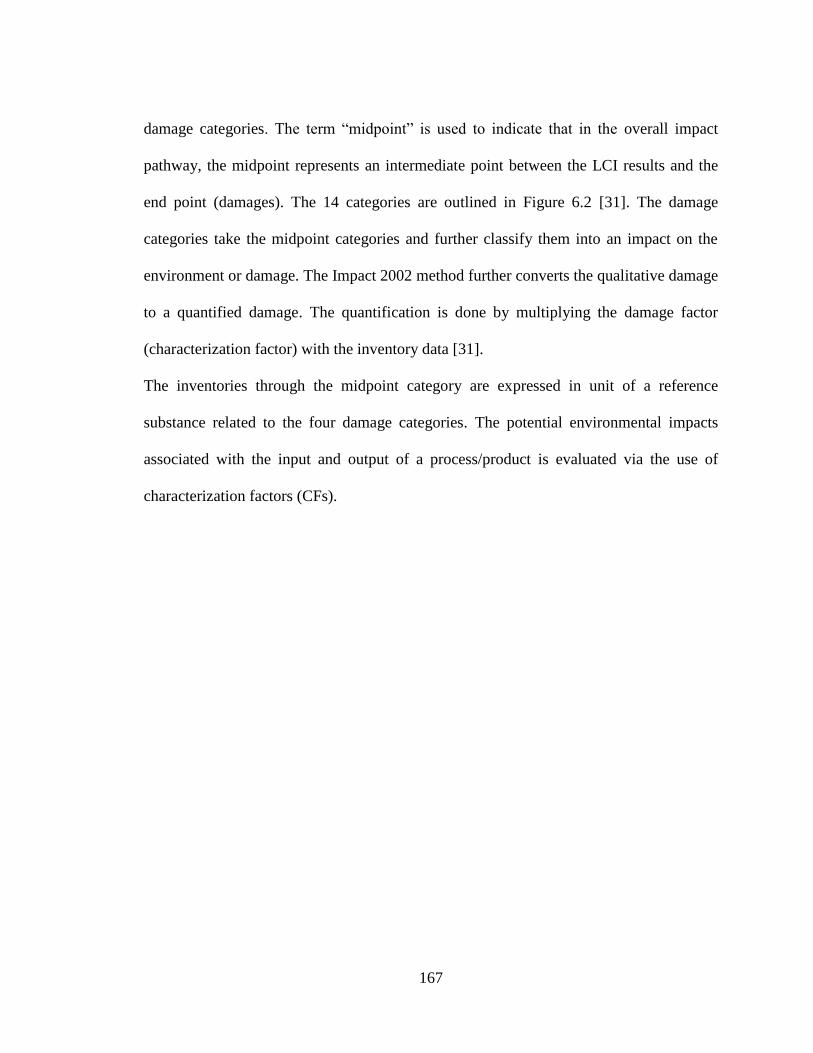
167
damage categories. The term “midpoint” is used to indicate that in the overall impact
pathway, the midpoint represents an intermediate point between the LCI results and the
end point (damages). The 14 categories are outlined in Figure 6.2 [31]. The damage
categories take the midpoint categories and further classify them into an impact on the
environment or damage. The Impact 2002 method further converts the qualitative damage
to a quantified damage. The quantification is done by multiplying the damage factor
(characterization factor) with the inventory data [31].
The inventories through the midpoint category are expressed in unit of a reference
substance related to the four damage categories. The potential environmental impacts
associated with the input and output of a process/product is evaluated via the use of
characterization factors (CFs).
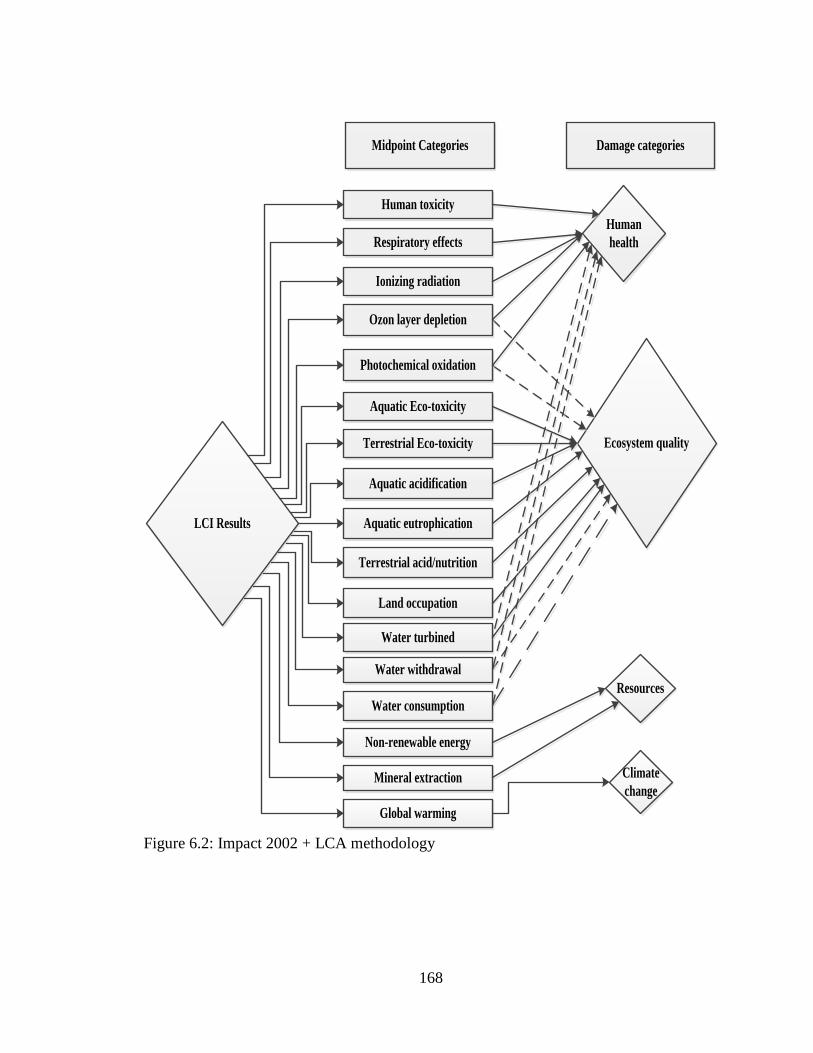
168
Midpoint Categories
Human toxicity
Respiratory effects
Ionizing radiation
Ozon layer depletion
Photochemical oxidation
Aquatic Eco-toxicity
Aquatic acidification
Terrestrial acid/nutrition
Land occupation
Water turbined
Water withdrawal
Water consumption
Non-renewable energy
Mineral extraction
Global warming
Damage categories
LCI Results
Ecosystem quality
Human
health
Resources
Climate
change
Aquatic eutrophication
Terrestrial Eco-toxicity
Figure 6.2: Impact 2002 + LCA methodology
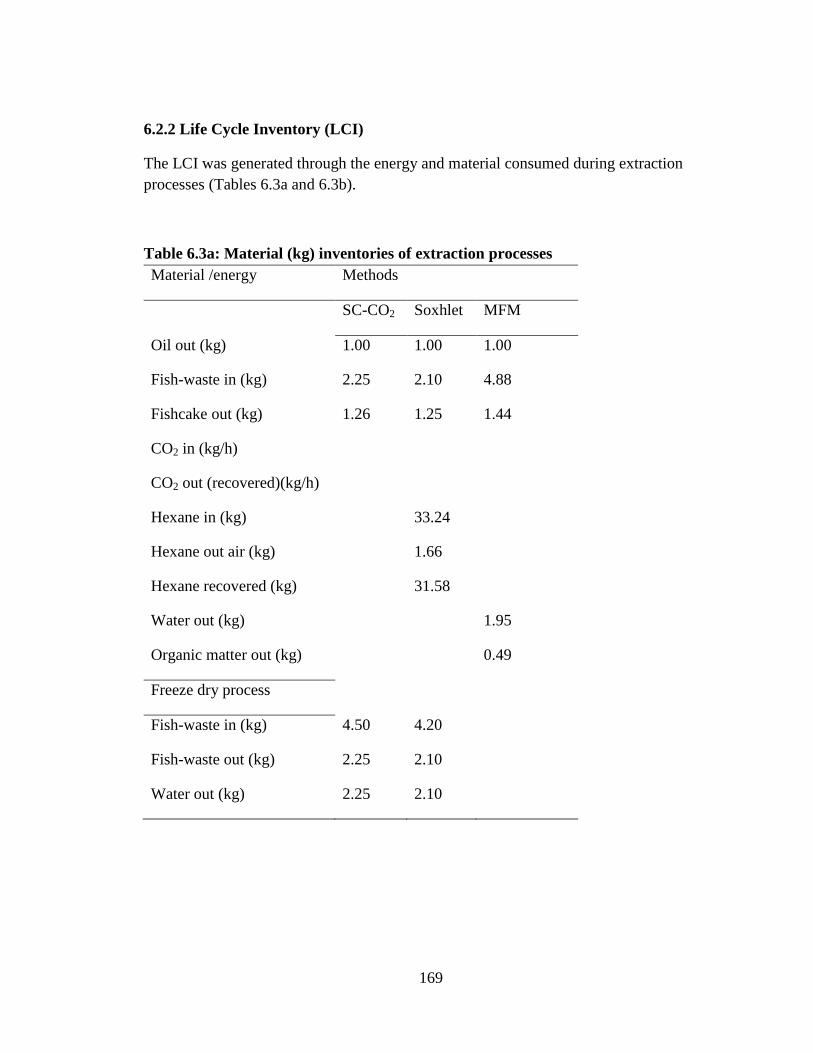
169
6.2.2 Life Cycle Inventory (LCI)
The LCI was generated through the energy and material consumed during extraction
processes (Tables 6.3a and 6.3b).
Table 6.3a: Material (kg) inventories of extraction processes
Material /energy Methods
SC-CO2 Soxhlet MFM
Oil out (kg) 1.00 1.00 1.00
Fish-waste in (kg) 2.25 2.10 4.88
Fishcake out (kg) 1.26 1.25 1.44
CO2 in (kg/h)
CO2 out (recovered)(kg/h)
Hexane in (kg)
33.24
Hexane out air (kg)
1.66
Hexane recovered (kg)
31.58
Water out (kg)
1.95
Organic matter out (kg)
0.49
Freeze dry process
Fish-waste in (kg) 4.50 4.20
Fish-waste out (kg) 2.25 2.10
Water out (kg) 2.25 2.10

170
Table 6.3b: Energy (kJ) inventories of extraction processes
Equipment MFM Soxhlet SC-CO2
Conveyor 486.30 187.53 203.94
Grinder/Crusher 482.44 186.04 202.32
Pump 486.75 187.71 204.13
Heat exchanger 5582.46 2152.78 2341.15
Pump 486.75
Twin screw press 573.53
Vertical centrifuge 1.51
Freeze dryer
1202.99 1308.25
Conveyor
187.53 203.94
Sub-Cooler
221.21
Rotaryvap/Evaporator
20.78
Grinder
186.04 202.32
CO2 Recovery
12958.18
Total energy input (MJ) 8.10 4.53 17.62
The mass of oil produced per mass of fish waste, chemicals required, and associated
waste streams for each process were determined from lab and pilot scale experiments
(Section 3.1 of chapter 5). The process flow diagram for each process is outlined in
Figures 6.3a – 6.3c and is based on lab and commercial scale data.
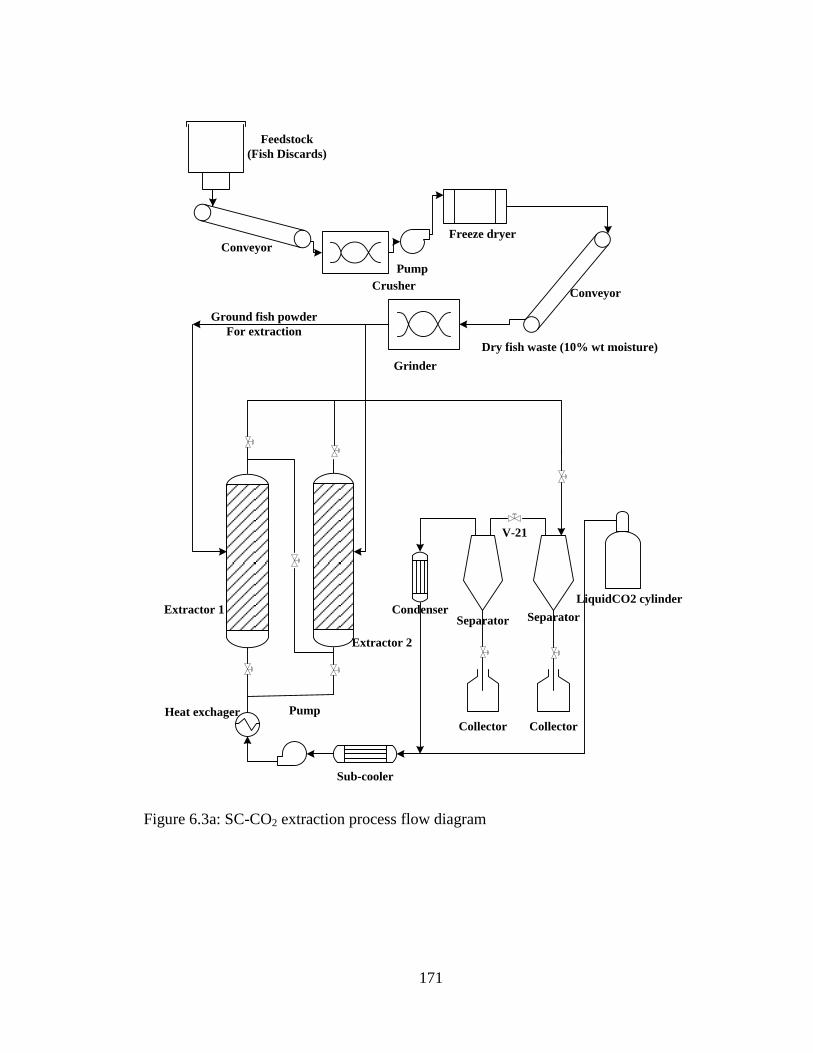
171
Crusher
Grinder
Freeze dryer
Feedstock
(Fish Discards)
Ground fish powder
For extraction
Extractor 1 Condenser
Sub-cooler
Separator
PumpHeat exchager
V-21
Separator
Collector Collector
LiquidCO2 cylinder
Dry fish waste (10% wt moisture)
Conveyor
Conveyor
Pump
Extractor 2
Figure 6.3a: SC-CO2 extraction process flow diagram

172
Crusher
Grinder
Freeze dryer
Feedstock
(Fish discards)
Pump
Ground fish powder for extraction
Extractor 1 Extractor 2
Heat exchanger
Oil collector
Make up hexane
Dry fish waste (10% wt moisture)
Conveyor
Conveyor
Rotary evaporator
Condenser
Hex
an
e
Cooling water
Figure 6.3b: Soxhlet extraction process flow diagram

173
Feedstock
(Fish discards)
Grinder
PumpPump
Cooker
Twin screw press
Conveyor
Vertical centrifuge
Cooked slurry
Fishmeal
Solid particles
Crude oil
Sticky water
Figure 6.3c: MFM extraction process flow diagram
The energy required for each unit operation, such as pumps, heat exchangers, freeze
dryers, sub-coolers and vacuum evaporators, were modeled using Aspen Plus®. The
energy input to conveyors, grinder/crusher, screw press and vertical centrifuge were
estimated using energy equations, while, the energy consumed in CO2 compression and
recovery was estimated using the energy analysis of supercritical carbon dioxide
extraction processes from Sievers and Eggers [32], and Smith et al. [33]. The results were
exported to SimaPro®7 to obtain the environmental impact assessment from the use of
energy and resources in each extraction process.

174
6.2.3 Materials and experimental methods
The feedstock is a by-product of the fish industry; specifically the offcuts (offal) from
farmed salmon (Salmo salar Linnaeus), from Cooke aquaculture provided by the Centre
for Aquaculture and Seafood Development (CASD). The detailed description of materials
and experimental methods for the fishmeal process can be found in Section 2.1 of chapter
3, soxhlet extraction method in section 3.0 of chapter 4 and the SC-CO2 in section 3.2 of
chapter 4.
6.3 Environmental impact assessment
6.3.1. Characterization
Figure 6.4 summarizes the damage characterization as a function of process. Among all
the extraction processes, only the soxhlet extraction has an impact of over 95% in the
category of carcinogens, ozone layer depletion, respiratory organics, terrestrial
ecotoxicity, and mineral extraction. The soxhlet extraction process in general has a high
impact due to emissions of hexane both in air and water or soil. The MFM process has an
impact of 92% on the aquatic eutrophication and 75% on aquatic acidification due to
process water discharge into the ocean and water bodies. This effluent is rich in nitrogen
compounds and other organics.
In the categories of aquatic ecotoxicicity, terrestrial acid/nutri and non-renewable energy,
the soxhlet extraction method has a contribution that is relatively high compared to SC-
CO2 and MFM methods. This impact can also be attributed to the impact of air emissions
of volatile hydrocarbons (hexane) during the extraction process.

175
Figure 4: Environmental impact characterization of the LCA of extraction processes.
6.3.2. Damage assessment
Figure 6.5 outlines the impact assessment, which refers to the categories as ‘harm’
instead of the ‘impact’ (as with the characterization). In the category of human health
(carcinogens and non-carcinogens combined) the soxhlet method contributed the highest
damage which, in this category, would be attributed to human exposure to n-hexane
during the process. Hexane is toxic and the most probable route of human exposure to
hexane is by inhalation and via the skin. The damage caused by the SC-CO2 in the human
health category is 35% which is mostly emissions due to energy usage (fuel, electricity
etc.). The damage contribution of the MFM process in this category is the least (13%)
which is also as a result of emissions from energy usage. Similar damage trends (soxhlet
0
10
20
30
40
50
60
70
80
90
100%
Characterization
MFM
Soxhlet
SC-CO2

176
> SC-CO2 > MFM) were observed with the ecosystem quality, climate change, and
resources. The high damage contributions from the soxhlet method would be attributed to
the damages effect from both energy consumption and solvent residue. However, the
higher effect from the SC-CO2 compared to MFM process is a reflection of higher energy
required (17.62 MJ) to produce 1 kg fish oil in SC-CO2 than (8.10 MJ) in MFM process
(Table 6.3b).
Figure 6.5: Environmental impacts by categories of damages for all extraction methods.
6.3.3. Normalization.
The objective of normalization is to reflect the relative magnitude of each impact
category of a product or system [31]. Normalization also assesses the impact category
contribution as a global environmental problem [21]. Again, the soxhlet extraction
0
10
20
30
40
50
60
70
80
90
100
Human health Ecosystem
quality
Climate
change
Resources
%
Damage assessment
MFM
Soxhlet
SC-CO2
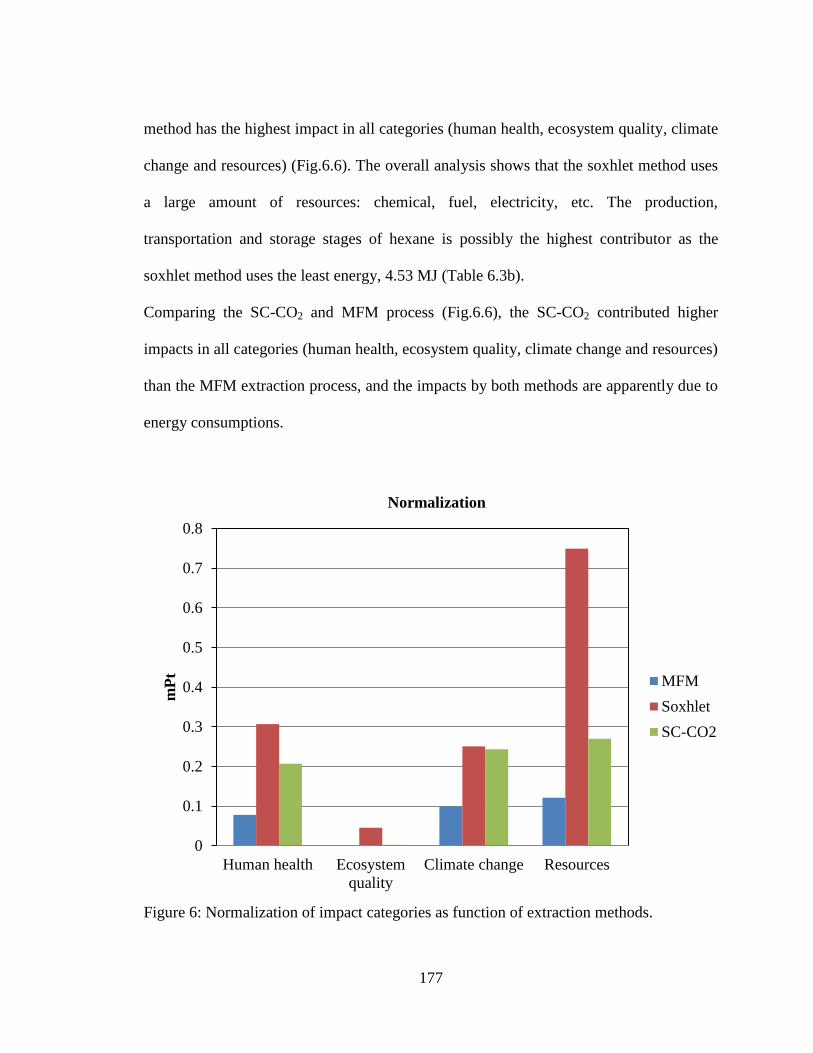
177
method has the highest impact in all categories (human health, ecosystem quality, climate
change and resources) (Fig.6.6). The overall analysis shows that the soxhlet method uses
a large amount of resources: chemical, fuel, electricity, etc. The production,
transportation and storage stages of hexane is possibly the highest contributor as the
soxhlet method uses the least energy, 4.53 MJ (Table 6.3b).
Comparing the SC-CO2 and MFM process (Fig.6.6), the SC-CO2 contributed higher
impacts in all categories (human health, ecosystem quality, climate change and resources)
than the MFM extraction process, and the impacts by both methods are apparently due to
energy consumptions.
Figure 6: Normalization of impact categories as function of extraction methods.
0
0.1
0.2
0.3
0.4
0.5
0.6
0.7
0.8
Human health Ecosystem
quality
Climate change Resources
mP
t
Normalization
MFM
Soxhlet
SC-CO2
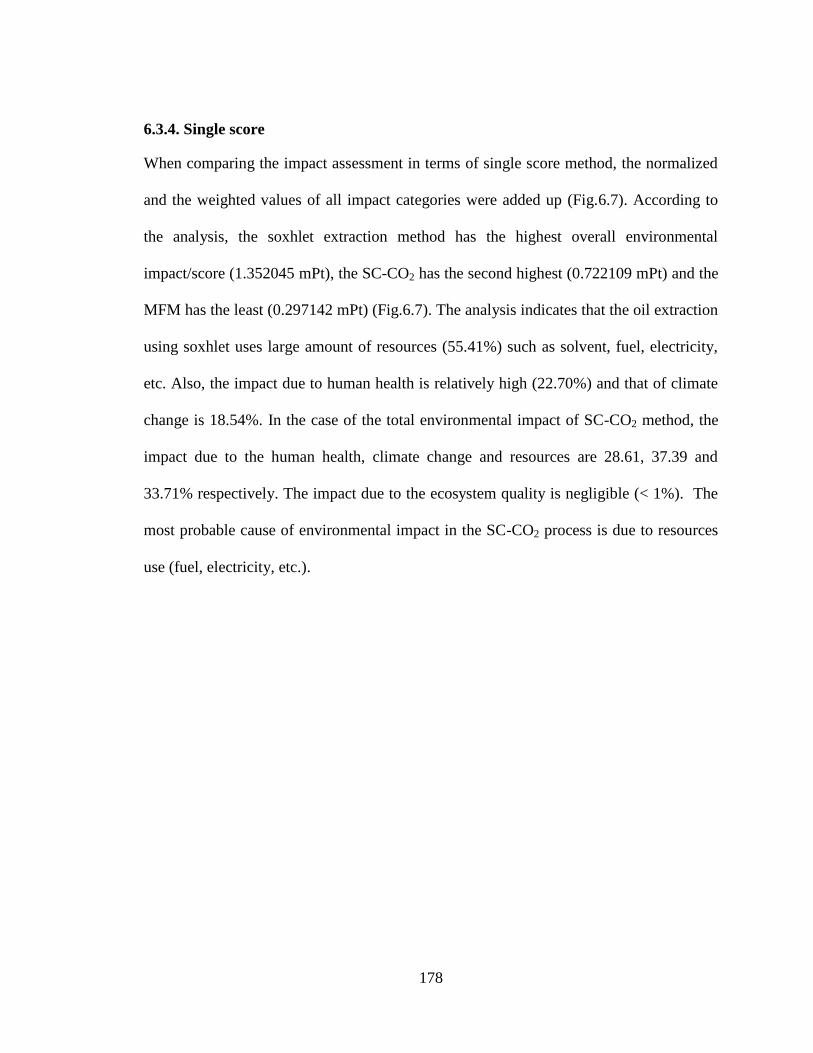
178
6.3.4. Single score
When comparing the impact assessment in terms of single score method, the normalized
and the weighted values of all impact categories were added up (Fig.6.7). According to
the analysis, the soxhlet extraction method has the highest overall environmental
impact/score (1.352045 mPt), the SC-CO2 has the second highest (0.722109 mPt) and the
MFM has the least (0.297142 mPt) (Fig.6.7). The analysis indicates that the oil extraction
using soxhlet uses large amount of resources (55.41%) such as solvent, fuel, electricity,
etc. Also, the impact due to human health is relatively high (22.70%) and that of climate
change is 18.54%. In the case of the total environmental impact of SC-CO2 method, the
impact due to the human health, climate change and resources are 28.61, 37.39 and
33.71% respectively. The impact due to the ecosystem quality is negligible (< 1%). The
most probable cause of environmental impact in the SC-CO2 process is due to resources
use (fuel, electricity, etc.).
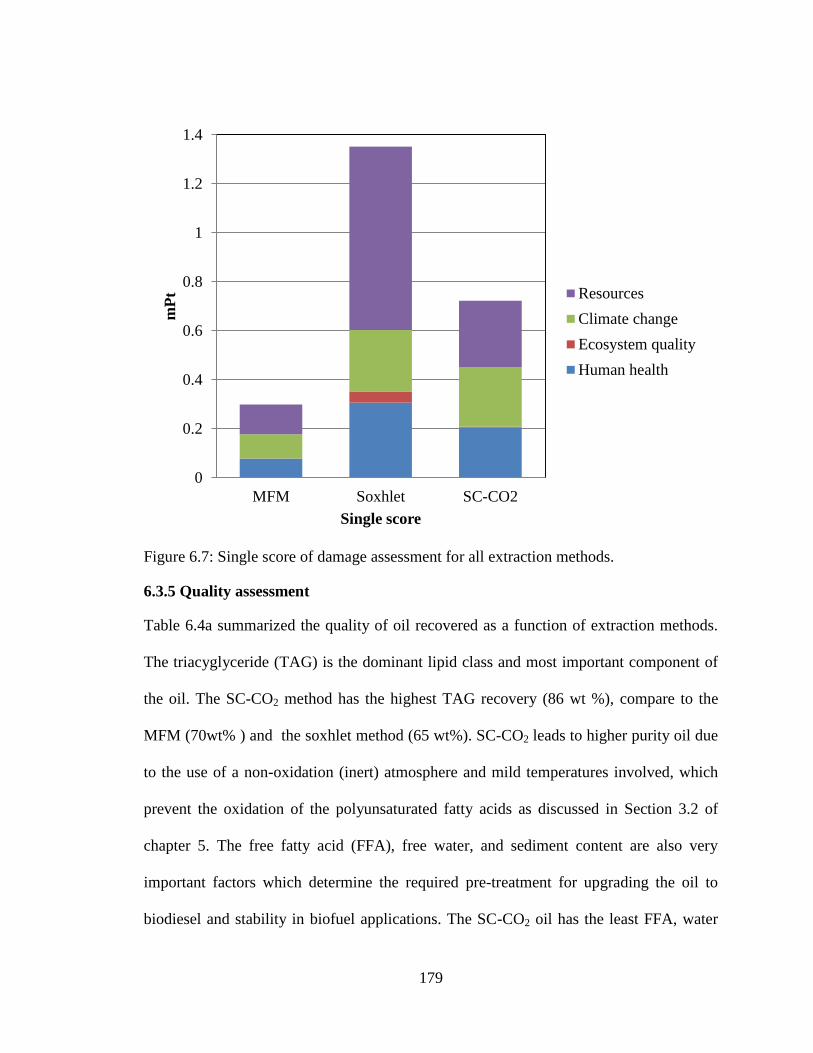
179
Figure 6.7: Single score of damage assessment for all extraction methods.
6.3.5 Quality assessment
Table 6.4a summarized the quality of oil recovered as a function of extraction methods.
The triacyglyceride (TAG) is the dominant lipid class and most important component of
the oil. The SC-CO2 method has the highest TAG recovery (86 wt %), compare to the
MFM (70wt% ) and the soxhlet method (65 wt%). SC-CO2 leads to higher purity oil due
to the use of a non-oxidation (inert) atmosphere and mild temperatures involved, which
prevent the oxidation of the polyunsaturated fatty acids as discussed in Section 3.2 of
chapter 5. The free fatty acid (FFA), free water, and sediment content are also very
important factors which determine the required pre-treatment for upgrading the oil to
biodiesel and stability in biofuel applications. The SC-CO2 oil has the least FFA, water
0
0.2
0.4
0.6
0.8
1
1.2
1.4
MFM Soxhlet SC-CO2
mP
t
Single score
Resources
Climate change
Ecosystem quality
Human health
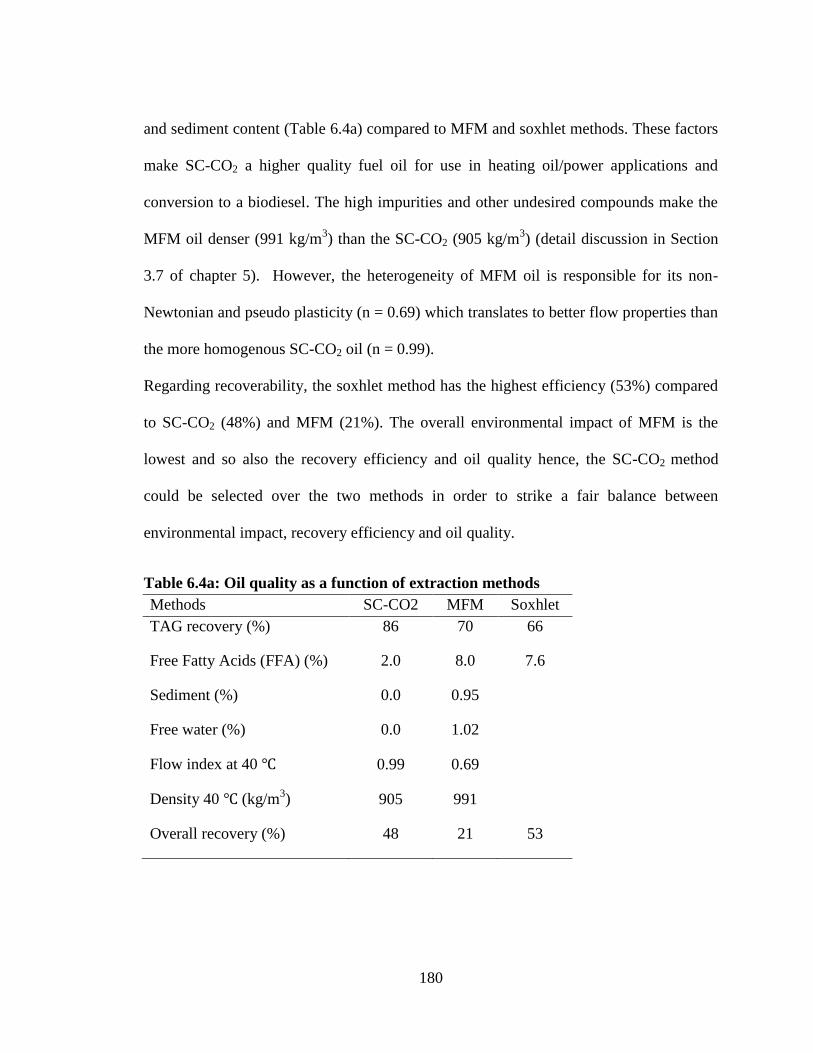
180
and sediment content (Table 6.4a) compared to MFM and soxhlet methods. These factors
make SC-CO2 a higher quality fuel oil for use in heating oil/power applications and
conversion to a biodiesel. The high impurities and other undesired compounds make the
MFM oil denser (991 kg/m3) than the SC-CO2 (905 kg/m
3) (detail discussion in Section
3.7 of chapter 5). However, the heterogeneity of MFM oil is responsible for its non-
Newtonian and pseudo plasticity (n = 0.69) which translates to better flow properties than
the more homogenous SC-CO2 oil (n = 0.99).
Regarding recoverability, the soxhlet method has the highest efficiency (53%) compared
to SC-CO2 (48%) and MFM (21%). The overall environmental impact of MFM is the
lowest and so also the recovery efficiency and oil quality hence, the SC-CO2 method
could be selected over the two methods in order to strike a fair balance between
environmental impact, recovery efficiency and oil quality.
Table 6.4a: Oil quality as a function of extraction methods
Methods SC-CO2 MFM Soxhlet
TAG recovery (%) 86 70 66
Free Fatty Acids (FFA) (%) 2.0 8.0 7.6
Sediment (%) 0.0 0.95
Free water (%) 0.0 1.02
Flow index at 40 0.99 0.69
Density 40 (kg/m3) 905 991
Overall recovery (%) 48 21 53

181
Table 6.4b: Process quality rating
Process
Human
health
Ecosystem
quality
Climate
change Resources
Fuel
quality
MFM 1 1-2 1 1 3
Soxhlet
3 3 3 2
SC-CO2 2 1-2 2 2 1
Notation: Good =1; Fair = 2; Bad = 3
6.4 Conclusion
In this study, three processes to recover bio-oil from fish wastes were compared via LCA.
The MFM method has the lowest overall environmental impact compared to the soxhlet
and SC-CO2 methods. This lower impact of MFM is reflected in the characteristics of all
impact categories except the aquatic acidification and aquatic eutrophication (Fig.6.4)
which could be due to process water discharge into oceans. However, the high aquatic
acidification and aquatic eutrophication reflected a lower damage to the ecosystem
quality. When considering categories of damage, the soxhlet extraction method, due to
the use of solvent, has the greatest impacts on all the four categories (human health,
ecosystem quality, climate change and resources). However, the oil quality produced by
soxhlet method is higher from a fuel perspective than the MFM method (Table 6.4).
The SC-CO2 method falls between the soxhlet and MFM in damage in all the four
categories (human health, ecosystem quality, climate change and resources). This method
requires more energy (17.62 MJ to produce 1 kg oil) than the MFM and soxhlet methods
(Table 6.3b). The damage is due to emissions of gases as a result of energy and resources
usage (fuel, electricity, etc.). The CO2 recovery unit consumes the most energy input

182
(74%) in this process. However, the SC-CO2 method produced the best quality oil of the
three methods.
Acknowledgements
The authors would like to acknowledge the funding provided by the Government of
Newfoundland and Labradors (Green Fund) and, NSERC (Natural Science and
Engineering Research Council of Canada).
183
References
[1]Nguyen H. Extraction of oil from Moringa oleifera kernels using supercritical carbon
dioxide with ethanol for pretreatment: Optimization of the extraction process. Chem Eng
Process 2011 -11-01;50(11-12):1207; 1207-1213; 1213.
[2]Blin J, Brunschwig C, Chapuis A, Changotade O, Sidibe SS, Noumi ES, et al.
Characteristics of vegetable oils for use as fuel in stationary diesel engines—Towards
specifications for a standard in West Africa. Renewable and Sustainable Energy Reviews
2013 6;22(0):580-597.
[3]Adeoti IA, Hawboldt K. A review of lipid extraction from fish processing by-product
for use as a biofuel. Biomass Bioenergy 2014 4;63(0):330-340.
[4]Atabani AE, Silitonga AS, Ong HC, Mahlia TMI, Masjuki HH, Badruddin IA, et al.
Non-edible vegetable oils: A critical evaluation of oil extraction, fatty acid compositions,
biodiesel production, characteristics, engine performance and emissions production.
Renewable and Sustainable Energy Reviews 2013 2;18(0):211-245.
[5]Jayasinghe P, Hawboldt K. A review of bio-oils from waste biomass: Focus on fish
processing waste. Renewable and Sustainable Energy Reviews 2012 1;16(1):798-821.
[6]Mis Solval K, Sathivel S. Use of an Adsorption Process for Purification of Pollock-
Oil-Based Biodiesel Comprises Methyl Esters. J Am Oil Chem Soc 2012;89(9):1713-
1721.
[7]Azapagic A. Life cycle assessment and its application to process selection, design and
optimisation. Chem Eng J 1999 4;73(1):1-21.

184
[8]Kaewcharoensombat U, Prommetta K, Srinophakun T. Life cycle assessment of
biodiesel production from jatropha. Journal of the Taiwan Institute of Chemical
Engineers 2011 5;42(3):454-462.
[9]B.S. Chiou, H. M. El-Mashad, R. J. Avena-Bustillos, R. O. Dunn, P. J. Bechtel, T. H.
McHugh, S. H. Imam, G. M. Glenn, W. J. Orts, R. Zhang. Biodiesel From Waste Salmon
Oil. American Society of Agricultural and Biological Engineers 2008;51(3):797-802.
[10]Behcet R. A comparative study on anchovy fish oil, anchovy fish oil methyl ester and
diesel fuels in a diesel engine. Energy Education Science And Technology Part A-Energy
Science And Research 2011;27(2):313-322.
[11]Behçet R. Performance and emission study of waste anchovy fish biodiesel in a
diesel engine. Fuel Process Technol 2011 6;92(6):1187-1194.
[12]Demirbas A. Biodiesel production from vegetable oils via catalytic and non-catalytic
supercritical methanol transesterification methods. Progress in Energy and Combustion
Science 2005;31(5–6):466-487.
[13]Preto F, Zhang F, Wang J. A study on using fish oil as an alternative fuel for
conventional combustors. Fuel 2008 8;87(10–11):2258-2268.
[14]Jayasinghe P, Adeoti I, Hawboldt K. A Study of Process Optimization of Extraction
of Oil from Fish Waste for Use as A Low-Grade Fuel. J Am Oil Chem Soc
2013;90(12):1903-1915.
[15]Kalligeros S, Zannikos F, Stournas S, Lois E, Anastopoulos G, Teas C, et al. An
investigation of using biodiesel/marine diesel blends on the performance of a stationary
diesel engine. Biomass Bioenergy 2003 2;24(2):141-149.
185
[16]Lin C, Li R. Fuel properties of biodiesel produced from the crude fish oil from the
soapstock of marine fish. Fuel Process Technol 2009 1;90(1):130-136.
[17]Lin C, Li R. Engine performance and emission characteristics of marine fish-oil
biodiesel produced from the discarded parts of marine fish. Fuel Process Technol 2009
0;90(7–8):883-888.
[18]Patil P. Biodiesel Production from Waste Cooking Oil Using Sulfuric Acid and
Microwave Irradiation Processes. Journal of environmental protection (Irvine, Calif.)
2012 -01-01;3(1):107.
[19]Ramadhas AS, Jayaraj S, Muraleedharan C. Biodiesel production from high FFA
rubber seed oil. Fuel 2005 3;84(4):335-340.
[20]Yahyaee R, Ghobadian B, Najafi G. Waste fish oil biodiesel as a source of renewable
fuel in Iran. Renewable and Sustainable Energy Reviews 2013 1;17(0):312-319.
[21]Sanz Requena JF, Guimaraes AC, Quirós Alpera S, Relea Gangas E, Hernandez-
Navarro S, Navas Gracia LM, et al. Life Cycle Assessment (LCA) of the biofuel
production process from sunflower oil, rapeseed oil and soybean oil. Fuel Process
Technol 2011 2;92(2):190-199.
[22]Varanda MG, Pinto G, Martins F. Life cycle analysis of biodiesel production. Fuel
Process Technol 2011 5;92(5):1087-1094.
[23]Yang J, Xu M, Zhang X, Hu Q, Sommerfeld M, Chen Y. Life-cycle analysis on
biodiesel production from microalgae: Water footprint and nutrients balance. Bioresour
Technol 2011 1;102(1):159-165.
186
[24]Ong HC, Mahlia TMI, Masjuki HH, Honnery D. Life cycle cost and sensitivity
analysis of palm biodiesel production. Fuel 2012 8;98(0):131-139.
[25]Anup Pradhan. Life cycle analysis of soybean biodiesel production. United States --
Idaho: University of Idaho; 2010.
[26]Yee KF, Tan KT, Abdullah AZ, Lee KT. Life cycle assessment of palm biodiesel:
Revealing facts and benefits for sustainability. Appl Energy 2009 11;86, Supplement
1(0):S189-S196.
[27]Hu Z, Tan P, Yan X, Lou D. Life cycle energy, environment and economic
assessment of soybean-based biodiesel as an alternative automotive fuel in China. Energy
2008 11;33(11):1654-1658.
[28]Kiwjaroun C, Tubtimdee C, Piumsomboon P. LCA studies comparing biodiesel
synthesized by conventional and supercritical methanol methods. J Clean Prod 2009
1;17(2):143-153.
[29]Peterson CL, Hustrulid T. Carbon Cycle For Rapeseed Oil Biodiesel Fuels. Biomass
Bioenergy 1998 3/23;14(2):91-101.
[30]Hackney J, de Neufville R. Life cycle model of alternative fuel vehicles: emissions,
energy, and cost trade-offs. Transportation Research Part A: Policy and Practice 2001
3;35(3):243-266.
[31]Humbert S, Schryver AD, Bengoa X, Margni M, Jolliet O, inventors.
AnonymousIMPACT 2002+: User Guide Draft for version Q2.21 (version adapted by
Quantis). 2012.
187
[32]Sievers U, Eggers R. Heat recovery in supercritical fluid extraction process with
separation at subcritical pressure. Chemical Engineering and Processing: Process
Intensification 1996;35(4):239-246.
[33]Smith Jr RL, Inomata H, Kanno M, Arai K. Energy analysis of supercritical carbon
dioxide extraction processes. The Journal of Supercritical Fluids 1999; 15(2):145-156.
[34] Jayasinghe P. Biofuels from fish waste from remote fish processing plants in
Newfoundland and Labrador, Master’s Thesis. Memorial University of NL, November
2010.
CHAPTER 7
CONCLUSION AND RECOMMENDATIONS
188
7.1 Summary and Conclusion
The objective of this research was to investigate different fish oil extraction processes in
an effort to produce a sustainable biofuel. Physical processing and solvent extraction are
primary methods for extracting edible and inedible oils in fish processing industry.
Unpurified fish oil contains a variety of impurities such as free fatty acids, primary
oxidation products, minerals, pigments, moisture, phospholipids, and insoluble impurities
that reduce oil’s fuel quality. The amount of these impurities extracted with the oil
depends on the extraction method. Series of refining processes are normally required
after extraction (physical processing and solvent extraction) to remove these impurities,
such as degumming, deodorization, bleaching, and neutralization. However, the operating
costs associated with these refining steps coupled with loss of oil and the generation of
chemical waste streams during processing increase the overall cost. The biofuel quality
can be determined by the quality of the feedstock and the processing conditions, which
need to be carefully managed to obtain high quality fuel. Three extraction processes
(soxhlet, MFM and SC-CO2) have been studied and the objectives were to maximize fuel
quality and minimize environmental and economic costs.
This thesis is comprised of five sections:
Literature review (Chapter 2);
Characterization of fish oil and blend with petroleum fraction (Chapter 3);
Solubility of fish oil in SC-CO2 and Mass transfer modeling (Chapter 4);
Quality evaluations (Chapter 5);
189
Life cycle analysis (LCA) (Chapter 6).
7.1.1 Literature Review
This review focuses on extraction processes. An overview of developments in oil
extraction processes including physical, chemical and biological processes, which was
limited in the literature, was presented in this chapter. The waste derived oil for use as a
fuel can be a sustainable cost effective strategy for conventional combustors, boiler
engines, remote fish plants, marine vessels or in-house use. The oil product does not need
to meet high purity standards associated with edible oils but must balance fuel quality
with costs, process complexity and robust enough to handle different types and quality of
fish residue.
The majority of advanced and modified solvent extraction methods are either designed
for sample analysis or environmental studies. They have not been proven beyond
laboratory and/or pilot scale. These methods are very high in extraction efficiency but
major constraints are high environmental impacts (due to solvent residue) and low
feedstock capacity. Therefore, the solvent extractions are impractical for large scale
extraction of fuel grade oils.
The fishmeal processing is environmental friendly and relatively less energy intensive.
This process has been proven to handle high volume feedstock in commercial scales.
However, oil product quality is low and could be less stable during storage. Process
modification to improve oil quality and to reduce further product degradation during
190
processing has been suggested. Nevertheless, this process is simple and has been widely
used over the years.
The SC-CO2, although limited in large scale application, can reduce the environmental
impacts and safety issues associated with conventional solvent extraction processes.
Quality fuel with minimal impurities can be achieved through this method. However, the
costs of energy (e.g. CO2 recycling, compression and freeze drying) and infrastructure
associated with required high pressures need further assessment. More feasibility studies
are also required to determine whether SC-CO2 is sustainable in commercial scale.
Biological processes are environmentally friendly and safe. The major problem is that the
processes required costly enzymes and the process control is very limited. The targeted
product is protein concentrate. Hydrolysis of FFA and oil-water emulsion usually prevails
due to long residence time and further downstream processing is also required. Therefore;
the biological process condition is not suitable for quality fuel oil products.
7.1.2 Characterization of fish oil and blends
In this chapter the fishmeal process was modified and the quality of oil was improved
compared to fishmeal process oil. The oil was blended with petroleum distillate (20 – 80
% wt.) and analyzed for physico-chemical, thermal and rheological properties. These
analyses determined certain characteristics valuable in understanding biofuel behavior
during application. The power law effectively described the flow properties of the oil,
petroleum distillate and their blends as shear thinning fluid. As the fish: petroleum
distillate mixture ratio increased, the flow property of the blend improves due to
191
decreased activation energy (flow barrier). As proposed in the literature ([2,4] chapter 3),
the fish oil blend with petroleum distillates minimize CO and Sulphur emission in
combustion engines therefore, the blend application provides the possibility to
combat/reduce the environmental impact due to emissions characteristics of heavy
petroleum distillates.
7.1.3 SFE and mass transfer modeling
The SC-CO2 extraction method is effective in terms of recovery, quality product and
environmental impact. The mass transfer rate effectively described the SC-CO2 extraction
process. For design and scale up purposes the optimum extraction condition and the
controlling parameters are very important. For instance when external mass transfer is the
controlling factor, as determined in the first stage of extraction (section 4.1 chapter 4),
good practice for scale-up would be to keep the solvent to solid ratio constant. So when
the maximum solubility of the fish oil in the SC-CO2 is maintained, then the extraction
may be completed using small amount of SC-CO2 possible. A maximum yield is always
desirable, but as overall oil content of the solid phase decrease, the cost of the extraction
would increase. In many cases the extraction process in commercial operations is
considered complete when 90% of the solute has been extracted. Therefore, it would be
ideal to complete the extraction system when the system is operating in the first stage of
extraction, which is limited by the solubility of the fish oil in the SC-CO2. Furthermore,
designing equipment to operate optimally as modeled in this chapter would require
certain inputs be fixed, such as temperature, pressure, and flow rate, etc. The major

192
problem then is how to effectively scale-up to larger/commercial scale production. Thus
appropriate scale-up factors must be determined for the process. However, it may be
inappropriate to scale up all factors at the same rate as the extraction process may be
constrained by certain key parameters (e.g. SC-CO2 flow rate, solubility, solid moisture
content, etc.), and others do not contribute to the desired extraction efficiency/outcome.
7.1.4 Quality evaluation
The quality of oils from the three different extraction processes (soxhlet, MFM and SC-
CO2) were analyzed. This chapter demonstrated the effect of extraction methods on
chemical composition, thermal, physicochemical, and flow properties of salmon waste
derived oils. The solvent extraction method as proposed in chapter 2, is only suitable for
sample analysis due to low feedstock capacity therefore, the MFM and SC-CO2 were
major focus. The lipid composition analysis determined the major chemical classes of
lipids.
The TAG lipid class is the major constituent and the most important compound useful for
biofuels. The nature of fatty acid constituents of TAG largely determines the oil’s
combustion property. TAG can be converted to biodiesel and should be maximized in
order to maximize biodiesel product. Compounds such as FFA, PL, AMPL, water and
sediments are undesirable for quality oil and should be eliminated or minimized during
extraction. In comparison to other methods, the SC-CO2 method recovered the highest
TAG content and minimized the content of all undesirable compounds. As such, SC-CO2
oil would have fewer performance problems when considered for biofuel application.
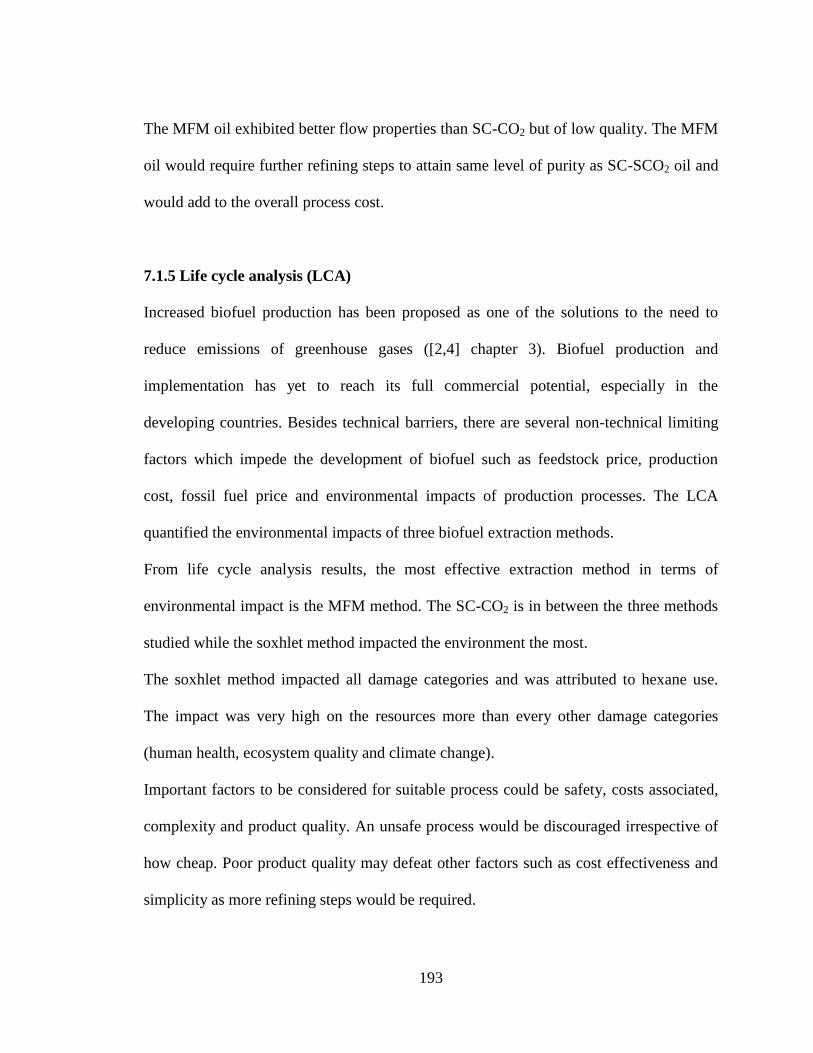
193
The MFM oil exhibited better flow properties than SC-CO2 but of low quality. The MFM
oil would require further refining steps to attain same level of purity as SC-SCO2 oil and
would add to the overall process cost.
7.1.5 Life cycle analysis (LCA)
Increased biofuel production has been proposed as one of the solutions to the need to
reduce emissions of greenhouse gases ([2,4] chapter 3). Biofuel production and
implementation has yet to reach its full commercial potential, especially in the
developing countries. Besides technical barriers, there are several non-technical limiting
factors which impede the development of biofuel such as feedstock price, production
cost, fossil fuel price and environmental impacts of production processes. The LCA
quantified the environmental impacts of three biofuel extraction methods.
From life cycle analysis results, the most effective extraction method in terms of
environmental impact is the MFM method. The SC-CO2 is in between the three methods
studied while the soxhlet method impacted the environment the most.
The soxhlet method impacted all damage categories and was attributed to hexane use.
The impact was very high on the resources more than every other damage categories
(human health, ecosystem quality and climate change).
Important factors to be considered for suitable process could be safety, costs associated,
complexity and product quality. An unsafe process would be discouraged irrespective of
how cheap. Poor product quality may defeat other factors such as cost effectiveness and
simplicity as more refining steps would be required.

194
7.2.0 Recommendations
The major part of this research provided information on a laboratory scale basis.
The extraction and blending experimental were all performed at laboratory scale;
further work is required to confirm the results on a pilot or commercial scale.
Design parameters should be validated at lager scales for design purposes.
The optimization of SC-CO2 extraction process in this research was based on one
factor at a time (OFAT) approach. Further work can focus on a comprehensive
design of experiment (DOE) to investigate the interaction effect of two or more
factors. The DOE could determine important parameters for optimum recovery
conditions and also, the interaction effect of factors such as temperature, pressure,
SC-CO2 flow rates, particle size etc. could be detected with minimum number of
experiments.
The SC-CO2 provided high quality oil as proven in this research. Further work
such as stability test and blending with mineral fuel as done on the MFM oil
(Chapter 3) should also be performed on SC-CO2 oil. Further, given the more
homogenous nature of SC-CO2 oil, it may blend more effectively with petroleum
based fuels.
The LCA in this work used literature simulated energy and other inputs which
could be refined with actual data based on larger scale.

195
Further studies should also focus on extraction process integration into actual
power plants, central heating systems, marine vessels or fish processing plants.
Biological extraction processes such as hydrolysis and fermentation method
should also be a future subject of study. Fish hydrolysate could find a good use
(feedstock) in fertilizer and fish farming industries therefore a hydrolysis process
could be part of fertilizer/animal feed processing steps.
The current work does not include cost evaluation of all the processes studied. In
future studies, the evaluation of the costs associated with each of the extraction
process is highly recommended in order to determine their economic feasibility.

196
APPENDIX
APPENDIX I
Thermogravimetric and rheological analysis of other fish species other than salmon.
Thermal degradation of the Cod oil under nitrogen and air atmosphere.

197
Thermal degradation of the Herring oil under nitrogen and air atmosphere.
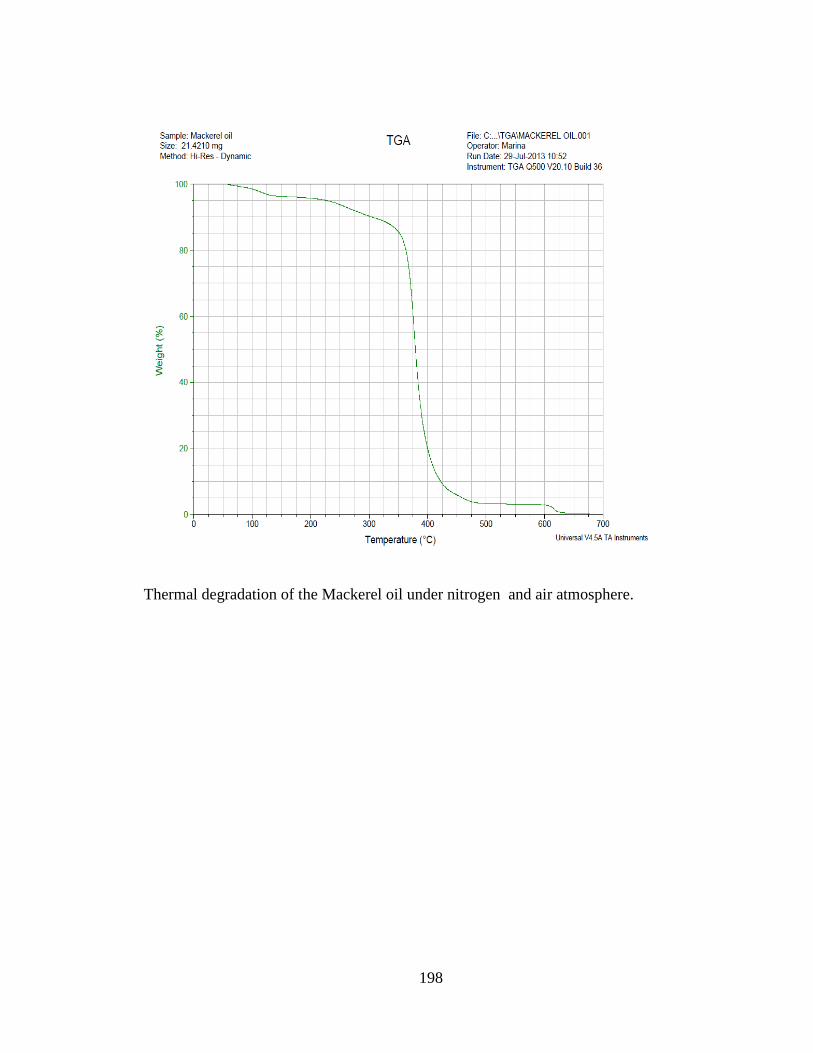
198
Thermal degradation of the Mackerel oil under nitrogen and air atmosphere.
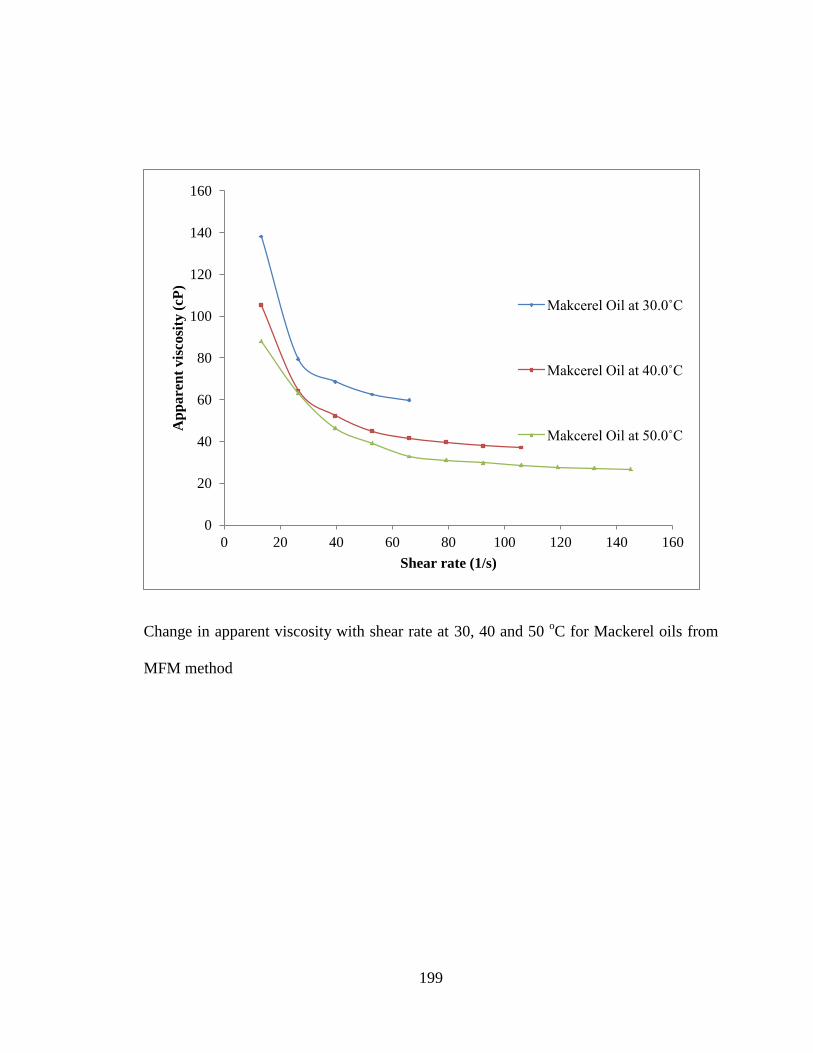
199
Change in apparent viscosity with shear rate at 30, 40 and 50 oC for Mackerel oils from
MFM method
0
20
40
60
80
100
120
140
160
0 20 40 60 80 100 120 140 160
Ap
pare
nt
vis
co
sity
(cP
)
Shear rate (1/s)
Makcerel Oil at 30.0˚C
Makcerel Oil at 40.0˚C
Makcerel Oil at 50.0˚C

200
Change in apparent viscosity with shear rate at 30, 40 and 50 oC for Cod oils from MFM
method
0
20
40
60
80
100
120
140
0 50 100 150 200
Appar
ent vis
cosi
ty (
cP)
Shear rate (1/s)
Cod Oil at 50.0˚C
Cod Oil at 40.0˚C
Cod Oil at 30.0˚C
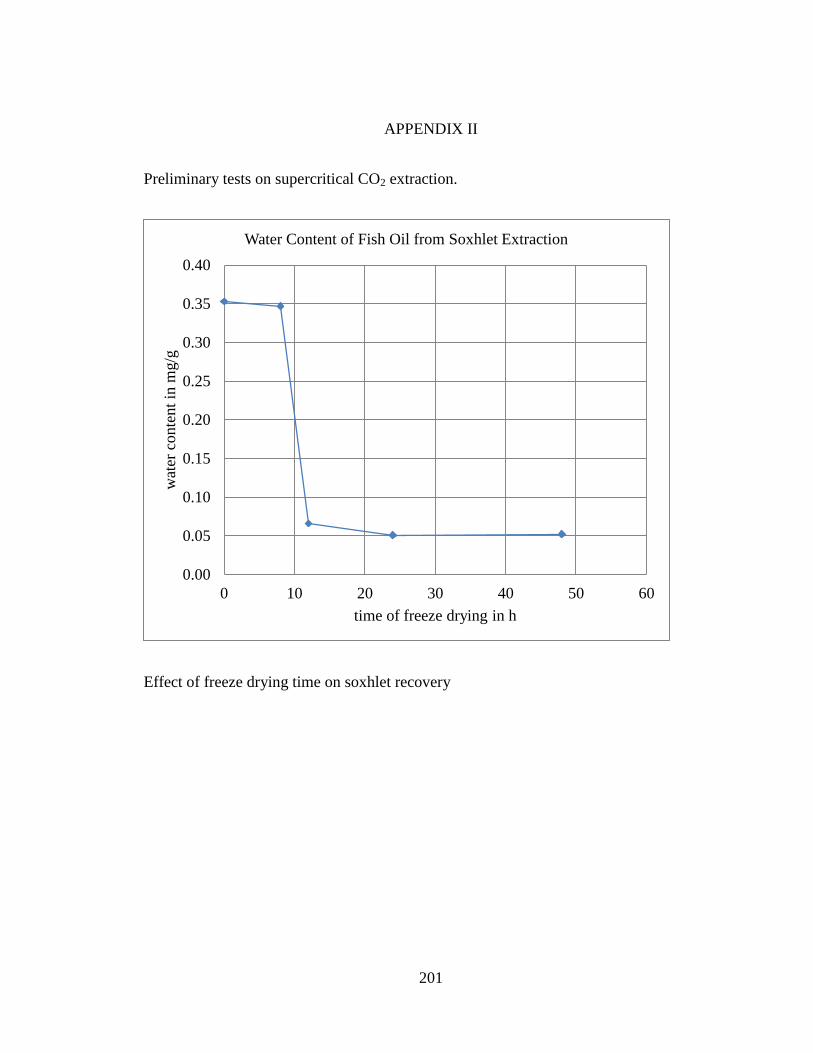
201
APPENDIX II
Preliminary tests on supercritical CO2 extraction.
Effect of freeze drying time on soxhlet recovery
0.00
0.05
0.10
0.15
0.20
0.25
0.30
0.35
0.40
0 10 20 30 40 50 60
wat
er c
onte
nt
in m
g/g
time of freeze drying in h
Water Content of Fish Oil from Soxhlet Extraction

202
Effect of freeze drying time on SC-CO2 recovery
0.00
20.00
40.00
60.00
80.00
100.00
120.00
0 10 20 30 40 50 60
wat
er c
onte
nt
in m
g/g
time of freeze drying in h
Water Content of Fish Oil from SC-CO2 extraction
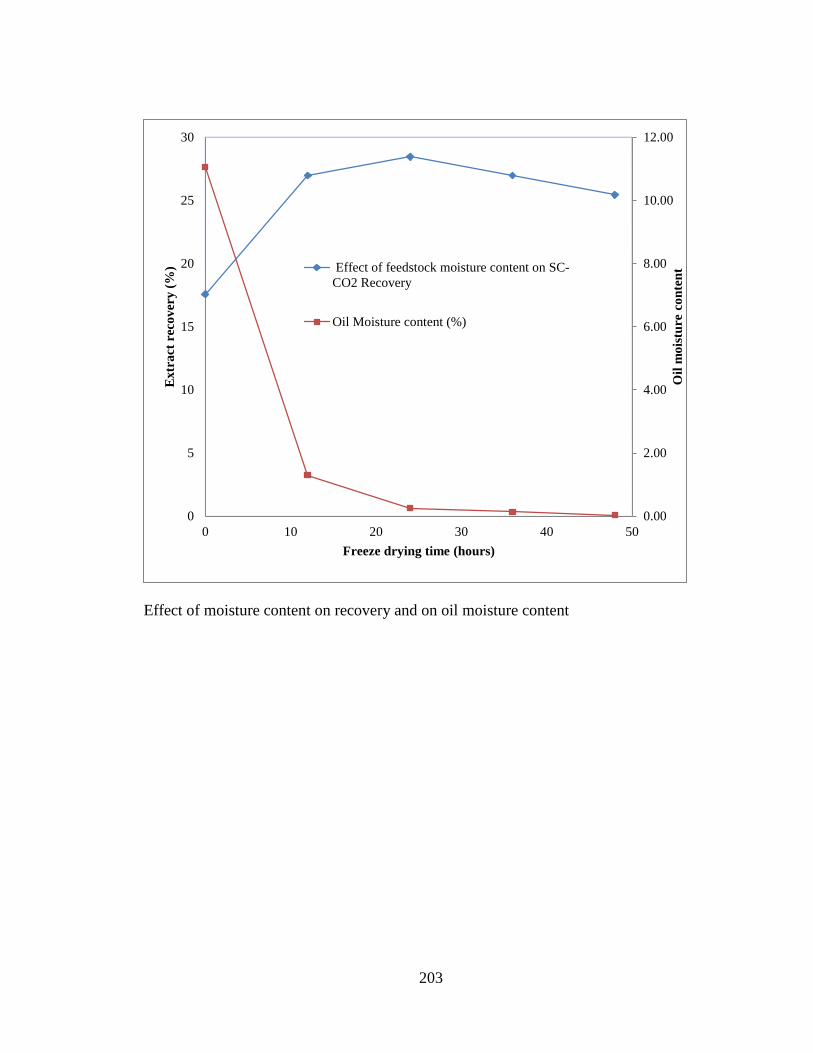
203
Effect of moisture content on recovery and on oil moisture content
0.00
2.00
4.00
6.00
8.00
10.00
12.00
0
5
10
15
20
25
30
0 10 20 30 40 50
Oil
mo
istu
re c
on
ten
t
Extr
act
rec
ov
ery
(%
)
Freeze drying time (hours)
Effect of feedstock moisture content on SC-
CO2 Recovery
Oil Moisture content (%)
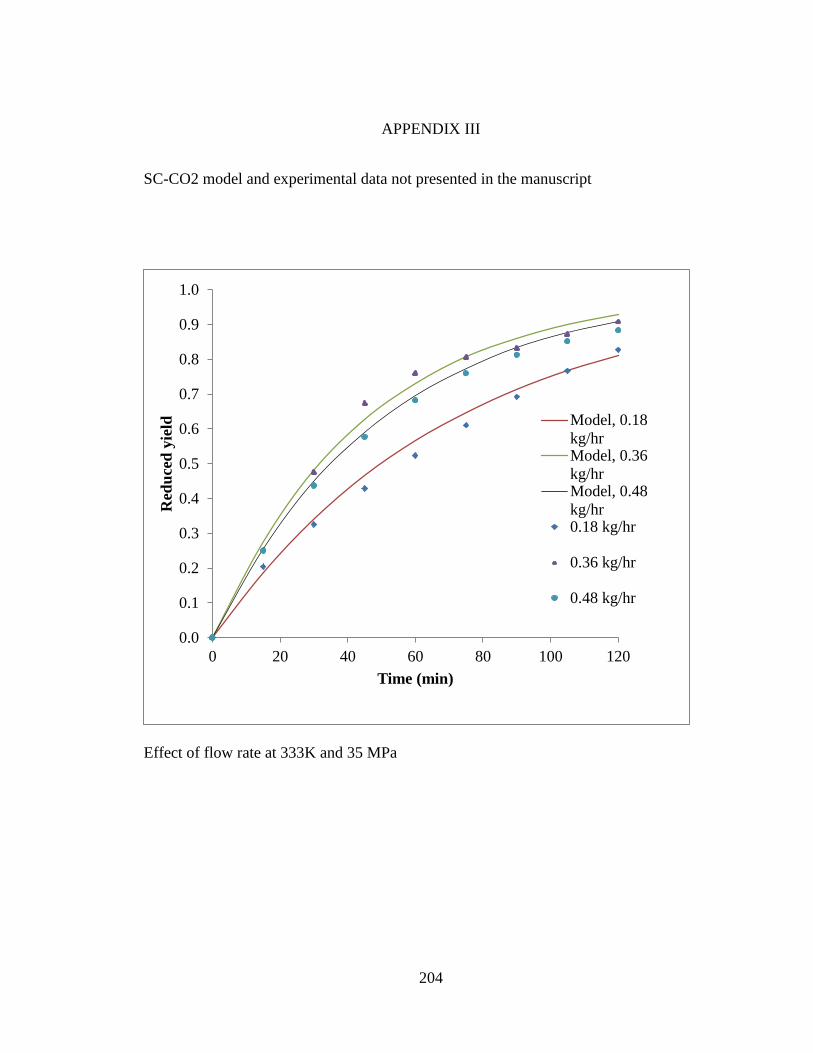
204
APPENDIX III
SC-CO2 model and experimental data not presented in the manuscript
Effect of flow rate at 333K and 35 MPa
0.0
0.1
0.2
0.3
0.4
0.5
0.6
0.7
0.8
0.9
1.0
0 20 40 60 80 100 120
Red
uce
d y
ield
Time (min)
Model, 0.18
kg/hrModel, 0.36
kg/hrModel, 0.48
kg/hr0.18 kg/hr
0.36 kg/hr
0.48 kg/hr
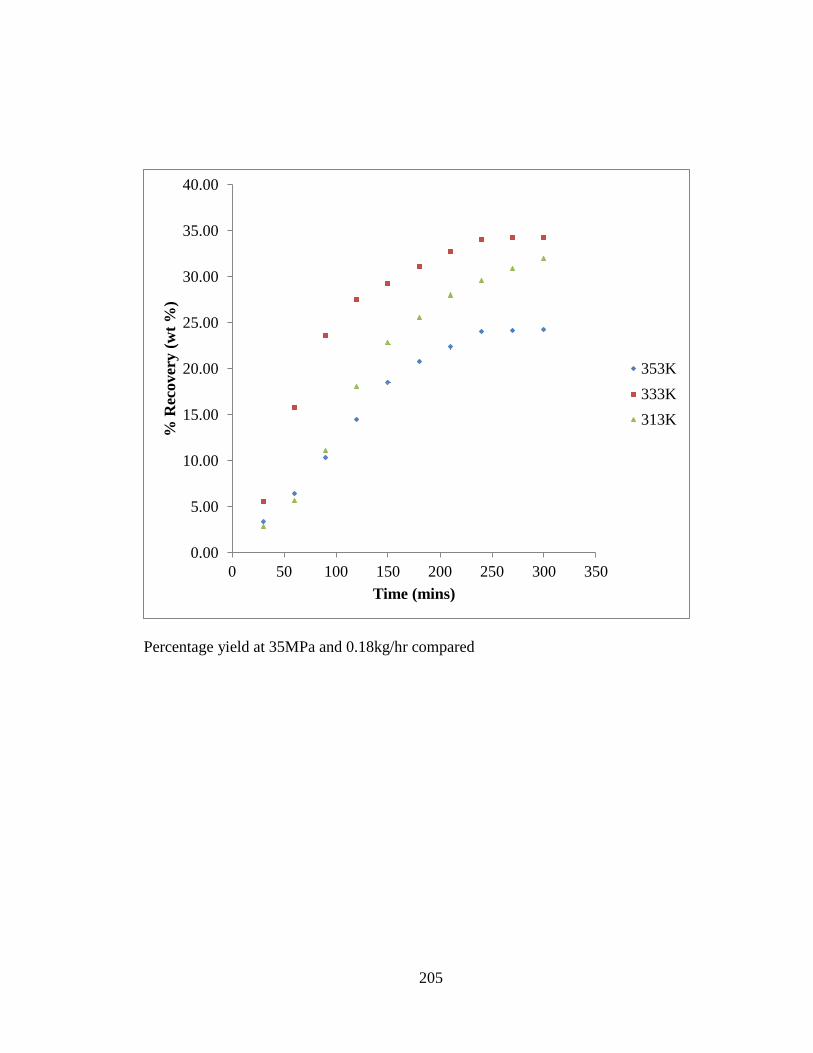
205
Percentage yield at 35MPa and 0.18kg/hr compared
0.00
5.00
10.00
15.00
20.00
25.00
30.00
35.00
40.00
0 50 100 150 200 250 300 350
% R
ecover
y (
wt
%)
Time (mins)
353K
333K
313K
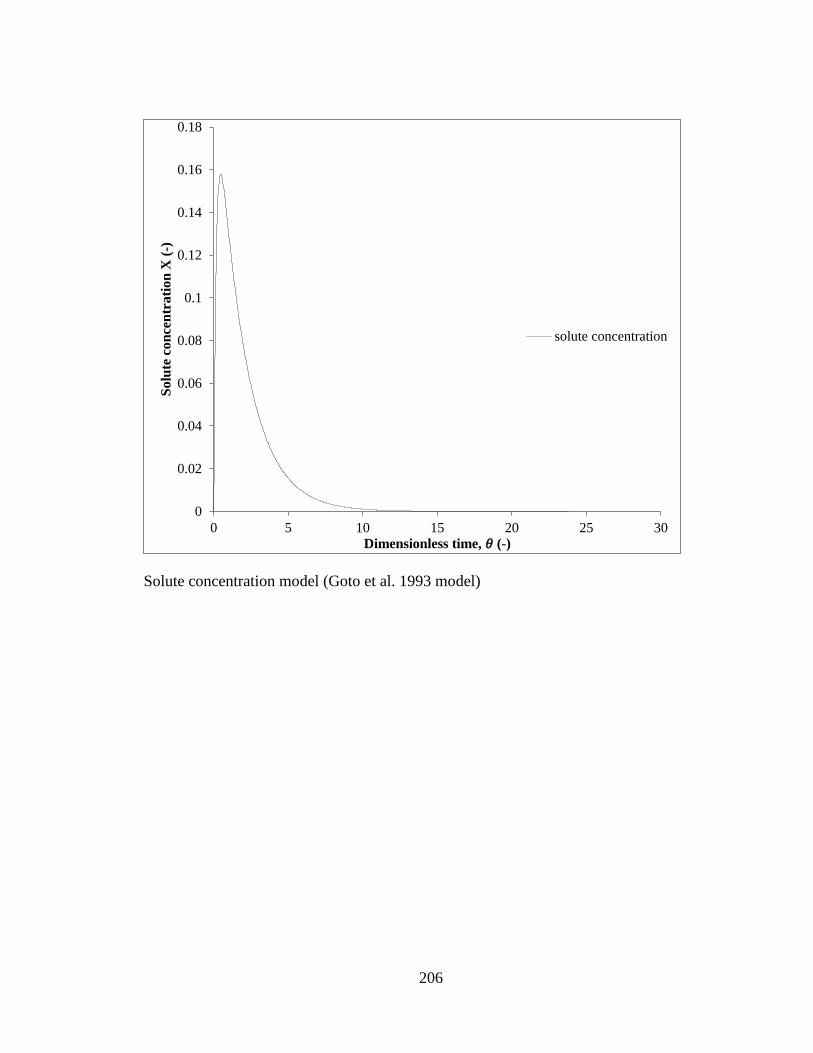
206
Solute concentration model (Goto et al. 1993 model)
0
0.02
0.04
0.06
0.08
0.1
0.12
0.14
0.16
0.18
0 5 10 15 20 25 30
Solu
te c
on
cen
trati
on
X (
-)
Dimensionless time, 𝜃 (-)
solute concentration
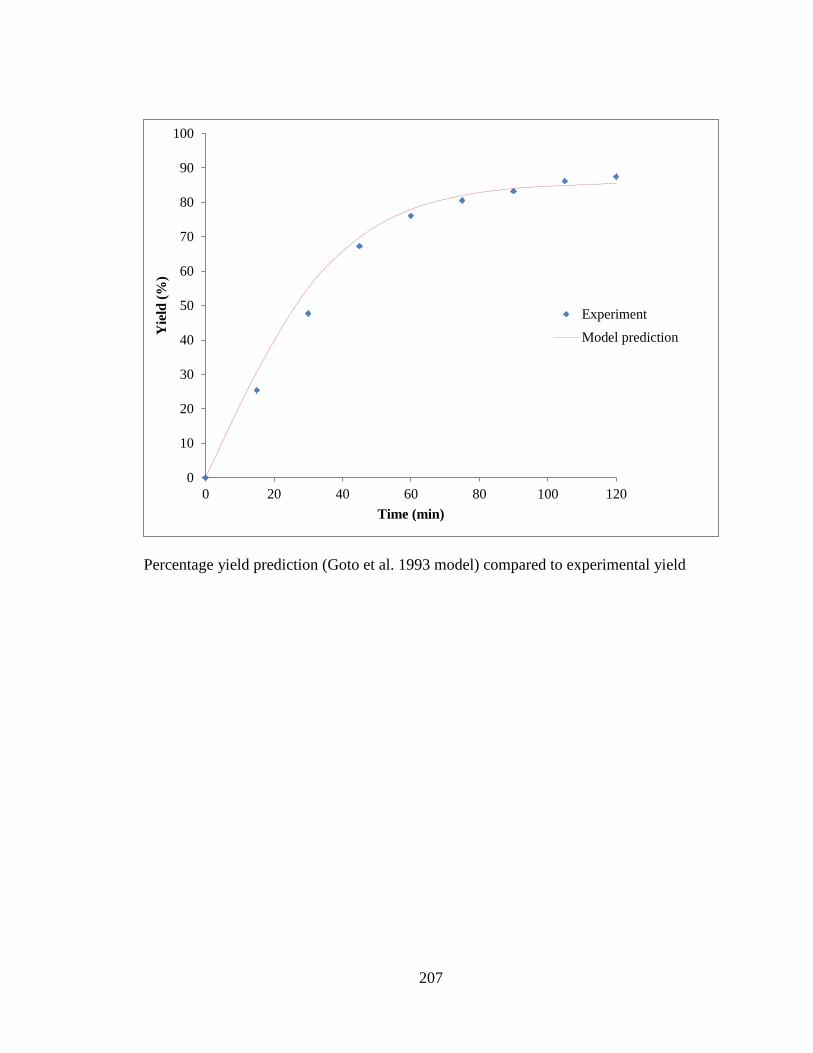
207
Percentage yield prediction (Goto et al. 1993 model) compared to experimental yield
0
10
20
30
40
50
60
70
80
90
100
0 20 40 60 80 100 120
Yie
ld (
%)
Time (min)
Experiment
Model prediction
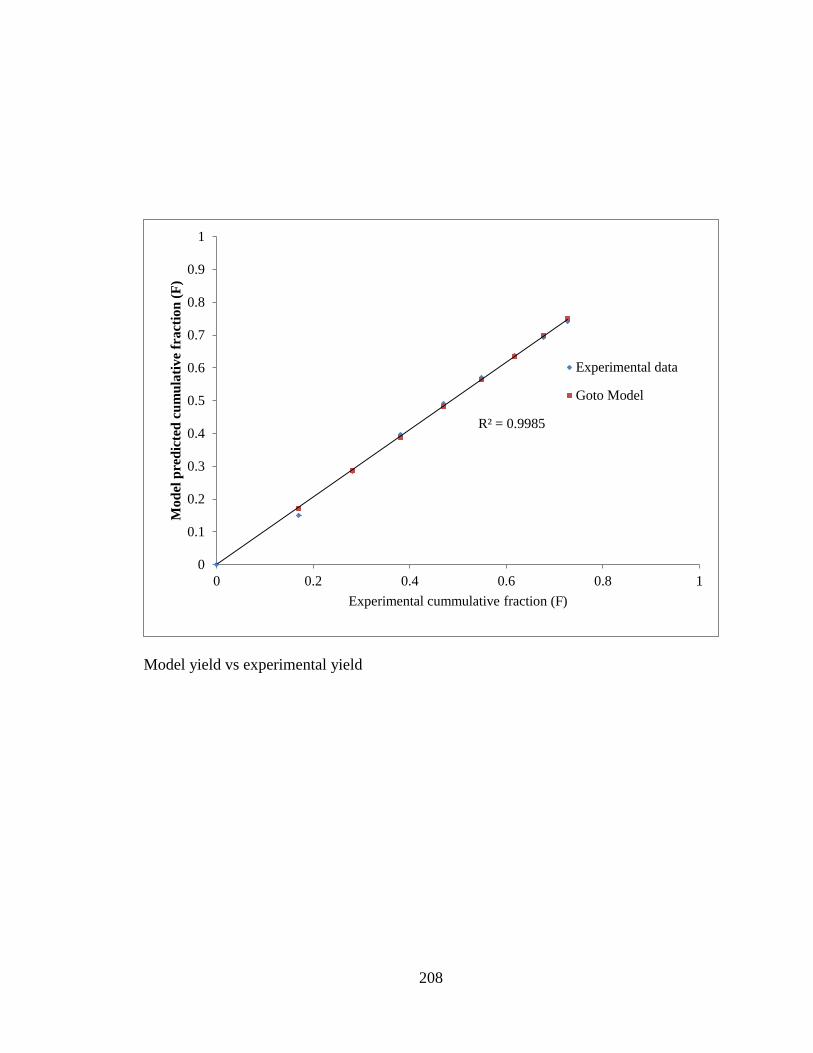
208
Model yield vs experimental yield
R² = 0.9985
0
0.1
0.2
0.3
0.4
0.5
0.6
0.7
0.8
0.9
1
0 0.2 0.4 0.6 0.8 1
Mod
el p
red
icte
d c
um
ula
tiv
e fr
act
ion
(F
)
Experimental cummulative fraction (F)
Experimental data
Goto Model
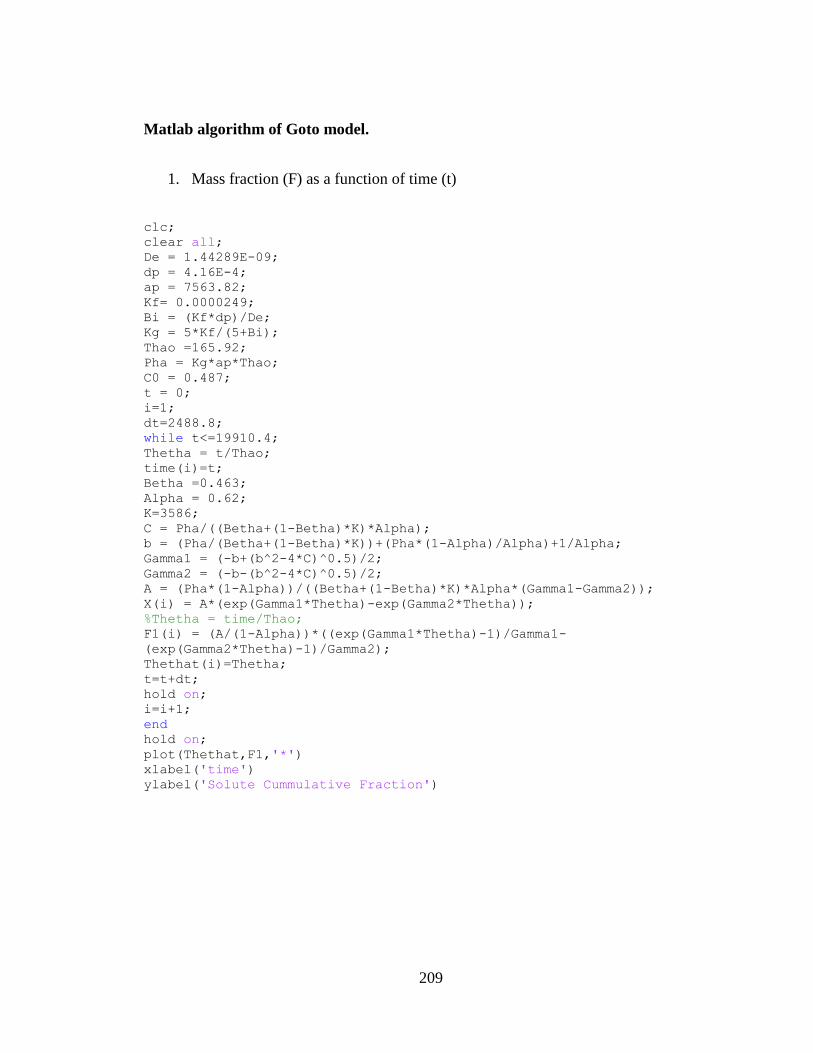
209
Matlab algorithm of Goto model.
1. Mass fraction (F) as a function of time (t)
clc; clear all; De = 1.44289E-09; dp = 4.16E-4; ap = 7563.82; Kf= 0.0000249; Bi = (Kf*dp)/De; Kg = 5*Kf/(5+Bi); Thao =165.92; Pha = Kg*ap*Thao; C0 = 0.487; t = 0; i=1; dt=2488.8; while t<=19910.4; Thetha = t/Thao; time(i)=t; Betha =0.463; Alpha = 0.62; K=3586; C = Pha/((Betha+(1-Betha)*K)*Alpha); b = (Pha/(Betha+(1-Betha)*K))+(Pha*(1-Alpha)/Alpha)+1/Alpha; Gamma1 = (-b+(b^2-4*C)^0.5)/2; Gamma2 = (-b-(b^2-4*C)^0.5)/2; A = (Pha*(1-Alpha))/((Betha+(1-Betha)*K)*Alpha*(Gamma1-Gamma2)); X(i) = A*(exp(Gamma1*Thetha)-exp(Gamma2*Thetha)); %Thetha = time/Thao; F1(i) = (A/(1-Alpha))*((exp(Gamma1*Thetha)-1)/Gamma1-
(exp(Gamma2*Thetha)-1)/Gamma2); Thethat(i)=Thetha; t=t+dt; hold on; i=i+1; end hold on; plot(Thethat,F1,'*') xlabel('time') ylabel('Solute Cummulative Fraction')

210
2 Mass percentage yield (y) as a function of time (t)
clc; clear all; De = 5.91e-9; dp = 6.8e-4; ap = 2941.2; Kf= 2.9e-6; Bi = (Kf*dp)/De; Kg = 5*Kf/(5+Bi); Thao =104.72; Pha = Kg*ap*Thao; C0 = 0.487; t = 0; i=1; dt=1570.8; while t<=12566.4; Thetha = t/Thao; time(i)=t; Betha =0.463; Alpha = 0.62; K=45.69; C = Pha/((Betha+(1-Betha)*K)*Alpha); b = (Pha/(Betha+(1-Betha)*K))+(Pha*(1-Alpha)/Alpha)+1/Alpha; Gamma1 = (-b+(b^2-4*C)^0.5)/2; Gamma2 = (-b-(b^2-4*C)^0.5)/2; A = (Pha*(1-Alpha))/((Betha+(1-Betha)*K)*Alpha*(Gamma1-Gamma2)); X(i) = A*(exp(Gamma1*Thetha)-exp(Gamma2*Thetha)); DensityCO2 = 770; DensityOil = 892; y1(i) = (Betha/K+(1-
Betha)).*(X(i).*DensityOil./DensityCO2).*A.*(exp(Gamma1.*Thetha)-
exp(Gamma2.*Thetha)); X1(i) = DensityCO2*y1(i)/C0; Q = 1.731e-7; m(i) = ((Betha/K)+(1-
Betha)).*X1(i).*DensityOil.*Q.*A.*Thao.*(1./Gamma1.*(exp(Gamma1.*Thetha
)-1)+1./Gamma2.*(1-exp(Gamma2.*Thetha))); Thethat(i)=Thetha*Thao; t=t+dt; hold on; i=i+1; end %plot(time/60,m) hold on; for i=1:length(m) F1(i)=sum(m(1:i))*(10000000/15); end plot(Thethat/60,F1,'*') xlabel('time (min)') ylabel('Yield (%)')
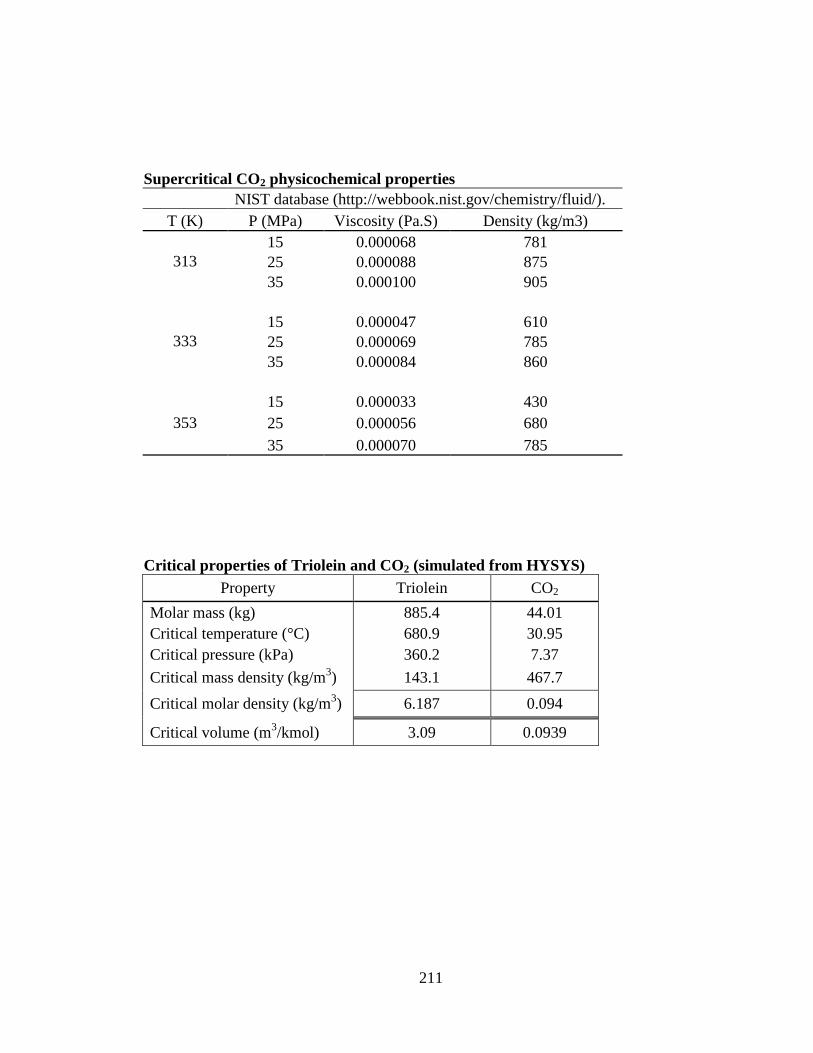
211
Supercritical CO2 physicochemical properties
NIST database (http://webbook.nist.gov/chemistry/fluid/).
T (K) P (MPa) Viscosity (Pa.S) Density (kg/m3)
313
15 0.000068 781
25 0.000088 875
35 0.000100 905
333
15 0.000047 610
25 0.000069 785
35 0.000084 860
353
15 0.000033 430
25 0.000056 680
35 0.000070 785
Critical properties of Triolein and CO2 (simulated from HYSYS)
Property Triolein CO2
Molar mass (kg) 885.4 44.01
Critical temperature (°C) 680.9 30.95
Critical pressure (kPa) 360.2 7.37
Critical mass density (kg/m3) 143.1 467.7
Critical molar density (kg/m3) 6.187 0.094
Critical volume (m3/kmol) 3.09 0.0939