external sector dimensions - planning...
TRANSCRIPT

97
4.1 The acceleration in the growth rateproposed for the Tenth Plan cannot take placewithout tapping the opportunities offered by theinternational economy in terms of markets, invest-ments and technologies. The macro-economicexercises carried out in chapter 2 clearly indicatethat the demand constraints afflicting Indian industrywarrant greater focus on external sources ofdemand if growth opportunities are not to be missed.Concurrently, resource requirements and efficiencyenhancement involve larger flow of external fundsand technologies. Equally important, the inflow offoreign direct investment (FDI) has been identifiedas a critical component in raising the level ofcorporate entrepreneurial activity in the country.Thus, both demand and supply considerations forgrowth acceleration dictate a significantly higherdegree of engagement with the internationaleconomy than in the past. But in so doing,vulnerabilities have to be identified and addressed.
4.2 The twin processes of globalisation andliberalisation are shaping a new system of interna-tional economic relations in which the changingpattern of investment, production and trade, theglobal span of finance and the central role of tech-nology are dominant. The increased interaction withthe world economy is expected to be facilitated bythe overall reduction in the cost of transaction andcommunication. The accelerating pace of libera-lisation and globalisation in the world economy hasincreased opportunities for growth and develop-ment, but it has also added new complexities andrisks in the management of global interdependence.The ability of the developing countries to influencethe pace and direction of global policy initiatives isstill weak, while their vulnerability to the economicpolicy decisions taken by major developed coun-tries, and more so by major market institutions, hasincreased.
4.3 Inter-linkages between trade, investment,money and finance, services, technology, com-modity markets and the environment have, nodoubt, made policy formulation more complex. Theproblem is compounded by weak commodity mar-kets, decline in Overseas Development Assistance(ODA), heavy debt burden, uncertainties in capitalflow, and restrictions on and high costs of technologytransfer. In order to benefit from globalisation,developing countries like India will need to engagethemselves more actively in shaping the contoursof the international economic order. Passive accep-tance of and reactive adjustments to decisions madeelsewhere and on other considerations will notsuffice. India continues to play an active role invarious international organisations and multilateralfora to draw attention to important economic issues,especially in the context of developing countries.But the ambit has to be widened. In particular, thevoices of the domestic civil society and commercialinterest must not only find articulation in ourinternational positions, but they must become majoractors in the process of determining our stand.Unfortunately, the institutional mechanisms foreliciting such participation are still weak, despiteconsiderable progress in recent years. The autar-chic mind-set appears to afflict our private sectoreven more than the government. It is hoped thatthe projections for the immediate future will convincethe private sector decision-maker that enlightenedself-interest dictates not just active engagement withthe government, but also investment of resourcesin research and mutual consultations.
4.4 The importance of reforming and revita-lising the institutional structures governing ourinternational economic relations cannot be over-stressed. A defensive and status-quoist position hasto give way to a more aggressive and proactiveposition. This cannot be done without a closer
CHAPTER 4
EXTERNAL SECTOR DIMENSIONS

TENTH FIVE YEAR PLAN 2002-07
98
interaction between the agencies concerned withtrade and investment, including those in the privatesector, and those in charge of our external relations.Indeed, international commerce cannot any longerbe treated as a mere hand-maiden of diplomacy.Quite the opposite, in fact. Diplomacy must todaysupport, as well as sub-serve, the commercialinterests of the country. There will, undoubtedly, besituations in which political and commercial interestsmay come into conflict. Resolution of such diffe-rences will have to rank high on the political agenda.
4.5 This chapter first examines the externaleconomic situation faced by the country in theemerging global context. Detailed analyses of thestatus of balance of payments position, trade andtariff policy and important World Trade Organisation(WTO) related issues are subsequently presented.Based on the overall situation, the projections aboutvarious dimensions relating to the balance ofpayments in different scenarios that have beenmade for Tenth Plan period are also presented inthe chapter.
RECENT EVENTS IN INTERNATIONALECONOMY
4.6 During the Ninth Five Year Plan, therehave been a number of events in the internationaleconomy that have influenced the behaviouralpattern of the international economic relationshipsignificantly, especially from the Indian point of view.These include the East Asian crisis of 1997-98,global slow-down since 1999-2000, and theSeptember 11, 2001 event. Some of these areoutlined in this section.
(a) East Asian Crisis
4.7 Prior to the Ninth Five Year Plan, the EastAsian Countries were visualised as the harbingerof economic growth – their performance beingdescribed as the East Asian Miracle. The scenario,however, changed in 1997 when financial andcorporate sector weaknesses combined with macro-economic vulnerabilities sparked off a crisis. Theweakness can be explained as exposure of financialinstitutions to a variety of external threats includingdecline in asset values, market contagion, specu-lative attacks, and a reversal of capital flows. Formal
and informal currency pegs, which discouragedlenders and borrowers from hedging, contributedto the problem. Capital inflows had helped rapidcredit expansion while lowering the quality of credit,thereby leading to asset inflation. The inflated assetprices encouraged further capital inflows, lent oftenby weakly supervised non-bank financial institutions.Highly leveraged corporate sectors and largeunhedged short-term debt made the crisis riddencountries vulnerable to changes in the marketsentiments in general, and exchange rate changesin particular.
4.8 The initial priorities in dealing with the crisiswere to stabilise the financial system and to restoreconfidence in economic management. Forcefulmeasures were needed to stop bank runs, protectthe payment system, limit central bank liquiditysupport, minimise disruptions to credit flows, main-tain monetary control and stem capital outflows. Inthe crisis-ridden countries, emergency measures,such as the introduction of blanket guarantees andbank closings, were accompanied by compre-hensive bank restructuring programmes andsupported by macro-economic stabilisation policies.
4.9 India could escape the contagion becausethe management of our external sector was gover-ned by parameters indicated by the High-levelCommittee on Balance of Payments (RangarajanCommittee) such as a flexible exchange rate,sustainable current account deficit, preference tonon-debt creating resource flows, limits on thequantum, use and cost of external debt and a highlyrestrictive approach to short-term debt.
Box 4.1
Lessons learnt from the Asian Crisis
• Any currency could come under speculativeattack if its exchange rate is out of alignment withthe fundamentals for a prolonged period of time.
• Once the speculative attack is launched on anycurrency, the neighboring currencies are alsovulnerable, no matter how sound their policiesmay be.
• The overvaluation of the currency acts as acatalyst when there is a run on the currency, asall the market players base their action on theinformation that the currency is due for correction.

EXTERNAL SECTOR DIMENSIONS
99
4.10 Since efficient markets cannot alwaysovercome speculative activities, it is necessary toremain ever vigilant on the performance of econo-mic parameters both on domestic and external front.Efficient micro and macro-economic management,transparency, putting in place an appropriate regu-latory framework and government’s effective andtimely intervention in case the markets dither, arenecessary measures to avoid the occurrence andimpact of such crisis in India.
(b) Global Slow-down
4.11 While the East Asian crisis was beingresolved, the prospects for global growth weakenedsignificantly, particularly during recent times due toa slow- down in the United States, a stalling recoveryin Japan, and a moderate growth in Europe and ina number of emerging market economies. Thegrowth rate of global output increased from 3.6 percent in 1999 to 4.7 per cent in 2000, but declined toaround 2.2 per cent in 2001. The projections for2002 and 2003 are 2.8 per cent and 3.7 per centrespectively (World Economic Outlook, IMF,September 2002).
4.12 In the context of the world economicoutlook, the following observations are worth noting:
• In an environment of slowing global growth,commodity prices may decline. Oil prices haveretreated from their late 2000 high though theirvolatility remains a matter of concern andcontinues very much to depend upon theproduction decisions of the Organisation ofPetroleum Exporting Countries (OPEC),though the risks may be on the downslide.
• Non-fuel prices are expected to remain broadlyunchanged; but if global demand slows downmore than expected, prices may decline,affecting adversely commodity producers,including many poor countries.
• With the possibility of oil prices declining andwage increases remaining moderate, inflationlevels are likely to stabilise. This would allowfiscal maneuvering in many countries.
• While a number of countries continue to faceserious difficulties, external and financialvulnerabilities in emerging markets have beengenerally reduced since the 1997-98 crisis, andthe shift away from soft exchange rate pegshas improved their ability to manage externalshocks.
• Over the past several years the strongexpansion in the US economy has beeninstrumental in stabilising global activity in theface of weak demand elsewhere.Unfortunately, with the recovery in Japanstalling, and its potential growth being stillmodest, the present slow-down in the US islikely to be offset by higher demand growthelsewhere. In these circumstances, therewould be greater risk of spillovers to othercountries through financial market andconfidence effects.
• Given that financial risks often tend to beunderestimated in periods of rapid expansion,lower growth could expose fragility of financialmarkets. Further, downward revision toexpectations of corporate profit growth couldintensify pressures on equity markets in theUnited States and elsewhere, with adverseeffects on wealth, investment, confidence andrisk aversion.
• In emerging markets, prospects dependcritically on maintaining investor confidence.External financing conditions have recentlydeteriorated. Given the global outlook, andcontinued economic difficulties in someemerging market countries, economies arelikely to remain volatile in the period ahead.This underscores the need to maintain prudentmacro-economic policies and to press aheadwith corporate, financial and institutionalreforms.
(c) Post September 11, 2001 Situation
4.13 Even before September 11, 2001, world’smajor economies had been witnessing a slow-down.In USA, growth rates had dropped to near-zero due

TENTH FIVE YEAR PLAN 2002-07
100
to weakening consumption growth, declininginvestment and reduced imports, coupled with adwindling manufacturing sector growth. Japanwitnessed deflationary pressures and Europe’sgrowth rate was slowing sharply. The events ofSeptember 11, 2001 further hit the globaleconomy at a vulnerable point when it had fewerbuffers to offer and its resilience to absorb newshocks was suspect. As a result, world tradegrowth is anticipated to decline from 12.6 per centin 2000 to (–) 0.1 per cent in 2001, 2.1 per centin 2002 and 6.1 per cent in 2003 (World EconomicOutlook, September 2002).
4.14 Insofar as India is concerned, the post-September 11 developments have affected a fewimportant sectors adversely. The Nasscom had firstestimated the software exports to grow by 52 percent during 2001-02, but the actual rate came downto only 13 per cent during the year. The civil aviationsector has also been hit, apart from fall in demand,hike in insurance costs has increased the opera-tional cost. India’s tourism industry, which serves2.6 million tourists a year, has been adverselyaffected. The flow of remittances has also declinedduring 2001-02.
4.15 Adverse external developments afterSeptember 11, and their effect on India’s financialmarkets, necessitated a quick response to provideappropriate liquidity and overall comfort to themarkets. In order to stabilise domestic financial mar-kets, the Reserve Bank of India (RBI) ensured thatinterest rates are kept stable with adequate liquidity.The RBI also undertook sale/purchase of foreignexchange as and when it was necessary to meetany unusual supply-demand gap. In view of theextraordinary circumstances in the governmentsecurities market, the RBI opened a purchasewindow for select government securities on auctionbasis. Indian companies were permitted to increasethe foreign institutional investment (FII) limit. Aspecial financial package was announced for largevalue exports of six select products, which wereinternationally competitive and had high valueaddition.
4.16 The above measures had the desiredeffect of moderating possible panic reactions and
reducing volatility in financial markets, particularlyin money, foreign exchange and governmentsecurities markets. While financial markets aregenerally stable, liquidity is adequate, and interestrate environment is favourable so far, the outturnof industrial output has been limited. This continuesto be a matter of serious concern. It is hoped thatas global markets gain back momentum after sometime, it will have a favourable impact on theinvestment climate in India as well.
4.17 The series of international disturbances,however, throw open a window of opportunities thatcan be harnessed. The interest rates have beencut several times in the USA giving an opportunityto off-load the interest burden. Excess capacityafflicts virtually every capital goods sector acrossthe globe, which presents an opportunity to importmachines and equipments at bargain prices. It maybe possible for India to attract higher FDI under thecircumstances. This is a time for the Indianmultinationals to look for cheap global acquisitions.When US companies resort to cost-cutting exer-cises, they may also resort to outsourcing, due towhich the IT-enabled services sector such as callcenters, back-office operations, transcriptions,payroll accounting services etc., will get a boost.
STATUS OF THE EXTERNAL SECTOR
4.18 During the Ninth Plan period, India’sbalance of payments position remained mostlycomfortable. The current account deficit narroweddown and on the average was 0.8 per cent of grossdomestic product (GDP), less than one half of the2.1 per cent envisaged in the plan. The growth ofexports in dollar terms during the Ninth Plan periodhas been 5.6 per cent as against the targeted growthrate of 11.8 per cent. During the same period, importgrowth has been 3.3 per cent as against the targetof 10.8 per cent. The country has withstood the EastAsian Crisis of 1997-98 and the recent global slow-down. Invisible receipts have been buoyant. Foreignexchange reserves have increased significantly toaround $ 54 billion by the end of March 2002. Theexchange rate of the Indian rupee, in terms of theUS dollar, has depreciated by 6 per cent. Theexternal value of the rupee seen in terms of real

EXTERNAL SECTOR DIMENSIONS
101
effective exchange rate (REER) has, however,appreciated slightly. Foreign direct investmentinflows have increased while foreign institutionalinvestments have gone down. The key indicatorsof external debt have improved considerably as aresult of better management of external debt. It issome of these trends that are discussed in greaterdetail in this section.
Exports
4.19 The Ninth Plan had envisaged a growthof 11.8 per cent per annum in exports, against whichthe actual growth was 5.6 per cent (in dollar terms)during the Ninth Plan period. Even this unsatis-factory performance was accompanied by highvolatility. Exports had recorded a negative growthof 3.9 per cent during 1998-99. The year 2000-01witnessed a high growth of 19.6 per cent butdeclined sharply to 0.05 per cent in 2001-02. TheNinth Plan had also envisaged that the export-GDPratio would be 10.4 per cent, but the likely outcomewould be lower, at around 9 per cent.
4.20 The drastic reduction in growth rate ofexports during 2001-02 was primarily due tostructural constraints operating on the demand aswell as on the supply side. The recessionarytendencies across the world affected the demandfor our exports as well. As mentioned in para 4.13,world trade in goods and services is projected to
record a negative growth of 0.1 per cent in 2001 asagainst a growth rate of 12.6 per cent during 2000.Such slow-down and contraction of world trade alsoresulted in emergence of protectionist policies bydeveloped countries in some sectors in the form ofbarriers of technical, environmental and socialstandards, affecting market access and disruptingour exports.
4.21 Movements of the exchange rate alsoaffected export performance. Major supply cons-traints that continued to hamper our exportsinclude infrastructural constraints, hightransaction costs, reservation for small scaleindustries, labour inflexibility, constraints inattracting FDI in exports sector and maintenanceof product quality.
4.22 Changes in the composition of exportsduring the Ninth Plan may be seen in Table 4.1. Itmay be observed that the share of agriculture andallied products has been declining, while that of oresand minerals has remained more or less steady.Share of manufactured goods increased during thefirst three years, but came down during the two lateryears. Share of petroleum products increasedsignificantly in 2000-01 and more so in 2001-02,while ‘others’ have shown a gradual rising trendduring the Ninth Plan period. It is important to notethat the share of processed agricultural exports andmanufactured goods must be suitably raised not
Table 4.1
Broad Composition of Exports
Percentage Share
S.No. Commodity Group 1997-98 1998-99 1999-2000 2000-01 2001-02
1. Agri.and Allied Products 18.9 18.1 15.2 13.5 13.4
2. Ores and Minerals 3.0 2.7 2.5 2.6 2.8
3. Manufactured Goods 75.8 77.7 80.7 78.0 76.1
4. Petroleum Products 1.0 0.3 0.1 4.2 4.9
5. Others 1.3 1.2 1.5 1.7 2.8
Total 100.0 100.0 100.0 100.0 100.0
Source : Directorate General of Commercial Intelligence and Statistics (DGCI&S).

TENTH FIVE YEAR PLAN 2002-07
102
only for a sustainable balance of payments position,but also to provide adequate aggregate demand tosupport the projected growth in these sectors.
4.23 Looking at the direction of these exports,it was observed that the share of our exports to theOrganisation for Economic Cooperation and Deve-lopment (OECD) countries has been declining,especially due to decline in our share to theEuropean Union (EU) and Japan. Share of exportsto USA has increased and so has to the OPEC andLatin American countries. It has gone down in thecase of Eastern Europe, with slowing down ofexports to Russia, while shares of exports to lessdeveloped countries in Africa and Asia haveremained more or less at the same level. Exportsto ‘other’ countries have increased and need to befurther stepped up.
Imports
4.24 The Ninth Plan had envisaged a growthof 10.8 per cent per annum in imports. The actualgrowth of imports has been 3.3 per cent (in dollarterms) during the Ninth Plan period. Petroleum Oiland Lubricants (POL) imports during the Ninth Planincreased by 6.4 per cent while that of non-POL by4.9 per cent. Lower import growth of non-POL is a
reflection of the slow-down in the domestic industrialactivity. The Ninth Plan had also envisaged thatthe import-GDP ratio would be 12.2 per cent. Theactual outcome has more or less been around thetargeted level as the average for the Plan periodworks out to 12.66 per cent. The slow growth ofimports was clearly offset by the low growth rate ofGDP.
4.25 The broad composition of imports duringthe Ninth Plan can be seen in Table 4.2. It may beobserved that the share of bulk items has increasedwhile that of non-bulk items has declined. Amongstthe bulk items, share of POL increased sharply till2001, which, however, came down in 2001-02. Theshare of bulk consumption goods in imports, mainlycomprising food items, has been fluctuating accor-ding to domestic demand. Share in import of otherbulk items like rubber, pulp and paper, wood andwood products, fertilizers, metalli-ferrous ores andmetal scrap, non-ferrous metals, and iron and steeldecreased till 2000-01, although it increasedthereafter in 2001-02. Share of capital goods hasshown a consistent declining trend. Share of exportrelated items consisting of chemicals, pearls andprecious stones, cashew, textile yarn and fabric,leather, raw cotton, silk, wool and jute has remainedsteady in this period.
Table 4.2Broad Composition of Imports
Percentage Share
S.No. Commodity Group 1997-98 1998-99 1999-2000 2000-01 2001-02 (P)
1. Bulk Imports 35.7 31.2 39.6 41.2 39.6
a. Petroleum and products 19.7 15.1 25.4 31.0 27.4
b. Bulk Consumption Goods 3.6 6.0 4.9 2.9 4.0
c. Other Bulk Items 12.4 10.2 9.3 7.4 8.2
2. Non-bulk Imports 64.3 68.8 60.4 57.7 60.4
a. Capital Goods 23.6 23.7 18.0 17.7 18.2
b. Export related Items 16.7 16.8 18.4 15.9 16.1
c. Others 24.1 28.2 24.0 24.1 26.0
- Of which Gold and Silver 7.6 12.0 9.5 9.2 8.9
Source : DGCI&S.

EXTERNAL SECTOR DIMENSIONS
103
4.26 Looking at the direction of our majorimports, it may be observed that the OECD coun-tries, and EU in particular, was the major supplierof the import items to India, although it was decliningby the end of the Ninth Plan period. Also, share ofimports from OPEC and Russia declined while theshare of ‘others’ increased substantially. It may besuggested that the import of POL items increasedfrom this set of ‘other’ countries and away from theOPEC. The share of imports from Africa, Asia andLatin America remained more or less constant.
Trade Balance
4.27 On account of shortfalls in the exportgrowth, the trade deficit averaged an estimated 3.4per cent of GDP during the Ninth Plan, almostdouble of 1.8 per cent, envisaged in the Plan docu-ment. However, in absolute terms the trade deficithas moved within a range of $ 12.7 billion and $17.8 billion during the Ninth Plan period. In fact,this was only $ 12.7 billion in 2001-02 as against $14.8 billion in 1996-97.
Invisibles
4.28 The total invisibles receipts increased from$ 21,405 million in 1996-97 to $ 35,612 million in2001-02 (i.e. an average growth of 10.72 per cent).Total payments increased from $ 11,209 million in1996-97 to $ 21,558 million in 2001-02 (i.e. anannual growth of 13.97 per cent). Net invisiblesthus increased from $ 10,196 million in 1996-97 to$ 14,054 million in 2001-02 (i.e. a growth of 6.63per cent). There has also been buoyancy inmiscellaneous net receipts and private transfers.Invisible flows were a source of immense strengthto the current account. Miscellaneous receipts (net)increased from $ 355 million in 1997-98 to $ 3,774million in 2001-02, and similarly, net private transfersmaintained a higher level, increasing from $ 11,830million in 1997-98 to $ 12,798 million in 2000-01,but went down slightly to $ 12,125 million in 2001-02. Private transfer receipts remain augmented bythe inclusion of local redemption of non-residentdeposits since 1996-97. Private remittances accountfor the bulk of private transfer receipts. Software
service exports, included under miscellaneousreceipts of non-factor services, have emerged asthe second largest item of invisible receipts.Software service exports had grown at an annualrate of about 52.5 per cent during the five yearsending 1999-2000. The growth momentum wassustained in 2000-01, when these recorded a growthof 57 per cent from $ 4.02 billion in 1999-2000 to $6.3 billion in 2000-01.
Current Account Balance (CAB)
4.29 It is estimated that the CAB would averageabout (-) 0.8 per cent of GDP during the Ninth Plan,less than one half of 2.1 per cent envisaged in thePlan document. The balance of payments positionmay be seen in Table 4.3.
4.30 The CAB was $ (-) 5.5 billion in 1997-98,which came down to $ (-) 2.6 billion in 2000-01 andturned positive to $ 1.35 billion in 2001-02. Theimprovement in CAB was made possible largelybecause of dynamism in export performance, asustained buoyancy in invisibles, reflecting a sharpincrease in software service exports and privatetransfers, and partly due to the subdued non-oilimport demand.
Foreign Exchange Reserves
4.31 India’s foreign exchange reserves com-prise foreign currency assets of the RBI, gold heldby the RBI and special drawing rights held by theGovernment of India. Foreign exchange reservesincreased rapidly during the last decade, increasingfrom $ 5,834 million in 1990-91 to $ 42,281 millionin 2000-01. The reserves continued to increase toreach the level of $ 54,106 million by March 2002,and $ 62,021 million by mid September 2002. Theimport cover of reserves increased from 6.9 monthsin 1997-98 to 8.6 months in 2000-01 and further toalmost one year in 2001-02, which is a source ofcomfort. Besides, it provides a measure of insula-tion against unforeseen external shocks or exigentdomestic supply shortages. It also helps to satisfythe need for liquidity, which instills confidence inthe economy among international investors andfinancial markets.

TENTH FIVE YEAR PLAN 2002-07
104
Exchange Rate Movement
4.32 The exchange rate of the rupee hasbroadly been market determined, except for
occasional counter-cyclical operations by theReserve Bank of India. The movement of exchangerate during the Ninth Plan has been as follows(Table 4.4).
Table 4.3
Balance of Payment
($ million)
S.No. Items 1997-98 1998-99 1999-2000 2000-01 2001-02
1. Exports 35,680 34,298 37,542 44,894 44,915
2. Imports 51,187 47,544 55,383 59,264 57,618
- Of which, POL 8,164 6,399 12,611 15,650 13,669
3. Trade Balance -15,507 -13,246 -17,841 -14,370 -12,703
4. Invisibles (net) 10,007 9,208 13,143 11,791 14,054
Non-factor services 1,319 2,165 4,064 2,478 4,199
Investment Income -3,521 -3,544 -3,559 -3,821 -2,728
Private Transfers 11,830 10,280 12,256 12,798 12,125
Official Transfers 379 307 382 336 384
5. Current Account Balance -5,500 -4,038 -4,698 -2,579 1,351
6. External Assistance (net) 907 820 901 427 1,117
7. Commercial Borrowing (net) @ 3,999 4,362 313 4,011 -1,144
8. IMF (net) -618 -393 -260 -26 0
9. NR Deposits (net) 1,125 960 1,540 2,317 2,754
10. Rupee Debt Service -767 -802 -711 -617 -519
11. Foreign Investment (net) Of which 5,353 2,312 5,117 4,588 5,925
i) FDI (net) 3,525 2,380 2,093 1,828 3,904
ii) FIIs 979 -390 2,135 1,847 2,021
iii) Euro equities and others 849 322 889 913
12. Other Flows (net)+ -606 608 3,940 -2,291 1,412
13. Capital Account Total (net) 9,393 7,867 10,840 8,409 9,545
14. Reserve Use (-increase) -3,893 -3,829 -6,142 -5,830 -10,896
Note : @ Figures include receipts on account of India Development Bonds in 1991-92, Resurgent India Bonds in 1998-99 andIndia Millennium Deposits in 2000-01 and related repayments, if any, in the subsequent years.
+ Include, among others, delayed export receipts and errors and omissions.Source : Reserve Bank of India (RBI).

EXTERNAL SECTOR DIMENSIONS
105
4.33 The exchange rate market has displayedreasonable stability, with the rupee depreciating by6.1 per cent from the annual average of Rs. 37.165per dollar in 1997-98 to Rs.47.707 in 2001-02.
4.34 The world economy experienced one ofthe worst shocks after the events of September 11,2001 in the US. Foreign exchange markets in Indiaalso became volatile as a consequence, with therupee showing a depreciation of 1.3 per cent vis-à-vis the dollar during the 10 days period of September10-20, 2001. In order to stabilise domestic financialmarkets, the RBI announced some measures duringthe period September 15-25, 2001. These mea-sures had the desired effect of moderating possible
panic reactions and reducing volatility in financialmarkets, particularly in money, foreign exchangeand government securities markets.
4.35 The exchange rate management policycontinues its focus on smoothening the excessivevolatility in the exchange rate with no fixed ratetarget, while allowing the underlying demand andsupply conditions to determine the exchange ratemovements over a period in an orderly way. TheRBI monitors closely the development in thefinancial markets at home and abroad andcoordinates the market operations with suitableregulatory measures, as considered necessary fromtime to time.
4.36 Given the movement of the exchange rateof the rupee and the domestic inflation rate relativeto important trading partners, the real effectiveexchange rate (REER) is reckoned as one of themost important determinants of the country’sexternal competitiveness. The position of the rupeein terms of REER and nominal effective exchangerate (NEER) is given in Table 4.5.
4.37 The REER was 63.81 in 1996-97, whichincreased to 67.02 in 1997-98 and declined during1998-99 and 1999-2000, thereafter increasing againduring the next two years. This shows the volatility
Table 4.4
Exchange Rate ( Rs. / $)
Year Exchange Rate Depreciation(per cent)
1997-98 37.165 4.48
1998-99 42.071 11.66
1999-00 43.333 2.91
2000-01 45.684 5.15
2001-02 47.707 4.24
Source : Reserve Bank of India.
Table 4.5Indices of Real Effective Exchange Rate (REER) and Nominal
Effective Exchange Rate (NEER) of the Indian Rupee(36- Country bilateral trade based weights)
(Base : 1985=100)
Year REER % Variation NEER %Variation
1996-97 63.81 0.3 38.97 -1.9
1997-98 67.02 5.0 40.01 2.7
1998-99 63.44 -5.3 36.34 -9.2
1999-00 63.30 -0.2 35.46 -2.4
2000-01 66.53 5.1 35.52 0.2
2001-02 (P) 68.43 2.9 35.75 0.7
Note : The indices on REER have been recalculated from April 1994 onwards using the new Wholesale Price Index (WPI)Series with base 1993-94 = 100.
Source : Reserve Bank of India.

TENTH FIVE YEAR PLAN 2002-07
106
in the exchange rate of the rupee. This also givesan impression that it is slightly overvalued. Withthe appreciation of the dollar vis-à-vis the majorcurrencies, the rupee also appreciated in real terms.
Foreign Investment
4.38 In developing countries like India, FDI isseen as a means to supplement domestic invest-ment for achieving a higher level of economicgrowth. FDI benefits the domestic industry as wellas the consumers by providing opportunities fortechnological up-gradation, access to globalmanagerial skills and practices, optimal utilisationof human and natural resources, opening up exportmarkets and access to international quality goodsand services. Towards this end, the FDI policy hasbeen constantly reviewed, and necessary stepstaken to make India a most favorable destinationfor foreign investors.
4.39 FDI inflows depend upon a number offactors like the assurance of safe recovery of capital,regular repatriation of dividends, overall climate,exchange rate and price stability, availability of rawmaterials and other inputs, skilled manpower,infrastructural facilities and the existence of dome-stic and export markets. The government policyon FDI since 1991 has aimed at encouraging foreigninvestment, particularly in the core and infrastructuresectors. The government has permitted access tothe automatic route for FDI in most sectors, exceptfor a small negative list. The foreign investors onlyneed to inform the RBI within 30 days of bringing intheir investment, and also within 30 days of issuingof shares. Emphasis is given to foreign investmentin infrastructure sectors with 100 per cent FDI,including in power, telecom, oil refining, etc.
4.40 Foreign investment inflows increasedfrom $ 103 million in 1990-91 to $ 5,925 million in
Table 4.6
Foreign Investment Inflows
($ million)
S.No. Items 1997-98 1998-99 1999-2000 2000-01 2001-02
A Direct Investment 3,557 2,462 2,155 2,339 3,904
a) Govt. (SIA/FIPB)# 2,754 1,821 1,410 1,456 2,221
b) RBI 202 179 171 454 767
c) NRI# 241 62 84 67 35
d) Acquisition of Shares* 360 400 490 362 881
B Portfolio Investment 1,828 -61 3,026 2,760 2,021
a) GDRs/ADRs@ 645 270 768 831 477
b) FIIs ** 979 -390 2,135 1,847 1,505
c) Offshore funds and others 204 59 123 82 39
Total (A+B) 5,385 2,401 5,181 5,099 5,925
Note : * Relates to acquisition of shares of Indian companies by non-residents under Section 5 of FEMA, 1999. Data onsuch acquisitions have been included as part of FDI since January, 1996.
@ Represents the amount raised by Indian Corporate through Global Depository Receipts (GDRs) and AmericanDepository Receipts (ADRs).
** Represents fresh inflows of funds by Foreign Institutional Investors (FIIs).# SIA = Secretariat of Industrial Approval.
FIPB = Foreign Investment Promotion Board.NRI = Non-resident Indians.
Source : RBI.

EXTERNAL SECTOR DIMENSIONS
107
2001-02, peaking at $ 6,133 million in 1996-97.Table 4.6 shows the pattern of these inflows duringthe Ninth Plan period.
4.41 Foreign direct investment flows, afterreaching a peak of $ 3,557 million in 1997-98,declined to $ 2,339 million in 2000-01 and increasedto $ 3,904 million in 2001-02. The source anddirection of FDI remained, by and large, unchangedduring the 1990s. The bulk of FDI was channeledinto computer hardware and software, engineeringindustries, services, electronics and electricalequipment, chemical and allied products and foodand dairy products.
4.42 Foreign institutional investment inflowsincreased from a mere $ 1 million in 1992-93,reached their peak of $ 2,135 million in 1999-2000and have been at $ 1,505 million during 2001-02.The year 1998-99 witnessed FII flows to record anegative of $ 390 million. The policy regardingportfolio investment by FIIs is reviewed constantlyand major initiatives are taken, when necessary. Inthe budget of 2001-02, it was proposed to raise thelimit for portfolio investment by FIIs from the normallevel of 24 per cent of the paid-up capital of acompany to 49 per cent, subject to the approval ofthe General Body of shareholders by a specialresolution. More recently, Indian companies havebeen permitted to raise the aggregate ceiling forportfolio investment by FIIs through the secondarymarket from the normal level of 24 per cent up tothe applicable sectoral cap levels of the issuedand paid up capital of the company, subject tocompliance with the special procedure, viz.,
(a) approval by the board of directors of thecompany to the enhanced limit beyond 24 per cent,and (b) a special resolution passed by the generalbody of the company approving the enhanced limitbeyond 24 per cent.
4.43 Funds raised through GDRs/ADRsamounted to $ 831 million in 2000-01 and $ 477million in 2001-02. The Government has beenliberalising the guidelines for issue of GDRs/ADRsin a phased manner.
External Debt
4.44 India’s external debt was $ 98.14 billionat the end of March 2002 as compared to $ 93.47billion at end March 1997 and $ 93.53 billion at endMarch 1998. The stock of external debt increasedby 0.98 per cent during the Ninth Plan. The positionrelating to India’s outstanding external debt is givenin Table 4.7.
4.45 Despite marginal increase in the externaldebt stock, the country’s external debt position hasimproved in recent years. The debt-GDP ratio, whichshows the magnitude of external debt in relation todomestic output, declined from 38.7 per cent at endMarch 1992 to 22.3 per cent at end March 2001and further to 20.8 per cent at end March 2002.Similarly, the debt-service ratio that measures theability to serve debt obligations, declined from thepeak level of 35.3 per cent of current receipts in1990-91 to 17.3 per cent in 2000-01, and further to14.1 per cent by end March 2002. The short-termdebt to total debt (with maturity up to one year)
Table 4.7
India’s External Debt Outstanding (end March)
($ million)
Categories 1998 1999 2000 2001 2002 (P)
Short-Term Debt 5,046 4,274 3,933 3,480 2,746
Long-Term Debt 88,485 92,612 94,330 96,224 95,392
Total Debt 93,531 96,886 98,263 99,704 98,138
Source : RBI.

TENTH FIVE YEAR PLAN 2002-07
108
declined from 10.2 per cent to 3.5 per cent fromend March 1991 to end March 2001 and furtherto 2.8 per cent by end March 2002. Short-termdebt to foreign currency assets has also improvedfrom a high of 382.1 per cent at end March 1991to 8.8 per cent at end March 2001. The ratiowas 5.4 per cent at end March 2002. The shareof concessional debt, which was steady around45 per cent during the first half of the 1990s,declined to 38.5 per cent at end March 1999 andfurther to 35.8 per cent at end March 2002. Indiahas the highest share of concessional debtamong the top 15 debtor countries of the world.
4.46 India’s indebtedness position vis-à-visother economies has improved. In terms of theabsolute level of debt, the position improved fromthe third largest debtor after Brazil and Mexico in1991 to the tenth in 1999, after Brazil, RussianFederation, Mexico, China, Indonesia, Argentina,Korea, Turkey and Thailand. In terms of thepresent value of external debt too, India ranksas the tenth largest debtor country. In terms ofindebtedness classification, India improved itsposition from ‘close to severely indebted’ categoryin 1991, to ‘less indebted’ bench-mark in 1999(Global Development Finance 2001, WorldBank).
4.47 The improvement in India’s externaldebt position since 1991-92 is due to a consciousdebt management policy that focused on high
growth rate of exports, keeping the maturitystructure as well as the total amount ofcommercial debt under manageable limits,limiting short-term debt, and encouraging non-debt creating financial flows. These measuresled to a sustained improvement in the externalindebtedness position of the country. Efforts arenow on to further consolidate the gains alreadymade. A number of new initiatives have beenundertaken to meet this objective. This includesincreased coverage and computerisation ofexternal debt data, better co-ordination amongagencies reporting debt statistics, pre-payments/refinancing of more expensive external debt andother measures to actively manage sovereignexternal debt of the country.
EXTERNAL SECTOR PROJECTIONS
4.48 As indicated in chapter 2, the macro-economic dimensions targeting an 8 per cent growthin GDP would lead to an increase in the investmentrate to 32.3 per cent by the year 2006-07, as againstthe present investment rate of 24.3 per cent. It isexpected that this growth rate will be achieved withimprovement in efficiency in the economy, and byincluding higher capacity utilisation. The savingsratio is expected to increase to 29.4 per cent by2006-07, as against a level of 23.5 per cent in 2001-02. For the Plan as a whole, the savings rate hasbeen targeted at 26.8 per cent. The implied currentaccount deficit, seen in terms of the gap between
Table 4.8
External Debt : Key indicators
(Percent ratio)
Items 1998 1999 2000 2001 2002 (P)
Total External Debt to GDP 24.3 23.6 22.2 22.3 20.8
Short Term Debt to Total Debt 5.4 4.4 4.0 3.5 2.8
Short Term Debt to Foreign Currency Assets 19.4 14.5 11.2 8.8 5.4
Concessional Debt as per cent to Total Debt 39.5 38.5 38.9 36.0 35.8
Source : RBI.

EXTERNAL SECTOR DIMENSIONS
109
investment requirement and domestic savings bythe end of the Tenth Plan, would be an estimated2.9 per cent of the GDP by 2006-07 and an average1.6 per cent for the Plan as a whole. This gap is tobe met from a combination of inflows of foreigninvestment, external commercial borrowings andother forms of external assistance. In order to lookat the behavioural side of the current account deficit,in this section we look at the projections of exports,imports and flow of invisibles. These projections arebuilt on the experiences of the Eighth and NinthPlan periods. The actual balance of paymentsoutcome will no doubt depend on developments inthe world economy and internal macro-economicbalances, but the policy stance regarding externalvariables will also have an important role to play.
4.49 On the basis of the more liberalisedbalance of payments policy to be pursued and takinginto account past trends in exports and imports aswell as other determining variables, projections havebeen made for exports and imports for the TenthFive Year Plan period.
Exports
4.50 In the Indian context, exports are still seento be primarily supply-side determined. Althoughdemand-related factors, like relative prices (includ-ing exchange-rate movements) and world incomes,are becoming progressively more important,particularly for specific export items, the dominantfactor continues to be the ability of the economy toproduce adequate volumes of exportables toaddress international markets. Analysis of the recentexport performance indicates that the share oftradables in GDP continues to exert a stronginfluence on export behaviour, with exchange ratevariations and relative prices also playing significantroles. International income levels still do not appearto matter significantly, reflecting the low share ofIndian exports in international trade.
4.51 Using the results of the analysis and takingthe projected growth in GDP and its constituentsduring the Tenth Plan period and certain assump-tions for trends in the independent variables during
the Ninth Plan period, export projections have beenmade. The results indicate that if the Tenth Plangrowth targets are met, exports are likely to increasefrom $ 44,915 million in 2001-02 to $ 80,419 millionby 2006-07. This would mean a compound growthrate of 12.4 per cent during the Tenth Plan, with anelasticity of 1.5. It needs to be noted, however, thatthese projections are based on the assumption thatthe REER will be maintained at more or less thecurrent level. Thus, some flexibility does exist inincreasing exports further with a more aggressiveexchange rate policy, if necessary.
4.52 On the basis of these projections, thesector-wise export vector has been estimated forabout 53 broad commodity groups, as may be seenin Annexure-1. The sector-wise break up is basedon shares and growth rates of these sectors duringthe Ninth Plan period. It may be observed thatfishery products, other food and beverages, textiles,readymade garments, other non-metallic minerals(including pearls, precious and semi-preciousstones), leather products, petroleum products,chemicals, iron and steel, machinery and commu-nication and electronic items are expected toconstitute the highest share of exports. At the sametime, the highest growth during the Tenth Plan isexpected in petroleum products, followed bycommunication and electronic equipments, elec-trical machinery, other non-metallic minerals,chemicals, paints, drugs and cosmetics, textiles,readymade garments, food and beverages, etc. Asfar as the projections for export of food items isconcerned, it may be mentioned that these aresubject to availability of surplus, and priority wouldbe given to domestic nutritional requirements.However, with an increase in agricultural productionof 4 per cent during the Tenth Plan and with limiteddomestic demand (due to constraints in purchasingpower), efforts would be on to increase export ofprocessed items. This could include exports ofhorticulture products, particularly processed foodsand vegetables, cashew nuts, spices, manufacturedtobacco, castor oil and oil meals, apart from dairyproducts, poultry, processed meat and other proces-sed foods and beverages. The projections foragricultural exports take these aspects into account.

TENTH FIVE YEAR PLAN 2002-07
110
The overall growth in export of agriculture andallied products has been projected to be around 9per cent.
Imports
4.53 In India, imports are primarily demanddetermined, and are also very sensitive to changesin average tariffs. The customs tariffs have beenreduced gradually as a part of the reforms process.The average tariff duty in 1991-92 was 128 per cent,along with a very large number of separate tariffrates across commodity groups and also coupledwith many exemptions. In 1996-97, the average(total) duty rates were 38.6 per cent with a standarddeviation of 19. The highest duty rate was in theintermediate goods sector, and with substantialvariation. By 2001-02, the average import duty (total)was reduced to 37.1 per cent, which has beenfurther reduced to 33.7 per cent in 2002-03 (theaverage basic import duty is 28.9 per cent in 2002-03). While there is scope for further rationalisationof tariff structure to bring it in line with other EastAsian countries, the sensitivity of imports to the tariffrates demands that care be taken not to place unduepressure on the macro-economic balances. Itbecomes necessary, therefore, to examine theimplications of alternative tariff reform scenarios onbalance of payments.
4.54 The behaviour of aggregate import dem-and in the country is expected to be strongly drivenby domestic growth rates. In addition, the averagelevel of tariffs also exerts a strong influence.Unexpectedly, the exchange rate effects were notparticularly significant over the recent past. Apossible explanation for this is that average tariffrates in India are still too high for the exchange rateto make any material difference in the decision toundertake imports. It is expected that as tariff ratesare reduced, exchange rate movements will becomeprogressively more important.
4.55 The projection of imports during the TenthPlan period has been made on the basis of twolikely scenarios. In the first (scenario-1), the aver-age (total) tariff rate is assumed to come down tothe East Asian level of 15 per cent in the terminal
year of the Plan. In scenario-2, the indicative targetannounced by the government has been assumedto obtain, which yields an average duty rate of 18per cent in the terminal year. The time phasing ofthese two sets of tariff reductions are also different.In scenario-1, tariff reductions are assumed to followa pattern where the present average of total dutyrate is brought down from 33.7 per cent to 27 percent in the next year, then to 22 per cent and 18 percent subsequently, and finally to 15 per cent by2006-07. In scenario-2, the gradual reductionsassume 28 per cent in 2003-04, and 24 per cent,20 per cent and 18 per cent respectively by 2006-07. In both the scenarios, GDP growth has beentaken at the Plan target of 8 per cent per annum.Using the results of the analysis imports wereprojected.
4.56 In scenario-1, with tariffs reduced to 15per cent by 2006-07, total imports are likely toincrease from $ 57,618 million in 2001-02 to $1,32,058 million by 2006-07, implying an annualgrowth of 18 per cent and an elasticity of 2.3. How-ever, if tariffs are reduced only to 18 per cent, theimports are likely to reach up to $ 1,22,846 millionby 2006-07, i.e. an annual increase of 16.3 percent and an elasticity of 2.0.
4.57 The details of the sector-wise projectionsfor imports are provided in Annexure-2. Themethodology used for estimation is the same ascommodity-wise projections for exports. It isexpected that crude petroleum would continue tohave the highest share, followed by other metallic(including gold and silver) and non-metallic minerals,chemicals, machinery and transport equipments.Import of food items is projected to be relativelylow, except edible oils. The highest growth inimports during the Tenth Plan is likely to be fromcommunication and electronic equipments, followedby electrical and non-electrical machinery, edibleoils, non-metallic minor minerals, tea and coffee andleather and leather products.
Trade Balance
4.58 The trade balance, derived on the basisof the projected exports and imports under differentscenarios, is expected to increase to $ (-) 1,64,141

EXTERNAL SECTOR DIMENSIONS
111
million in scenario-1 and to $ (-) 1,41,352 million inscenario-2.
Invisibles
4.59 The net invisibles are projected exogen-ously and are expected to grow broadly at the rateof 11 per cent from the base position of $ 14,054million in 2001-02, comprising $ 35,612 million
receipts and $ 21,558 million payments. It isexpected that the projected net-invisibles wouldincrease to $ 23,716 million by 2006-07.
Current Account Balance
4.60 Based on the projected trade balance andthe net invisibles, the status of current accountbalance is arrived at in different scenarios and given
Table 4.9Current Account Balance during the Tenth Plan Period
($ million)
Scenario-1 : (GDP 8 % : Tariff 33.7 %, 27 %, 22 %, 18 %, 15 %)
2001-02 2006-07 Total Gr.Rate (%)
GDP 4,37,029 6,42,025 27,37,497 8.0
Exports 44,915 80,419 3,22,863 12.4
Imports 57,618 1,32,058 4,87,004 18.0
Trade Balance -12,703 -51,639 -1,64,141
Trade Balance/GDP (%) -2.9 -8.0 -6.0
Invisibles – Receipts 35,612 67,077 2,64,542 13.5
– Payments 21,558 43,361 1,67,155 15.0
Invisibles (Net) 14,054 23,716 97,387 11.0
Current Account Balance 1,351 -27,923 -66,754
Current Account/GDP (%) 0.3 -4.3 -2.4
Scenario-2 : (GDP 8 % : Tariff 33.7 %, 28 %, 24 %, 20 %, 18 %)
2001-02 2006-07 Total Gr.Rate (%)
GDP 4,37,029 6,42,025 27,37,497 8.0
Exports 44,915 80,419 3,22,863 12.4
Imports 57,618 1,22,846 4,64,215 16.3
Trade Balance -12,703 -42,427 -1,41,352
Trade Balance/GDP (%) -2.9 -6.6 -5.2
Invisibles – Receipts 35,612 67,077 2,64,542 13.5
– Payments 21,558 43,361 1,67,155 15.0
Invisibles (Net) 14,054 23,716 97,387 11.0
Current Account Balance 1,351 -18,711 -43,965
Current Account/GDP (%) 0.3 -2.9 -1.6
Note : Tariffs are total duties and include basic and special additional duty.Source : RBI for the year 2001-02.

TENTH FIVE YEAR PLAN 2002-07
112
in Table 4.9. It may be observed that the CAB islikely to increase sharply with lowering of tariffs froman average 33.1 per cent in 2001-02 and 33.7 percent in 2002-03 (the first year of the Tenth Plan), tobring it in line with East Asian levels, i.e. to 15 percent. Reduction of tariffs to 18 per cent by 2006-07would be most consistent with this. The CAB wouldbe relatively more manageable if the tariffs arereduced to 18 per cent as may be seen from thestatus of the CAB/GDP ratios.
Capital Account
4.61 The capital account projections show thefinancing of the current account balance, as in Table
4.10, which gives the details of foreign savings.These projections for the external assistance andforeign investment during the Tenth Plan estimatesare worked out on the basis of the past trends andlikely developments in the future. In particular, therepayment of Resurgent India Bonds and the IndiaMillennium Depositories has been fully taken intoaccount.
Balance of Payments
4.62 On the basis of the current account andcapital account, the balance of payments seen interms of change in reserves, has been projectedunder the two scenarios as may be seen in Table
Table 4.10Inflow of Foreign Savings
($ million)
2001-02(P) 2006-07
External Assistance (net) 1,117 1,572
Commercial Borrowings (net) -1,114 4,400
Non-Resident Deposits (net) 2,754 2,750
Rupee Debt Service -519 -600
Foreign Direct Investment (net) 3,905 7,500
Portfolio Investment 2,020 5,600
Foreign Investment Flows (net) 5,925 13,100
Other Capital Flows (net) 1,382 1,000
Capital Account Total (net) 9,545 22,222
Debt 2,550 9,122
Source : Planning Commission (September 2001), Report of the Sub-Group on External Aid and WTO Commitments,
Table 4.11Change in Reserves under Various Scenarios
($ million)
Year Current Account Balance Capital Accountand CAB/GDP in bracket (Net) Change in Reserves
Sc-1 Sc-2 Sc-1 Sc-2
2001-02 1,351 1,351 9,545 10,896 10,896(0.3) (0.3)
2006-07 -27,923 -18,711 22,222 -5,701 3,511(-4.3) (-2.9)
Source : Derived from Table 4.9 and 4.10.

EXTERNAL SECTOR DIMENSIONS
113
4.11. In scenario-1, when the tariffs are broughtdown to 15 per cent, the change in reserves by2006-07 is likely to be $ (-) 5,701 million. The changein reserves is likely to be $ 3,511 million by 2006-07in scenario-2 where the tariffs are brought downless sharply to 18 per cent.
4.63 As may be observed from Table 4.11, thesustainable current account deficit and balance ofpayments situation at present are likely to besubstantially compromised if average tariffs arebrought down sharply to East Asian levels. Concer-ted effort would, of course, be required to increaseexports. Since structural changes (in terms ofchanging share of tradables and relative prices) canbe a medium to long-term option, it is the nominalexchange rate that would need to be suitablyadjusted from time to time to keep balance ofpayments under control. It is the financing of thecurrent account deficit that is important for sustaineddevelopment during the Tenth Plan. Flow of foreigninvestment into productive sectors is essential.Moreover, as has been learnt from the experiencein East Asian countries, the present trend of limitedreliance on the ‘flighty’ short-term debt needs to becontinued. Flow of foreign exchange reserves toshort-term debt and, even more so, from the short-term debt to export of goods and services, needsto be maintained at viable levels to maintainbuoyancy in the international capital markets.
TRADE AND EXCHANGE RATE POLICY
4.64 The trade regime in India till recently, hasbeen very complex, characterised by severequantitative restrictions on imports and exports, andvery high tariffs on imports. Quantitative restrictionson imports were based on a restrictive licensingpolicy and further complicated by a wide variety ofspecial import schemes. These included the importreplenishment scheme for exporters, the actual userpolicy, government purchase preference andcanalised imports for specified items throughdesignated state agencies.
4.65 It is recognised that the most importantpre-condition for creating a more open economy isto create an expanding production base of tradable
goods and services, which can not only withstandexternal competition, but also provide the surplusnecessary to ensure sufficient export earnings formeeting the import needs of the country. The secondpre-condition is to create conditions under whichthe export market becomes increasingly moreattractive, so that there is both a shift from sellingin the domestic market to exports, and developingcapacities to specifically target such export oppor-tunities. Both these conditions are inextricablyinterlinked, and involve the reduction and eventualelimination of the anti-export bias that hascharacterised the Indian economic system in thepast and continues to exist to some degree even atpresent. There are two dimensions to this. First,the incentive structure has to be re-oriented towardsinvestment in tradable goods and services and awayfrom non-tradables. Second, the relative profitabilityof exports vis-a-vis domestic sales has to beimproved. The principal instrument for achievingboth these conditions is the exchange rate, whichis discussed in some detail.
4.66 With the steady reduction of controls intrade matters, the exchange rate has emerged asa major instrument of policy. It needs to be usedfirmly but judiciously to achieve steady andsustainable growth of trade, investment andcompetitiveness. With the introduction of almostfull convertibility on the current account and alsopartial convertibility on the capital account, theexchange rate has already been made moresensitive to the demand for and supply of foreignexchange in the economy. This, however, may haveto be tempered occasionally by strategic inter-vention of the government in order to ensure thatthe imperatives of macro-economic policy are met.Since exports have a central role to play in theattainment of the Tenth Plan targets and in thepresent and future development strategy, it issuggested that the exchange rate be viewedprimarily as an instrument to affect the behaviourof exports at least until such time as the productionbase of the economy is sufficiently integrated withthe international market and exports are robustenough to withstand periodic fluctuations in theexchange rate and in international prices.

TENTH FIVE YEAR PLAN 2002-07
114
4.67 The exchange rate not only affects thedegree of price competitiveness of domestictradables in comparison to international markets,but also determines the relative profitability oftradables vis-a-vis non-tradables in the domesticeconomy. In the present context, both the factorsare of importance, and the conduct of exchangerate policy would have to take into account thesomewhat different considerations that underlie thetwo objectives. The standard measure of domesticprices relative to international prices, the realeffective exchange rate, adjusts the nominalexchange rate by the differential rates of inflation inIndia and abroad. During the Ninth Plan, the export-weighted real effective exchange rate of the rupeehas shown considerable amplitude, combiningsharp depreciations with long periods of gradualappreciation, with the effect that at the end of theNinth Plan (2001-02) the REER was 1.4 per cent
above its level in March 1997, which implies thatthe relative price competitiveness of Indian exportson account of the exchange rate has been erodedto this extent. Matters are worse if the effect of theexchange rate on relative attractiveness of tradablesvis-a-vis non-tradables in the domestic economy isconsidered. The appropriate measure of this is notthe REER, but the nominal exchange rate adjustedonly by the domestic inflation rate. This measurehas appreciated quite substantially over the sameperiod by 35.9 per cent, as shown in Table 4.12.This behaviour of the exchange rate is notconducive to a steady move towards greater exportorientation of the economy. During the Tenth Plan,the exchange rate will need to be deliberatelydepreciated in terms of the average level of pricesin the country, which would, given the targeted rateof inflation for the Tenth Plan period, imply a nominaldepreciation in the range of 5 to 7 per cent per
Table 4.12
Indices of the Exchange Rate (Base 1997-98 = 100)
Year NEER REER WPI/NEER
Level % Change Level % Change Level % Change
1997-98 100.00 - 100.00 - 100.00 -
1998-99 90.83 -9.17 94.66 -5.34 116.65 16.65
1999-00 88.63 -2.42 94.45 -0.22 123.45 5.83
2000-01 88.78 0.17 99.27 5.10 132.06 6.98
2001-02 89.35 0.64 102.10 2.85 135.94 2.94
Note : (1) NEER = Nominal Effective Exchange Rate= w(i).e(i).e
where : w(i) = x(i)/xx(i) = exports made in the ith currencyx = total exportse(i) = index of the exchange rate of the ith
currency against $ expressed as the number ofunits of ith currency per $ 1
e = index of exchange rate of the rupee expressedas the number of units of $ to Re. 1
(2) REER = Real Effective Exchange Rate= NEER.[ w(i).P/P(i)]
where : P = Price Index for IndiaP(i) = Price Index of ith country
(3) WPI = Wholesale Price Index (domestic)Source : Economic Survey 2001-02 and Annual Report, RBI, 2001-02.

EXTERNAL SECTOR DIMENSIONS
115
annum under normal circumstances. Such anexchange rate strategy would, to some extent,correct the bias against tradables, by leaving therelative prices of traded and non-traded goods moreor less unchanged, and thereby facilitate the effortsat containing the secular reduction in the share oftradables in GDP. This should also automaticallylead to a depreciation of the REER in the 2 to 3 percent per annum range, assuming that the inter-national rate of inflation does not accelerate fromits usual trend rate of 3 to 4 per cent per annum,and thereby improve the price competitiveness ofIndian goods and services in the external market.
4.68 There is a point of view which holds thatthe exchange rate is not only an uncertain instru-ment of export promotion but it also has the negativeeffects of generating cost-push inflation andretarding external capital inflows, and that greaterreliance should be placed on increase in efficiencyand improvements in quality, productivity andtechnology for attaining greater internationalcompetitiveness. While it is no doubt true that inthe longer run there is no substitute for efficiency,quality, productivity and technology, these take timeto develop and may not be directly affected by publicpolicy during the short to medium run. Theseattributes are expected to develop steadily over timein the Indian economy as a normal consequence ofincreased competition and greater integration withthe international economy, and the government canplay only a facilitative role. The immediate impera-tive is to encourage a greater degree of outwardorientation through policy initiatives, for which theexchange rate is the principal instrument.
4.69 Note, however, has to be taken of thealleged negative dimensions of exchange ratedepreciation. The first argument against a policyof steady depreciation is that it is inherentlyinflationary and, when exports are either import-dependant or face low price-elasticity of demand, itmay not stimulate exports in any substantial manner.Thus, the trade-off involved in exchange ratedepreciation is between the negative effects ofacceleration in domestic inflation and a net exportexpansion effect. It is true that any effort at alteringthe relative price structure tends to be inflationary
as the various sectors of the economy attempt toprotect their relative position. This does not, how-ever, constitute a compelling argument for notmaking the effort at altering the price relatives whenit is desirable as a part of a development strategy.On the other hand, it does underline the need toadopt a stringent anti-inflationary policy stance asa complementary measure, which is in any case anintegral component of the Tenth Plan strategy.Furthermore, in the Indian context, there is ampleempirical evidence that exchange rate depreciationdoes have strong export expanding effect. Thisarises primarily out of the fact that the Indian exportbasket still has a very low share of differentiated orbranded products, which are the category of goodsthat are less price-sensitive, and the bulk of exportsrely principally on price competitiveness. Thischaracteristic of the Indian export basket is likely tocontinue to obtain in the immediate future, andemphasises the need to follow an active exchangerate policy.
4.70 It is sometimes argued that a stablenominal exchange rate is conducive to attractinggreater external capital flows, and an expectationof currency depreciation may deter such inflows bylowering the expected returns denominated inforeign currency terms. But, it should be noted thatif the exchange rate gets misaligned due to inflationand macro-economic imbalances, there will beexpectations of depreciation, and a prolonged non-adjustment of the exchange rate will only strengthensuch expectations resulting in reduced capital flowsand eventual capital flight. What is called for is theadoption of appropriate policies to maintain macro-economic balances and not any artificial peggingof the exchange rate. Furthermore, the real benefitsof foreign investment can be reaped, only whenthese investments come in, on the basis of theintrinsic strengths of and the real factors present inthe economy, rather than on the basis of the implicitcapital gains arising out of an expected appreciationof the currency. The advantage of a depreciatingcurrency is that the foreign investment that doescome in under such an expectation will not only beless speculative, but also more export-oriented inits own interest as against the greater inwardorientation of investment that relies on nominal

TENTH FIVE YEAR PLAN 2002-07
116
exchange rate stability. The possibility of an outflowof existing portfolio investment, arising out of anexpected depreciation, adds to the urgency ofclearly signaling the future strategic approach toexchange rate management before the stock ofsuch external portfolio liabilities becomes too largeto risk any substantial net outflow.
4.71 There is, however, an issue as to whetherthe exchange rate should be depreciated graduallyor devalued sharply to attain some medium-runtarget value. If the primary emphasis of exchangerate policy is on its effect on external capital flows,then a devaluation is generally to be preferred, sinceit immediately improves the incentive to export andreduces the probability of generating expectationsof further depreciation among foreign investors.However, such a step does not generally create thecondition for a sustained shift towards greater exportorientation, particularly insofar as new investmentsare concerned. It may also require much sharperanti-inflationary measures, which may be contrac-tionary in the short run since the fiscal parametersare unlikely to improve sufficiently within the shortperiod. A more gradualist exchange rate stance,on the other hand, not only improves the relativeprofitability of exports, albeit less than a devaluation,but also affects the pattern of investment in favourof tradables in general, and exportables in particular.It would, however, require strict management interms of the collateral macro-economic policies,particularly to prevent generation of inflationaryexpectations that may accompany a process ofgradual depreciation. In view of the objectives ofthe Tenth Plan, it appears preferable to opt for thelatter strategy and address the issue of foreigninvestment through policies aimed at reducing andeventually eliminating the impediments that existat present.
4.72 In recent years, the ability of the govern-ment to determine the behaviour of the exchangerate has eroded quite significantly. Relatively largemovements of financial capital and the need formonetary restraint have constrained the extent towhich the exchange rate could be used as a policyinstrument. In order to re-establish the primacy ofthe exchange rate as an instrument of macro-
economic policy in an open economy, thegovernment has to create the conditions wherebyit can intervene in the foreign exchange markets ina meaningful way. For this, binding ceilings notonly on ECBs as at present, but also some controlon net FPI flows through taxes and otherdisincentives, appear inescapable, at least until suchtime as the Indian foreign exchange marketachieves sufficient depth and the foreign exchangereserves of the country are sufficiently large towithstand speculative pressures. Such restrictionson the inflow of FDI are, however, unnecessarysince they are normally associated with real capitalinflows, both physical and in the form of technologyand services.
4.73 Exchange rate management, however, isonly one of the instruments to affect a greaterdegree of export orientation in the economy. Tariffreforms is an important component of the efforts atincreasing competition and efficiency in the eco-nomy, and making Indian exports more competitiveboth abroad and, also, relative to import substitutesin the domestic market. As has already beenmentioned, the Tenth Plan will attempt to achieveinternational levels of tariffs, while carefully phasingout the changes, keeping in view the larger interestsof the economy and the progress made on otherfronts. This transition can be made without too muchdisruption in view of the additional protection todomestic industry that is sought to be providedthrough the process of exchange rate depreciationduring the Tenth Plan period.
DIRECT EXPORT POLICY INITIATIVES
4.74 The policy reforms have aimed at creatingan environment for achieving rapid increase inexports to make it an engine for achieving highereconomic growth. Depending on the internationalenvironment and domestic exigencies, variousexport policies have been formulated from time totime. More recently, a number of steps have beentaken to enhance the export growth. This includesreduction in transaction costs through decentra-lisation, simplification of procedures and variousother measures, which are enumerated in the EXIMPolicy 2002. Steps have been taken to promote

EXTERNAL SECTOR DIMENSIONS
117
exports through multilateral and bilateral initiatives,identification of thrust sectors and focus regions.Special economic zones are being set up to furtherboost the exports. Import of second hand capitalgoods, which are of less than10 year vintage, havebeen allowed. In order to encourage export ofquality/branded goods, double weightage has beenaccorded to exports made by units having ISO orequivalent status. Other measures include promo-tion of agricultural exports, market access initiative,setting up of business-cum-trade facilitation centresand trade portals, strengthening of the AdvanceLicensing Scheme, Duty Free ReplenishmentCertificate (DFRC), Duty Entitlement Pass Book(DEPB) Scheme, etc.
4.75 The EXIM Policy 2002 has removed allquantitative restrictions (QRs) on exports, exceptfor a few sensitive items retained for export throughthe State trading enterprises. The comprehensivepolicy covers the agricultural sector, cottage andhandicrafts and the small-scale sectors. Apart fromremoving restrictions on agricultural exports, it isproposed that transport assistance be madeavailable for exports of fresh and processed fruits,vegetables, floriculture items, poultry and dairyproducts, and products of wheat and rice.
4.76 Some of the sector-specific packages inthe policy include incentives for export of jewellery,leather and textiles, handicrafts, and other itemsfrom the small-scale sector. To elaborate, the pack-age includes reduction of customs duty on importof rough diamonds to zero per cent; abolition oflicensing for rough diamonds which should helpIndia to emerge as a major international center fordiamonds; reduction in value addition norms forexport of plain jewellery from 10 per cent to 7 percent; and allowing export of all mechanised un-studded jewellery at a value addition of 3 per centonly as part of the effort to achieve a quantum jumpin jewellery exports. Further, relaxations have beenmade in terms of extension of duty-free imports oftrimmings and embellishments up to 3 per cent off.o.b. value, hitherto confined to leather garmentsto all leather products; and permitting DEPB ratesfor all kinds of blended fabrics among several otherbenefits for the textile sector. The policy also marks
the launching of a new programme called, SpecialFocus on Cottage Sector and Handicrafts, keepingin view that the small scale products form 50 percent of India’s exports.
4.77 In addition to merchandise exports, thereis tremendous scope for increasing exports fromthe services sector as India has a highly skilledmanpower and a large industrial base. This is beingtapped for electronic and computer software, engi-neering consultancy, banking, insurance, tourism,etc. The Policy is geared towards nearly doublingIndia’s present exports of about $ 45 billion to morethan $ 80 billion over the Tenth Five Year Plan by2007.
4.78 It was also announced that overseasbanking units (OBUs) would be permitted to be setup in special economic zones (SEZs). These unitswould be virtually foreign branches of Indian banksbut located in India. These OBUs would be exemptfrom usual requirements of credit reserve ratio andstatutory liquidity ratio. The banks would provideaccess to SEZ Units and SEZ developers tointernational finances at international rates. Thepolicy includes various duty-neutralisation instru-ments for exports such as the Duty Entitlement PassBook. Export Promotion Capital Goods (EPCG) andall other schemes like Advance Licenses, etc., wouldcontinue along with the existing dispensation of nothaving any value caps. EPCG licenses of Rs.100crore or more will have 12 years export obligationperiod (as against 8 years earlier) with a five-yearmoratorium. A Plan scheme entitled, Market AccessInitiative (MAI) was initiated to assist industry inresearch and development, market research,warehousing and marketing infra-structure. Also,a scheme for participation of States in the exportendeavour, Assistance to States for InfrastructureDevelopment for Exports (ASIDE) is beingencouraged. Moreover, attention is being paid toaspects of grading and quality control, and scientificpackaging methods to meet international standards/specifications.
4.79 In order to promote exports to LatinAmerica, Africa and the Commonwealth of Indepen-dent States (CIS) countries, various programmes

TENTH FIVE YEAR PLAN 2002-07
118
have so far been launched. It is expected that inaddition to the Focus: LAC programme for accele-rating trade with Latin American countries, the newprogramme called Focus: Africa would give a boostto India’s trade with the sub-Saharan African region.In order to strengthen trade ties with the CIScountries, a Focus: CIS programme would belaunched in the coming year.
4.80 A Medium-Term Export Strategy 2002-07 was announced in January 2002, with a viewto providing a road map for the export sector inthe medium term. The aim is to focus on theimport baskets of our major trading partners(USA, Japan and EU) in the context of India’sexport basket, and arrive at focus products andfocus markets for India. A total of 220 items and25 markets have been identified for specialattention based on various criteria, and indicativesector-wise strategies have been formulated.The Export Strategy 2002-07 aims to achieve 1per cent share in world exports by 2006-07, froma 0.67 per cent in 2000-01. In order to achievethis, there is a continued need to address thedomestic problem of infrastructural bottlenecksin the country, mainly relating to transportproblem and ports facilities. Further, in order toimprove the price competitiveness of our exports,provision is being made for WTO compatiblesubsidies, transport, pricing and comprehensivetax system especially for exporters, strengtheningexport oriented small-scale industries,dissemination and extension of information topotential exporters, etc. At the international level,apart from genuine trade fluctuations, restrictivetrade practices by some of the trading partnersin developed countries need to be negotiated.
4.81 Thus, in order to facilitate promotion ofexports during the Tenth Plan, there is need to givefurther impetus to the major foreign exchangeearning sectors of cottage and handicrafts, gemsand jewellery and exports from the services sector,including electronic and computer software,engineering, and consultancy. The special econo-mic zones already set up could be allowed greaterrelaxations from investment restrictions, particularlysmall scale industries reservations, foreign equity
limits, real estate, etc. These zones could be classi-fied as completely duty free enclaves for tradeoperations and be treated as ‘foreign country’ insofaras trading conditions are concerned. Relaxationsmay be given to corporate income tax and otherexcise and service taxes, and appropriate labourlaws made applicable to these enclaves.
FOREIGN INVESTMENT
4.82 The projected balance of payments (BOP)position for the Tenth Plan period given in Table 4.9indicates that the current account deficit (CAD) islikely to be 2.9 per cent of GDP by the terminalyear of the Plan (2006-07). In view of the experienceof the late 1980s during which India experiencedCADs of above 2 per cent per annum, culminatingin the crisis of 1991, there may be some appre-hensions about the sustainability of the proposedBOP scenario. On the other hand, there is a pointof view which holds that the CAD need not per sebe a matter of policy concern, and attention shouldbe restricted only to the public component of theexternal liabilities. The argument is that the privatesector can be expected to fully take into accountthe inter-temporal viability of its liabilities, bothinternal and external, and hence the privatecomponent of CAD would necessarily be self-correcting in the longer run. This is not, however, atenable position for countries whose currencies arenot reserve currencies, and certainly not for count-ries with non-convertible currencies. The reasonfor this, apart for the normal failure and default riskpresent in any commercial activity, is that theindividual private sector firm normally evaluates itsinter-temporal budget constraint in terms of thedomestic currency and not on the basis of thecurrency in which the liabilities were originallyincurred. Thus, the possibility exists that privateviability can co-exist with a running down of acountry’s foreign exchange reserves. Internationalexperience, especially the East Asian crisis,provides ample instances of such outcomes.
4.83 Prior to the economic reforms, whenforeign investment was virtually non-existent, thesustainable CAD for India was estimated to be about1.4 per cent of GDP. With the liberalisation of

EXTERNAL SECTOR DIMENSIONS
119
external trade and investment, this figure has risenquite sharply, since foreign investment does notcarry the same level of systemic risk as externaldebt. On the aggregate, therefore, it is felt that theCAD projections are sustainable provided that theforeign investment flows are of the requiredmagnitudes. Nevertheless, there are two factorsthat need to be taken into account. First, foreigninvestments tend to require a higher rate of returnthan the interest rate on debt over the longer run.Therefore, it would not be prudent to raise the CADtarget too much unless there is sufficient confidencein being able to maintain relatively high growth ratesof exports over an extended period. Second, adistinction has to be drawn between foreign directinvestment and foreign portfolio investment in termsof their effects on the economy.
4.84 In general, FDI is preferred to FPI, partlybecause its returns are closely linked to the perfor-mance of the real economy and partly because ittends to be less volatile than FPI. Besides, the mostimportant disadvantage of FPI flows is that it tendsto be pro-cyclical, in the sense that it comes in whenthe balance of payments (BOP) position is seen tobe strong and goes out when the BOP position isexpected to weaken. Thus, it accentuates thedirection of movement of the BOP, which can causeserious problems in macro-economic management.In the case of countries like India, where the foreignexchange markets are very thin as compared tothe international financial market, a free FPI regimecarries the danger of speculative movements, whichcan lead to serious disruption in the economy.
4.85 There is another dimension, however, tothe relative benefits of FDI over FPI which needs tobe taken into account. FDI can make up not onlyfor deficiencies in the availability of savings andforeign exchange – which is true of all external flows– but also for weaknesses in domestic entre-preneurial capacity. In other words, the role of FDIin directly stimulating investment activity in thecountry can be of great significance. This isparticularly important for India during the Tenth Planperiod since, as has been pointed out in chapter 2,there is a likelihood that corporate investmentactivity may not be dynamic enough to absorb the
available resources, particularly in those areaswhich are being vacated by the public sector. Insuch a situation, the entrepreneurial function playedby FDI can have the effect not only of bringing inadditional resources, but also leading to betterabsorption of domestic savings. On the other hand,relatively free access for FDI with restrictions onother forms of external capital may put domesticentrepreneurs at a serious disadvantage. This hasnot only to do with the access to relatively lowercost external funds, but also in terms of the competi-tion for accessing domestic finance. This disadvant-age can be bridged by FPI, which increases theliquidity available to domestically listed companies.Thus, a careful balance needs to be struck betweenthe inflows of FDI and FPI in order to ensure thatsufficient foreign entrepreneurship comes in to thecountry without “crowding out” domesticentrepreneurship. The figures for the various formsof external flows given in Table 4.10 reflect theseconsiderations.
4.86 However, it needs to be borne in mind thatthese foreign investment figures are targets and notprojections. Foreign investments, by their verynature, are supply-driven in the sense that althoughthe country can create the conditions for makingsuch investments attractive, the decision as towhether and how much to invest is made by theforeign investor. This factor is of course well recog-nised, and there is considerable discussion in thecountry regarding the creation of a conduciveenvironment for foreign investment. It would bedesirable to unequivocally state that much of thisdebate may actually miss the essential issue –namely, that an investor-friendly climate needs tobe created in the country for all investment, andnot just for foreign investors. Indeed, it is submittedthat if the investment climate in general is improved,no exclusive measures may be needed to attractforeign investors. On the other hand, if a specialand differentiated investment regime is set up forforeign investors, it may actually do more harm thangood.
4.87 Nevertheless, a certain degree of focuson foreign investors has to exist if for no otherreason than as a recognition that they would be

TENTH FIVE YEAR PLAN 2002-07
120
treading on unfamiliar waters. There are twodimensions to this which are of particular relevance.First, potential foreign investors have to bespecifically targeted at and wooed. Although India’spresence has improved significantly in theinternational investors’ radar screen in recent years,there is still a long way to go before it can be takenfor granted. This is especially true for a number ofsectors in which India’s requirements may be atvariance with international investor perceptions.Heavy industries are a case in point, especiallythose which, until recently, were reserved for thepublic sector. Second, hand-holding operations inthe form of an effective investment facilitationmechanism is essential for companies which wouldbe making their first foray into the country.Unfamiliarity with laws, rules and procedures canbe a great deterrent, particularly in a country withsignificant regional variations in these matters.
4.88 Insofar as FPI is concerned, similarconsiderations apply. The state of the domesticcapital market is far more crucial to attracting foreigninstitutional investors than any special regime ordispensation. The focus, therefore, should be onimproving the regulatory and supervisory frameworkgoverning the domestic capital markets and ontechnological modernisation of their operations.There has already been considerable progress inthis regard, but it is still some distance away beforethe full range of financial instruments are introducedin India and innovations are expeditiously permitted.Finally, there is no reason to expect that externalinvestor confidence can be at variance with that ofthe domestic investor. Therefore, the preconditionto attracting greater FPI is the return of the domesticinvestor to the Indian capital markets.
WTO ISSUES
4.89 India is one of the founding members ofthe World Trade Organisation (WTO) and partici-pation in the WTO rule based system implies greaterstability, transparency and predictability in thegovernance of international trade. The importanceof WTO in promoting multilateral trade is beingincreasingly acknowledged. The WTO rulesenvisage non-discrimination in the form of national
treatment and most favoured nation (MFN) treat-ment to our exports in the markets of other WTOmembers. National treatment ensures that ourexports to other member countries would not bediscriminated vis-à-vis their domestic products.MFN treatment likewise ensures non-discriminationamong various members in their tariff regimes andalso other rules and regulations.
4.90 Emerging from continued discussions invarious multilateral fora, developmental issuesalong with trade related issues are being increa-singly focused at the international level. Povertyconcerns of developing countries along withdevelopment and trade policies are also being givencognisance. Need has been felt for integration oftrade policies with development strategies,increasing support to areas of finance and debtrelief, recognising the importance of technology fordevelopment, improvement in market access fordeveloping countries in sectors like textiles, clothingand agriculture, and providing better access to thedispute settlement mechanisms for these countries.The issue of abuse of the anti-dumping procedure,the problems of rules of origin criteria, technicalbarriers to trade, regional trading blocs, etc., arealso being considered at various levels in the WTO.
4.91 The Government of India has takenseveral steps to implement the policy commitmentsmade under some of the agreements, particularlyunder the Agreement on Tariffs and QuantitativeRestrictions, Agreement on Agriculture (AoA), TradeRelated Intellectual Property Rights (TRIPs), TradeRelated Investment Measures (TRIMs), GeneralAgreement on Trade in Services (GATS), apart fromothers. A strategy for tariff negotiations is, however,required. The additional ‘non-trade’ issues relatingto transparency in government procurement prac-tices, trade and competition policy, trade andenvironment, and trade and labour standards pro-posed in the Singapore and the Geneva Ministerialneed to be addressed for negotiations. The commit-ments regarding the technical barriers to trade,social agenda covering labour standards andenvironmental and phyto-sanitary issues alsorequire establishment of certain national standardsand technical regulations in a standardised andtransparent system.

EXTERNAL SECTOR DIMENSIONS
121
4.92 At the same time, there are some issueson which India has expressed certain reservations.These are:
• During the implementation of WTO agree-ments in the last six years, India hasexperienced certain imbalances andinequities in the WTO agreements. It isfound that some developed countries havenot fulfilled their obligations in letter andspirit of the WTO agreements, and manyof the Special and Differential Treatmentclauses, in favour of developing countries,added in various WTO agreements haveremained inoperational.
• Taking advantage of the exception clausesprovided in the WTO, most industrialisedcountries are still enforcing various regula-tions on foreign producers and suppliers.
• Extending the scope of the investmentregime in WTO beyond Trade RelatedInvestment Measures and GeneralAgreements on Trade in Services, is notappropriate.
• A multilateral framework cannot guaranteean increase in FDI inflows although itthreatens to adversely affect the qualityof the inflows.
• There are also other asymmetries present,as the WTO does not address theresponsibilities of corporations which oftenimpose trade restrictive clauses on theirsubsidiaries.
• WTO has not been able to ensure abolitionof non-trade barriers being imposed onlabour and environmental considerations,including the linkage in certain Genera-lised System of Preferences (GSP) sche-mes to these issues.
4.93 The present negotiations strategy is basedon the decisions taken at the Doha Ministerial inNovember 2001. The Doha Declaration focusedmainly on TRIPs agreement, public health, tradeand environment and the implementation relatedissues and concerns. Elaborate timetables on work
programme for current negotiations in agricultureand services and other issues have been workedout.
4.94 The Doha Conference presented mixedresults for India. India’s main concern was to speedup implementation of various agreements and toundo the imbalances and inequities present in someWTO agreements. From India’s point of view, fasterremoval of the textile quotas maintained by deve-loped countries like the USA was the most importantimplementation issue, which was, however, met withlimited success. As far as environmental issuesare concerned, the Doha declaration has mandatednegotiations to clarify WTO rules in the light ofmultilateral environmental agreements. Thesenegotiations could lead to developed countriesraising barriers against goods from developingcountries on the pretext of environmental protection.India had also reservations on starting negotiationson four new ‘non-trade’ areas, namely, multilateralinvestment, global rules on competition, transpa-rency in government procurement and trade facili-tation, i.e., framing of uniform custom’s proceduresfor clearance of goods. India could secure only atwo-year respite and the study process wouldcontinue for two more years, i.e. up to the FifthMinisterial Conference, when a decision aboutnegotiations will be taken on the basis of an explicitconsensus.
4.95 Apart from mandated negotiations inagriculture and services where the process hasalready started, negotiations on market access fornon-agricultural products is quite important for India,as reduction or elimination of tariffs, tariff peaks andtariff escalation as well as removal of non-tariffbarriers will be quite helpful in exports. India would,of course, have to make offers even though thenegotiations will be carried out under less than fullreciprocity as far as developing countries areconcerned.
4.96 The other area where action is requiredis in regard to extension of protection of geogra-phical indications to products other than wines andspirits under Article 23 of TRIPs and the relationshipbetween TRIPs and the Convention on Biological

TENTH FIVE YEAR PLAN 2002-07
122
Diversity (CBD), and Traditional Knowledge (TK)under Article 71.1. The process of legislation inregard to geographical indications needs to becompleted. In the area of TRIPs and access tomedicine, where additional flexibility is provided inseparate ministerial declarations in terms ofcompulsory licensing and parallel imports, India canbenefit in terms of lower prices of crucial life savingdrugs and even promoting exports of pharma-ceutical products.
4.97 India and other developing countriesshould now ensure an average balance ofreciprocity in these negotiations. There is need fora continued effort to handle some of the complexissues, as per international requirements as wellas our domestic resources and other constraints,during the Tenth Five Year Plan. Some of theseissues are briefly examined here in the context ofthe text of the agreements, some of which arealready accepted and others proposed fornegotiations.
Agreement on Agriculture
4.98 The Agreement on Agriculture (AoA) aimsto have an equitable reform programme for tradein agriculture amongst the member countries, alsotaking into consideration some non-trade concernsincluding food security. It is recognised thatagriculture is a way of life in most developingeconomies. It contributes significantly to the overallGDP of these countries and employs a large propor-tion of the workforce. The policies for agriculturaldevelopment aim to increase productivity and overallproduction in the agriculture sector. Rapid growthof agriculture in these economies is essential forfood security as well as alleviation of poverty. Foodsecurity is defined by the FAO as ‘the physicaleconomic access for all people at all times forenough food for an active, healthy life with non-riskof losing such access and as such is directly connec-ted with livelihood in the developing countries’. Inthis background, the commitments made under AoAare expected to ensure that food security interestsof developing countries are primary in relation tothe disciplines of market access and domesticsupport.
4.99 The commitments under AoA mainly relateto product-specific and non-product-specific domes-tic support, market access and export subsidies.The product-specific support is related to theAggregate Measure of Support (AMS) given tofarmers in the form of subsidies for fertilizers, seeds,pesticides, credit, electricity, etc. The AMS is calcu-lated for each product receiving market support andis based on the prices prevailing in the base period1986-88. Several categories of subsidies have beenexempted from AMS calculations such as forresearch programmes, pests and disease control,training services, extension and advisory services,marketing and promotional services, and infrastruc-ture development. Apart from this so- called ‘greenbox’ areas of support, payments for productionlimiting programmes and also decoupled incomesupport was exempted.
Issues of Concern
4.100 There are a number of issues under theAoA, which are considered against the interests ofdeveloping countries like India. First of all, it relatesto minimum access for import of primary goods thatflout the basic rule of free trade promotion enshrinedunder the WTO agreement. The governmentbudgetary support for agriculture is subjected tointernational discipline. ‘Green Box’ subsidies andalso exports subsidies are required to be identifiedtransparently to be permissible, while the rest isactionable by WTO. In any case, the ‘blue box’ and‘green box’ subsidies, which are exempted fromreduction commitments, also lead to distortions intrade. This has been emphasised by developingcountries, like India, which have a majority of lowcost agricultural producers.
4.101 It has been suggested, on the basis of theexperience of implementation of the AoA, that theagreement legitimised the various trade distortingpractices of the developed countries in their favour.Further, it has even taken away the right of thedeveloping countries to give some limited exportsubsidies as otherwise provided under the Subsidiesand Countervailing Measures Agreement. Despitefulfilling their so called reduction commitments, thetotal support being given to agriculture in the OECD

EXTERNAL SECTOR DIMENSIONS
123
countries has gone up from $ 308 billion in the year1988 to $ 361 billion in the year 1999.
4.102 The other problem relates to distortionsemerging from inequity in domestic subsidy disci-pline due to different base positions. The developedcountries, which are heavily subsidising countries,are allowed to retain up to 80 per cent of theirsubsidies, while developing countries can subsidisetheir farmers not more than 10 per cent of the totalvalue of agricultural production. The domesticsupport by developed countries needs to be reducedsubstantially in absolute terms.
4.103 The domestic support measures relaxedfor the purpose of food security and PDS areallowed only in relation to the international marketprice and to the targeted population. This is aproblem for countries like India with high percentageof poor population and also dependent on agri-culture, where purchase of agricultural products atinternational market price is not possible withoutadverse consequences. Food security that is inter-linked with the livelihood security, is extremelyimportant for densely populated countries with alarge agrarian economy like India. These countrieswould need enough flexibility under the Agreementon Agriculture to take care of its food security, ruralemployment and livelihood concerns.
4.104 India has also argued that low incomedeveloping countries such as ours, need to addressmarket access and domestic support discipline suchthat their food requirements are basically met fromdomestic sources. The volatile international marketcan get transmitted to the domestic economy andseriously affect the prices of food grains and foodentitlement of the poor. Commodities like wheat,coarse grains, edible oils, sugar, dairy products,fruits and vegetables that are crucial for foodsecurity would need to match high levels of exportsubsidies by developed countries. It is suggestedthat for development of agriculture in developingcountries, diversification of ‘green box’ subsidiesshould be encouraged and allowed input subsidiesto crops where productivity levels are below theworld average. The negative product-specific
support may be permitted so as to be adjustedagainst non-product-specific support.
4.105 The other issue of concern relates toimplementation of changes in the tariff regime foragricultural commodities. The peak tariff on agri-cultural commodities in countries like USA, Canada,EU, Japan, Korea and the Cairns group continuesto prevail at very high rates. A study conducted bythe WTO with United Nations Conference on Tradeand Development (UNCTAD) (1997) has observedthat one-fifth of the peak tariffs of the USA, a quarterof those of EU, about 30 per cent of those of Japanand about one seventh of those of Canada exceed30 per cent. It further reports that the most importantareas for developing countries face highest tariffrates and include the major agricultural staple foods,cereals, meat, sugar, milk, butter and cheese aswell as tobacco products and cotton. In fact, thestudy suggests that tariff wedges will continue tobe significantly high on account of tariff escalation,which is a major factor preventing developingcountries from diversifying and increasing theirshare of processed agricultural exports.
4.106 In India, agricultural tariffs are much lowercompared to these countries, even though industrialand mining tariff rates still prevail much higher. Thepeak rates for agricultural commodities in developedcountries need to be negotiated. These tariff ratesare progressively being reduced to bring them inline with rates prevailing in East Asian economies.
4.107 Moreover, support packages by developedcountries under production-limiting programmes forretirement of producers, as well as resourcesemployed for production of marketable surplus inthe past is still beyond the purview of the subsidydiscipline. This needs to be re-negotiated. Also,there is the issue of import access rights byagricultural exporters of developing countries whoare restricted on grounds of phyto-sanitaryregulations in developed countries. It is importantthat scientific phyto-sanitary standards are esta-blished at the international level so as to preventprotectionist measures by developed countries onthis plea.
TENTH FIVE YEAR PLAN 2002-07
124
4.108 Some of these concerns have been givendue cognizance at the Doha Ministerial Meet byWTO in November 2001. The Declaration commitsto comprehensive negotiations for improvement inmarket access for developing countries along withphasing out of all forms of export subsidies andother domestic support being given by developedcountries. The development needs of countries likeIndia, including food security and rural developmenthave been taken note of. The issue of trade andenvironment and the aspects impinging on agricul-ture, however, met with limited success in thenegotiations. There is continued need for negotia-tions prior to the Mexico Ministerial Meet, apart fromthe requirement of implementation by India on hercommitment from 2004.
4.109 It is important that steps are taken to reapbenefits of a liberalised trade regime throughincreased efficiency in agriculture and combatrestriction by developed countries arising fromsanitary and phyto-sanitary measures. Efficiencywould be greatly enhanced with increased invest-ments and land reforms. Also, diversification ofagricultural production into agro-foods, horticultureand floriculture products and farm products withmaintenance of international quality standards,along with application of sanitary and phyto-sanitarymeasures could help to increase exports from thissector.
Trade Related Intellectual Property Rights(TRIPs)
4.110 The agreement on Trade - Related Intell-ectual Property Rights was introduced in the WTOagreements and includes protection throughexclusive rights to provide returns for undertakinginnovation. At the same time, balance is ensuredbetween the interest of the innovator on the onehand and the users on the other. It is supposed tocontribute to the promotion of technologicalinnovation and also dissemination to the mutualadvantage of producers and users of the knowledgeand to promote social and economic welfare. Theagreement covers copyrights, trademarks, geogra-phical indications, industrial designs, patents, layout designs of integrated circuits and undisclosed
information. The implementation of TRIPs is throughprescribed laws and regulations and the membersare obliged to ensure that their laws commit effectiveaction in their infringement.
Issues of Concern
4.111 Developing countries like India, which areinvariably technology seekers, face difficulties intheir commercial dealings with technology holdersin developed countries. Apart from market imper-fections, these developing countries have inade-quate experience and skill in finalising appropriatelegal arrangements for acquisition of technology.Technology transfers of crucial scientific deve-lopments to the third world have been constraineddue to the protection given by the intellectualproperty rights.
4.112 The declaration on the TRIPs agreementand public health recognises the gravity of the publichealth problems afflicting the developing countries.The WTO members have a right to formulate theirpublic health policies. It is important also to notethat technological development of new medicinesshould be transmitted to developing countries topromote the development of manufacturingcapacities of pharmaceuticals, without restrainingpolicies on access to medications. Emphasis hasbeen on ensuring the accessibility of pharma-ceuticals and medical treatments used to treatpandemics such as HIV/AIDS, Malaria, TB, etc., aswell as their affordability for all, in accordance withinternational law.
4.113 It has been suggested that even thoughexclusive rights conferred by patents provideincentive for further investment in R&D of new andeffective medicines, the exclusive rights in case oflife-threatening diseases should be treated sepa-rately at a different level. There is need to ensureaccess to medicines for such diseases at affordablerates to the vast majority of the population,particularly in countries where the per capita incomeis low and per capita expenditure on health isabysmally small. The Doha Declaration made acategorical statement on TRIPs and public healthand emphasized the rights of WTO members to

EXTERNAL SECTOR DIMENSIONS
125
protect public health and to promote access tomedicines for all.
4.114 The impact of the far reaching changes inTRIPs needs to be carefully examined in regard topublic health in India as improvement in the healthstatus of the population has been one of the majorthrust areas in social development programmes ofIndia. Technological improvements and increasedaccess to health care have resulted in steep fall inmortality but disease burden due to communicablediseases and non-communicable diseases andnutritional problems continue to be high. Inspite ofthe fact that norms for creation of infrastructure andmanpower are similar throughout the country, thereare substantial differences between States anddistricts in availability and utilisation of health careservices and health indices of the population. A re-evaluation of the problem of health and impact ofthe Declaration under TRIPs needs to be done inthe Tenth Plan.
4.115 One way of increasing access to medi-cines in poor countries is through differential pricingof drugs in the developed and developing countries.Some major companies are already pricing theirproducts in such a manner. However, more wide-spread and sustainable differential pricing can bemade feasible provided a right legal, technical andpolitical environment is secured. The most impor-tant aspect is to recognise the importance ofrespecting the balance found in the negotiations ofthe TRIPs Agreement and the rights of thedeveloping countries to use the flexibility in it, inregard to compulsory licensing and parallel importsto respond to health concerns. TRIPs Agreementis also not against segmenting of the marketsthrough the prohibition of parallel imports. However,adequate provision has to be made for enhancedR&D efforts in India.
4.116 Traditional Medicine (TM) plays a crucialrole in health-care or serves the health needs of avast majority of people in developing countries.Access to ‘modern’ health care services andmedicine may be limited in developing countries.TM thus becomes the only affordable treatmentavailable to poor people and in remote communities.
The protection of TM under intellectual propertyrights (IPRs) raises some issues, the most importantbeing the extent to which it is feasible to protect theexisting IPR system. Certain aspects of TM maybe covered by patents or other IPRs. There havebeen many proposals to develop sui generissystems of protection. Such proposals are basedon the logic that if innovators in the ‘formal’ systemof innovation receive compensation through IPRs,holders of traditional knowledge should be similarlytreated.
4.117 The grant of patents on non-originalinnovations (particularly those linked to traditionalmedicines), which are based on what is already apart of the traditional knowledge of the developingworld have been causing a great concern to thedeveloping world. The governments in the thirdworld as well as members of public are rightlyconcerned about the grant of patents for non-original inventions in the traditional knowledgesystems of the developing world. At theinternational level there is a significant degree ofsupport for opposing the grant of patents on non-original inventions. In fact, a mechanism has beenproposed for disclosure of the source of origin ofbiological material used in invention and obtainingthe consent of the country of origin. At the sametime, dissemination of knowledge along with patentrights for seed diversity is crucial for developingcountries like India where such a large populationis dependent on agriculture for their livelihood. TheDoha Ministerial Declaration took cognisance ofthe compatibility between TRIPs and theconvention on bio-diversity during its review of theTRIPs agreement.
4.118 On the domestic front, it is important torecognise the need to urgently implement productpatenting in India. Detailed documentation oftraditional knowledge areas is required to beundertaken at the earliest. Measures have alreadybeen initiated for setting up of the ‘TraditionalKnowledge Digital Library’ by the Council forScientific and Industrial Research. We need toensure that when an overseas product is based onIndian resources and Indian medicinal knowledge,India’s rights must be protected. Therefore, there

TENTH FIVE YEAR PLAN 2002-07
126
is need for a separate government body for (i)facilitating Indian patents abroad, (ii) preventingforeign companies from getting exclusive marketingrights and patents on items of Indian origin, (iii)improved information dissemination to avoidexploitation of Indian consumers particularly ofpharmaceutical products and farmers, (iv) betterdispute settlement mechanism in consultation withlawyers, scientists and historians, and (v) improvedbio-diversity through organised institutions andmonitoring of seed economy.
Trade Related Investment Measures, theMultilateral Agreement on Investment and theSingapore Issues
4.119 The agreement on Trade RelatedInvestment Measures mainly applies to trade ofgoods that take place via Transnational Corpora-tions (TNCs). The agreement aimed to protectconditions applied by an enterprise, like purchaseor use of products of domestic origin, volume orvalue of products and minimum percentage of localproduction, purchase or use of imported products,export conditions, etc. Similarly, restrictions imposedby host countries on foreign investment were alsobrought under the purview of this agreement.TRIMs does not cover foreign equity participationin industries and the issue of channeling of invest-ment to particular areas. The agreement does notcover restrictions by government using exportperformance requirements. The government isexpected to have similar trade policies for foreignand domestic companies.
4.120 The developing countries invite TNCs toaugment availability of capital and technology. The‘performance clauses’ had been added to checktheir effectiveness. This had led to conflict, as anappropriate code of conduct for TNCs and hostcountries had not been arrived at. It was againstthis background that this agreement was introducedin the WTO to combat the problem that had arisendue to large number of countries having imposedrestrictions on foreign investment and trade in goodstaking place through TNCs. However, since controlson the operations of the TNCs were required to beremoved under this agreement, it has been felt that
developing countries may not be in a position todirect their operations to critical areas requiringtechnological and financial support, withoutadversely affecting foreign exchange flows. Theimportance of FDI in developing countries cannotbe undermined but selectivity of investment flowscontinues to be relevant as may be learnt from theforeign investment policy of China (vis-à-vis policiesof some of the African and even Latin- Americancountries).
4.121 Since the establishment of the WTOcertain members have been trying to introduce non-trade issues into its agenda. At the First MinisterialConference in 1996 at Singapore, members like EUand Japan pushed the inclusion of Investment andCompetition Policy in the agenda in order to havemultilateral set of rules on these issues. At Singa-pore the developing countries, with India in the lead,managed to limit the work on Investment andCompetition Policy to the establishment of WorkingGroups on Trade and Investment and a WorkingGroup on Trade and Competition Policy. These twoissues, along with Trade Facilitation and Trans-parency in government procurement have come tobe known as Singapore issues.
4.122 The Organisation for Economic Coopera-tion and Development introduced the MultilateralAgreement on Investment to provide betteropportunities for investment by TNCs, althoughthere was no consensus on the issues. The OECDinitiative covers all direct investment transactions,whether by non-resident enterprises or by domesticenterprises under foreign control. Three funda-mental principles form the basis of the OECDinstruments, viz. right of entry and establishment,national treatment, and freedom of repatriation, bothon capital and current accounts, with the ultimateobjective of progressive liberalisation of policies tobe carried out by member countries in respect offoreign investment. It was propounded that it willprovide the requisite transparency, predictability andlegal security to foreign investment.
4.123 The Doha Ministerial Conference decidedto start negotiations on the MAI and other Singa-pore issues once a consensus (on the issue of

EXTERNAL SECTOR DIMENSIONS
127
negotiations) is reached in the fifth session of theMinisterial Conference. On the basis of the decision,by explicit consensus on the modalities, actualnegotiations will begin. However, a number of issuesare of concern for developing countries like India,which need to be addressed prior to actual negotia-tions. Some of these are discussed here.
Issues of Concern
4.124 This agreement has important implicationsfor the developmental objectives that the hostcountry may want to address while inviting foreigninvestment and negotiating the multilateralagreement. The developing countries feel the needfor selective and judicious intervention of thegovernment to support domestic industry andtechnology creation so as to ensure a level playingfield for domestic enterprises. These developingcountries also employ an appropriate mix of incen-tives and performance requirements for foreigninvestment to achieve specific developmentalobjectives. The responsibilities of the MNCs needto be addressed and also prevent imposition of traderestrictive clauses on their subsidiaries. It is in thisbackground that the important features of MAI needto be looked into in greater detail and view theproposed agreement of bringing the world under alegally secure, non-discriminatory and stable regimefor foreign investment. In any case, it is essentialto recognise that the multilateral framework cannotguarantee an increase in FDI inflows, although itcould impact the quality of the inflows.
4.125 The treaty seeks to adopt a compre-hensive asset-based definition of investment asopposed to the enterprises-based one, i.e., it coversall forms of assets, which are recognised and alsothe evolving forms of investment. Specifically,investment has been defined as ‘every kind of assetowned or controlled, directly or indirectly, by aninvestor’, while the investor is the natural or legalperson of a contracting party. Thus, investmentwould cover, not just equity capital, but also portfolioinvestment, debt capital, monetary and financialtransactions, and every form of tangible andintangible assets including intellectual propertyrights, licences and authorisations. It is this wide
definition of ‘investment’ that has been contested.The other major issue of concern under the MAI isregarding performance requirements and invest-ment incentives. The proposed treaty aims to gofar beyond the restrictions on performance require-ments under the TRIMs agreement of the WTO.The treaty prohibits a wide range of performancerequirements totally even if they apply equally todomestic and foreign investors.
4.126 As far as the issue of privatisation of firmsin host countries is concerned, the agreement aimsto apply national treatment and the most favourednation principle at all stages of the privatisationprocess. The agreement does not prohibit govern-ment-designated monopolies provided the rules ofnon-discrimination in their sales and purchasesprevail. The problem is regarding handling disputesettlements, particularly that relating to investor toState disputes, State to State disputes, etc. Theinvestor could have an option to file the dispute inthe national courts or international arbitration. Thiswould have implications on the rules chosen forarbitration, which could be rules operational in thehost or parent country or even other internationalbodies. At the same time, the State (of the hostcountry) would have no option but to go by thenational legal remedies. These are also contentiousissues that require negotiations.
4.127 Further, in case of the new MAI framework,it is likely that the flexibility available to us, underbilateral investment protection agreements, is takenaway. In the next two years, we need to think interms of (a) the possible impact of an MAI ondifferent sectors; (b) status of the Indian economyin regard to the relation between trade andinvestment and trade and technology transfer;(c) existence or devising of new policy instrumentsor legislation to protect certain high priority areas;(d) to ensure a level playing field for domesticindustry and (e) to provide enabling legislations torein in the multinationals when their conduct iscontrary to national objectives. This is possible inview of the emphasis in the Declaration that accountshould be taken, as appropriate, of the existingbilateral and regional arrangements in investment.In India such agreements are based on a model

TENTH FIVE YEAR PLAN 2002-07
128
code, devised and approved after careful consi-derations.
4.128 Similarly, the issues relating to Trade andCompetition have wide ranging implications. TheWorking Group has been concentrating on princi-ples of transparency, non-discrimination andprocedural fairness and provisions for hardcorecartels. Negotiations on multilateral competitionagreement could commence after a consensus isreached after the 2003 Ministerial. There has beenconsiderable exploitation due to monopoly powerof major TNCs and the price fixation mechanism.The issue of anti-competitive pricing by TNCs andthat of mobility and tradability of factors of productionlike labour, needs to be taken up as it relates toclarification of core principles, including transpa-rency, non-discrimination and procedural fairness,and provisions on cartels. Strengthening of theinternational competition law needs to be precededby strengthening of domestic competition law andregulatory framework. India and many otherdeveloping countries are required to introduce sucha system domestically. At the same time, legalreforms in governance of factor market, particularlylabour market is essential.
4.129 As far as the proposed changes in theissue of ‘government procurement’ is concerned,greater transparency in assessment of alternativeinvestments in a fair manner would greatly enhanceefficiency and help development in the developingcountries. Fundamental changes are expected inthe Indian and world economies within the periodof the Tenth Plan where competition, productivityand efficiency will determine the place of a countryin the comity of nations. In recent times, whileanalyzing the productivity of investment, leakagesor corruption has been identified as a retardingfactor in the development process. The DohaDeclaration, focusing on transparency in govern-ment procurement seems to be backed by thisconsideration. Already there is a plurilateralagreement and a Working Group is working on thisissue. During its working, the group has identifiedand analysed a number of principles of transparencyand due process in procurement. These includedefinition and scope of government procurement,
transparencies of decisions on qualification andcontract awards, etc. Of these elements significantdifferences have remained on several key elements,including, in particular, scope and coverage of atransparency agreement and application of WTODispute Settlement Procedures to such a possibleagreement. As the discussions in the WorkingGroup on this subject have sought to tread on manymarket access related issues, developing countriesare concerned that the real intention appears to beto extend the market access in future. However,according national treatment to all tendering partiesmay not be acceptable to developing countries likeIndia, as preference would have to be given todomestic suppliers.
4.130 In India, government procurement proce-dures are in accordance with technical specificationsand no details are revealed on the system ofselection of tenders. Although there is a felt needfor following standardised and transparentprocedures, there is no unanimity on the exactimplementation and review method. In fact, it isfelt that developed countries should be preventedfrom using transparency principle as a means ofsecuring market access on grounds of social anddevelopment needs. At the same time, an improvedand transparent government procurement systemis required for our economy.
4.131 Trade facilitation came on the work progra-mme to undertake exploratory and analytical work,drawing on the work of other relevant internationalorganisations, on the simplification of trade proce-dures in order to assess the scope for WTO rulesin this area. Most of the trade facilitation proposalsrelated to customs procedures while some were alsorelated to transport, payment, insurance and otherfinancial requirements. The process of negotiationon trade facilitation is also likely to commence afterthe Mexico ministerial in 2003. The agreement isexpected to modernise and standardise customsprocedures and facilitate movement and clearanceof goods. The Doha Declaration on trade facilitationcarries the objective of Article 8 of GATT regardingthe desirability of reducing formalities in tradetransactions by reducing customs and otherprocedures and enhancing movement, release and

EXTERNAL SECTOR DIMENSIONS
129
clearance of goods. As the transaction cost in Indianexports are quite significant, it is essential toimplement reforms in these areas on an urgentbasis. This would help our export promotion effortsonce improved procedures are established.
4.132 Emphasis needs to be given to measuresthat ensure economic growth and development withtrade. Inclusion of these issues, taking develop-mental concerns of LDCs, should be given duecognisance which would help to streamline the flowof multilateral investments into these LDCs. Onthe one hand, it would give access to foreigninvestors in a transparent framework and get legalprotection, while, on the other, it would give greaterconfidence to the host country players to takemaximum benefit in terms of financial support andtechnological development from TNCs. The TradeRelated Committee on Investments of the WTO hasbeen monitoring the notifications for relaxation bymember countries. At the same time, negotiationson the labour market front are essential and couldensure that LDCs get improved working conditionsfor their skilled/unskilled workers abroad.
Trade and Environment and Related Issues
4.133 In line with increased international concernfor issues relating to preservation of globalenvironment, the multilateral environmentagreements (MEA) are being brought in as part ofthe agreements on international trade. A harmo-nised code of conduct is being introduced to achieveuniversal conservation of the environment, as perglobal standards. In this case an important distinc-tion has been suggested between environmentalproblems that are basically domestic, as againstthose that are inherently international in nature. Thelatter involves physical spillovers across nationalborders. It is these intrinsically internationalenvironmental problems that are related to tradeissues, although domestic environmental problemsare also related to trade through the operations oftransnational production activities. Due to theseissues, need has been felt for neutralising environ-mental externalities through use of appropriatetaxes, subsidies and transfers. As part of the DohaDeclaration, it has been mandated to have
negotiations on limited aspects of trade andenvironment, viz., relating to WTO rules and tradeobligations, procedures for exchange of informationbetween MEA and WTO, and reduction/eliminationof tariff and non-tariff barriers to environmentalgoods and services.
4.134 The multilateral Agreement on Environ-ment addresses protection of human, animal andplant life. Here, all governmental and non-govern-mental bodies that set standards are required toabide by the ‘Code of Good Practice for the Prepara-tion, Adoption and Application of Standards’, whichstates that national standards must be based oninternational norms. An exception is made wherethe international standards are ‘ineffective’ or‘inappropriate’, or where the national standards areused to pursue ‘protection of human health or safety,animal or plant life or health, or the environment’.However, it is suggested that exceptions tointernational standards must be least trade-restrictive and must be supported by availablescientific and technical information.
4.135 Additionally, the agreement aims toestablish universal risk assessment criteria in settingpesticide residue levels and other health standardsfound in environmental laws. The proposed criteriarequire that the standards for risks to human healthbe offset by balancing the economic benefits of theharmful activity. The agreement has implicationsfor maintaining appropriate labour standards,including child labour in developing countries. Theset of minimum standards proposed includefreedom of association, collective bargaining, prohi-bition of forced labour, elimination of exploitativechild labour and non-discrimination. Here the terms‘unfair’, ‘exploitation’ and ‘forced’ are not preciselydefined but reflect basic human rights and standardsto stimulate economic development in the interestof all workers and countries.
4.136 The agreement on Technical Barriers toTrade accords protection to developing countriesagainst prescriptions on technical regulations forproducts which could sometimes work asunreasonable barriers to trade. The basic principlesprescribe that the regulations should not be more

TENTH FIVE YEAR PLAN 2002-07
130
trade restrictive than necessary to fulfill legitimateobjectives of the government based on security,health or environment. The regulations areprescribed in terms of performance of the productrather than design or descriptive characteristics andare to be non-discriminatory among members. Theagreement encourages adoption of internationalstandards. It also requires a high degree of transpa-rency in preparation and administration of technicalregulations and standards in the industrialisedcountries.
Issues of Concern
4.137 It has been felt that trade is basically aimedat exploiting markets whereas preservation ofenvironment is traditionally outside its purview.Need was felt for an objective harmonisation andsearch for compatibility between the interests of thetrading system and environmental protection.Although, steps were taken to harmonise cross-country intra-industry environmental standards,these are being questioned. A particular country’spreferred environmental choices and solutions, (sayby setting up appropriate pollution standards andtaxes) could be very different from that of anothercountry. There are differences in endowments andtechnology across countries, and different costs ofpollution abatement relative to income and consu-mption levels. Forcing the poor country to spendas much on abatement to improve its tradeprospects could reduce its welfare substantially.There is continued need to encourage and promoteimproved standards rather than have drasticsanctions.
4.138 It has been felt that no universal agree-ment on minimum labour standards can be outlinedfrom the fact that prevailing labour standards in aparticular society are lower than those of another,thereby implying that the former is engaging in‘unfair’ practices or is exploiting its labour. There isdifference in values which leads to differences inlabour standards. Also, consumers indicate theirpreferences through the market and thus changethe prevailing labour standards in their country.Using labour conditions in developing countries toimpose trade restrictions, is considered unfair and
somewhat harsh. It is felt that this does not call forimposing protectionist measures/trade sanctions bythe developed countries.
4.139 The work programme adopted at Dohaclearly indicates that negotiations on environmentwill begin soon, notwithstanding the opposition fromdeveloping countries including India. The negotia-tions on trade and environment will concentrate onthe relationship between existing WTO rules andtrade obligations contained in multilateral environ-ment agreements (MEAs) and reduction orelimination of tariffs and non-tariff barriers toenvironmental goods and services. The workprogramme of the Committee on Trade and Environ-ment will evaluate the effect of environmentalmeasures on market access, the relevant provisionsof TRIPs and labeling requirements for environ-mental purposes. These, along with the applicationof the sanitary and phyto-sanitary measures, willcreate a strict and environment friendly regimehaving far reaching impact on trade of developingcountries like India. As exports of these countriesare already affected by the application ofprecautionary principles and other environmentalmeasures including eco-labeling requirements,necessary steps would be required in upgradingquality control, consistent with the emergingenvironment regime.
4.140 The transparency requirement on groundsof market access accords the right to the developedcountries to be able to intervene in various opera-tions and regulations in developing countries. Incase a new technical regulation is introduced by amember country, public notice is required to beissued and cognisance taken of comments offeredby other members. A code of good practice forpreparation, adoption and application of standardshas been suggested to member countries and themeasures are drafted in a way to protect their tradeinterests.
4.141 On the domestic front, it is important toestablish set procedures for international anddomestic trade, taking into consideration improvedhealth and environment standards. The qualitycontrol mechanism could be strengthened as per

EXTERNAL SECTOR DIMENSIONS
131
requirements of our major export markets in theUS, EU and other countries. Industry could also begiven incentives for enhancing R&D expenditure todevelop environmentally sound technologies andpractices.
General Agreement on Trade in Services
4.142 GATS is the first set of multilateral legallyenforceable rules covering international trade inservices. It covers trade in services in terms of crossborder supply of services like internationaltelephony; tourism and education abroad; banking,legal advice and communication; and movementof natural persons. The GATS covers all servicesbased on a positive list, and the aim is toprogressively liberalise trade in services, within theexisting architecture of GATS. The membercountries are required to schedule specificcommitments under the agreements. The objectiveof the GATS negotiations is to achieve progressivelyhigher levels of liberalisation so as to promoteeconomic growth amongst trading partners anddevelopment of developing countries. The overallbalance of rights and obligations has beenemphasised through market access to promoteinterest of all participants. The participation ofdeveloping countries in trade and services has beengiven special priority. Focus has been on sectorsand modes of supply of export interest to thedeveloping countries.
4.143 The Council for Trade in Services (CTS)carries out an assessment of trade in services inoverall terms and on sectoral basis with referenceto the objectives of GATS. The servicesnegotiations are conducted in special sessions ofthe CTS, which in turn is required to report to theGeneral Council on a regular basis. Specificschedules of commitments by individual membercountries have been drawn out which form the basisfor the negotiations. Appropriate flexibility has beenprovided for developing country members foropening fewer sectors, liberalise fewer types oftransactions, progressively extending marketaccess in line with their development situation. Itwas decided that the process of progressiveliberalisation should be advanced in each sub-round
through bilateral, plurilateral or multilateralnegotiations directed towards increasing the generallevel of specific commitments undertaken by themembers.
4.144 The sectors inscribed in the individualschedules are required to be accorded treatmentthat is no less favourable than accorded to itsown like services and service suppliers, i.e., theschedules are subjected to ‘national treatment’.The members are allowed to modify and withdrawany commitment in its schedule at any time afterthree years have elapsed from the date on whichthe commitment came into force, after suitablynotifying to the CTS. India has indicated aschedule of specific commitments whereby thelimitations on market access and nationaltreatment is outlined. These relate toprofessional services, computer and relatedservices, R&D services, communication services,audio-visual services, construction and relatedengineering services, financial services, andother business services.
4.145 The Doha Declaration took cognisance ofthe proposals on various sectors, includingmovement of natural persons. Negotiations havebeen carried out between member countries oncommitments for services and environment,movement of natural persons, financial services,maritime transport services, basic telecommunica-tions and professional services. The Committeesare to decide on the scope for further liberalisationof these services. The Committee on ProfessionalServices is in the process of examining measuresto ensure that the qualification requirement andprocedures, technical standards and licensingrequirements do not constitute unnecessary barriersto trade.
Issues of Concern
4.146 It is the implementation of some of theseissues, which are of concern to developing countrieslike India. Movement of natural persons has beenrestricted by many of the developed countries. Indiahas the advantage in movement of professional andcomputer services, as it has a large reservoir of

TENTH FIVE YEAR PLAN 2002-07
132
highly skilled and experienced professionals likelawyers, chartered accountants, cost accountants,company secretaries, computer and electronicsbased scientists/technicians, information tech-nology/communications, scientists/technicians,engineers, doctors, etc. The barriers to high levelof movement have constrained expansion of tradein technical and non-technical services from India.The requirement of the CTS to undertake constantconsultation and cooperation with the UN and itsspecialised agencies has been limited. Further,GATS is silent on the issue of down-market unskilledworkers like construction workers, labour, etc.There is need to negotiate trade of these servicesfor such workers going abroad. There is scope alsofor promoting greater upmarket skills for higherearnings. Further, standardisation and harmoni-sation of requisite qualifications and experience ofworkers moving to the developed countries is calledfor. Requirements of local competency or localcertification (e.g. medical boards) should not beused as non-tariff barriers.
4.147 It is important to note that, for India, thesectors where market access, particularly forprofessionals is relevant, include health, software,construction and engineering, accountancy, audio-visual, tourism and architecture. India has also toidentify the sectors where it may assume commit-ments on market access in the negotiations. At thesame time, there is need to spur active thinking onwidening our negotiating initiatives in other modes(besides the mode 4 relating to movement of naturalpersons) of delivery of services. Commercialpresence and cross-border supply are nowgradually gaining importance in terms of India’scapability.
4.148 On the domestic front, there is need for aregulatory mechanism, based on objective andtransparent criteria, so that competence and abilityto supply services is given due cognisance. Theuse of international standards needs to be furtherencouraged. There is need to improve the level ofour professional institutions so as to raise it to theinternational standards. In addition, it may bementioned that a demographic shift has beenobserved in developed countries where the ratio of
working population has witnessed a decline;therefore, supply of skilled manpower/services fromdeveloping countries to developed countries maybe negotiated suitably.
4.149 Another step needed is supplying moreinformation to service providers in foreign marketswith a view to exploiting emerging opportunities.Data and information on services is very importantfor both WTO negotiations and tapping the exportpotential for services. In this context, the Committeeon International Trade in Services set up by theDepartment of Commerce has given concretesuggestions to improve the data collection process,which require to be implemented.
4.150 It is quite evident that a defensive positionin WTO negotiations is no longer appropriate. Indiawill have to take a more proactive and aggressiveposition on a number of emerging issues byproposing its own drafts. A few areas in which suchpositions can be taken are readily identifiable:Multilateral Agreement on Investment, trade inenvironmental goods, General Agreement on Tradein Services, and even on labour standards.
REGIONAL TRADING ARRANGEMENTS
4.151 With increased globalisation, there hasbeen a proliferation of a number of regional tradingblocks for economic cooperation within regions andacross regions. There are around 15 regional blocksand an estimated 42 per cent of world trade iscarried out through the preferential trade operations.The tariff rates within these blocks are usuallysignificantly lower to the most favoured nation(MFN) rates required to be offered to all membersof the WTO. There is thus an apprehension thatIndia may be at a serious disadvantage in exportingto the dominant markets within these blocks. Itneeds to be noted, however, that the extent of dis-advantage depends upon the differential betweenthe MFN tariff rates and the preferential rate for anygiven product. In the case of most developedcountry markets, these differentials are fairly smallexcept in the case of a few products in which thereare tariff peaks, such as agricultural goods, textilesand clothing. Even in these cases, the effect may

EXTERNAL SECTOR DIMENSIONS
133
not be particularly substantial at present becauseof supply-side limitations on our part for mostagricultural products and the operation of the Multi-Fibre Agreement (MFA) for textiles and clothing. Inthe future, however, as our agro-export potentialimproves and the MFA gets phased out, the negativeeffects may become considerable.
4.152 It would, therefore, appear desirable thata comprehensive strategy to mitigate the effects ofregional trading arrangements be evolved. In doingso, however, it needs to be borne in mind that underthe WTO, preferential tariff areas are expected tohave a common set of tariffs such that the tariffrate on any product is equal to or less than thelowest rate prevailing in any member country priorto the formation of the block. This continues toremain relevant in the context of India joining oneor more of the existing trade blocks, even thoughthe Indian tariff rates are gradually being broughtdown to East Asian levels.
4.153 India is a member of the South AsianAssociation for Regional Cooperation (SAARC),which has very low level of intra-regional trade. Theexports from India to the SAARC region constitutearound 4.5 per cent of the total, while imports are alittle over 1 per cent. It is important to emphasisedevelopment of regional initiatives in trade andinvestment since it is crucial for building on thepotential synergies that are available in the SouthAsian region. It has been suggested that thepossible gains from liberalisation of trade within theSAARC region are substantial and with very littlerisk. The main export items from India to theSAARC countries include cotton fabrics, sugar, rice,wheat, machinery, transport equipment, drugs and
pharmaceuticals, rubber products, chemicals, steel,plastic products, etc. There is even greater potentialfor non-traded products such as power, transportand water resources. The potential of these itemsneed to be explored during the Tenth Five Year Planwith greater vigour.
4.154 During the past few years, there has beenefforts to upgrade India’s ties with the countries ofthe Association of South East Asian Nations(ASEAN). India has substantial trade with thisregion, constituting 7.9 per cent of our exports and8.5 per cent of our imports. The main items of exportin this trade include oil meals, groundnut, sugar,vegetables, wheat, rice, meat and its preparations,drugs and pharmaceuticals, plastic products, steel,machinery items, electronics, gems and jewellery,etc. The main import items are vegetable oils, woodand wood products, yarn and fabrics, electronicgoods, machinery, chemicals, etc. There is scopeto integrate software exports from India to the SouthEast Asian countries, with the expertise in thecomputer hardware, apart from support in the formof communications, roads, ports and power. Intra-regional trade arrangements with these countrieswould facilitate industrial development and tradewith the rest of the world. India should also activelyparticipate in the regional grouping of the Bangla-desh, India, Mayanmar, Sri Lanka, ThailandEconomic Cooperation (BIMSTEC) to promoteregional cooperation in trade and investment in theregion. However, the process should be initiatedcautiously in view of the fact that average tariff ratesin the ASEAN region are around 10-15 per cent,while tariffs are only expected to be brought downin India to around 18 per cent by the end of theTenth Plan.

TENTH FIVE YEAR PLAN 2002-07
134
Annexure 4.1
Export Projections for Tenth Plan
(US $ million)
S.No. Sector 2001-02 2006-07 Total
1 Paddy & Rice 618.93 1085.09 4389.01
2 Wheat 289.01 383.76 1718.56
3 Other Cereals 74.37 98.75 442.22
4 Pulses 78.35 90.00 426.04
5 Jute 1.75 2.01 9.51
6 Cotton 6.16 7.08 33.52
7 Tea and Coffee 568.23 868.66 3691.60
8 Rubber 15.26 20.27 90.77
9 Other Crops 461.71 613.09 2745.55
10 Animal Husbandry 344.43 631.54 2514.31
11 Forestry and Logging 265.61 290.44 1401.67
12 Fishing 1357.18 2074.74 8817.12
13 Coal & Lignite 42.18 56.01 250.82
14 Iron Ore 327.60 376.32 1781.46
15 Other Metallic Minerals 137.65 200.86 868.35
16 Non Metallic Minor Minerals 369.95 491.25 2199.90
17 Sugar 515.23 863.32 3548.90
18 Edible Oils 179.52 206.21 976.20
19 Other Food & Beverages 1585.42 2656.53 10920.29
20 Cotton Textiles 2183.74 4004.04 15940.96
21 Woolen Textiles 50.04 71.34 311.08
22 Silk Textiles 267.86 381.82 1665.04
23 Art. Silk & Synthetic Fibres 406.78 579.85 2528.63
24 Jute Hemp Mesta Textiles 92.12 154.36 634.52
25 Readymade Garments 5253.59 10070.60 39474.29
26 Other Textiles 2798.52 3989.18 17396.10
27 Wood & Wood Products 33.51 56.16 230.84
28 Paper & Paper Products 255.81 339.69 1521.18
29 Leather & Leather Products 1549.53 2261.14 9775.19
30 Rubber Products 1074.88 1532.20 6681.66
31 Plastic Products 384.45 644.18 2648.07

EXTERNAL SECTOR DIMENSIONS
135
32 Petroleum Products 1757.80 4550.74 16121.44
33 Fertilisers 6.23 7.15 33.86
34 Pesticides 255.13 293.06 1387.34
35 Synthetic Fibre & Resins 430.03 824.32 3231.12
36 Paints, Drugs & Cosmetics 1951.10 4082.97 15527.30
37 Other Chemicals 2134.62 4467.00 16987.75
38 Cement 77.22 110.07 479.99
39 Other Non-Metallic Minerals 6042.49 12644.80 48087.43
40 Iron & Steel 2041.90 3914.12 15342.38
41 Non-ferrous Metals 1662.82 2661.85 11123.89
42 Tractor & other Agricultural Machinery 44.39 63.27 275.93
43 Other Non-Electrical Machinery 1199.74 2299.78 9014.56
44 Electrical Machinery 961.40 2011.88 7651.05
45 Comm. & Electronic Equipment 791.30 1729.18 6479.94
46 Rail Equipment 50.41 71.86 313.38
47 Motor Vehicles 512.56 730.63 3186.16
48 Motorcycles,Scooters & Bicycles 112.63 160.55 700.15
49 Other Transport Equipment 294.39 419.64 1829.96
50 Other Manufacturing 2999.48 4275.64 18645.33
Total 44915.00 80419.00 322863.13
Annexure 4.1 Contd.
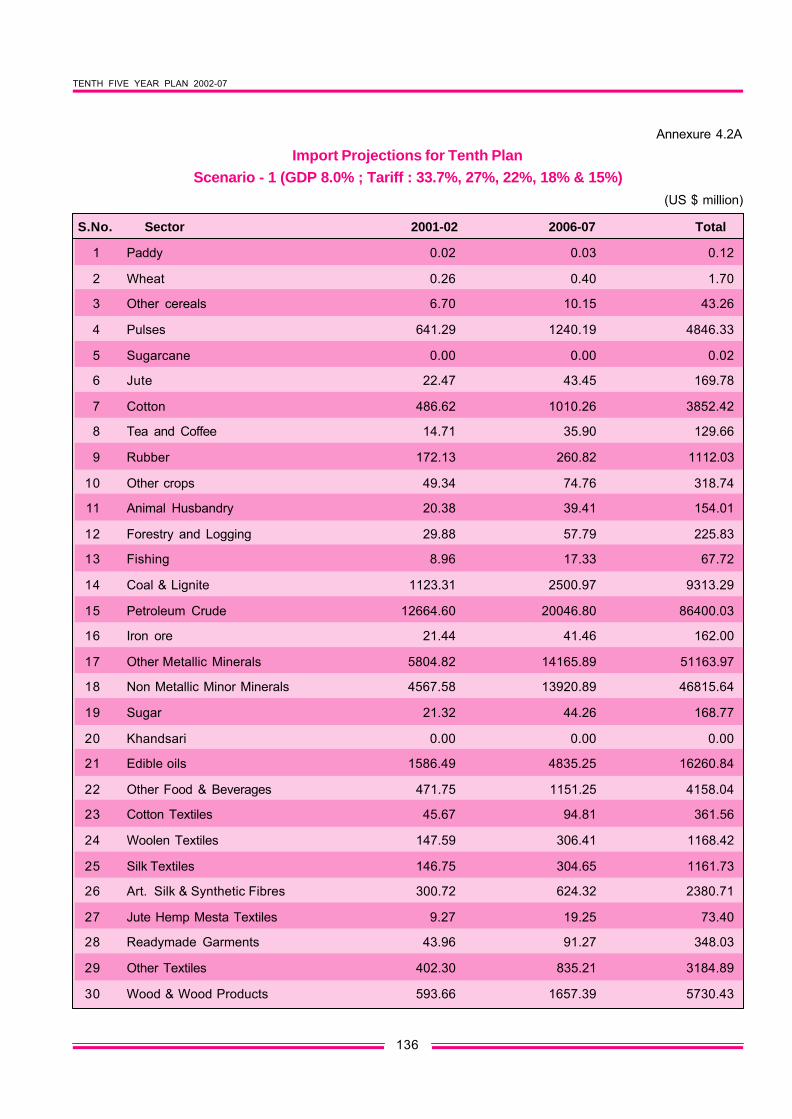
TENTH FIVE YEAR PLAN 2002-07
136
Annexure 4.2A
Import Projections for Tenth PlanScenario - 1 (GDP 8.0% ; Tariff : 33.7%, 27%, 22%, 18% & 15%)
(US $ million)
S.No. Sector 2001-02 2006-07 Total
1 Paddy 0.02 0.03 0.12
2 Wheat 0.26 0.40 1.70
3 Other cereals 6.70 10.15 43.26
4 Pulses 641.29 1240.19 4846.33
5 Sugarcane 0.00 0.00 0.02
6 Jute 22.47 43.45 169.78
7 Cotton 486.62 1010.26 3852.42
8 Tea and Coffee 14.71 35.90 129.66
9 Rubber 172.13 260.82 1112.03
10 Other crops 49.34 74.76 318.74
11 Animal Husbandry 20.38 39.41 154.01
12 Forestry and Logging 29.88 57.79 225.83
13 Fishing 8.96 17.33 67.72
14 Coal & Lignite 1123.31 2500.97 9313.29
15 Petroleum Crude 12664.60 20046.80 86400.03
16 Iron ore 21.44 41.46 162.00
17 Other Metallic Minerals 5804.82 14165.89 51163.97
18 Non Metallic Minor Minerals 4567.58 13920.89 46815.64
19 Sugar 21.32 44.26 168.77
20 Khandsari 0.00 0.00 0.00
21 Edible oils 1586.49 4835.25 16260.84
22 Other Food & Beverages 471.75 1151.25 4158.04
23 Cotton Textiles 45.67 94.81 361.56
24 Woolen Textiles 147.59 306.41 1168.42
25 Silk Textiles 146.75 304.65 1161.73
26 Art. Silk & Synthetic Fibres 300.72 624.32 2380.71
27 Jute Hemp Mesta Textiles 9.27 19.25 73.40
28 Readymade Garments 43.96 91.27 348.03
29 Other Textiles 402.30 835.21 3184.89
30 Wood & Wood Products 593.66 1657.39 5730.43

EXTERNAL SECTOR DIMENSIONS
137
31 Paper & Paper Products 978.77 2179.18 8114.95
32 Leather & Leather Products 235.47 574.63 2075.44
33 Rubber Products 129.87 251.15 981.44
34 Plastic Products 264.13 548.35 2091.01
35 Petroleum Products 1407.02 2240.77 9381.72
36 Fertilisers 524.95 1115.66 4220.49
37 Pesticides 84.55 179.68 679.72
38 Synthetic Fibre & Resins 485.60 1185.05 4280.12
39 Paints, Drugs & Cosmetics 601.32 1338.79 4985.49
40 Other Chemicals 3649.87 9746.74 34183.70
41 Cement 2.51 5.58 20.79
42 Other Non-Metallic Minerals 356.96 832.22 3051.62
43 Iron & Steel 1396.73 2899.70 11057.43
44 Non-ferrous Metals 925.30 1789.46 6992.70
45 Tractor & other Agricultural Machinery 11.55 28.20 101.84
46 Other Non-Electrical Machinery 3495.70 8530.78 30811.26
47 Electrical Machinery 2025.83 5409.85 18973.37
48 Comm. & Electronic Equipment 3033.90 11439.28 36054.12
49 Rail Equipment 13.27 27.54 105.03
50 Motor Vehicles 915.67 1900.98 7248.99
51 Motorcycles,Scooters & Bicycles 0.32 0.66 2.53
52 Other Transport Equipment 4549.01 9444.01 36012.85
53 Other Manufacturing 3125.71 6959.19 25915.10
Total 57618.00 132058.00 487003.33
Annexure 4.2A Contd.
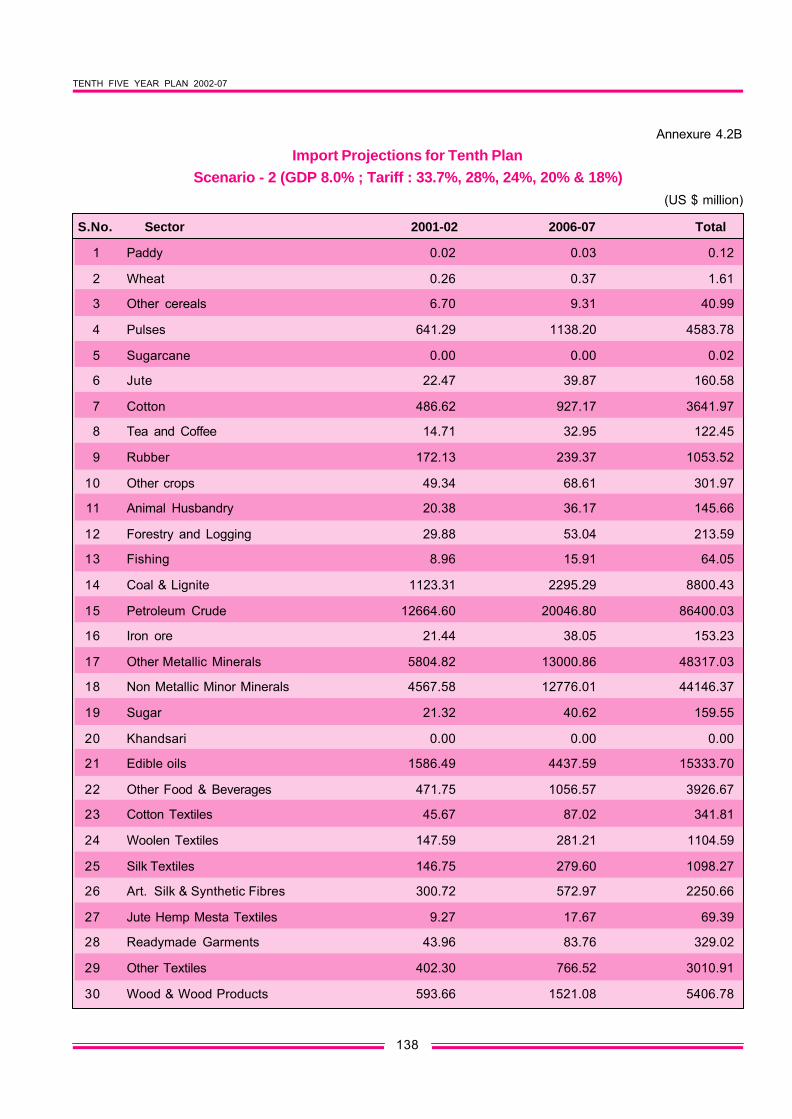
TENTH FIVE YEAR PLAN 2002-07
138
Annexure 4.2B
Import Projections for Tenth PlanScenario - 2 (GDP 8.0% ; Tariff : 33.7%, 28%, 24%, 20% & 18%)
(US $ million)
S.No. Sector 2001-02 2006-07 Total
1 Paddy 0.02 0.03 0.12
2 Wheat 0.26 0.37 1.61
3 Other cereals 6.70 9.31 40.99
4 Pulses 641.29 1138.20 4583.78
5 Sugarcane 0.00 0.00 0.02
6 Jute 22.47 39.87 160.58
7 Cotton 486.62 927.17 3641.97
8 Tea and Coffee 14.71 32.95 122.45
9 Rubber 172.13 239.37 1053.52
10 Other crops 49.34 68.61 301.97
11 Animal Husbandry 20.38 36.17 145.66
12 Forestry and Logging 29.88 53.04 213.59
13 Fishing 8.96 15.91 64.05
14 Coal & Lignite 1123.31 2295.29 8800.43
15 Petroleum Crude 12664.60 20046.80 86400.03
16 Iron ore 21.44 38.05 153.23
17 Other Metallic Minerals 5804.82 13000.86 48317.03
18 Non Metallic Minor Minerals 4567.58 12776.01 44146.37
19 Sugar 21.32 40.62 159.55
20 Khandsari 0.00 0.00 0.00
21 Edible oils 1586.49 4437.59 15333.70
22 Other Food & Beverages 471.75 1056.57 3926.67
23 Cotton Textiles 45.67 87.02 341.81
24 Woolen Textiles 147.59 281.21 1104.59
25 Silk Textiles 146.75 279.60 1098.27
26 Art. Silk & Synthetic Fibres 300.72 572.97 2250.66
27 Jute Hemp Mesta Textiles 9.27 17.67 69.39
28 Readymade Garments 43.96 83.76 329.02
29 Other Textiles 402.30 766.52 3010.91
30 Wood & Wood Products 593.66 1521.08 5406.78

EXTERNAL SECTOR DIMENSIONS
139
31 Paper & Paper Products 978.77 1999.96 7668.08
32 Leather & Leather Products 235.47 527.37 1959.96
33 Rubber Products 129.87 230.50 928.27
34 Plastic Products 264.13 503.25 1976.79
35 Petroleum Products 1407.02 2056.48 8885.13
36 Fertilisers 524.95 1023.91 3989.32
37 Pesticides 84.55 164.90 642.49
38 Synthetic Fibre & Resins 485.60 1087.59 4041.96
39 Paints, Drugs & Cosmetics 601.32 1228.69 4710.95
40 Other Chemicals 3649.87 8945.15 32262.45
41 Cement 2.51 5.12 19.64
42 Other non-metallic Minerals 356.96 763.78 2882.69
43 Iron & Steel 1396.73 2661.22 10453.40
44 Non-ferrous Metals 925.30 1642.29 6613.87
45 Tractor & other Agricultural Machinery 11.55 25.88 96.17
46 Other Non-Electrical Machinery 3495.70 7829.20 29096.81
47 Electrical Machinery 2025.83 4964.93 17906.99
48 Comm. & Electronic Equipment 3033.90 10498.49 33952.20
49 Rail Equipment 13.27 25.28 99.29
50 Motor Vehicles 915.67 1744.64 6853.00
51 Motorcycles,Scooters & Bicycles 0.32 0.61 2.39
52 Other Transport Equipment 4549.01 8667.32 34045.60
53 Other Manufacturing 3125.71 6386.86 24488.00
Total 57618.00 122846.00 464214.06
Annexure 4.2B Contd.

TENTH FIVE YEAR PLAN 2002-07
140