external end-of-project evaluation: urban …pdf.usaid.gov/pdf_docs/pdacr703.pdfexternal...
TRANSCRIPT

External End-of-Project Evaluation: Urban Agriculture Program for HIV/AIDS Affected Women and Children
Final Report
July 2008
This publication was produced for review by the United States Agency for International Development/Ethiopia. It was prepared by The Mitchell Group under Contract No. 663-C-00-08-00409-00

This document was submitted by The Mitchell Group, Inc. 1816 11TH Street, NW
Washington, DC 20001, USA Telephone: (202) 745-1919 Facsimile: (202) 234-1697
To
The United States Agency for International Development/Ethiopia under
USAID Contract 663-C-00-08-00409-00
Disclaimer: The authors’ views expressed in this publication do not necessarily reflect the views of the U.S. Agency for International Development or the United States Government.

The Urban Agriculture Program for HIV/AIDS Affected Women and Children
July 1, 2004 – June 30, 2008
Implementer: Development Alternatives Inc. (DAI), San Diego Total project funding: USD $ 2,185,654
(Picture taken in Bahir Dar)
Evaluation Contractor: The Mitchell Group, Washington DC Team leader: Ms. Annemarie Hoogendoorn
Team member: Ms. Kyung Endres
June 2008

i
Recommended citation: Hoogendoorn, Annemarie and Endres Kyung. The Urban Agriculture Program for HIV/AIDS Affected Women and Children: End of Project Evaluation. Addis Ababa, Ethiopia. The Mitchell Group, June 2008. The authors of this report would like to thank the DAI/ECIAfrica staff and all their implementing partners who so graciously met with us, facilitated site visits and presented their projects to us in Addis Ababa, Adama, and Bahir Dar. A special thanks also goes out to representatives of Family Health International, Project Concern International, World Food Programme, FAO, UNAIDS, HAPCO and USAID/Ethiopia for sharing information, perspectives and advice with the researchers. Warm appreciation goes out to all of the project beneficiaries who met with us to discuss their experiences. We wish you the best of luck with your future endeavors.

ii
TABLE OF CONTENTS
I. INTRODUCTION..................................................................................................................... 1
SPREAD OF HIV IN ETHIOPIA .............................................................................................. 1 HIV RESPONSE PROGRAMS IN ETHIOPIA......................................................................... 1
II. THE DEVELOPMENT PROBLEM AND USAID’S RESPONSE..................................... 2
PROBLEM STATEMENT......................................................................................................... 2 THEORY OF THE INTERVENTION....................................................................................... 4
The Home Nutrition Garden Approach................................................................................................................4 HIV/AIDS and Household Food Security and Nutrition Model ...........................................................................4
III. EVALUATION PURPOSE ................................................................................................... 6 IV. EVALUTION DESIGN AND METHODOLOGIES .......................................................... 6
TEAM COMPOSITION AND TIME PLANNING................................................................... 6 METHODOLOGY ..................................................................................................................... 7 DIETARY DIVERSITY............................................................................................................. 7
V. FINDINGS ................................................................................................................................ 8
ORGANIZATIONAL SET-UP AND PERFORMANCE.......................................................... 8
At the Global Level ..............................................................................................................................................8 At the National / Regional Level ..........................................................................................................................8 At Implementing Partners Level...........................................................................................................................9
TARGETING............................................................................................................................ 10
Geographical Coverage .....................................................................................................................................10 Beneficiary Selection..........................................................................................................................................10 Garden Sites Selection .......................................................................................................................................11
IMPACT EVALUATION ........................................................................................................ 12
Inputs .................................................................................................................................................................12 Outputs & Outcomes..........................................................................................................................................15 Unintended Impacts ...........................................................................................................................................18 Cross-Cutting Issues ..........................................................................................................................................18
COST EFFICIENCY ................................................................................................................ 19

iii
SUSTAINABILITY.................................................................................................................. 20 LINKAGES TO OTHER SERVICES...................................................................................... 23
Links with Other PEPFAR Contractual Partners ..............................................................................................23 Links with GoE...................................................................................................................................................23 Links with UN Agencies .....................................................................................................................................24
CAPACITY BUILDING .......................................................................................................... 24 MONITORING AND EVALUATION .................................................................................... 24
Baseline Study and Mid-Term Learning Assessment Executed in 2005.............................................................24 Performance / Progress Monitoring Plans (PMPs)...........................................................................................25
V. LESSONS LEARNED ........................................................................................................... 26
IMPACT EVALUATION ........................................................................................................ 26
Inputs, Outputs & Outcomes ..............................................................................................................................26 SUSTAINABILITY.................................................................................................................. 27 MONITORING AND EVALUATION .................................................................................... 27
VI. APPENDICES....................................................................................................................... 27
FIGURES AND TABLES Figure 1 Ethiopia Adult Prevalence HIV by Region 1Figure 2 The Impact of HIV/AIDS on Household Food Security and Nutrition 5Figure 3 Ecological, Social and Economic Types of Urban Agriculture 5Figure 2 Disaggregation by Beneficiary Type 10Figure 3 Percent of Beneficiaries Trained 13Figure 4 Household Consumption Patterns 14Table 7 Household Vegetable Use per Month of Gardening 16Figure 8 Average Household Income from Vegetable Sales & Kg Sold 17Figure 5 Replicated Garden Plot 18Figure 6 Beneficiary Gender Distribution 19 Table 1 Region and City Beneficiary Targets by Implementation Phase 3Table 2 Summary of Project Goal, Purposes and Outcomes (Phase I to III) 4Table 3 Household Consumption Patterns 15Table 1 Household Vegetable Use per Month of Gardening 16
APPENDICES

iv
Appendix A Scope of Work Appendix B Contact List Appendix C Summary of Implementation Plan Appendix D References Appendix E Beneficiary Targets and Achievements Appendix F Questionnaires Appendix G IP Coverage Table Appendix H Key Informant Background Appendix I Project Monitoring Data Appendix J Capital Investments Appendix K Beneficiary List of Training Components Appendix L Beneficiary Income Generating Activities

v
ACRONYMS AIDS Acquired Immuno Deficiency Syndrome AMAP Accelerated Microenterprise Advancement Project (USAID) ART Anti Retroviral Therapy B Birr (9.57B = $US1) BDS Business Development Services (USAID) CHBC Community Home Based Care CTO Cognizant Technical Officer (USAID) CVDA Common Vision for Development Association (NGO) DAI Development Alternatives Inc. DHS Demographic Health Survey EDA Emmanuel Development Organization (NGO) FANTa Food and Nutrition Technical Assistance FAO Food and Agricultural Organization (UN agency) FGAE Family Guidance Association of Ethiopia (NGO) FHI Family Health International (NGO) GAA German Agro Action (NGO) GoE Government of Ethiopia HAPCO HIV/AIDS Prevention and Control Office HAPSCO HIV/AIDS Prevention Care and Support Organization (NGO) HBC Home-Based Care HH Household HIV Human Immuno Virus HNG Household Nutrition Garden IFPRI International Food and Policy Research Institute IGA Income Generating Activity IP Implementing Partner IQC Indefinite Quantity Contract ISAPSO Integrated Service for AIDS Prevention & Support Organization (NGO) M&E Monitoring & Evaluation MENA Mekdem Ethiopia National Association (NGO) MoH Ministry of Health NGO Non Governmental Organization OSSA Organization for Social Services for AIDS (NGO) OVC Orphans and Vulnerable Children PC3 Positive Change: Communities and Care (PEPFAR program) PCI Project Concern International (NGO) PEPFAR President’s Emergency Plan for AIDS Relief PICDO Progress Integrated Community Development Organization (NGO) PLHIV People Living With HIV/AIDS PMP Performance / Progress Monitoring Plan PMTCT Prevention of Mother-to-Child Transmission SC-US Save the Children Fund – USA (NGO) SNNPR Southern Nations and Nationalities and Peoples´ Region SOW Scope of Work

vi
STTA Short-Term Technical Assistance SWDA Social Welfare Development Association (NGO) TA Technical Assistance TB Tuberculosis TMDIA Tana Medhanialem Integrated Development Association (NGO) TMG The Mitchell Group ToT Training of Trainers TP Technical Partner UA Urban Agriculture U.S. United States USAID United States Agency for International Development WeSMCO Welfare for the Street Mothers and Children Organization (NGO) WFP World Food Program (UN agency)

vii
EXECUTIVE SUMMARY The end-of-project evaluation of the Urban Agriculture (UA) Program in Ethiopia, commissioned by USAID/Ethiopia to TMG Washington DC, was a mission to Ethiopia from May 29th up to June 13th 2008. The aim was to assess achievements, impacts and challenges in reaching the three program objectives: (a) improvement of nutritional status of HIV/AIDS affected families; (b) improvement of income levels for these families; and (c) improvement of skills and alternative livelihoods. The UA program is part of the U.S. response package for Ethiopia that includes substantial PEPFAR funding. Program duration was from July 1st 2004 up to June 30th 2008, with a total budget of US$ 2,185,654 for a planned coverage of 15,000 households in five main cities (42% in Addis Ababa, 19% in Bahir Dar, the rest in Gondar, Dessie, Adama and Awassa). A preventive approach that aims to avoid poor urban women turning to sex work has been combined with a care and support approach aimed at orphans and vulnerable children (OVCs) and people undergoing treatment. The program included back-yard and group gardens for the cultivation of vegetables. Organizational performance The UA program has been managed by a lean but strong ECIAfrica/Ethiopia office which received some administrative and technical guidance from DAI/Washington (the USAID contract partner) and ECIAfrica/Johannesburg. The program is well known among PEPFAR partners and other NGOs involved in food security. At field level, the program has been implemented through a network of 27 partners who nearly all have performed satisfactorily. The program is marked by strong field level contacts, both with local government offices, community-level organizations and beneficiary households. Over the course of the program, the high ground-level workload was reduced by halving the number of households to be covered per extension worker. Although in principle the beneficiaries are covered with training and supervision visits for a period of 1 year, there are many cases where the contact with the implementing agency is prolonged. Achievements Contrary to what was seen as a major potential constraint, the UA program has been able to resolve the problem of access to land for the program beneficiaries, although obviously land for cultivation is scarcer in more congested areas in the center of town. In general, land tenure security has not been a major issue. There are some cases where allotted land was later on taken by the city administration because they needed it for other purposes. The use of former waste dumps in Addis Ababa has had a positive impact on urban sanitation. Water and soil testing has been done for each of the locations to confirm suitability for vegetable growing. Becoming involved in nutrition gardening has had great psychosocial effects on the marginalized HIV/AIDS affected households. They were able to better take care of themselves by growing vegetables for home consumption and by earning some income through selling to people in the neighborhood, in markets and to businesses. Marketing generally has not been a problem, but better prices possibly could be fetched through improved market linkages and joint selling by groups of gardeners. Additional impacts within the realm of urban agriculture could be achieved through adding poultry keeping and other small livestock activities to future programs to increase revenue levels. The UA program has greatly reduced stigma and discrimination. Some

viii
self-replication of vegetable gardening has taken place by neighbors, and the urban agriculture approach has also been replicated by other NGOs and is being studied by WFP. Cost-Efficiency The overall cost of the intervention is US$ 145 per household served. Mid-way through the program the drip kits for irrigating 100 m2 and 30 m2 were procured locally which slightly increased costs, although they were still within acceptable ranges. The procurement costs for grow bags for use in backyard when there was no access to land were very minimal. Sustainability and linkages with other services The drip kit technology was found to be highly appropriate for the target groups and sustainable at least for 5 to 7 years. The grow bags that were used only lasted 1 or 2 harvests which indicates a need for a bag made of more durable material. The savings that beneficiaries were able to make are small, and do not allow for expansion of the gardens. But, nevertheless, urban gardens have helped households somewhat to get out of dire poverty. The program is rated as having sustainable impacts on household food and nutrition security. This could be further strengthened by ensuring continued technical backstopping of gardeners by Urban Agriculture Departments within the City Administrations and through linking up beneficiaries with microfinance institutions. Capacity building The four-tier Training-of-Trainers system that was adopted in the UA program is rated as efficient but possibly at the expense of effectiveness. While contact gardeners are regularly in touch with the extension workers and also receive some formal training on agronomy and the drip kit technology, this is not the case for the other ´regular´ beneficiary households who are mainly trained by talks and demonstrations at the garden plots. There is a need to improve training on practical nutrition (meal planning, food groups, food preparation, special needs for young children and sick people) and to focus more on business training. Monitoring & Evaluation At the end of the first phase of the UA program (July 1st 2004 – December 31st 2005), a Mid-Term Learning Assessment was undertaken that provided good insight into the socio-economic conditions of beneficiary households. Nutritional status has not been monitored apart from an indicator on the number of times per week that vegetables are consumed. The Performance Monitoring Plans for all three phases of the UA program are very elaborate but they miss an indicator on performance of the implementing partners and disaggregation on production of various types of vegetables. There is an overflow of household-level variables that forms a heavy burden for the extension workers responsible for collecting the data. In general, it is noted that the indicators are not always easily understood in relation to each other and they do not seem to be specifically geared to provision of input for further program planning purposes.

Page 1 of 27
I. INTRODUCTION
SPREAD OF HIV IN ETHIOPIA The latest Ethiopia Demographic Health Survey (2005) and results from the Government of Ethiopia (GoE) 2007 Single Point HIV Prevalence Estimate (GoE, 2007) demonstrate that the HIV/AIDS epidemic is stabilizing at a rather low national adult HIV prevalence rate of 1.4% (DHS, 2005) and 2.1% (GoE, 2007), respectively. The disease is found to be particularly common among women in urban areas (7.7%) while men in urban areas and
both men and women in rural areas show much lower prevalence rates1. The 2008 GoE estimate showed that the three regions with the highest overall HIV prevalence are Gambella (8.3% urban), Addis Ababa (7.5%) and Dire Dawa (4.2%). Sex workers have long been identified to be the ‘core group’ most at risk of both acquiring HIV and transmitting it, which stresses the need for gender sensitive prevention, treatment and care and support programs. In epidemiological studies uniformed services, truckers, refugees and displaced people, street children, daily laborers, students and other mobile populations have been identified as the other main
vulnerable groups in Ethiopia for contracting HIV/AIDS. Some key HIV/AIDS indicators extracted from the most recent GoE report on progress monitoring for implementation of the UN Declaration on HIV/AIDS (GoE, 2008) are:
• The total number of people living with HIV/AIDS (PLHIV) is 977,394 • Out of these, 258,264 PLHIV are estimated to be in need of treatment. • The total number of children orphaned by AIDS is estimated at 898,350.
HIV RESPONSE PROGRAMS IN ETHIOPIA The Multi-Sectoral Plan of Action for Universal Access to HIV Prevention, Treatment, Care and Support 2007 – 20102 that has been developed by the GoE’s HIV/AIDS 1 The 2005 Ethiopia Demographic Health Survey showed prevalence rates of 2.4% among men in urban areas, and 0.6% respectively 0.7% among women and men in rural areas. 2 See: http://www.etharc.org/publications/eth_multi_plan_action2007.pdf
Figure 7 Ethiopia Adult Prevalence HIV by Region (MoH/HAPCO, Single Point HIV Prevalence Estimate, June 2007)

Page 2 of 27
Prevention and Control Office (HAPCO) stresses attainment of universal access to HIV prevention, treatment, care and support3. There has been significant progress over the past years, with 265 ART sites throughout the country as of May 2007 attaining 37% coverage of all PLHIV in need of therapy. Ethiopia is one of the focus countries for the President’s Emergency Plan for AIDS Relief (PEPFAR), and funding levels are very substantial, leveraging additional funding from the Global Fund, wrap around USAID and other U.S. funding for Ethiopia. PEPFAR Ethiopia provides funding for a wide range of prevention, treatment and care and support interventions laid out in the PEPFAR Referral and Linkages Network. In its 2003-2008 HIV/AIDS Strategy, USAID/Ethiopia identified the need to address the underlying causes that lead to women being disproportionately infected and affected by HIV/AIDS if the impact of HIV/AIDS is to be successfully mitigated and the prevalence of HIV/AIDS reduced.
II. THE DEVELOPMENT PROBLEM AND USAID’S RESPONSE
PROBLEM STATEMENT Various poverty-related factors exacerbate the burden of HIV/AIDS for urban women in Ethiopia. A baseline assessment undertaken by Development Alternatives Inc (DAI) in November 2003 found that women in poor neighborhoods in Addis Ababa were characterized by limited income (US$ 1 per day on average), suboptimal nutritional and health status, very restricted investment resources, limited land or space around the homes, limited labor potential and little education/ practical training. The Ethiopia Household Nutrition Garden (HNG) USAID-Ethiopia task order to DAI under AMAP BDS IQC4 GEG-/I-00-02-00014-00 was awarded in April 2004 with the aim to establish vegetable gardens for low-income urban women who are affected by HIV/AIDS or who are at high risk of contracting HIV/AIDS. The program contributes to the achievement of USAID/Ethiopia’s Improved Family Health Strategic Objective, IR3 Reduced HIV/AIDS Prevalence and Increased Mitigation of the Impact of HIV/AIDS, and targets the types of beneficiaries covered under already existing USAID-funded HIV-related services implemented by Family Health International (FHI)5. The main rationale was that women in the target groups for the FHI program needed to increase their economic opportunities in order to avoid turning to high-risk professions such as sex work. The first program phase ran from July 1, 2004 - December 31, 2005 for 4,500 urban households in Addis Ababa and Bahir Dar with a task order ceiling of US$ 750,000. The program centered on the introduction of gardening systems that are low-
3 Treatment, care and support targets for 2010 of the Plan of Action include: 80% coverage with PMTCT (reaching 72,167 HIV positive pregnant women in 2010), increase of ART coverage from 32% in 2007 to 100% (397,000 people) in 2020, 1.68 million OVC receiving care and support by 2010, and 50% coverage of PLHIV (560,000 people) by care and support services in 2010. 4 AMAP BDS IQC stands for: Accelerated Microenterprise Advancement Project (AMAP) Business Development Services (BDS) Indefinite Quantity Contract (IQC). 5 From September 2001 to September 2006, FHI implemented the `IMPACT` program in Ethiopia which included 5 elements: a) Voluntary Counseling and Testing, b) TB/HIV care, c) Facility-based OI and non-ART care and support, d) Home and Community Based Care, and e) Support for referral systems and ART linkages.

Page 3 of 27
cost and require less labor input. Combined with appropriate training, organization and market linkages, the urban gardening systems were meant to generate food for household consumption as well as a significant surplus for income generation. The proposal was modeled on a successful project run by DAI in Zimbabwe on micro-irrigation for small scale horticulture in rural, peri-urban and urban areas in Zimbabwe. In the light of the rapidly expanding PEPFAR program in Ethiopia, the program description for the task order was expanded in September 2005, with an increase of the task order ceiling by US$ 700,000 and a shift of the completion date to September 30, 2007. This modification allowed DAI to build on the pilot results, to increase coverage in Addis Ababa and Bahir Dar and to add new urban centers (Gondar and Dessie in Amhara Region, Adama in Oromiya and Awassa in SNNPR). It was expected that by the end of the program period, 11,000 households would have been reached and at least 45,000 persons serviced. The revised Scope of Work (SOW) called for three cross-cutting themes: Gender, Stigma and Community, and for compliance with PEPFAR Ethiopia reporting systems and the use of PEPFAR indicators for OVC and PLHIV Care and Support Programs. In September 2006, the revised Technical Proposal for Project Extension was approved, leading to Modification 2 (Phase III; October 1st 2007 – June 30th 2008’) of the Urban Agriculture program. This entailed a revised SOW, extension of the task order by 9 months, and an increase in the task order ceiling amount to a total of US$ 2,185,664. The revised SOW had a total beneficiary target of 15,000 households and put particular emphasis on reaching female and orphan-headed households. The expansion was to take place within the same urban areas as targeted in Phase II and the project retained the same goal, purposes, and outcomes as in Phase II. The contractor was to work with other PEPFAR/Ethiopia partners for referral linkages for OVCs support and other HIV/AIDS prevention, care and treatment services. Appendix C provides an overview of the work plans for the three phases of the program. Table 1 Region and City Beneficiary Targets by Implementation Phase. DAI, May 2008 Region City Phase
I July ´04 – Dec ´05
Phase II
Jan ´06 – June ´07
Phase III
July ´07 – June ´08
Total
No. HHs
No. IPs
No. HHs
No. IPs
No. HHs
No. IPs
HHs
Addis Ababa
Addis Ababa 3,100 5 2,500 6 752 6 6,352
Amhara Bahir Dar 1,400 2 1,000 3 730 3 3,130 Gondar - - 400 2 560 2 960 Dessie - - 600 4 1040 4 1,640 Oromiya Adama - - 1,000 3 558 4 1,558 SNNPR Awassa - - 1,000 4 360 4 1,360 Total 4,500 7 6,500 22 4,000 23 15,000 The program aim is to achieve at least three crop cycles of fresh vegetables per year, with an average yield of 200 kg per household per year. Due to the extreme poverty of the families and very small plot sizes, the initial goal of the program was to enhance “income-in-kind” in terms of higher quantity and quality of food consumed by the family. As a secondary but important objective the program was meant to increase households’

Page 4 of 27
cash income through the sale of produce. The program was to have positive environmental impact through composting of animal manure and household refuse. Table 2 Summary of Project Goal, Purposes and Outcomes (Phase I to III) [Table is taken from Draft SOW for the End-of-Project Evaluation, May 31, 2008.] Project Goal/Highest level result
Contribute towards reduced incidence, prevalence and impact of HIV/AIDS on infected and affected women, men, girls and boys in Ethiopia.
Project Purpose
• Improve nutritional status of HIV/AIDS affected and infected women and their families including OVC.
• Improve average HH income of beneficiaries from the sale of vegetables.
• Improve support to HIV-infected and affected individuals, HHs and communities.
Outcomes • Increased number of women affected and infected by HIV/AIDS benefiting from the HH nutrition gardens.
• Increased number of OVC benefiting from the HH nutrition gardens.
• Increased number of individuals reached with HIV/AIDS related prevention, care and treatment services through a referral linkage system between the project and respective service providers.
• Increased number of OVC that receive care and support.
THEORY OF THE INTERVENTION
The Home Nutrition Garden Approach Starting up HNGs – small, intensively cultivated garden plots near the home – was seen as a sound option for enhanced household income among poor urban women in Ethiopia. The hypothesis behind the program was that adoption of simple micro-irrigation and gardening technologies would greatly reduce labor, water6 and land requirements for horticulture and therefore would be appropriate for use in poor congested neighborhoods affected by HIV/AIDS. The Zimbabwe experience had revealed that good harvests could be achieved with this technology combined with low-cost organic fertilizers7. The original and consecutive program proposals all acknowledged that access to land could be a significant constraint in more congested urban areas. Availability of water and access to markets were seen as other potential threats to the successfulness of the program.
HIV/AIDS and Household Food Security and Nutrition Model
6 Micro-irrigation techniques require about 50% less water use than traditional gardening methods. 7 In Zimbabwe, the DAI-managed project (LEAD) had installed over 15,000 nutrition gardens, supporting at least 75,000 people, including 35,000 OVCs. These gardens are providing complete vegetable requirements of households, plus additional cash income of US$20 to US$120 per year.

Page 5 of 27
Already in 1999, FAO published an article with a comprehensive model of the direct and indirect impacts of HIV/AIDS on household food security and nutrition (Egal & Valstar,
1999) which serves very well as reference model for this program evaluation. The impact model highlights the cumulative effects of HIV/AIDS on reduced labor availability, decreased agricultural production, increased non-food expenses, shifts in time allocation patterns towards care and support of the infected person, and increased needs for health services, water and sanitation, domestic hygiene and nutrition. The diagram below is taken from a recent publication on Urban Agriculture (UA) (Veenhuizen, 2006). It shows that subsistence oriented urban agriculture can take the form of a social program for poverty alleviation and HIV/AIDS mitigation aimed at social inclusion and that it can function as a social safety net with both food security and nutrition objectives.
Figure 3 Ecological, Social and Economic Types of Urban Agriculture (Veenhuizen, 2006)
Figure 2 The Impact of HIV/AIDS on Household Food Security and Nutrition (Egal & Valstar, 1999)

Page 6 of 27
III. EVALUATION PURPOSE
The purpose of this external end-of-project evaluation of the Urban Agriculture Program in Ethiopia is to demonstrate program outcomes and to assess the program processes that led to these results. The evaluation will assess a) achievements, b) impact, and c) challenges for the project in addressing the above three objectives. The evaluation report will document lessons learned and best practices to inform follow-on activities. The evaluation will attempt to answer the following questions (listed in order of priority as given in the Scope of Work, see Appendix A): Key evaluation questions are: 1. Impact: Achievement of the three objectives of the program and on reduction of
stigma and discrimination? 2. Sustainability: Can the community continue and replicate such projects? 3. Program linkages to related services: Do links exist with treatment services and
home, community and facility-based HIV/AIDS care and support programs, and food/nutrition and other PEPFAR income generating activity (IGA) in the program areas?
4. Capacity Building: Has capacity improved for the community in terms of technical
know-how and community mobilization, and knowledge and skills improved in producing nutritious foods for the beneficiary households?
5. Monitoring and Evaluation: Is the M&E system functioning as a tool for planning
and management based on the mandated indicators? 6. Lessons Learned: How can project implementation improve in future?
IV. EVALUTION DESIGN AND METHODOLOGIES
TEAM COMPOSITION AND TIME PLANNING The evaluation was conducted by a team of two external international consultants assisted by a national logistics support sub-contractor. . The Team Leader is an expert in food and nutrition interventions for people living with HIV and had overall responsibility for the management of the mission and evaluation of the various phases of the program. The Team Member with a background in food security, public health and monitoring and evaluation undertook an evaluation of impacts achieved. The evaluation team carried out field work in Ethiopia from June 1 to 13, 2008, with visits to Addis Ababa, Adama and Bahir Dar. A list of persons contacted is attached as Appendix B. In addition to a round of meetings with stakeholders in Addis Ababa, the team met with representatives of 15 implementing partners (IPs) and undertook field

Page 7 of 27
work covering 5 IPs8. Sampling was done by the evaluators based on an overview of numbers of beneficiaries per IP and per type of garden size provided by ECIAfrica. The approach ensured sufficient coverage in Addis Ababa and Bahir Dar where most of the beneficiaries are found; Adama is a city that was added more recently to the program. Addition of other cities would have required too much travel time. At the end of the mission separate debriefings were held with USAID/Ethiopia and ECIAfrica.
METHODOLOGY The process evaluation has been based on scrutiny of all available program documentation, various publications on the HIV/AIDS problem and PEPFAR programs in Ethiopia, plus some background information on urban agriculture and technical reports on measuring nutrition impacts contained in Appendix D. A series of semi-structured interviews were held with key informants from ECIAfrica/Ethiopia and from selected organizations like some PEPFAR health partners, a USAID Food-for-Peace partner, FAO, WFP and UNAIDS. For the field work the evaluator started in every city with a group meeting with all IPs that are currently active, and then had separate meetings with the staff of the IP(s) selected for the field study in that city. Visits were paid to local government representatives (mayor, HAPCO, Urban Agriculture Department) and informal talks were held with program beneficiaries while visiting some garden sites. The main part of the impact evaluation consisted of field data collection (9 focus group discussions and 28 household interviews9 that were held at a total of 10 project sites). The household surveys, in Appendices E and F have concentrated on data collection on overall impacts (direct and indirect; intended or unintended) of the program as perceived by graduated beneficiaries10. The beneficiary households were also questioned on skills they have gained by participating in the program and on the impact of the current household situation with regards to diets, sources of income and expenditure patterns. It was intended that households would be graduated project beneficiaries who were no longer receiving support from the implementing partners. Due to time constraints and the unavailability of lists of project beneficiaries by site, it was not possible for the researchers to randomly select households to visit or to include in focus groups. Key informants were therefore selected by the implementing partners. Although the researchers requested to speak to people who were successful urban agriculturists and those who were having difficulties implementing the techniques, there is a high probability of selection bias. The IPs tended to select beneficiaries with whom they were still in contact. All results should therefore be interpreted with this bias in mind. The field study results were triangulated with available baseline and project monitoring data.
DIETARY DIVERSITY Dietary diversity is “the number of different food groups consumed over a given reference period”11. In the case of this evaluation the reference period was one week which was considered by the researcher to be more representative of actual consumption considering local fasting days. Dietary diversity is a significant proxy indicator as it is associated with birth weight, anthropometric status, and improved hemoglobin
8 The two team members travelled together and their field work covered the same 5 IPs. 9 The very limited sample size is due to the time constraints for this mission. 10 This Included important issues like stigma, discrimination and gender. 11 Swindale, A & Bilinsky, P. Household Dietary Diversity Score (HDDS) for Measurement of Household Food Access: Indicator Guide V2. FANTa. Washington, DC; Sep 2006.

Page 8 of 27
concentrations. FANTa (2006) states that, “A more diversified diet is highly correlated with such factors as caloric and protein adequacy, percentage of protein from animal sources (high quality protein), and household income. Even in very poor households, increased food expenditure resulting from additional income is associated with increased quantity and quality of the diet.” Dietary diversity scores range from 0 to 12, 12 being the most complete diversity of food intakes. Dietary diversity was measured and computed per the FANTa 2006 guidelines.
V. FINDINGS
ORGANIZATIONAL SET-UP AND PERFORMANCE According to the SoW, DAI/ECIAfrica was to manage all aspects of the program in Ethiopia and to provide specialized technical backstopping. The program was designed to build on FHI’s infrastructure in terms of project liaison with GoE and the Addis Ababa Municipality, and for access to potential IPs. An assessment of the strengths and weaknesses of the organizational set-up for the program revealed the following points:
At the Global Level DAI is US-based company with an IQC contract with USAID with previous experience with drip kit irrigation in Zimbabwe. ECIAfrica is a Johannesburg-based subcontractor to DAI. Awarding the urban agriculture grant to DAI actually proved to be difficult as within USAID funding mechanisms there was no allowance for this sort of constructions. The problem caused considerable delay in the release of funding for the first program year but was eventually solved by adding the ´grants under contracts´ clause. ECIAfrica/Johannesburg and DAI/Washington have provided technical assistance (TA) to ECIAfrica/Ethiopia on management, reporting and technical issues. The DAI/Washington involvement was at critical stages of the project (start, mid-term and end). The main involvement of the Johannesburg-based advisors was in the first months of Phase I. Afterwards their input consisted of 2 to 3 visits to Ethiopia per year, mainly for management, M&E and reporting support, and in the form of technical support missions12. The implementation of the recommendations within the technical reports has been rather limited up to now. It is therefore not clear whether the TA in Phases II and III has been useful for strengthening of the program. The baseline and mid-term learning assessments were done by a local consulting company and external experts sent from Johannesburg respectively. The quality of the reports is generally good.
At the National / Regional Level ECIAfrica/Ethiopia had a clear reporting line to the HIV/AIDS – Health Strategic Objective manager at USAID/Ethiopia, who acted as Cognizant Technical Officer (CTO) for the program. The frequent changes in CTOs (5 different persons over a 4-year period) and the fact that the CTOs mainly had a public health background have resulted in limited technical oversight by USAID/Ethiopia of the urban agriculture program.
12 A Land use study report was published in December ´05, reports on marketing studies date from April ´07 and April ´08.

Page 9 of 27
The Technical Proposal for Phase I mentioned that a Project Advisory Committee would be established, but this seems not to have been effectuated and is not mentioned in any program report. ECIAfrica/Ethiopia is a very lean organization with its head office in Addis Ababa and field offices in Bahir Dar, Adama and Awassa13. The program staff is seen to be rather small and in the last two phases has consisted of 1 program director, 7 supervisory trainers, 6 admin and other office staff, 1 cleaner and 2 drivers. Of the 7 supervisory trainers, 3 are based in Addis Ababa, 2 in Bahir Dar, 1 in Adama and 1 in Awassa. Three of the supervisory trainers also act as regional coordinator. The supervisory trainers are all well qualified for their job. Various IPs have remarked that the supervisory trainers are very active and that they spend about 90% of their time in the field with the IPs and their beneficiaries. No standard exists for the workload per supervisory trainer. From the overview of achieved coverage per phase of the program (Appendix G) it can be deduced that in the current Phase III the field offices had double the workload of their colleagues in Addis Ababa (about 800 beneficiaries of the program per supervisory trainer vs. about 400 beneficiaries in Addis). Finally it has been noted that hardly any staff turnover has taken place within ECIAfrica/Ethiopia.
At Implementing Partners Level Over the 4 years of program implementation, the partner network consisted of 27 IPs, of which 23 have been active in Phase III of the program. IP selection has been based on a system of advertizing in the newspaper. Nearly all of the selected IPs have proven to be capable of implementing the program well. It was noticed that there is very good working relationship between ECIAfrica/Ethiopia and its IPs. It was repeatedly stated by ECIAfrica/Ethiopia and IP staff that the urban agriculture network operates as a family in close partnership. At the start of the program, linking up with a network of local partners was seen as an efficient way to achieve sufficient outreach and to ensure sustainability after program funding came to an end. No specific urban agriculture network has been established to ensure sustainability of the relations and exchange of information among the IPs, so far the main contact moments have been the Annual IP meeting and the Vegetable Days, which are organized by most of the IPs to demonstrate their work. The strategy had each IP employ a dedicated Supervisory Trainer from ECIAfrica/Ethiopia, which facilitated long-term relationships building and also was helpful developing contacts with local external stakeholders like HAPCO and the Urban Agriculture Department. At the IP-level, the program in Phase I had set a clear standard of 1 extension worker per 400 beneficiary households, which was later on adjusted to 280 and then to 200 to reduce the workload for the extension workers14. Nonetheless, most of the IPs complained to the evaluators that the work load for the urban agriculture program is more than the extension worker can deal with. Often other IP staff has had to help them out (particularly for the quarterly monitoring exercise) which actually meant the urban agriculture program drew on other resources of the IP. Also it was repeatedly stated that the cash grant to the IPs was not sufficient to cover necessary administration expenses and that they could only operate by using overhead funds from other projects.
13 Awassa and Adama field offices were opened at the start of Phase II. 14 This reduction in workload per extension worker was covered by an increase in the cash grant to the IP, see section on cost efficiency.

Page 10 of 27
Within the program design, there is no system for follow-up of the graduates after the 1-year program. Some IPs were still found to be in touch with ex-beneficiaries, especially on the communal plots. Others have lost contact with the IP, e.g. the ones who got grow bags and only produced one or two harvests. Some graduated beneficiaries (especially the ones on bigger communal gardens who have been most successful in their vegetable production) have been linked to the technical experts of the Urban Agriculture Department, but this is not common in the program.
TARGETING
Geographical Coverage The urban agriculture program is operated in 6 urban areas spread over 4 regions in Ethiopia. A detailed overview of the IPs and achieved coverage over the total program period (July 2004 – June 2008) is attached as Appendix G. The overview shows that 42% of the served beneficiaries live in Addis Ababa, 19% in Bahir Dar, about 10% in each of the other cities Dessie, Adama and Awassa, and 7% in Gondar. There are no HIV/AIDS prevalence figures available at city level (apart from Addis Ababa where the rate is 7.7%), and thus it is not possible to assess whether the geographical targeting is in line with prevalence patterns within the country.
Beneficiary Selection It is very difficult for the evaluation team to assess whether beneficiary selection has focused on the (most) needy households affected by HIV/AIDS and is in line with the targeting of each program phases. The mission could only meet with very few beneficiary households. These households were selected by the IP and therefore by no means formed a representative sample. Nevertheless, the impression from the field work is that the program indeed has managed to reach many very poor households in congested urban or little developed peri-urban neighborhoods. The program can be described as having a preventive element (to avoid households turning to risky behavior) and a care and support element (various categories of households affected and/or infected with HIV/AIDS). The set of selection criteria works very well and is replicable in other urban agriculture programs. The motivation of the selected households for micro-irrigation was tested by having them first prepare the land and the seed beds before the drip kits were handed out. At entry into the program, a Beneficiary Registration Form was filled for each household to be stored in the database. In Phase II an effort was made to focus on households with OVCs, while in Phase III an additional focus was placed on households with a member undergoing HIV or TB treatment. The latter formed about 29% of Phase III household coverage, while the great
Total Number of Beneficiaries
1,610, 12%
1,719, 12%
7402, 53%
3126, 23%
Child headed HH (male) Child headed HH (female)Women headed HH Men headed HH
Figure 4 Disaggregation by Beneficiary Type (DAI, May 2008)

Page 11 of 27
majority of households were characterized as taking care of one or more OVCs (81% of the households).15 As can easily be gathered from the two coverage figures, the two categories are not mutually exclusive as a household can take care of an OVC and also have a person undergoing treatment. The lumping of households as per PEPFAR reporting categories, however important for monitoring of PEPFAR performance at national level, is thought to hamper detailed insight into which categories of households were assisted by the program. For all three phases together, 52% were individual backyard gardens, while 48% were group gardens.
Garden Sites Selection ECIAfrica has achieved very good working relationships with local GoE authorities like the mayor, kebele or city administration, HAPCO and the Urban Agriculture Department. This has greatly facilitated allocation of communal land for establishment of group gardens, both in the centers of town and in the peripheries. In all three cities that were visited (Addis, Bahir Dar and Adama) there seemed to be trend to move to the periphery of town where fallow land is still available to start vegetable gardening. In Bahir Dar it was noticed that some communal gardens are situated in swamp lands, which are not suitable for construction. The selection of these sites prohibits cultivation for at least 5 months per year, which substantially reduces the annual revenues for the beneficiary households (the majority have only one or two harvests per year, but as an innovation rice cultivation is being piloted in the major rainy season). Some garden sites in Addis Ababa are former waste dumps which first had to be cleaned, while others are found in `green city areas´ which the city administration designated for use as parks and for re-forestation. A logical question here is whether soil at former waste dumps will be safe enough for vegetable growing. Tests were undertaken in 2005 by the GoE Laboratory for Water and Soil Analysis. Some tests were also done when Adama and Awassa were added to the program during Phase II. ECIAfrica told the evaluation team that all sites were found to be suitable for vegetable growing16. No more testing has taken place for any of the new sites that since have been developed. But the quality of the soil and of groundwater in congested urban areas in Ethiopia simply cannot be taken for granted. Sanitation facilities
15 Coverage figures are taken from the Bi-Annual Report for the period October 1 2007 up to March 31st 2008. Figures from the Semi-Annual Report for the period October 1 2006 up to March 31sr 2007 (which fall within Phase II which ran from January 2005 up to end September 2007) are 48% of the households covered have a member undergoing treatment while 77% have one or more OVCs. 16 Especially one would like to know the contamination with faecal bacteria (E. Coli and the like) and the presence levels of heavy metals and other toxic agents. The test reports were not made available to the evaluators.

Page 12 of 27
generally are very scanty and household and industrial waste are often just dumped on open spaces in the vicinity.
IMPACT EVALUATION The impact evaluation collected beneficiary perspectives on project inputs, outputs and outcomes of the three program objectives. A description of key informants is found in Appendix H. DAI input and output indicators are listed in Appendix I. No outcome indicators were monitored or reported on. Due to the small scale of this project, global impact is not expected and was not measured. Because targets were set for very few of the indicators, determination on reaching benchmarks are largely qualitative. The project evaluation presents progress and attempts to justify why changes are acceptable outcomes.
Inputs
Capital Investments Key informants generated a list in Appendix J of the capital investments that were provided by implementing partners. Seeds or seedlings were given to all beneficiaries participating in the program. One of the implementing partners (IPs) we visited continued to provide seeds after the beneficiaries’ one-year graduation marker. The drip irrigation system was given to nearly all farmers with land as well but for in Bahir Dar where the
government provided flood land to use as communal gardens. Beneficiaries regularly expressed concern over the expected future loss of communal land. Beneficiaries were unfamiliar with drip irrigation before it had been introduced to them. The grow bags were often times a jumping off point used to introduce urban dwellers to urban gardening. Most of the project beneficiaries visited in Bahir Dar had started with grow bags and graduated to
garden plots. They felt the benefits produced by the grow bags warranted a greater investment in time and capital. This resulted in requests for additional space to grow food. Beneficiaries of two IPs used animals as a reward for hard work, which invigorated more people to work harder. Nine of the 28 beneficiaries interviewed were raising animals. Half had received animals through the program. Beneficiaries received an average of six chickens or one sheep. Others are raising chickens on their own, purchased either with their own savings or loans from the Women’s Association micro credit program.

Page 13 of 27
The initial capital investment is prohibitive for the target population before they enroll in the project. It was well understood by project beneficiaries that the financial support from the project would continue for a limited time. Many understood they would only receive financial support for one year. The psychological preparation of the beneficiaries for project completion has been very important. It encouraged beneficiaries to make the decision whether to continue gardening or to stop. All but one of the project beneficiaries interviewed in this study was still gardening. The one who stopped decided to use the space where she had grow bags to open a small shop. She felt it was better to have her garden as life was getting expensive and the shop was not lucrative. At least with the garden she could eat well.
Human Resource Development (Increased skills) Agriculture Both key respondents and focus groups discussions resulted in a similar list of agricultural training topics as elucidated below. None of the beneficiary lists contained all of the elements of the composite list contained in Appendix K. Training lasted anywhere from two days to one week. Beneficiaries identified training as taking place in classrooms and demonstration fields. Some beneficiaries reported that they were taken on site visits which they found very informative, interesting and motivating. Two informants received drip kits but no training and were no longer using the kits due to clogged pipes. Beneficiaries that received chicken also received training on how to feed and rear the chickens to maximize egg production and fattening. Some beneficiaries in Addis Ababa were trained by Ministry of Agriculture extension staff. Most were trained by the implementing partner extension staff. Two focus groups said that they were trained by lead farmers who had been trained by the IP and were responsible for training others. Only one focus group felt that the agricultural training was not helpful and they already knew what the trainers were teaching them. These same groups of beneficiaries did not receive drip kits. A few focus group beneficiaries reported receiving no training but they all received monitoring visits. This corresponds to Figure 5 Percent of Beneficiaries Trained data from DAI where 88% to 90% of beneficiaries received training. Agricultural training was not standardized across IPs. This is not a problem in and of itself. The problem occurs when some IPs are providing very useful training while others are not as thorough. It was evident from the home and communal gardens that people had knowledge of growing vegetables. People used the training to improve their standard of living by growing food for home consumption and sales. At the time of the study the
Figure 5 Percent of Beneficiaries Trained (DAI, May 2008)
0
1000
2000
3000
4000
5000
6000
Num
ber o
f Ben
efic
iarie
s
Phase-I Phase-II Phase-III
Beneficiaries Training Numbers
Trained Beneficiaries Untrained Beneficiaries
90%
89%
88%
90%
Percent Trained

Page 14 of 27
gardens were in the initial stages of the growing season but already appeared to be flourishing. Nutrition Very limited nutrition training was transferred to the beneficiaries. Beneficiaries receiving support from half of the IPs reported learning about food cleanliness and not overcooking to conserve vitamins and minerals. A limited few knew they needed to eat cooked foods so they didn’t risk illness and that vegetables helped you stay healthy especially if you are taking anti-retroviral medication. Many people who had not received any nutrition training through the program did mention the importance of vegetable consumption to maintain a balanced diet. People stated they were eating more vegetables than before they had gardens and those who had received nutrition messages were very receptive to implementing them in the household. No food preparation was observed due to the limited timeframe of the evaluation. Actual adoption of the messages can not be confirmed by this investigation. Business Business training was reported to consist of people being told to sell produce one could not consume at home. The Adama sites had more instruction on pricing and marketing. This training consisted of how to find clients through simple advertising and direct marketing to hotel restaurants. These beneficiaries also learned that pricing was to include all costs incurred including the cost of labor.
“Last year a lot of things were free – seeds, water, medicine. Now everything is on us. So this has made us put the price up. We used to beg for seeds. When they finished they told us to buy and pay for water. That’s why we made it expensive.”
- focus group participant Adama Some IPs were also promoting group and individual savings. Saving was new to the project beneficiaries. Most participants interviewed had been saving for only a few months. Everyone who was saving used the money for other non-regular expenses such as school fees for children, school supplies, loan repayment, and clothing. No one mentioned reinvesting in their gardens as a use for savings. Business training was generally non-existent. The more uneducated beneficiaries did not know the quantity of their harvests, how much they had spent on their gardens nor how much money they made.
Frequency of Vegetable & Protein Consumption
0
0.5
1
1.5
2
2.5
3
3.5
2005-10 2008-06
Evaluation Date
Days
per
Wee
k
vegetables protocon
Figure 6 Household Consumption Patterns (DAI, May 2008)

Page 15 of 27
Outputs & Outcomes
Improved Nutrition The nutritional output for this project has been the number of days vegetables were consumed by beneficiaries in a week as outlined in Table 3 Household Consumption Patterns The baseline evaluation stated that of the control group, only 12% consumed vegetables once or twice a week. This study found that 82% of key informants consumed vegetables once or twice a week.17 Beneficiaries self-reported eating vegetables once a week to once a month before having a garden. The midterm evaluation stated that project participants consumed vegetables an average of 2.86 times per week and proteins 0.22 times per week.18 The results of this study indicate that project beneficiaries consume vegetables an average of 3.07 times per week which corresponds to the DAI October 2007 to March 2008 semi-annual report and proteins 1.9 times per week (See Figure 6 Household Consumption Patterns.19) Beneficiaries reported eating a greater variety, quantity and quality of vegetables now than before they grew their own vegetables. People reported eating as much as they wanted as compared to before gardening when their children went to bed with empty stomachs. Table 3 Household Consumption Patterns (DAI, May 5008) % of households consuming
vegetables once or twice a week
No. of times per week vegetables are consumed
Midterm Evaluation 12% (control group) 2.86 Final Evaluation 82% (project participants) 3.07 Figure 8 Vegetable Use per Month of Gardening shows that average household production has been relatively stable over the life of the activity. An average of between 4.3 and 4.6 kg are produced per household for each month of gardening. Error! Reference source not found. clearly demonstrates that the proportion of vegetables consumed as a function of overall production has decreased from the mid-term learning assessment figure of 60% to 40%. Conversely the percentage of vegetables sold has increased from Phase I to Phase II. 17 Daystar Consult International. Urban Agriculture Program for HIV/AIDS Affected Women (UAPHAW) Baseline Survey Report. Addis Ababa, June 2005. 18 ECIAfrica. Mid-Term Learning Assessment of Urban Agriculture Program for HIV-Affected Women in Ethiopia Final Report. Oct 2005. 19 DAI. UAPHAW Whole Project life Indicators May 2008.xls
Phase-I Phase-II Phase-III
0.00
1.00
2.00
3.00
4.00
5.00
Kg
Household Vegetable Use Per Month of Gardening
Vegetables Sold Vegetables Consumed (HNG) Vegetables Produced
Figure 8 Vegetable Use per Month of Gardening (DAI, May 5008)

Page 16 of 27
Table 7 Household Vegetable Use per Month of Gardening (DAI, May 5008) Quantity of Vegetables (kg) Phase-I Phase-II Phase-III Sold 1.38 (31%) 1.94 (45%) 2.68 (57%) Consumed from HNG 2.95 (67%) 2.24 (52%) 1.86 (40%) Produced 4.38 4.28 4.69
The project did not monitor nutritional status. Collecting biological or anthropometric data was beyond the scope of this evaluation. This study used the proxy indicator of dietary diversity to gain some insights on how well people are eating. The average dietary diversity score of 3.8 was found for key informants. Scores ranged from 1.14 to 6.86. A 2004 study by the International Food Policy Research Institute (IFPRI) stated that dietary diversity for children aged 6-23 months was 2.2 in Ethiopia.20 This score is in the mid- range as compared to Columbia (4.8) and Mali (1.7) of the same study. The current dietary diversity score for the small sample size, which can not be confirmed as statistically significant in June 2008 was 3.8 which approaches the USAID standard target of 4.21 This result was not for children as in the IFPRI study but for households participating in the Urban Agriculture project. It is expected that dietary diversity would be higher for adults and older children than for toddlers. The qualitative outcomes of household nutrition are very touching. Focus group and household key informants expressed an overwhelming amount of gratitude to the implementing partner for saving their lives. Beneficiaries stressed the importance of good nutrition and their current ability to eat as much as they want and how their vegetable gardens help them to maintain balanced diets. Beneficiaries liked to eat all vegetables and are able to sell all the varieties they produced. Most respondents expressed delight at having a varied diet as a direct result of the garden.
“Now we eat more vegetables and varieties. We couldn’t think about it before, only shiro, always shiro…”
-Focus group participant Addis Ababa Kale was a favorite because it grows quickly and can be harvested for up to eight months using the same plant. Cauliflower was a preferred vegetable for sale as it fetches a god price, 20 B per head. Unfortunately cauliflower seeds were not available on the market at the time of this study.
Increased Income Key informants were asked about incomes from vegetable sales and other income generating activities. Nearly all beneficiaries, including children interviewed engage in multiple income generating activities listed in Appendix L. The household average salary from work outside of gardening, excluding the teachers and children, is approximately 500B per month. Income from vegetable sales varied widely depending on the size of the garden, the number of layers (chickens), the regular 20 Arimond, M. & Ruel, M. Dietary Diversity Is Associated with Child Nutritional Status: Evidence from 11 Demographic and Health Surveys. Food Consumption and Nutrition Division, International Food Policy Research Institute (IFPRI). Washington, DC 2006; J. Nutr. 134: 2579–2585, 2004. 21 AED Linkages Project. http://www.aednutritioncenter.org/results/complementary-feeding, downloaded 11 June, 2008.

Page 17 of 27
supply of water and the amount of time spent on cultivation. Most beneficiaries questioned did not know the amount of money, either gross or net, they earned from the sale of agricultural produce. People reported from 20 B to 125 B per month. The average household sold produce every other day and consumed vegetables every other day. As a general rule, key informants did not know the size of their land or the quantity of vegetables produced or sold. It was subsequently not possible to accurately calculate the value of production or sales based on the household surveys. The outcome from an increased income is generally considered to be a better standard of living. The project did not measure standard of living or any other income-related outcomes. For the purposes of this evaluation this measure is largely qualitative in nature and results vary greatly from one beneficiary to another. Key informants mentioned improved housing, the ability to purchase household necessities such as clothing, staple foods, electricity, and water, and to eat more balanced diets as a result of the income they earned. People saved what they would have spent on vegetables and used the money to make other purchases. As a result of inflation, rising demand, and decreased supplies vegetable prices increased greatly over the last year. An example of this is a bunch of kale sold for 1 B last year contained approximately 25 to 30 leaves as compared to 5 to 6 leaves this year. Although the quantity of vegetables sold per household increased from Phase II to Phase II, the average household income from vegetable sales dropped by 20B per month over the same period. During this time the price of vegetables has quadrupled to quintupled as evidenced by the price of kale. Beneficiaries who had been producing for more than three years felt that soil fertility had decreased in 2007-2008 and yields had subsequently decreased. The other main factor beneficiaries attributed to low production was the lack of water in the last year. The data do not support the beneficiary remarks that yields decreased. Respondents from household and focus groups unanimously felt that their supply could not satisfy demand. Beneficiaries felt that the reason for consistent demand was the high quality of their produce as compared to that found the market. Quality was described as fresh, clean and not sunburned. Given the increase in kilograms of sales and the unmet demand, household incomes from vegetable sales should not decrease. This phenomenon
Average Household Income From Vegetable Sales
3554.7840.8
2.681.38 1.94
0
10
20
30
40
50
60
Phase-I Phase-II Phase-III
Birr
/Mon
th
Average household income from sale of vegetablesVegetables Sold (kg)
Figure 9 Average Household Vegetable Sales & Kg Sold (DAI, May 2008)

Page 18 of 27
represented in Figure 9 Average Household Vegetable Sales & Kg Sold deserves investigation.
Unintended Impacts
Replication Upon seeing beneficiary gardens others became interested and wanted gardens of their own. Many project beneficiaries reported sharing seedlings and knowledge with friends and neighbors. Beneficiaries were proud to be considered specialists with expertise others wanted. Figure 10 Replicated Garden Plot is an example of one such replicated garden. The replicated gardens did not use drip irrigation. Self-Reliance A general feeling of pride was expressed among project beneficiaries. People were proud of their ability to make vegetables available to the community that community members sought their produce out and they were able to share something valuable with friends, family and neighbors. Those who had been gardeners for over one year expressed an increased sense of self-esteem and self-respect because they were working, not begging, and productive members of society.
Cross-Cutting Issues
HIV/AIDS For those living with HIV/AIDS the labor requirements for ground preparation were circumvented by paying for the labor-intensive work. A 10 by 10 meter plot cost approximately 40 B to clear. Respondents felt they were getting stronger as a result of good food and work. Many people cited the difficulty of carrying water long distances. To avoid transportation costs of fetching water one focus group said they had to walk one-and-a-half to two hours to get water from a well. This level of effort may not be appropriate for the weakest of those participating in the project. Stigma Some beneficiaries did not feel marginalized by the community but many HIV positive people were afraid to interact with other community members and one respondent even told her children not to play with others. After being accepted into the urban agriculture program and seeing the activity levels of others living with the virus she felt comfortable being an active member of her community. When discussing program entry criteria beneficiaries said that orphans, those living with the virus and the impoverished were eligible for assistance. This understanding allowed people who were not yet comfortable publicly sharing their status a cloak of anonymity.
Gender
Figure 10 Replicated Garden Plot

Page 19 of 27
As presented in Figure 11 Beneficiary Gender Distribution, the majority of participants are female. All of the interviewees felt that urban agriculture was an appropriate and fruitful activity for them to be undertaking.
Community Beneficiaries felt a sense of belonging and community with their fellow gardeners. HIV positive people also felt closer to their neighbors because they had something of value to offer others. Instead of being very poor, they now considered themselves working poor. This differentiation is considerable in boosting feelings of self worth and self-efficacy.
COST EFFICIENCY A simple calculation of the total cost per beneficiary leads to a cost of US$ 145.11 per beneficiary household. This calculation is based on a total of 15,062 households reached and a total budget for the 4-year project period of US$ 2,185,654. The costs levels per household served with expenditure levels taken from ECIAfrica/DAI financial reports and basing the calculation on the same total of 15,062 households reached are: - Labor costs Addis and STTAs22 US$ 30.61 - Other direct costs23 US$ 54.87 - Cash grant to IPs24 US$ 54.68 - Generals & Administration Costs (DAI and ECIAfrica) US$ 4.95
Total cost: US$ 145.11
22 About 25% of the labor costs are for ECIAfrica/Ethiopia, 75% for Short-Term Technical Assistance (STTA) for program support including missions to Ethiopia from DAI Washington and ECIAfrica/Johannesburg. This balance is not in line with the fact that the 90% of the work is done by ECIAfrica/Ethiopia. 23 Other direct costs is for a range of expenses including travel costs, administrative staff, office expenses, procurement costs for capital equipment for ECIAfrica/Ethiopia and cumulative ODCs at DAI office including procurement costs for the drip kits and other equipment that was provided to the IPs as “in kind” contribution. Procurement for ECIAfrica/Ethiopia included 2 4x4 cars, 2 motorcycles, 4 laptops, 2 desk tops and 2 cell phones with a total budget requirement of US$ 92,600 (excluding shipping costs). 24 The cash grant includes the salary costs for an extension officer and a field worker, costs for training and monitoring, purchase of seeds and tools, organization of field days, running costs for the motorbike, and 15% administration costs. The budget line includes a 2% grant management fee. It is not clear why the cost information from the budget does not correspond with the information collected from ECIAfrica/Ethiopia and from the IPs.
0%
20%
40%
60%
80%
100%
Perc
ent
Phase-I Phase-II Phase-III Total
Garden Distribution by Gender
Garden estabilished by malesGarden estabilished by females
Figure 11 Beneficiary Gender Distribution (DAI, May 2008)

Page 20 of 27
When we look into project costs at field level, the following picture emerges (estimated current cost levels25): - Drip kit (container, tap and hoses) US$ 71.20 (100 m2) - US$ 43.90 (30m2) - Cash grant to IP26 US$ 31 per beneficiary27 It should be noted here that, in line with the amount of cultivable land that were found to be available or accessible for the selected households, 20% of the beneficiary households received a drip kit for 100 m2, 46% for 30 m2, and 32% received the much cheaper grow bags system. The kit procurement costs including hoses and taps etc. in this Urban Agriculture program amounted to US$ 0.71 per m2 irrigated for the big kit and US$ 1.46 per m2 irrigated for the small drip kit. A quick search on the internet reveals that the costs level for big drip kit procurement is more or less in line with other projects but that the procurement cost for the small kit is on the high side. One literature reference dating from 2002 cites that for small 20 L bucket systems an average kit purchase cost amounts to US$ 0.47 – US$ 0.93 per m2 irrigated, while for a 200 L bucket the kit purchase cost is about US$ 0.50 per m2 irrigated28. In the DAI Urban Agriculture program the small kit has a double cost per m2 irrigated when compared to the bigger container for irrigation of 100 m2, but it should be taken into account here that the poorer households will be more predominant among the beneficiaries for 30 m2 plots and that the actual difference when also other costs incurred within the program are taken into account is less pronounced.
SUSTAINABILITY For the beneficiaries with drip kits the outputs and outcomes achieved by the home nutrition garden are regarded as very valuable. Therefore, they are very motivated to continue gardening. Motivation was generally highest among beneficiaries with better education levels and those with more experience in growing and selling vegetables. The drip kits are expected to last for about 5 to 7 years, and the evaluators expect that the kits will indeed be used for some more years at least. The people that were given grow bags however have only cropped for one or two harvests and then the bags were too worn out to continue. The evaluation team has not been brought in contact with any graduated beneficiary still using the grow bag system, but we have been told that grow bags are still being used by an orphanage in Bahir Dar based on the use of more durable cement bags. On the other hand it can be remarked that grow bags form a good entry point for households who are not yet willing to engage in the more complicated and more demanding drip kit farming systems. The urban agriculture program has been very important for strengthening community support around the gardeners´ families, and is widely acclaimed to have resulted in reduction of stigma and discrimination in poor urban neighborhoods. While individual
25 Source: ECIAfrica/Ethiopia. 26 The cash grant includes the salary costs for an extension officer and a field worker, costs for training and monitoring, purchase of seeds and tools, organization of field days, running costs for the motorbike, and 15% administration costs. 27 The IP cash grant was US$ 10 to 12 in Zimbabwe. In this project in Ethiopia the cash grant went up from US$ 16 in Phase I to US$ .25 in Phase II and US$ 31 per beneficiary in Phase III. The increase was mainly caused by a reduction of the number of households served per extension worker, going down from 400 in Phase I to 280 in Phase II to 200 in Phase III. 28 Costs estimates taken from an interesting report dating from 2002 which compares some low-cost drip technologies for use in developing countries, see www.siminet.org/images/pdfs/10k-contest.pdf.
Page 21 of 27
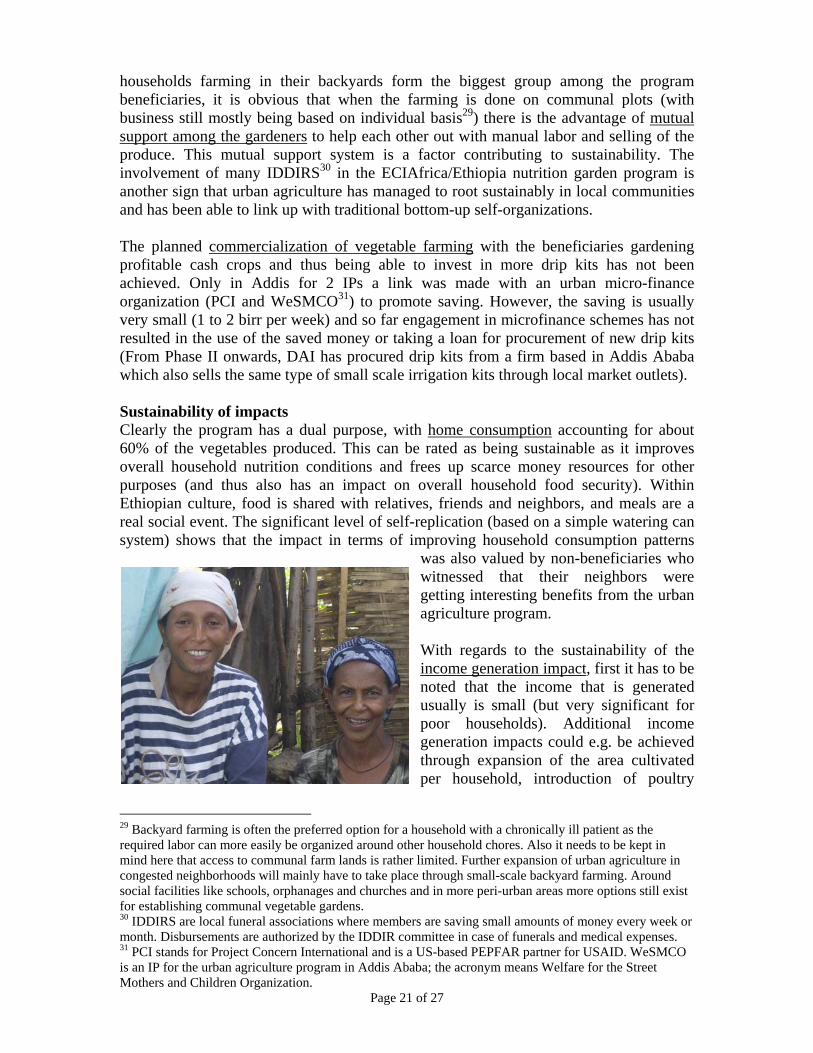
households farming in their backyards form the biggest group among the program beneficiaries, it is obvious that when the farming is done on communal plots (with business still mostly being based on individual basis29) there is the advantage of mutual support among the gardeners to help each other out with manual labor and selling of the produce. This mutual support system is a factor contributing to sustainability. The involvement of many IDDIRS30 in the ECIAfrica/Ethiopia nutrition garden program is another sign that urban agriculture has managed to root sustainably in local communities and has been able to link up with traditional bottom-up self-organizations. The planned commercialization of vegetable farming with the beneficiaries gardening profitable cash crops and thus being able to invest in more drip kits has not been achieved. Only in Addis for 2 IPs a link was made with an urban micro-finance organization (PCI and WeSMCO31) to promote saving. However, the saving is usually very small (1 to 2 birr per week) and so far engagement in microfinance schemes has not resulted in the use of the saved money or taking a loan for procurement of new drip kits (From Phase II onwards, DAI has procured drip kits from a firm based in Addis Ababa which also sells the same type of small scale irrigation kits through local market outlets). Sustainability of impacts Clearly the program has a dual purpose, with home consumption accounting for about 60% of the vegetables produced. This can be rated as being sustainable as it improves overall household nutrition conditions and frees up scarce money resources for other purposes (and thus also has an impact on overall household food security). Within Ethiopian culture, food is shared with relatives, friends and neighbors, and meals are a real social event. The significant level of self-replication (based on a simple watering can system) shows that the impact in terms of improving household consumption patterns
was also valued by non-beneficiaries who witnessed that their neighbors were getting interesting benefits from the urban agriculture program. With regards to the sustainability of the income generation impact, first it has to be noted that the income that is generated usually is small (but very significant for poor households). Additional income generation impacts could e.g. be achieved through expansion of the area cultivated per household, introduction of poultry
29 Backyard farming is often the preferred option for a household with a chronically ill patient as the required labor can more easily be organized around other household chores. Also it needs to be kept in mind here that access to communal farm lands is rather limited. Further expansion of urban agriculture in congested neighborhoods will mainly have to take place through small-scale backyard farming. Around social facilities like schools, orphanages and churches and in more peri-urban areas more options still exist for establishing communal vegetable gardens. 30 IDDIRS are local funeral associations where members are saving small amounts of money every week or month. Disbursements are authorized by the IDDIR committee in case of funerals and medical expenses. 31 PCI stands for Project Concern International and is a US-based PEPFAR partner for USAID. WeSMCO is an IP for the urban agriculture program in Addis Ababa; the acronym means Welfare for the Street Mothers and Children Organization.

Page 22 of 27
keeping32 and other small livestock programs as suitable for the area and the household. It was noted that so far marketing has not been a problem as there is sufficient demand for the vegetables produced33, that is, after the initial reservation against buying vegetables from people who might by PLHIV. One of the reasons is that in urban areas in Ethiopia there is a noticeable shift in dietary patterns towards higher consumption of vegetables, which is partly due to the HIV/AIDS epidemic. In general, the best prices are fetched for kale and Swiss chard. The majority of the sales are to regular customers from the kebele who come to the garden (especially in Addis but also in Bahir Dar for example). However, prices might be better with better market linkage, e.g. with restaurants, shop keepers, retailers who have access to the main city vegetable markets, etc. In Addis Ababa, a key selling point for the vegetables has been that they are grown with clean tap water and that polluted surface water is not used during cultivation. In Adama the market for vegetables seems strongest as vegetable growing was not practiced previously and there is a high demand from hotels and the relatively a bit wealthier local population. Prospects for sales are also rather good in Bahir Dar and the other cities in Amhara Region where the Urban Agriculture program operates (Dessie, Gondar). Some problems apparently exist with market access in Awassa where the market is monopolised and supplies are abundant from Shashemane area. Nearly all of the project beneficiaries interviewed were still receiving support and monitoring from their respective IPs which should be taken into consideration when evaluating program success. All but one of the 28 people interviewed were still gardening. All of the focus group key informants were still gardening. Respondents noted that they would keep gardening and strongly encouraged others to garden but also mentioned that there are others who had been gardening but had stopped. Second-hand reasons for the discontinuation were that the expenses were too high, namely water and it was hard work for those who were weak. Program sustainability at the community level may be impeded by land use rights and reliable water sources. The two reasons given for water shortages were that it was too expensive to pay for municipal water or there was no water readily available. Beneficiaries in all of the sites said that the city could turn the water off once or twice a week. Some communal gardens dug wells but none of the wells produced enough water to cover all of the need. Access to land continues to prohibit sustainability and expansion. Land use issues were that communal gardens were on government or IP land. Beneficiaries in two of the focus groups expressed grave concern over the government reclaiming the land at any point in time. Renters were not allowed to cultivate in their compounds. All of the respondents wanted to expand their gardens which were viewed by beneficiaries as essential to sustainability. Scaling-up gardens would allow them sufficient profits to reinvest in the garden. One key informant said she would be willing to take public transportation if she received land outside of the city limits.
32 This is currently being piloted with 2000 households. 33 ECIAfrica and the IPs have provided advice on which crops to grow in which season etc.

Page 23 of 27
LINKAGES TO OTHER SERVICES
Links with Other PEPFAR Contractual Partners The Urban Agriculture is in line with the PEPFAR referral linkages network model. The links with PEPFAR partners actually are an innate feature of the urban agriculture program. The program was designed when anti retroviral therapy (ART) became more widely available in Ethiopia and former bedridden HBC clients were found to be capable to undertake some light IGA activities to reduce their dependency on food aid and other social support. In 2004, the Urban Agriculture program started off building on the network of HBC patients being served through FHI. The IP selection system has resulted in linking up with 27 local NGOs (some active at national level, some more at local level) over the 4-year project period, of which 14 organizations are also implementing OVC support programs (PC334) for USAID partners. This applies to 10 organizations that also have (or have had) links with FHI, 2 IPs linked up with SC-US35 and also 2 IPs linked up with Intrahealth. The total overlap between the Urban Agriculture program and other PEPFAR programs amounts to 50% of the IPs which serve 54% of the Urban Agriculture program beneficiaries). The system of targeting the same IPs and often the same beneficiaries has ensured that the care and support programs for OVCs and PLHIV treatment and care schedules (ART, PMTCT36, CHBC) build upon each other so that program effectiveness is increased. On the other hand it is also true that inclusion of non-PEPFAR IPs within the Urban Agriculture program has increased the span to reach out to organizations that were not (yet) availing of other PEPFAR funding, e.g. newer/smaller NGOs and some IPs that focus on agriculture and environmental protection. The combination of more health and social services-oriented and agriculture-oriented IPs has enriched the expertise base that is available within the partner network. The link with FHI Ethiopia was especially strong in Phase I of the project during the implementation of the IMPACT program for which FHI was contractual partner to USAID. During this Phase ECIAfrica indeed has been greatly assisted by FHI to get their feet on the ground. With the start of the PC3 program more international NGOs became involved in care and support programs for OVCs. ECIAfrica maintained some links with these organizations particularly for training of staff on a variety of topics (vice versa).
Links with GoE ECIAfrica/Ethiopia has been very strong in mobilizing interest in the Urban Agriculture program among GoE stakeholders like city and kebele administrations, HAPCO, and staff of the Urban Agriculture Departments in the cities covered. Also there have been some links with research institutes on e.g. certified seeds and testing of land and water quality. These contacts however are not maintained on a structural basis but rather on ad-hoc basis. 34 PC3 stands for Positive Change: Communities and Care. It is a 5-year PEPFAR program (2004-2009) with the goal to provide care and support to 500,000 OVCs as follow-on to the IMPACT program that was managed by FHI. The PC3 program is implemented by a number of major US-based NGOs present in Ethiopia. 35 Save the Children USA, a PEPFAR partner and lead agency for the PC3 program 36 PMTCT stands for Prevention of Mother-to-Child Transmission and focuses on HIV positive pregnant women. The program provides an intensive course up anti-retrovirals to considerably reduce the chance of transmission to the newborn during pregnancy and/or labor.

Page 24 of 27
Links with UN Agencies The Urban Agriculture project has been rather weak in linking up with UN agencies in the agricultural and food security fields like WFP and FAO or with agencies dealing with HIV/AIDS (UNAIDS) and OVCs (UNICEF). In Ethiopia there are cluster working groups on e.g. HIV/AIDS and nutrition, but no specific area of practice exists yet on urban agriculture.
CAPACITY BUILDING In the original proposal the training component of the program was organized as a three-tier system, starting with trainers of Technical Partners (local technical institutions on horticulture37) who then would train project trainers of ECIAfrica/Ethiopia and the extension workers of the IPs who would finally interact with contact gardeners (community leaders) participating in the program. This approach was later on slightly reshaped into a four-tier system starting from ECIAfrica/Ethiopia agricultural supervisors to train the extension workers of the IPs who then train the contact gardeners (2 to 3 day training session) who each then train 9 other beneficiary households. A detailed training manual for use as a field guide was published by ECIAfrica/Ethiopia in April 2006. The manual mainly focuses on the technicalities of drip-kit irrigation and container gardening but also has a good though rather technical section on nutrition and HIV/AIDS and some basics on recordkeeping. The applied tier-system evidently is a very efficient mechanism for capacity building. However, this might very well be at the expense of effectiveness. It is rather questionable if more detailed technical information is picked up by regular beneficiary households from the contact gardeners although the (rather simple) drip kit technology was generally found to being practiced without problems. Topics that are not immediately required to start up a vegetable garden, like basic training in business skills including marketing, talks on HIV/AIDS prevention and on improved food handling and preparation and on nutrition in general (next to simply stimulating the consumption of vegetables), seem to have fallen between the cracks a bit. Various interviewed beneficiaries even complained that they had not received any formal training on gardening skills. Regular presence in the field of the IP extension workers and also the ECIAfrica Supervisory Trainers has somewhat closed the training gap through instruction ´by walking around´ but presumably this again was mainly focused on the contact gardeners. Another observation is that no system has been established for refresher training of graduated contact farmers and beneficiaries after the 1-year project inclusion is finished.
MONITORING AND EVALUATION
Baseline Study and Mid-Term Learning Assessment Executed in 2005 Early 2005, a baseline survey was done to study characteristics of the beneficiary households, their health status and HIV/AIDS behavior and average household income and expenditures patterns (Daystar Consult International, 2005). This study showed that most beneficiaries had no garden before the HNG program was introduced, that most of the gardeners are women and that most of them were worried about finding markets for
37 The first program proposal mentions potential technical partner organizations like Selam Technical College, ENDA Ethiopia, Addis Ababa Department of Urban Agriculture, the Linkages Project, WISE, FHI, Bio Farm, and Concern International.

Page 25 of 27
their produce. As the drip kits had only recently been distributed no effect was found yet on household nutrition and income levels. In general, expectations for the nutrition gardens did not seem to be high, also because of the limited plot sizes. The baseline study gave limited insight in the socio-economic situation of the household, more in-depth questioning of income sources etc. would have been helpful. The baseline also only had very little information on household food consumption and nutritional status (which actually was not measured at all). This reveals that the nutrition objective in fact was not given a lot of priority in the urban agriculture program. The Mid-Term Learning Assessment was implemented only a few months after the Baseline study, as a review of project implementation in the period July 2004 to September 2005. The overall conclusion was that the objectives of the program were met, that about 75% of the vegetables produced were consumed by the beneficiary households which increased vegetable consumption frequency from 0 to about 3 times per week. About 20% of the produce was sold, raising an income of about 25 birr per month. Some overlap was found to be present in some of the kebeles where 2 IPs were active (this was corrected in Phase II). The report also recommended forming associations to create economies of scale for market linkages (not done so far) and to shift to local procurement of the drip kits locally (done from Phase II onwards but costs were higher than with imported kits).
Performance / Progress Monitoring Plans (PMPs) The PMPs for the three phases of the program were very elaborate, containing a variety of indicators on program coverage of different target groups (in Phase III with disaggregated data for coverage of ART, PMTCT and HBC clients), outputs (training courses, gardens established), outcomes (vegetable production, from Phase II onwards also on skills gained) and impacts (consumption patterns, raised income through vegetable sales, household expenditure patterns). In Phase I there also were two mainstreaming indicators on HIV/AIDS behavior change but these were dropped in Phase II and III. It is understood from ECIAfrica/Ethiopia that in Phase I the household monitoring format included too many variables but that it was simplified from Phase II onwards. Collection of monitoring data has been done quarterly according to plan. The PMP format has been closely followed in the reports to USAID for nearly all of the indicators. However, the PMP is rated as containing too many variables which are not always easily understood in relation to one another. More specific indicators on program outputs (types of training provided) and on outcomes (disaggregation of the production levels per vegetable group, types of skills and competences gained) were found missing. The number of indicators on the impact on household expenditure patterns is rated as being too high and not very meaningful. The presentation of the data in the reports is not very straightforward as there are many repetitions and some important data are missing (like e.g. a simple and to-the-point overview of the different categories of households that are covered). The annual reports have more narrative than the semi-annual reports. However, these rapports are mainly descriptive in nature and lack discussion on the meaning of the reported data and how they could be used for fine-tuning of the urban agriculture program. This results in reporting being a rather technical exercise which is undertaken in order to comply with the PMP requirements. There seems to have been little thought over the 4-year period how to improve the information base for further planning and demonstration of the success of the project in terms of impact for the

Page 26 of 27
beneficiaries. Especially the information on crop production expressed in kg produced has little value. The information on crop sales is interesting but might lack accuracy. Information on the use of the income earned by gardening is of high relevance for the program but was not analyzed and reported upon in a structured manner. Monitoring of program outputs and results in terms of outcomes and impacts has been a key feature of the urban agriculture program to which much time and energy from the side of ECIAfrica/Ethiopia and also the IPs has been dedicated. The quarterly collection of monitoring data for all beneficiary households laid a heavy burden on the extension workers of the IPs. It is very questionable whether this has been efficient use of time which otherwise could have been spent on more training and instruction of the program beneficiaries. A final note is made that the program did not have any systematic monitoring and reporting on IP performance.
V. LESSONS LEARNED
IMPACT EVALUATION
Inputs, Outputs & Outcomes
Capital Investments • Grow bags were weak and did not last for an entire growing season. One
orphanage experimented with cement sacs and found them more durable. • Drip kits should only be distributed with training. The only two key informants
who received the kits and were not using them did not have training on fitting, maintenance, or use.
• Watering lines wear out and need to be replaces. Part of the training on the drip irrigation system should be where to purchase replacement lines.
Improved Nutrition • Practical nutrition training should be standardized across all IPs to include meal
composition and planning. Stress that this is a nutrition project and nutrition messages must be included in outreach. If nutrition trainings were provided the quantity may have been insufficient to adequately transfer the information to the beneficiaries. It is therefore recommended that nutrition trainings be provided along with refresher courses on a regular basis.
• The project should monitor nutritional status of the beneficiaries. All participants do not need to be monitored on a quarterly basis. A sample will suffice to give program managers an indication as to the need for reinforced messages.
Increased Income • Incorporate functional business literacy into the curriculum. To effectively train
people with no formal education in business skills will most likely take two growing seasons. The first season will be for the training and the second for follow-up and refresher courses. Program monitoring should then include regular reviews of beneficiary record keeping.

Page 27 of 27
• Beneficiaries are interested in diversifying business activities. • Organizing urban agriculturalists may promote positive outcomes. Organized
farmers can more effectively lobby for land use, mobilize social support networks, take advantage of economies of scale to increase purchasing power and more efficiently sell bulk produce to regular client.
Increased Skills & Knowledge • Agricultural training has been effective and well implemented. • With effective training and monitoring, urban agriculture can easily be adopted by
the urban poor. Beneficiaries are eager to gain new knowledge and request more training to improve themselves as people.
SUSTAINABILITY Land Tenure
• Land tenure and use may impede project sustainability. DAI has very successfully procured government land right for communal gardens. Future success depends on the beneficiaries’ ability to advocate and renegotiate for continued or expanded access privileges.
Water
• The lack of reliable water sources has discouraged beneficiaries from gardening upon project graduation and has caused current participants to question the long-term viability of gardening. Wells were dug at some communal garden sites with insufficient recharge rates. Hydrological engineers may need to be involved in ensuring affordable and consistent water sources at garden epicenters.
MONITORING AND EVALUATION • Track fewer indicators which provide meaningful information to enlighten
program decisions. • Reducing data collection level of effort will allow for timely use of the results. It
will also free-up extension workers to provide TA and support to their assigned beneficiaries.
VI. APPENDICES