extensional, bending and twisting stiffness of titaniulll … · · 2013-08-31stiffness of...
TRANSCRIPT

: 111~~!li~~!~~]~~1111 \ NASA Contractor Report 165866
NASA-CR-165866 19820017452
Extensional, Bending and Twisting Stiffness of Titaniulll Multi-wall Therlllal Protection Systelll (TPS)
J.E. Meaney
ROHR INDUSTRIES, INC. CHULA VISTA, CA 92012
CONTRACT NASI-15646 APRIL 1982
NI\S/\ National Aeronaulics and Space Admlnlstratron
Langely Research Center Hampton, Virginia 23665
I ,.' <~i 1982
https://ntrs.nasa.gov/search.jsp?R=19820017452 2018-06-28T01:16:47+00:00Z

..
FOREWORD
ThlS is the interim report on work being performed by Rohr Industries in a contract for Design and Fabrication of Titanium Multiwall Thermal Protection System (TPS). This report describes the Task III activities. For Task III, the extensional, bending, and torsional stiffnesses of flat, multiwall sandwich were determined.
This program is administrated by the National Aeronautics Administration Langley Research Center (NASA LaRC). Mr. John Shideler of the Aerothermal Loads Branch, Loads and Aeroelasticity Division, is Technical Monitor for the program.
The following Rohr personnel were the principal contributors to the program during thlS reporting period: Winn Blair, Program Manager; J. E. Meaney, Structures; and L. A. Wiech, Engineering Laboratory. Overall program responslbility is assigned to the Rohr Aerospace Research and Development Engineerlng Organization with U. Bockenhauer, Manager.

SUMMARY
This report describes a test program that determined the extensional,
bending, and twisting stiffnesses of Titanium Multiwall Thermal Protection System (TPS). The results of the testing are presented in tabular and graphical form. The graphs plot stiffness versus various geometric parameters of the dimpled core. The tests show that unlike honeycomb core, the dimpled core is a significant contributor to the stiffness and strength of the sandwich. Irregularities in the extensional stiffness test data are attributed to foil thickness variations and to difficulty in determining linear values from nonlinear test results.
i;
\

Section 1
2
3
4
5
6
TABLE OF CONTENTS
INTRODUCTION Page
1
TEST PLAN .......................................... 3
TEST SPECIMEN FABRICATION .......................... 7
TEST METHODS AND RESULTS ........................... 9
4.1 Extensional Stiffness ...................... 9 4.2 Bending Stiffness .......................... 14 4.3 Torsional Stiffness ........................ 16
CONCLUSIONS ........................................ 19
5.1 Extensional Stiffness of Dimpled Sheet 19 5.2 Extensional Stiffness of Multiwall
San dw i c h ................................... 19 5.3 Bending Stiffness of Multiwall Sandwich .... 20 5.4 Torsional Stiffness at Multiwall Sandwich .. 20
REFERENCES •..••...••.•.•.••....•.••....••••.......• 21
iii

Figure 1
2
3
4
5
6
7
8
9
10
11
12
LIST OF ILLllSTRATIONS
Panels B, E1 and E2 ShowinQ Overall Panel Thickness (Rohr photo 80-295-2) .........•.....•... 23 Panels A, 01 and 02 Showing Overall Panel Thickness (Rohr photo 80-295-1) ................... 23
Panels C, F1 and F2 Showing Overall Panel Thickness (Rohr photo 80-295-3) ..••..•......•..... 24
Panels Showing Specimen Layout (Rohr photo 80-295-4) ......................................... 24
Panels Showing Specimen Layout (Rohr photo 80-295-5) ......................................... 25
Panels Showing Specimen Layout (Rohr photo 80-295-6) ......................................... 25
Panels G, K1 and K2 Showing Thickness and Spec imen Layout ................................... 26
Panels H and I Showinq Thickness and Specimen Layout ............................................ 26
Panels J1 and L1 Showing Thickness and Specimen Layout ............................................ 27
Panels J2 and L2 Showing Thickness and Specimen Layout ............................................ 27
Tensile Test Set-Up Showing Instron Tester (Rohr photo 80-311-1) ............................. 28 Close-Up of Dimple Sheet Tensile Test (Rohr photo 80-311-2) ................................... 28
iv

Figure 13
14
15
16
17
18
19
20
21
22
23
24
25
26
27
28
29
LIST OF ILLUSTRATIONS
Dimpled Sheet - Effect of Dimpled Depth and Orientation of Dimples ...•..•........•............ 29 Dimpled Sheet - Effect of Foil Thickness and Orientation of Dimples ••....•.......•...••.•....•• 30 Extensional Stiffness - Single Layer Stiffness Versus Dimple Depth •.....•.......••••.....••.....• 31
Extensional Stiffness - Single Layer Stiffness Versus Core Foil Thickness .......................• 32 Extensional Stiffness - Double Layer Stiffness Versus Dimple Depth .....................•......... 33 Extensional Stiffness - Double Layer Stiffness Versus Core Foil Thickness ..........•.......•..... 34 Typical Load Versus Strain Curve ....•....•........ 35 Beam Flexure Test Set-Up (Rohr photo 80-370-1) .... 35 Bending Test - Single Layer EI Bending Stiffness Versus Core Dimple Depth ...•.............••......• 36
Bending Test - Single Layer EI Bending Stiffness Versus Core Foil Thickness ..................•..•.. 37 Bending Test - Double Layer EI Bending Stiffness Versus Core Dimple Depth ......................... 38 Bending Test - Double Layer EI Bending Stiffness Versus Core Foil Thickness ........................ 39
Torsional Stiffness Test Set-Up (Rohr photo 80-301-1) ......................................... 40
Torsion Test - Single Layer JG Torsional Stiffness Versus Core Dimple Depth ............•...•••....... 41
Torsion Test - Single Layer JG Torsional Stiffness Versus Core Foil Thickness ................•....... 42 Torsion Test - Double Layer JG Torsional Stiffness Versus Core Dimple Depth ••...........•.•.......... 43 Torsion Test - Double Layer JG Torsional Stiffness Versus Core Foil Thickness .....•..•............... 44
v
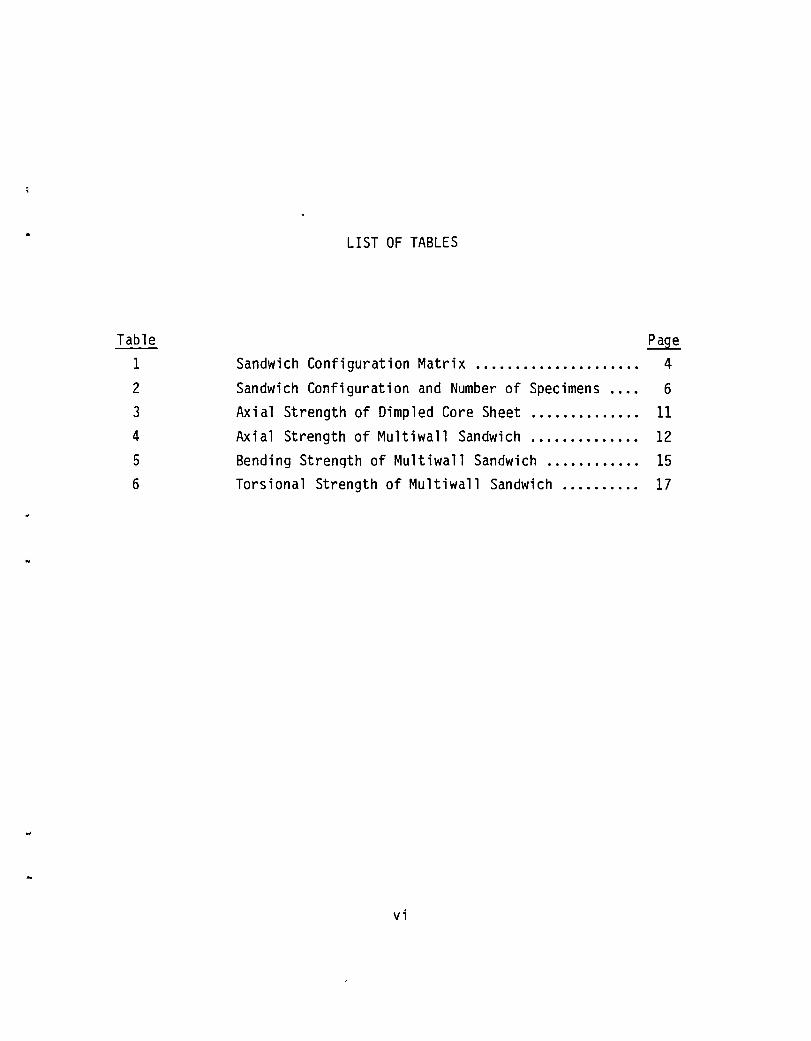
Table 1 2
3
4
5
6
LIST OF TABLES
Sandwich Configuration Matrix
Sandwich Configuration and Number of Specimens .... 6 Axial Strength of Dimpled Core Sheet .............. 11 Axial Strength of Multiwall Sandwich .....•.......• 12 Bending Strenqth of Multiwall Sandwich ............ 15 Torsional Strength of Multiwall Sandwich .......... 17
vi
1/ INTRODUCTION
Rohr Industries was awarded a contract in January 1979 to design and
fabricate titanium Multiwall Thermal Protection Panels for testing by NASA. This contract included Task I, Design Definition, and Task II, Test Model Design and Fabrication. Results of this work are provided in References 1 and 2. Upon completion of these tasks, the basic contract was amended in February 1980 to add a revised Task III, Titanium Multiwall Structural Evaluation.
Task III was a test program for determination of extensional, bending and tors10n stiffnesses of various multiwall sandwich configurations. In addition, strength values were determined for these loading modes. The test plan that was followed 1n performance of the Task is described in Section 2.0. A description of the methods used in fabricating the test specimens is prov1ded in Section 3.0. The test results are presented in graphical and tabular form in Section 4.0 and conclusions are presented in Section 5.0.
1

This Page Intentionally Left Blank

2/ TEST PLAN
The testing performed in this task determined the extensional, bending and torsional stiffness of single layer and double layer multiwall sandwich configurations. The extensional stiffnesses of the individual dlmpled sheets were also determined. In addition, this testing considered three varlables:
a. Dimpled core foil thickness b. Dimpled core height c. Dimpled core orientation
In order to provide all of the required test configurations, a Sandwlch Conflguration Matrix was established and is presented in Table 1 of this report. The two core foil thicknesses tested were 0.038 mm (0.0015 inch) and 0.076 mm (0.003 inch); the nominal core heights tested were 2.210 mm (0.087 inch) and 4.445 mm (0.175 inch). The two core orientatlons were ORad (0 degrees) and 0.785 Rad (45 degrees). Notlce that the thicknesses of the face sheet and the septum sheet (required in the double layer sandwich configuration) remained constant.
In order to provide multlple test pOlnts for a given configuratlon, three specimens were subJected to each required test.
3

Table 1
Sandwich Configuration Matrix
S1ngle Layer Sandw1ch Double Layer Sandw1ch One D1mpled Sheet
Parallieters A B C D E F G H I J K L M N 0 p Q R
Face Sheet o 076 o 076 o 076 o 076 o 076 o 076 o 076 o 076 o 076 o 076 o 076 o 076 - - - - - -Till dness (0 003) (0 003) (0 003) (0 003) (0 003) (0 003) (0 003) (0 003) (0 003) (0 003) (0 003) (0 003) - - - - - -IIIIl1 (Inch)
Septuill - - - - - - o 0381 o 0381 D 0381 o 0381 o 0381 o 0381 - - - - - -Tilldness - - - - - - (0 QOI5) (0 0015) (0 0015) (0 0015) (0 0015) (0 0015) - - - - - -lIun (Inch)
Core 4 44~ 4 445 2 21 4 445 4 445 2 209 4 445 4 445 2 21 4 445 4 445 2 21 2 21 2.21 4 445 4 445 4 445 4 445 D1111pled (0 175) (0 175) (0 087) (0 175) (0 175) (0 087) (0 175) (0.175) o 087) o 175) (0 175) (0 087) (0 087) (0 087) (0 175) (0 175) (0 175) (0 175) Depth nun (Inch)
Core o 0381 a 076 o 076 o 076 o 0381 o 076 o 0381 o 076 o 076 o 076 o 0381 o 076 a 076 o 076 o 076 o 076 o 0381 o 0381 Th1ckness (0 0015) (0 003) o 003) (0 003) (0 0015) (0 003) (0 0015) a 003) o 003) o 003) (0 0015) (0 003) (0 003) (0 003) (0 003) o 003) (0 0015) (0.0015) nun (I nch)
Core 0 0 0 o 785 o 785 o 785 0 0 0 o 785 o 785 o 735 0 o 785 0 o 785 0 o 785 Onentat 10n (O) (0) (0) (45) (45) (45) (0) (0) (0) (45) (45) (45) (0) (45) (0) (45) (0) (45) Oepth Rad (Oegrees)

A matrix showing the number of specimens of each sandwich configuration
is provided in Table 2. As shown, the total test program required 126 specimens. Their overall dimensions are also included in Table 2.
5

Table 2. Sandwich Configuration and Number of Specimens
Single Layer Sandwich Double Layer Sandwich
Type of Test A B C D E F G
Beam Flexure (1) 3 3 3 3 3 3 3
Torsion (2) 3 3 3 3 3 3 3
Tension (3) 3 3 3 3 3 3 3
(1) Size 76 mm by 305 mm (3 inches by 12 inches)
(2) Size 76 mm by 229 mm (3 inches by 9 inches)
(3) Size 50 mm by 254 mm (2 inches by 10 inches)
H I J K L
3 3 3 3 3
3 3 3 3 3
3 3 3 3 3
One Dimpled Sheet
M N 0 p Q
- - - - -
- - - - -
3 3 3 3 3
R Total
- 36
- 36
3 54
126

3/ TEST SPECIMEN FABRICATION
All test specimens were made of Ti-6Al-4V. The pre-cut panels, 305 mm by 610 mm (12 inches by 24 inches), were formed and Liquid Interface Diffusion (LID) bonded on the tools described in References 1 and 2. The material was fabricated using the same heat and lot as described in References 1 and 2. The thickness range was 0.0305 mm (0.0012 inch) to 0.0406 mm (0.0016 lnch) for the septum sheets, and 0.0711 mm (0.0028 inch) to 0.0813 mm (0.0032 inch) for the outside sheets. The single layer and double layer panels were fabricated in accordance with a Rohr Proprietary Process. Figures 1 through 10 show the layout for cutting of the test specimens.
7

This Page Intentionally Left Blank

4/ TEST METHODS AND RESULTS
The strength properties determined during this testing are presented in tabular form, while the stiffness values are presented in graphical form so the various parameters may be easily correlated. Each value presented in the tables and graphs represents an average of three test points.
4.1 EXTENSIONAL STIFFNESS These specimens consisted of single dimpled sheets, single layer, and double layer multiwall sandwich panels. The overall size of the specimens was 51 mm by 305 mm (2 inches by 12 inches), but they were cut into standard tensile type specimens with a test area width of 25 mm (1 inch). The ends of the specimens were clamped and loaded with an Instron test machine as shown in Figures 11 and 12. A solid metal filler was 1nserted into the ends of some of the double layer sandwich specimens so that they could be loaded without ~rushing the ends. The results of testing these specimens did not differ from those obtained testing identical specimens that were held 1n the test fixture by crushing the ends.
The dimpled sheets were generally not LID plated or exposed to the LID bonding temperature cycle. However, two specimens (M and N) were LID plated and exposed to the LID bonding temperature cycle prior to testing. The test results did not show any significant differences in the
stiffness values but did show a reduction 1n strength of about 17 percent.
9
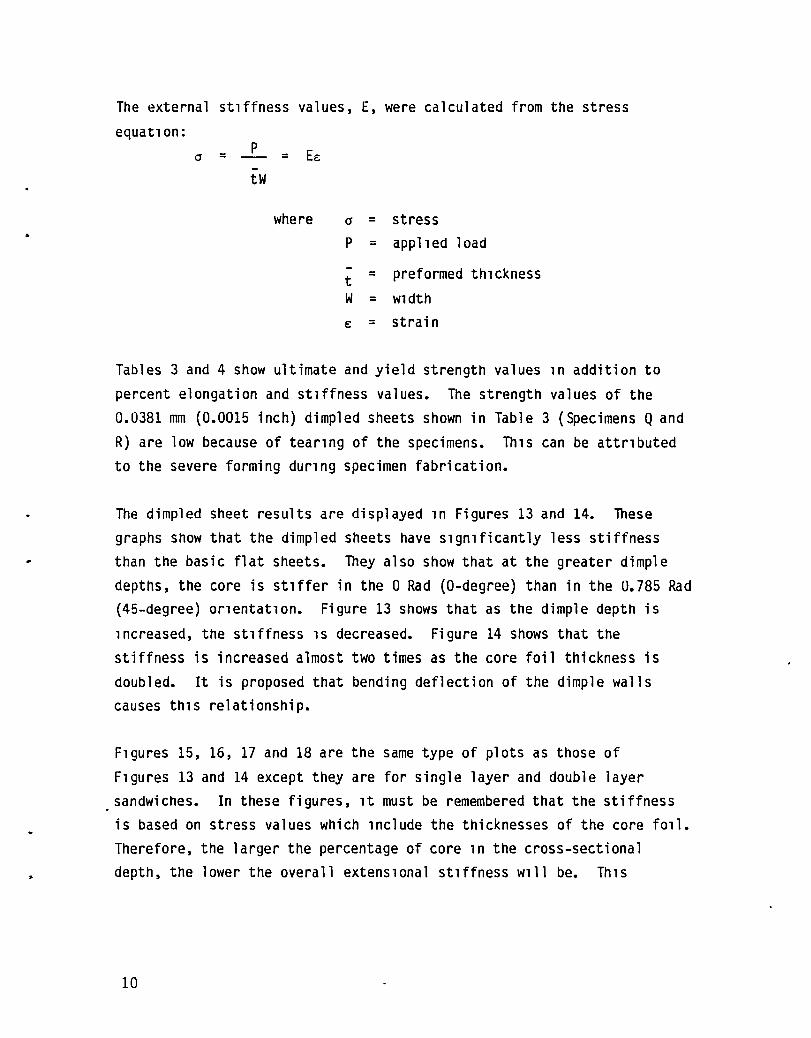
The external st1ffness values, E, were calculated from the stress
equat10n:
a = p = Ee -tW
where (J = stress p = appl1ed load
t = preformed th1ckness
W = w1dth
€ = strain
Tables 3 and 4 show ultimate and yield strength values 1n addition to
percent elongation and st1ffness values. The strength values of the 0.0381 mm (0.0015 inch) dimpled sheets shown in Table 3 (Specimens Q and
R) are low because of tear1ng of the specimens. Th1S can be attr1buted to the severe forming dur1ng specimen fabrication.
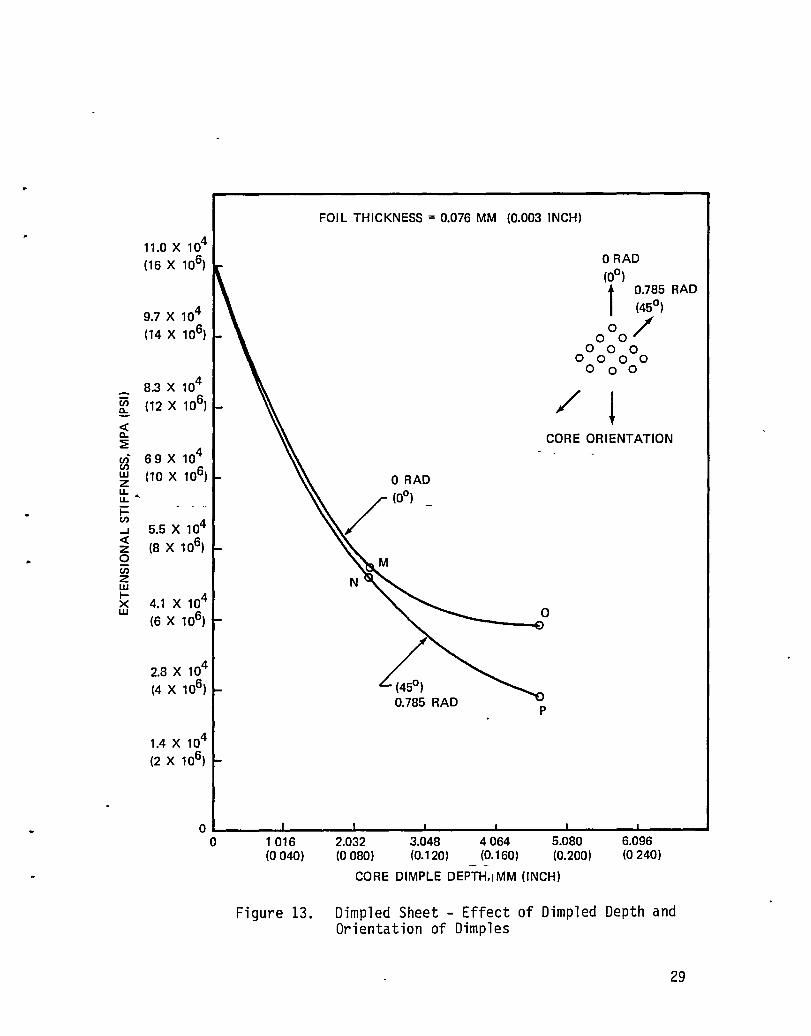
The dimpled sheet results are displayed 1n Figures 13 and 14. These graphs show that the dimpled sheets have slgn1ficantly less stiffness than the basic flat sheets. They also show that at the greater dimple depths, the core is stlffer in the a Rad (a-degree) than in the 0.785 Rad (45-degree) or1entat10n. Figure 13 shows that as the dimple depth is
1ncreased, the st1ffness 1S decreased. Figure 14 shows that the stiffness is increased almost two times as the core foil thickness is doubled. It is proposed that bending deflection of the dimple walls causes thlS relationship.
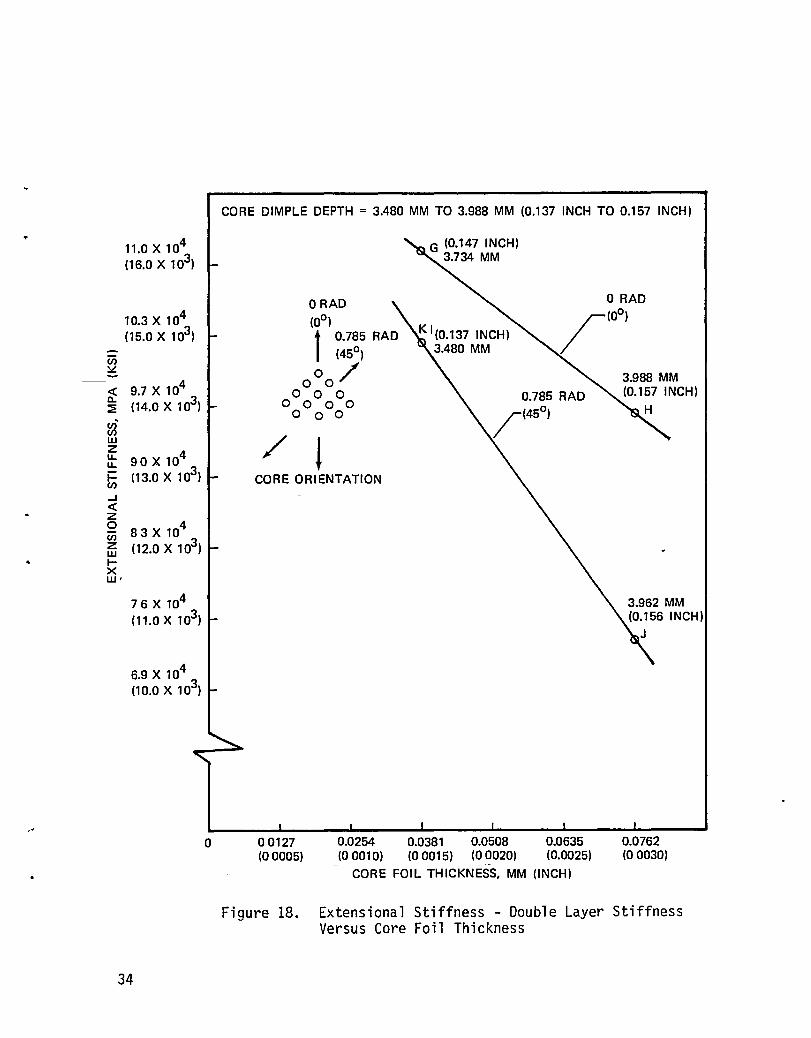
F1gures 15, 16, 17 and 18 are the same type of plots as those of
Flgures 13 and 14 except they are for single layer and double layer sandwiches. In these figures, 1t must be remembered that the stiffness is based on stress values which lnclude the thicknesses of the core f01l. Therefore, the larger the percentage of core ln the cross-sectional depth, the lower the overall extenslonal stlffness wlll be. ThlS
10

Table 3. Axlal Strength and Extenslonal Stlffness of Dimpled Core Sheet
E(4) Specimen(l) F (4) F (4)
eX £long. (4) Mpa x 103
Conflguratlon MPat{k~l) MPat~ksl) (pSl x 106)
M 495.06 889.46 4.1 51.02 (71.8) (l29.0) (7.4)
M(2) 420.60 733.63 2.5 48.95 (61.0) (106.4) (7.1)
N(2) 717.77 859.12 4.4 49.64 (l04.1) (l24.6) (7.2)
0 314.41 638.48 5.1 39.99 (45.6) (92.6) (5.8)
P 297.7 709.50 8.4 26.20 (43.1) (102.9) (3.8)
Q N/A 181.34 0.2(3) 22.06 (26.3) (3.2)
R N/A 253.05 2.6 8.27 (36.7) (1. 2)
(1) See Table 1 for deflnition of core conflguration.
(2) These speclmens have been LID plated and run through LID thermal cycle. All others are as recelved sheet after formlng.
(3) All speclmens falled outslde of 2-1nch gage marks.
(4) These values are averages of 3 to 5 separate test pOlnts.
N/A--Not available.
11
..
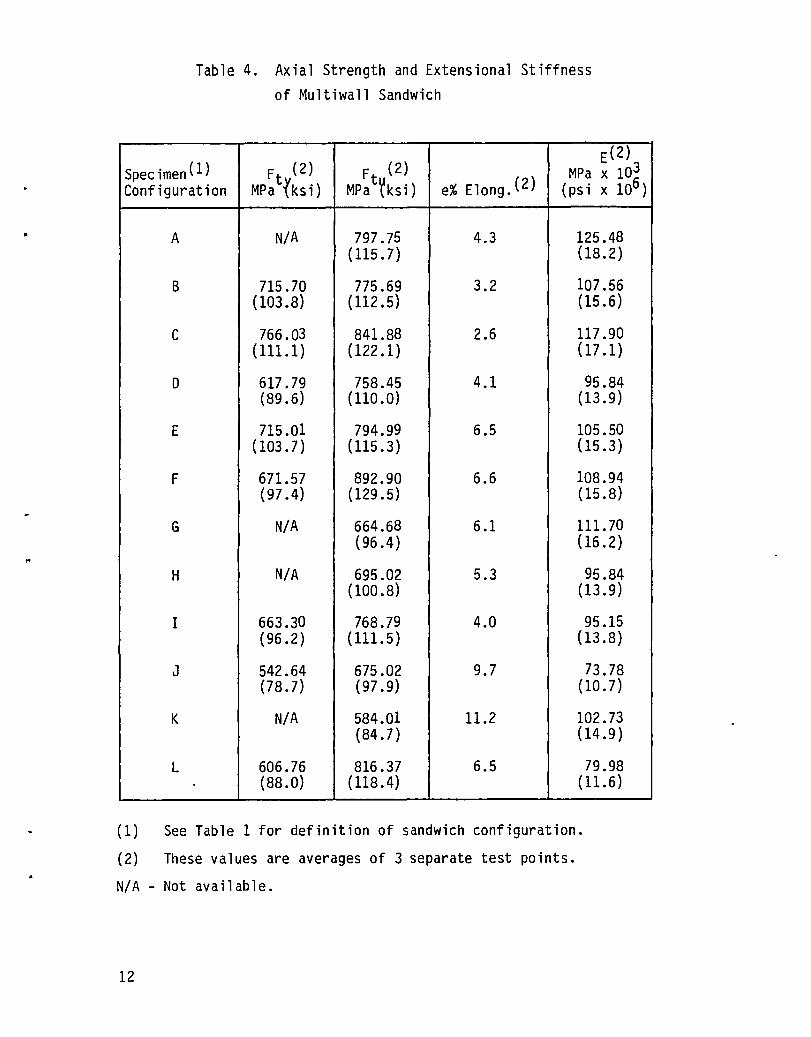
Table 4. Axial Strength and Extensional Stiffness of Multiwall Sandwich
Specimen(1) F (2) F (2) E(2)
MPa x 103 Configuration MPatrksi) MPa t~ksi) e% Elong.(2) (ps i x 106)
A N/A 797.75 4.3 125.48 (115.7) (18.2)
B 715.70 775.69 3.2 107.56 (103.8) (112.5) (15.6)
C 766.03 841.88 2.6 117.90 (111.1) (122.1) (17.1)
0 617.79 758.45 4.1 95.84 (89.6) (110.0) (13.9)
E 715.01 794.99 6.5 105.50 (103.7) (115.3) (15.3)
F 671.57 892.90 6.6 108.94 (97.4) (129.5) (15.8)
G N/A 664.68 6.1 111.70 (96.4) (16.2)
H N/A 695.02 5.3 95.84 (100.8) (13.9)
I 663.30 768.79 4.0 95.15 (96.2) (111.5) (13.8)
J 542.64 675.02 9.7 73.78 (78.7) (97.9) (10.7)
K N/A 584.01 11.2 102.73 (84.7) (14.9)
L 606.76 816.37 6.5 79.98 (88.0) (118.4) (11.6)
(1) See Table 1 for definition of sandwich configuration.
(2) These values are averages of 3 separate test points.
N/A - Not available.
12
explains why the stiffness appears to decrease as the core foil thickness increases. Also to be noted is that the core is stiffer in the 0 Rad
(O-degree) than in 0.785 Rad (45-degree) orientation as in the single dimpled sheet.
The single layer sandwich contains a dimpled sheet which, as shown in Table 3, has significantly less stiffness than a flat sheet. Therefore, the stiffness of a single layer sandwich would be expected to be
significantly less than for a basic flat sheet. However, there are three stlffness test values shown in Table 4 that exceed the accepted value
(110 x 103 MPa (16 x 106 psi)) of Ti-6Al-4V sheet material. These specimens are A, C and G, and their test values are plotted in
Figures 15, 16 and 18. There are two basic reasons for these anomalous results. Both reasons are explained below and must be taken into account when considering the overall accuracy of all test values.
The first reason is that thickness tolerance on foil type gages can be a significant factor. For example, a quarter of a mil on 0.003 inch thick foil (the maximum tolerance encountered with these test specimens) is an eight percent increase or decrease. Even measurlng and detecting these small differences is difticult. While this magnitude cannot alone account for the high measured stiffness, it can be a contributing factor.
The second reason involves the technique for measuring the stiffness value. The specimen has a Linear Variable Differential Transformer (LVOT) attached to it to measure strain. The load versus strain values are plotted automatically by the Instron test machine. The scale and the shape of these curves are the basic considerations for determining the accuracy of the stiffness values. Figure 19 shows a typical curve of load versus strain. These curves do not have the classic shape, one of initial straight line portion, but rather, have two or three lines with different slopes. It is suspected that this nonlinear behavior is due to
13

local bend1ng of the d1mple walls and a non-un1form stress d1stribution 1n the dimpled sheets. Regardless of the cause, however, the selection of the slope (or st1ffness value) becomes a matter of Judgment on the part of the 1nvestigator as 111ustrated in F1gure 19. As previously ment1oned, these factors must be taken 1nto account when cons1der1ng the overall accuracy of all test values.
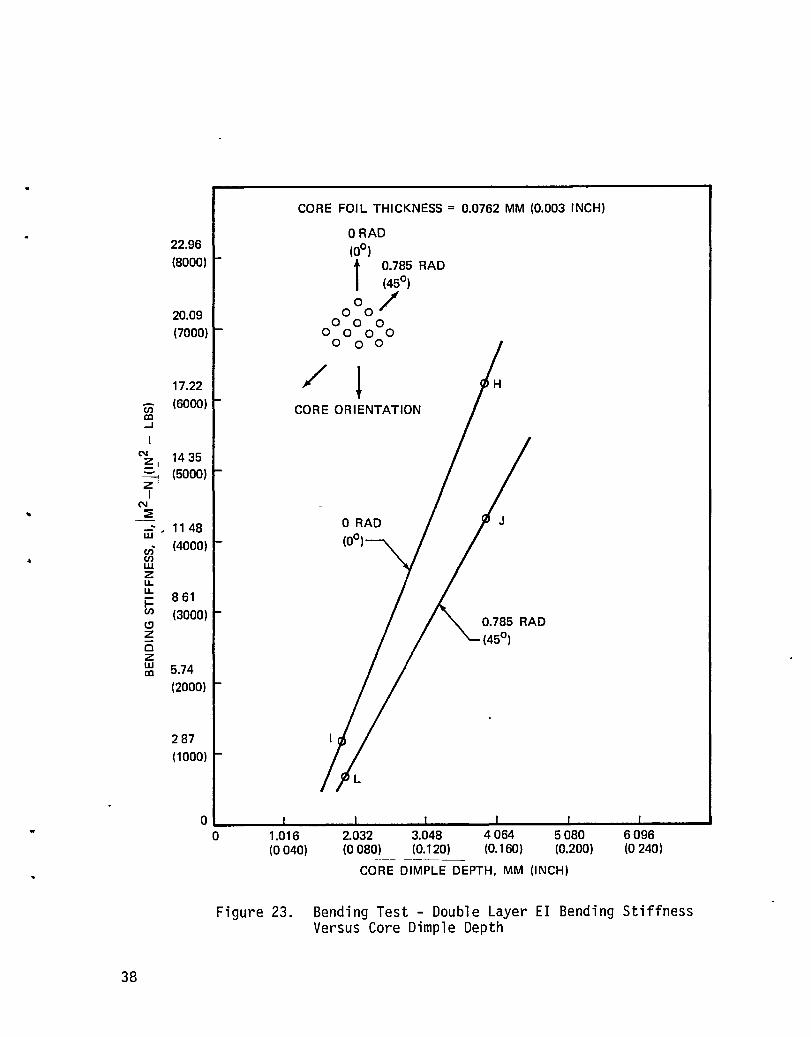
4.2 BENDING STIFFNESS These spec1mens consisted of single layer and double layer sandwich panels Wh1Ch were 75 mm (3 1nches) w1de by 305 mm (12 1nches) long. These specimens were four point loaded 1n flexure as shown in Figure 20. The 1nner span length was 152 mm (6 1nches) and the outer span was 254 mm (10 inches). As shown, a d1al indicator was pos1t1oned at the center of the beam. Deflect10ns were recorded during 1ncremental loading. The linear portions of these recorded deflections (before face sh~et buckling occurs) were used to calculate bend1ng st1ffnesses. These values and the ult1mate moment values are tabulated in Table 5. It should be noted that the ultimate fa1lure load ranged from approx1rnately two to f1ve t1mes as much as the maXlmum load 1n the linear deflect10n range.
The maximum linear load can be ~sed as an allowable for design llmit loads. Th1S approach prov1des a large factor of safety for des1gn ultimate loads and also prov1des a structure that is free from buckling when subJected to llm1t load1ng. However, this approach may result 1n
. relat1vely heav1er des1gns. A lighter des1gn will result if the face sheets are allowed to buckle at llmit load and 1f the associated reductlon 1n factor of safety for design ultimate is acceptable.
The bend1ng st1ffness values, EI, were calculated from the beam deflect10n equation A = ~ (3L2_4a2), where terms are defined in
Flgure 20. These values are plotted on Flgures 21, 22, 23 and 24. These
f1gures present the data in the same manner as in the extensional st1ffness sect1on. F1gures 21 and 23 show that as the core d1mple depth is doubled (th1S 1S effectively doubling the sandwich height), the
14

Table 5. Bending Strengths of Multiwall Sandwich
Sandwich(l) Overall (2) Proportional (2)
Ult. Moment(2) Sandwich Ht. Moment Configuration rrm (Inch) N.m/0.0762 m N.m/0.0762 m
(In-Lbs/3 In.) (In-Lbs/3 In.)
A 3.556 0.226 0.542 (0.140) (2.0) (4.8)
B 3.785 0.339 1.390 (0.149) (3.0) (12.3)
C 1.854 0.113 0.475 (0.073) (1.0) (4.2)
0 3.912 0.226 0.870 (0.154) (2.0) (7.7)
E 3.454 0.158 0.350 (0.136) (1.4 ) (3.1)
F 1.880 0.068 0.373 (0.074) (0.6) (3.3)
G 7.493 0.678 1.740 (0.295) (6.0) (15.4)
H 7.950 0.904 4.994 (0.313) (8.0) (44.2)
I 3.759 0.339 1.560 (0.148) (3.0) (13.8)
J 7.976 0.678 2.937 (0.314) (6.0) (26.0)
K 7.315 0.452 1.118 (0.288) (4.0) (9.9)
L 3.937 0.339 1.277 (0.155) (3.0) (11.3)
(1) See Table 1 for definition of sandwich configurations.
(2) These values are averages of 3 separate test points.
.
15

st1ffness 1S 1ncreased about four times. Th1S 1S cons1stent w1th
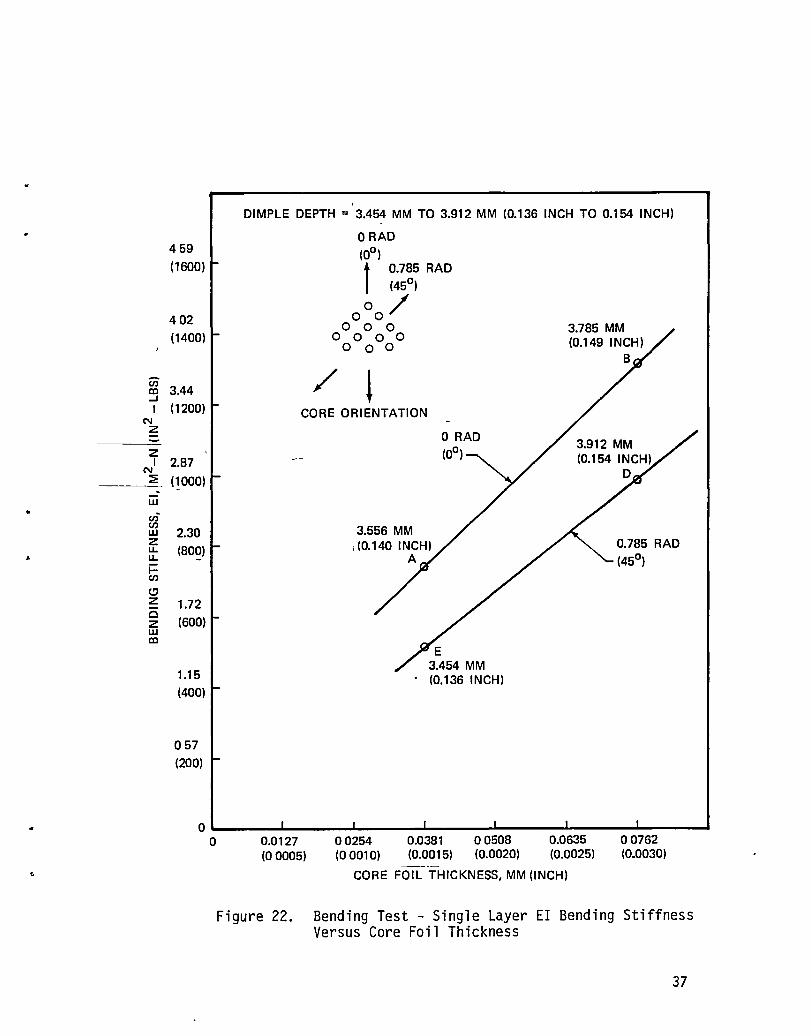
standard beam theory since height values are squared in the calculation of the moment of 1nert1a of a sandw1ch structure. All four figures show that, as in the extens10nal testing, the 45-degree core orientation d1rect10n is less st1ff than the O-degree direct10n. Figures 22 and 24 show that the core foil thickness does have a significant 1-nf1uence on the st1ffness of a glven panel. ThlS fact plus the core orientation influence indicate that the dimpled core has a significant 1nfluence 00 the bendlng strength of th1S type of structure.
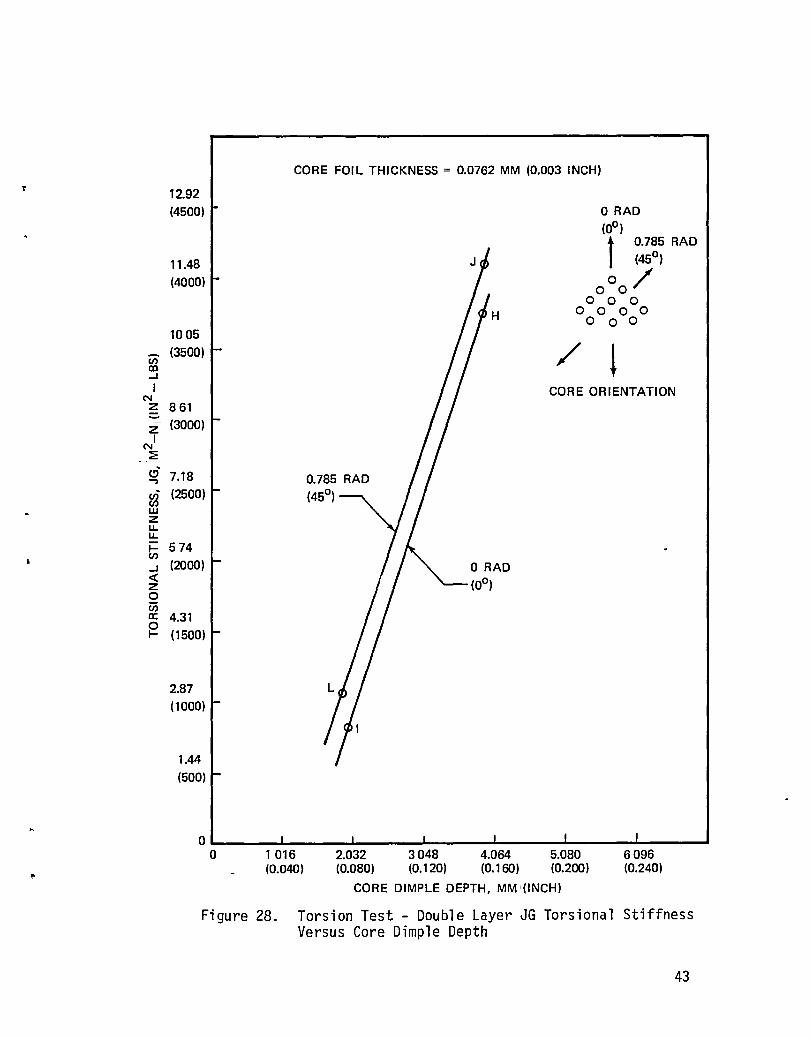
4.3 TORSIONAL STIFFNESS These specimens consisted of single layer and double layer sandwich panels that were 76 mm (3 lnches) wide by 229 mm (9 inches) long. One end of these spec1mens was restrained against rotation and translation and the other end was restralned aga1nst translatlon by a bear1ng, but was rotated by an off-center dead loading system. This is shown 1n Flgure 25. Note that a lever arm extends from each side of the loaded end of the specimen. Dial lndlcators are at the tips of the lever arm. As 1n the bend1ng tests, deflectlons were recorded dur1ng 1ncremental
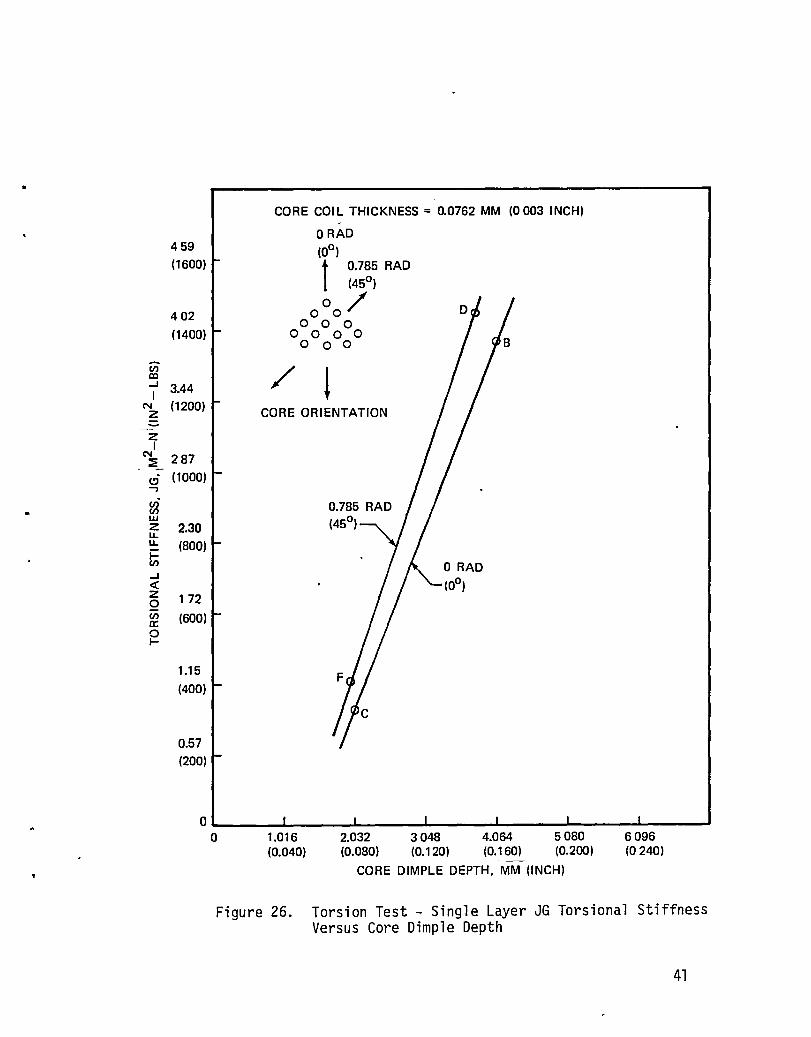
loading. The llnear portion of these recorded deflections was used to calculate the torsional stiffnesses. Fa1lure loads were not attalnable Slnce the deflect10n capabilities of the specimens exceeded those that could be handled by the test rig. However, the maXlmum torque values in the linear deflection range are tablulated 1n Table 6. The torslonal stiffness values, JG, were calculated from the formula
JG TL -e
where T = torque value
L = length of speclmen e = angle of twist
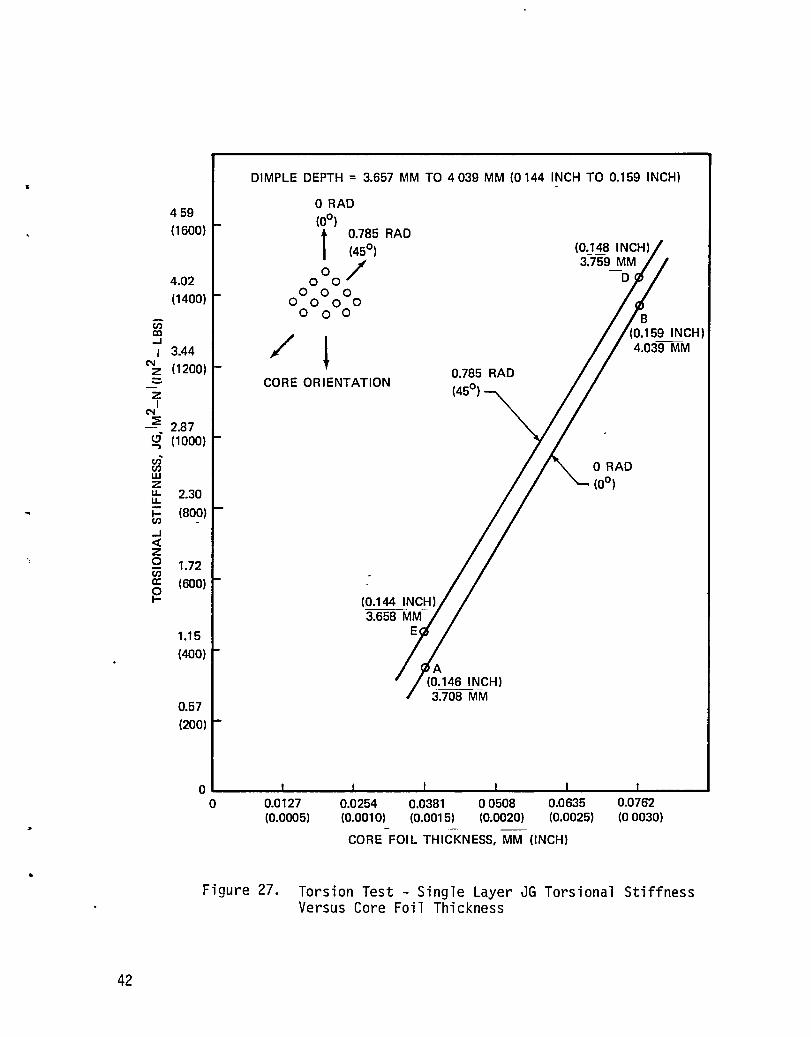
These values are plotted on Figures 26, 27, 28 and 29. These flgures present the data in the same manner as presented in the extenslonal and bendlng st1ffness sections. Figures 26 and 28 show that a doubllng of
16

•
Table 6. Torsional Strength of Multiwall Sandwich
Sandwich{l} Overall {2} Maximum proportional{3}
San dwi ch Ht. Torque N.m/0.0762m Confi gurat ion mm {Inch} {In-Lbs/3 In}
A 3.708 0.36 {0.146} {3.2}
B 4.039 0.36 {0.159} {3.2}
C 2.032 0.20 {0.080} {1. 8}
D 3.759 0.59 {0.148} {5.2}
E 3.656 0.45 {0.144} {4.0}
"\
F 1.956 0.25 {o.on} {2.2}
G 7.341 0.70 {0.289} {6.2}
H 7.950 0.97 {0.313} {8.6}
I 3.861 0.45 {0.152} {4.0}
J 8.001 1.58 {0.315} {l4.0}
K 7.366 0.81 {0.290} (7.2)
L 3.912 0.56 {0.154} {5.0}
{l} See Table 1 for definition of sandwich configuration.
{2} These heights are averages of 3 values.
(3) These values are averages of 3 test pOlnts and are the maXlmum values in the linear deflection range. Note that ultimate torque values were not determined.
17

the d1mpled depth causes approximately a quadrupling of the st1ffness.
Th1S 1S consistent with bas1c tors1on theory, Wh1Ch states that 1n mult1cell torque boxes:
4A2 J= --,....
L: ds t
where J
A ds t
= polar moment of inert1a of cross sect10n
= cross sectional area of torque cell
= distance around torque cell
= thickness of torque cell wall
When analytically treating the multiwall specimens as a ser1es of triangles and applying th1S equation, an approx1mate quadrupling 1S achieved when the height of the triangle is doubled.
An incons1stency, however, arises with this equation when examining Figures 27 and 29. The test data shows that a doubling of the core foil thickness causes an approximate quadrupling of the stiffness. The prev10us equation would pred1ct only about a doubl1ng of the st1ffness. Also, this data shows that 0.785 Rad (45 degrees) core or1entation has a very Sllght advantage over the 0 degree d1rection, Wh1Ch is opposite to that found in the bending and extensional tests.
18

• 5/ CONCLUSIONS
The test specimen variables included the following dimpled core properties:
a. Dimple depth b. Core foil thickness c. Core orientation
All of these had an influence on the stiffness and strength values measured. Consequently, these tests showed that, unlike honeycomb core, dimpled core is a significant contributor to the extensional, bending and torsional stiffnesses as well as to the overall strength of a sandwich structure.
5.1 EXTENSIONAL STIFFNESS OF DIMPLED SHEET All core variables produced values significantly less than that for a flat sheet. Average values ranged from 8.3 x 10³ to 51.0 x 10³ MPa (1.2 x 10⁶ to 7.4 x 10⁶ psi). The most significant core variable was the foil thickness.
5.2 EXTENSIONAL STIFFNESS OF MULTIWALL SANDWICH The core variables had less effect on the results of these tests on single and double layer sandwich specimens. The range of average values was 73.8 x 10³ to 125.5 x 10³ MPa (10.7 x 10⁶ to 18.2 x 10⁶ psi). There
19
•
were three configurations that produced values even greater than
110 x 10 3 MPa (16.0 x 10⁶ ) psi (the accepted stiffness value of Tl-6Al-4V). These lrregularltles are attributed to the fOll thlckness variations and to difflculty in determining the extensional stiffness for
this type of structure. The Judgment of the investigator was often required to obtain linear values from nonlinear test results. This dlfflculty must be consldered when evaluatlng the accuracy of the data.
5.3 BENDING STIFFNESS OF MULTIWALL SANDWICH All core varlables had a signlflcant influence on these values. ThlS indlcates that the dlmpled core contrlbutes to the overall bendlng strength and stiffness of the multiwall sandwlch. This is in contrast to the honeycomb core which is normally considered to be a noncontrlbutor to the moment of lnertla of a sandwich structure.
5.4 TORSIONAL STIFFNESS OF MULTIWALL SANDWICH The core orlentatlon did not have a slgniflcant lnfluence on the results of these tests. However, a doubling of either the core fOll thickness or core helght caused a quadrupling of the torsional stiffness value. The lncrease in torslonal stiffness due to core foil thickness is greater than would be predlcted analytlcally •
20

61 REFERENCES
1. Winford B"lair, John E. Meaney, Jr., and Herman A. Rosenthal, "Design and Fabrication of Titanium Multi-Wall Thermal Protection System (TPS) Test Panels," NASA CR 159241, February 1980.
2. Winford Blair, J. E. Meaney, Jr., and H. A. Rosenthal, "Fabrication of Titanium Multi-Wall Thermal Protection System (TPS) Test Panel Arrays," NASA CR 159383, December 1980.
808A4/037WB 4-15-82
21

This Page Intentionally Left Blank
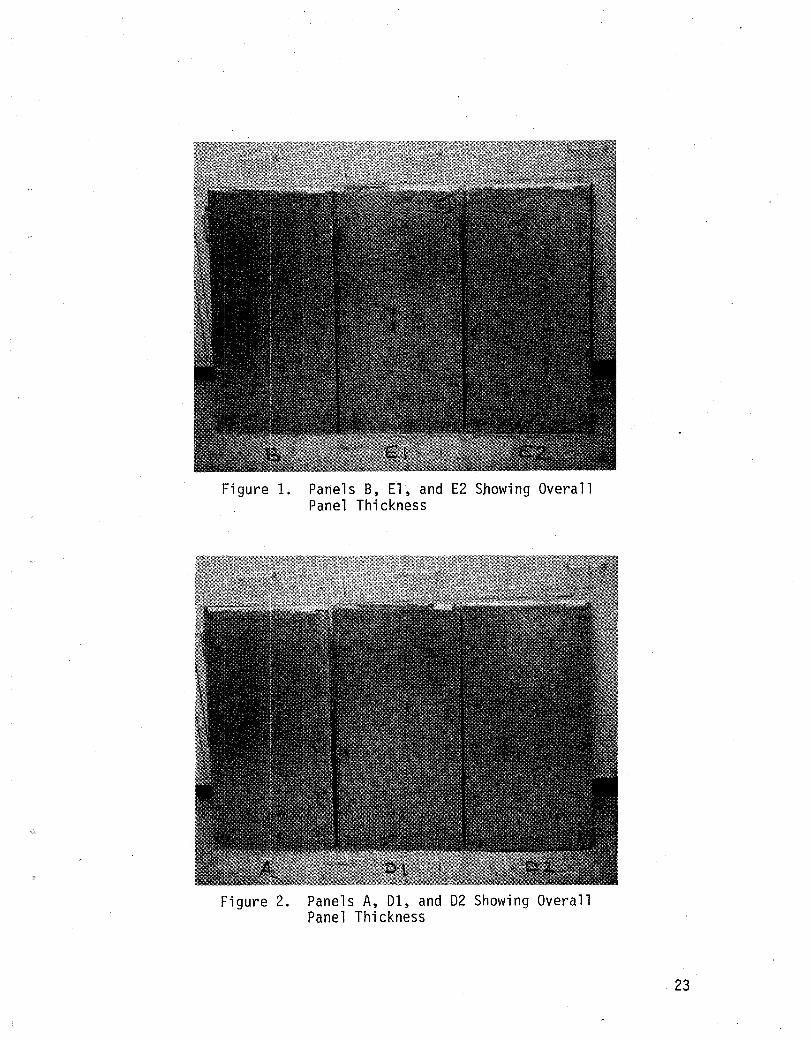
Figure 1. Panels B, El~ and E2 Showing Overall Panel Thickness
Figure 2. Panels A, 01, and 02 Showing Overall Panel Thickness
23

24
Figure 3. Panels C, Fl, and F2 Showing Overall Panel Thickness
Figure 4. Panels Showing Specimen Layout

Figure 5. Panels Showing Specimen Layout
Figure 6. Panels Showing Specimen Layout
25
26
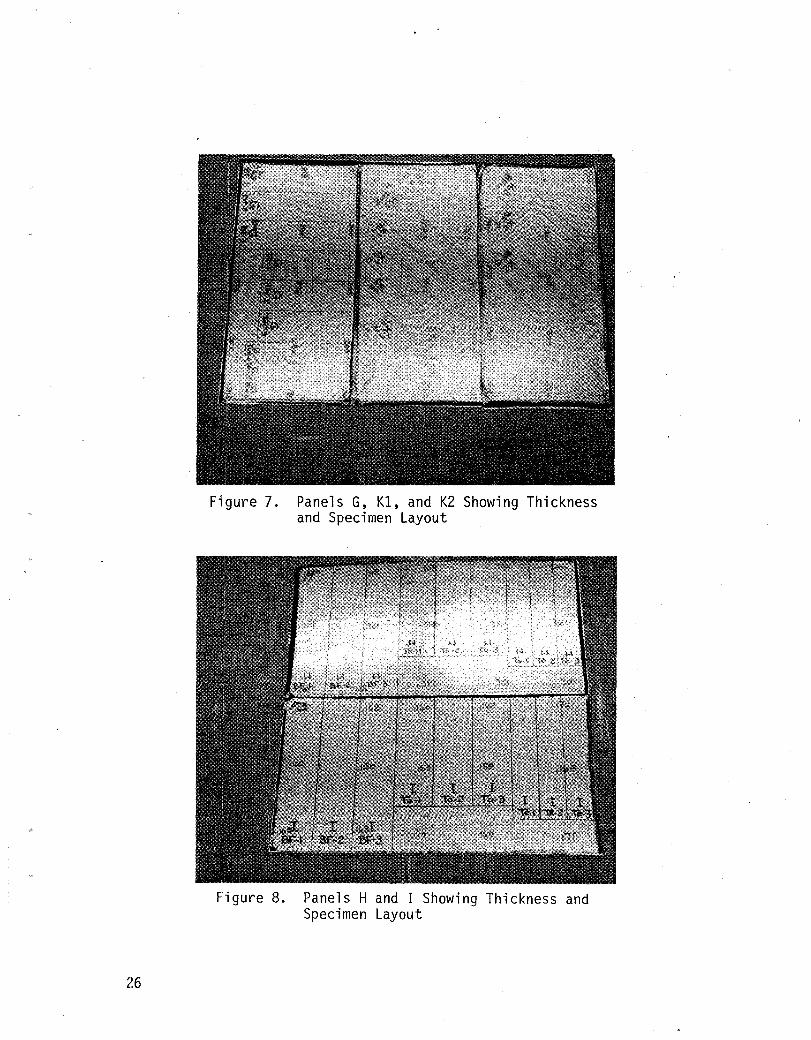
Figure 7. Panels G, Kl, and K2 Showing Thickness and Specimen Layout
Figure 8. Panels H and I Showing Thickness and Specimen Layout
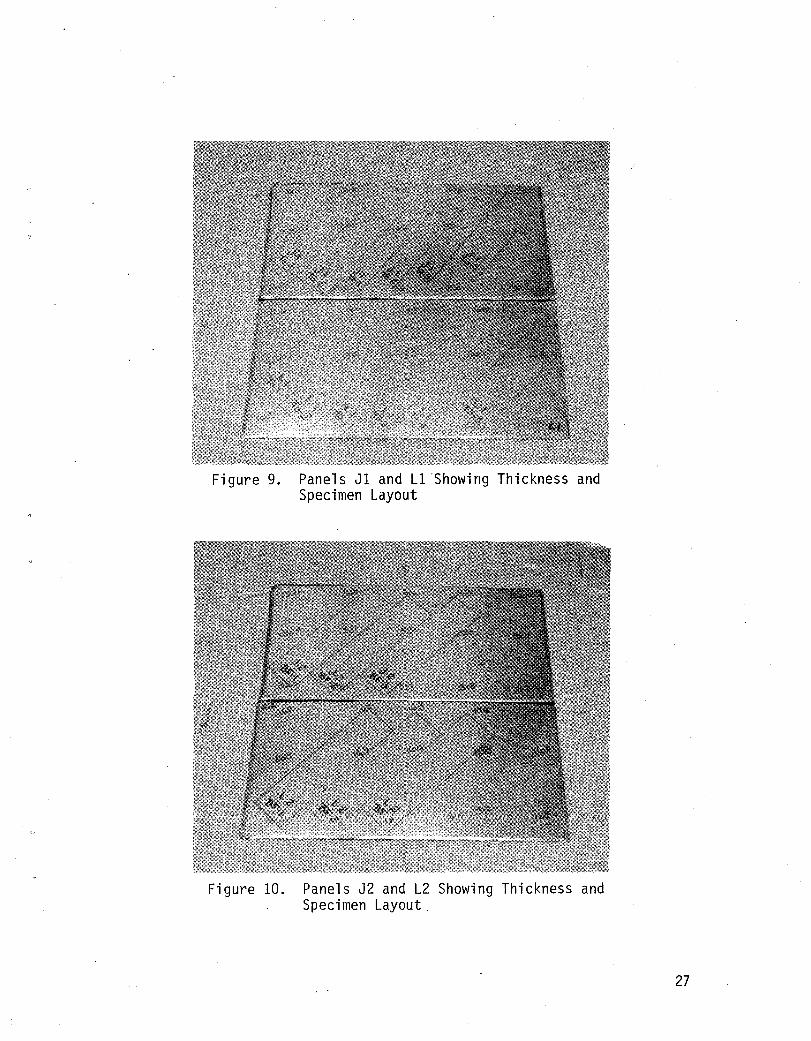
Figure 9. Panels Jl and Ll 'Showing Thickness and Specimen Layout
Figure 10. Panels J2 and L2 Showing Thickness and Specimen Layout,
27

28
Figure 11. Tensile Test Set-up Showing Instron Tester
Figure 12. Close-up of Dimple Sheet Tensile Test
en f:. « c.. ~
en en w z tt .. i= en ...J « z 0 en z w I-X w
11.0 X 10⁴
(16 X 106)
9.7 X 10⁴
(14 X 106)
8.3 X 10⁴
(12 X 106)
69 X 104
(10 X 106)
5.5 X 10⁴
(8 X 10⁶)
4.1 X 10⁴
(6 X 10⁶)
2.8 X 10⁴
(4 X 10⁶)
1.4 X 10⁴
(2 X 10⁶)
FOIL THICKNESS = 0.076 MM (0.003 INCH)
ORAD /10"1 ~
4, 0.785 RAD
CORE ORIENTATION
o
P
o~----~~----~------~------~------~------~------~ o 1016 (0040)
2.032 (0080)
3.048 (0.120)
4064 (0.160)
5.080 (0.200)
CORE DIMPLE DEPTH.I MM (INCH)
6.096 (0240)
Figure 13. Dimpled Sheet - Effect of Dimpled Depth and Orientation of Dimples
29

en !:. <! CI.. ~
en en w Z,
~I i= ... en,
~I z 0 en z w I-X w
30
41 X 104
(6 X 10⁶)
3.4 X 10⁴
(5 X 10⁶)
2.8 X 10⁴
(4 X 10⁶)
2.1 X 10⁴
(3 X 10⁶)
1.4 X 10⁴
(2 X 10⁶)
0.69 X 10⁴
(1 X 10⁶)
DIMPLE DEPTH = 4.445 MM (0.175 INCH) NOMINAL
/l CORE ORIENTATION
0.785 RAD
(45°)
o~ ______ ~ ____ ~~ ____ ~ ______ ~ ______________ ~ ______ __ o 0.0127 0.0254
(0.0005) (0.0010) 0.0381 (0.0015)
0.0508 0.0635 (0.0020) (0.0025)
CORE FOIL THICKNESS, MM (INCH)
0.0762 (0.0030)
Figure 14. Dimpled Sheet - Effect of Foil Thickness and Orientation of Dimples

en ~ -
11.7 X 10⁴
(170 X 103)
<t: 11 0 X 104
~ (16.0 X 10³)
en en w Z
~ 103 X 104
t; (15.0 X 10³) ...J <t: z ~ 9.7 X 10⁴
ffi (14.0 X 10³) l-X w
9.0 X 10⁴
(13.0 X 10³)
CORE FOI L THICKNESS = 00762 MM (0.003 INCH)
/ CORE ORIENTATION
o------~------~------~----~------~------~----~ o 1016 (0040)
2.032 (0.080)
3048 (0.120)
4064 (0.160)
5080 (0200)
CORE DIMPLE DEPTH, MM ,(INCH)
6096 (0.240)
Figure 15. Extensional Stiffness - Single Layer Stiffness Versus Dimple Depth
31

12.4 X 10⁴
(18.0 X 10³)
en 11.7 X 10⁴ ~
(170X 103
) <{ Il. ~
en 11.0 X 10⁴ en
w Z (16.0 X 10³) u.. u.. i= en ...J
103 X 104 <{ ... z
(15.0 X 10~! 0 en Z w l-X
9.7 X 10⁴ w
(14.0 X 10³)
9.0 X 10⁴
(13.0 X 10³)
•
32
o
CORE DIMPLE DEPTH = 3480 MM TO 3861 MM (0.137 INCH TO 0.152 INCH) 3.683 MM (0.145 INCH)
ORAD A
(0°)
t 0.785 RAD
(45°)
000/ 000
o 0 0 0 o 0 0
/l CORE ORIENTATION
0.785 RAD (45°)
00127 0 0254 0.0381 00508 0.0635 0 0762 (0 0005) (0 001 0) (0.0015) (0.0020) (0.0025) (0.0030)
CORE FOIL THICKNESS, MM I (INCH)
Figure 16. Extensional Stiffness - Single Layer Stiffness Versus Core Foil Thickness

-: 11.0 X 10⁴
(16.0 X 10³)
10.3 X 10⁴
(150 X 103)
en ~
97 X 104 q:
(140 X 103) a.. :E
en en w
9.0 X 10⁴ z u. u. (13.0 X 10³) i= en ...J q:
.Z 83 X 10
4 0 en (12.0 X 10³) z w l-X w
76 X 104
(11.0 X 10³)
6.9 X 10⁴
(10.0 X 10³)
o 1.016 (0040)
CORE FOIL THICKNESS = 0.0762 MM (0.003 INCH)
2032 (0.080)
0.785 RAD (45°)
3.048 4.064 (0.120) (0.160)
CORE DIMPLE DEPTH, MM (INCH)
/t CORE ORIENTATION
5.080 6096 (0.200) (0.240)
Figure 17. Extensional Stiffness - Double Layer Stiffness Versus Dimple Depth
33
11.0 X 10⁴
(16.0 X 10³)
10.3 X 10⁴
(15.0 X 10³)
en ~
« 9.7 X 10⁴ c..
(14.0 X 10³) :2 en en W z
90 X 104 u.. u.. i= (13.0 X 10³) en ..J « z 0
83 X 104
en z (12.0 X 10³) W l-X W'
76 X 104
(11.0 X 10³)
6.9 X 10⁴
(10.0 X 10³)
,-
o
34
CORE DIMPLE DEPTH = 3.480 MM TO 3.988 MM (0.137 INCH TO 0.157 INCH)
ORAD
(0°)
(45°) t 0.785 RAD
000/ 0 0 0
0 0 o 0 0 o 0
/ ! CORE ORIENTATION
00127 (00005)
0.0254 0.0381 0.0508 (0 0010) (0 0015) (00020)
0.0635 (0.0025)
CORE FOIL THICKNESS, MM (INCH)
0.0762 (00030)
Figure 18. Extensional Stiffness - Double Layer Stiffness Versus Core Foil Thickness

p
/
VARIATioN IN SLOPE ~/ /' DEPENDING ON JUDGEMENT /'/' .. / /'
/ /. /
/ /
/ / /'
h /'
/ /
/
/ /' / /'
/ /'/'.------
~ /' /'
V//'/'
S Figure 19. Load Versus Strain, Extensional Stiffness Test Data
Figure 20. Beam Flexure Test Set-up
35

en co ..J
N z - -z
I N :E
jjj
en en w Z u. u. r;; (!) z 0 z w co
36
4.59 (1600)
4.02 (1400)
3.44 (1200)
2.87
(1000)
2.30 (800)
1.72
(600)
1.15
(400)
0.57 (200)
CORE FOIL THICKNESS = 0.0762 MM (0.003 INCH)
ORAD (0°)
t 0.785 RAD (45°)
000/ 000
o 0 0 0 o 0 0
/l CORE ORIENTATION
O~ ____ ~ ______ ~ ______ ~ ____ ~ ______ -L ______ ~ ____ ~
o 1.016 (0040)
2032 (0.080)
3.048 (0.120)
4064 (0.160)
5.080 (0200)
CORE DIMPLE DEPTH, MM (INCH)
6.096 (0.240)
Figure 21. Bending Test - Single Layer EI Bending Stiffness Versus Core Dimple Depth
en CD ...J I
N z
z I
N ::E
-w en en w z u. u. i= en C!l Z C z w CD
459
(1600)
402 (1400)
3.44
(1200)
2.87
(1000)
2.30 (800)
1.72 (600)
1.15 (400)
057
(200)
DIMPLE DEPTH = 3.454 MM TO 3.912 MM (0.136 INCH TO 0.154 INCH)
ORAD (0°)
t 0.785 RAD (45°)
000/ 000
o 0 0 0 o 0 0
/l CORE ORIENTATION
O~ ____ -...J~ ____ -...J~ ____ -...J ______ ~ ______ ~ ______ ~ ______ ~
o 0.0127 (00005)
00254 (00010)
0.0381 00508 (O.0015) (O.0020)
0.0635 0 0762 (0.0025) (0.0030)
CORE FOIL THICKNESS, MM'(lNCH)
Figure 22. Bending Test - Single Layer EI Bending Stiffness Versus Core Foil Thickness
37
en c:c ...J
N
~I
z1 I
N .. :E
w' vi en w Z u.. u.. i= en (!) z c z w c:c
38
22.96
(BOOO)
20.09
(7000)
17.22
(6000)
1435 (5000)
1148
(4000)
861
(3000)
5.74
(2000)
287 (1000)
CORE FOIL THICKNESS = 0.0762 MM (O.003 INCH)
ORAD
(0°)
t 0.785 RAD
(45°)
000/ o 0 0
o 0 0 0 o 0 0
/l CORE ORIENTATION
O~ ____ ~~ ____ ~~ ____ ~ ______ ~ ______ ~ ______ ~ ______ ~
o 1.016 (0040)
2.032 (0080)
3.048 (O.120)
4064 (O.160)
5080 (O.200)
CORE DIMPLE DEPTH, MM (INCH)
6096 (024O)
Figure 23. Bending Test - Double Layer EI Bending Stiffness Versus Core Dimple Depth

en III ..J I
2009 (7000)
17.22 (6000)
('II 14.35 z - (5000) z I
('II
:E _ 11.48 w en (4000) en w Z u.. u..
~ (!J z is z
8.61 (3000)
~ 5.74 (2000)
287 (1000)
DIMPLE DEPTH = 3.607 MM TO 3.912 MM (0142 INCH TO 0.154 INCH)
ORAD
(0°)
t 0.785 RAD
(45°)
000/ 000
o 0 0 0 o 0 0
/ CORE ORIENTATION
o~ ______ ~ ____ ~~ ____ ~~ ____ ~ ______ ~ ______ ~ ______ ~ o a 0127 a 0254 a 0381 00508
(0.0005) (0 0010) (0.0015) (0.0020) 00635 (0 0025)
CORE FOIL THICKNESS. MM (INCH)
0.0762 (0.0030)
Figure 24. Bending Test - Double Layer EI Bending Stiffness Versus Core Foil Thickness
39
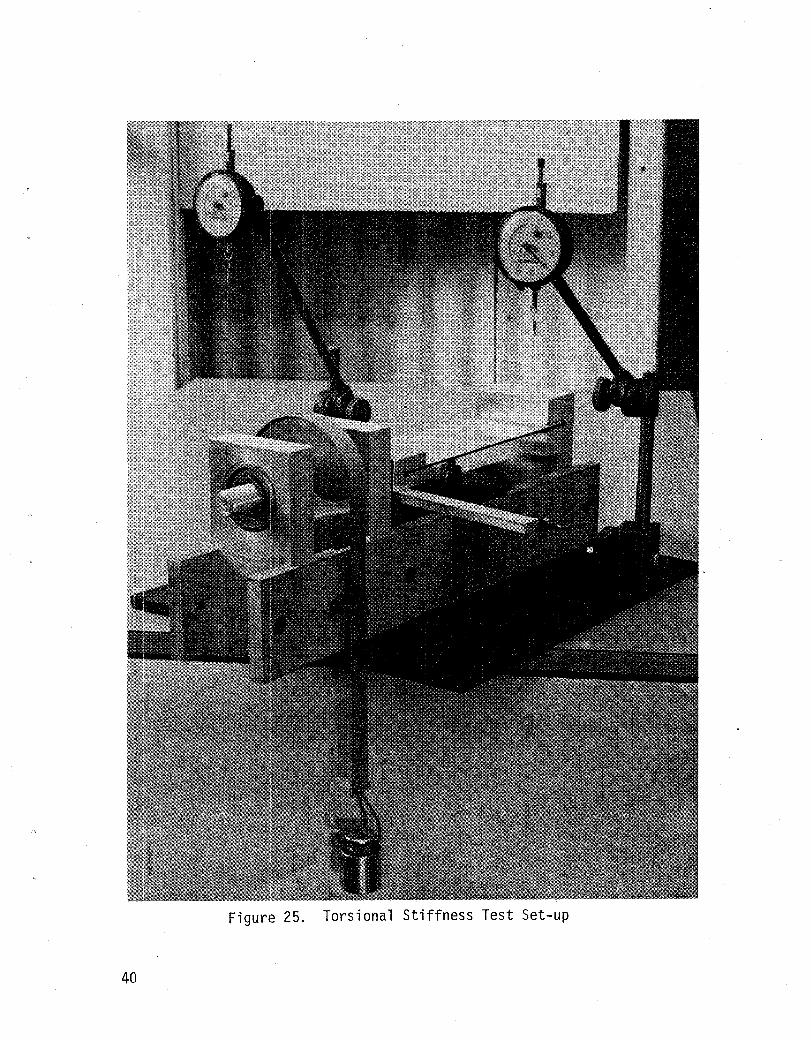
Figure 25. Torsional Stiffness Test Set-up
40
-fJ) co -I
I ('II
z -Z I
('II
~
cd ...., en fJ) w z LL LL
i= fJ)
-I « z 0 fJ)
a: 0 I-
459
(1600)
402
(1400)
3.44 (1200)
287
(1000)
2.30 (800)
172
(600)
1.15
(400)
0.57 (200)
CORE COIL THICKNESS ='0.0762 MM (0003 INCH)
ORAD
(0°)
t 0.785 RAD (45°)
0°0/ 000
o 0 0 0 o 0 0
/! CORE ORIENTATION
o~ ____ ~~ ____ ~ ______ ~ ______ ~ ______ ~ ______ ~ ____ ~ o 1.016
(0.040) 2.032 (0.080)
3048 (0.120)
4.064 (0.160)
5080 (0.200)
CORE DIMPLE DEPTH, MM (INCH)
6096 (0240)
Figure 26. Torsion Test - Single Layer JG Torsional Stiffness Versus Core Dimple Depth
41
•
•
42
rn !Xl ...J
459 (1600)
4.02
(1400)
I 3.44 NZ (1200)
Z I
N :E -- 287 ~. (1000)
en rn w Z u. u.
Ii;
2.30
(800)
...J < Z a 1.72 rn a: (600)
~
1.15
(400)
0.57 (200)
DIMPLE DEPTH = 3.657 MM TO 4039 MM (0144 INCH TO 0.159 INCH)
ORAD (0°)
t 0.785 RAD (45°)
000/ 000
o 0 0 0 o 0 0
/l CORE ORIENTATION
0.785 RAD (45°)
o~----~~----~------~------~------~------~--------o 0.0127 (0.0005)
0.0254 0.0381 00508 0.0635 0.0762 (0.001 0) (0.0015) (0.0020) (0.0025) (0 0030)
- -CORE FOIL THICKNESS, MM (INCH)
Figure 27. Torsion Test - Single Layer JG Torsional Stiffness Versus Core Foil Thickness
(J) en -I
I N
12.92 (4500)
11.48 (4000)
1005
(3500)
z 861 -z (3000) I
N :: ~ 7.18
~ (2500) w z u. u. t; 574 -I (2000) « z o (J)
a: 4.31
~ (1500)
2.87 (1000)
1.44
(500)
CORE FOIL THICKNESS = 0.0762 MM (0.003 INCH)
0.785 RAD (45°)
H
/l CORE ORIENTATION
o~ ____ ~ ______ ~ ______ ~ ____ ~ ______ ~ ______ ~ ____ ~ o 1016
(0.040) 2.032 (0.080)
3048 (0.120)
4.064 (0.160)
5.080 (0.200)
CORE DIMPLE DEPTH. MM '(INCH)
6096 (0.240)
Figure 28. Torsion Test - Double Layer JG Torsional Stiffness Versus Core Dimple Depth
43

Ci) co -I I
N z --
z I
N ~
t5 -,
en en w Z LL LL
i= en -I <t z 0 en a: ~
44
12.92 (4500)
11.48 (4000)
10.05 (3500)
8.61
(3000)
7.18 (2500)
5.74 (2000)
4.31 (1500)
2.87 (1000)
1.44 (500)
DIMPLE DEPTH = 3.581 MM TO 3886 MMI,IO.l44 INCH TO 0153 INCH)
ORAD (00)
t 0.785 RAD (45°)
000/ 000
o 0 0 0 o 0 0
/t CORE ORIENTATION 0.785 RAD
(45°)
o~------~----~~----~------~~----~~----~------~ o 00127 00254 00381 00508 00635 00762 (0 0005) (0.0010) (0 0015) (0 0020) (0.0025) (0.0030)
CORE FOIL THICKNESS, i MM (INCH)
Figure 29. Torsion Test - Double Layer JG Torsional Stiffness Versus Core Foil Thickness
1. Report No. 2. Government Accession No.
NASA CR-165866 4. Title and Subtitle
Extensional, Bending and Twisting Stiffness of Titanium Multiwall Thermal Protection System (TPS)
7. Author(s)
J. E. Meaney
3. Recipient's Catalog No.
5. Report Date
4Qril 1982 6. Performing Organization Code
8. Performing Organization Report No.
1-------------------------------1 10. Work Unit No. 9. Performing Organization Name and Address
Rohr Industries, Inc. P. O. Box 878 Chula Vista, CA 92012
11. Contract or Grant No.
NASI - 15646 ~_--_----__ --------------------I 13. Type of Report and Period Covered
12. Sponsoring Agency Name and Address
National Aeronautics and Space Administration Langley Research Center Hampton, Virginia
15. Supplementary Notes
Langley Technical Monitor: John Shideler Interim Report
16. Abstract
Contractor Report 14. Sponsoring Agency Code
A test program was conducted which determined the extensional, bending and torsional stiffness of various titanium multiwall sandwich configurations. The test methods and results are described.
17. Key Words (Suggested by Author(s))
Liquid Interface Diffusion (LID) Multiwall Sandwich, Stiffness Thermal Protection System
18. Distribution Statement
Unclassified Unlimited
19. Security Classif. (of this report) 20. Security Classif. (of this page) 21. No. of Pages 22. Price
Unclassified Unclassified
N-305 For sale by the National Technical Information Service, Springfield, Virginia 22161

End of Document