extension of continental lithosphere: a model for two … · journal of geophysical research, vol....
TRANSCRIPT
JOURNAL OF GEOPHYSICAL RESEARCH, VOL. 91, NO. B5, PAGES 4826-4838, APRIL 10, 1986
Extension of Continental Lithosphere' A Model for Two Scales of Basin and Range Deformation
M.T. ZUBER I AND E.M. PARMENTIER
Dept. of Geological Sciences, Brown University, Providence, Rhode Island
R.C. FLETCHER
Center jbr Tectonophysics, Texas A&M University, College Station, Texas
We develop a model for deformation in an extending continental lithosphere that is stratified in density and strength, assuming a rheology consistent with seismic focal depths and experimental flow laws. The model demonstrates that necking instabilities at two wavelengths will arise due to the presence of a strong upper crust and upper mantle separated by a weak lower crust. The magnitudes of the instabilities are directly related to strength contrasts within the lithosphere, while the dominant wavelengths of necking are controlled mainly by the thicknesses of the strong layers. The results are applied to the Basin and Range Province of the western United States where two scales of deformation can be recognized, one corresponding to the spacing of ranges and the other to the width of tilt domains. A Bouguer gravity ano- maly and associated regional topography with a wavelength comparable to the width of tilt domains has also been recognized. For plausible density and strength stratifications, our results show that the horizontal scale of short wavelength necking is consistent with the spacing of individual basins and ranges, while that of the longer wavelength necking is consistent with the width of tilt domains. We thus suggest that Basin and Range deformation may be controlled by two scales of extensional instability. Extension in the weak lower crust in this model is laterally displaced from regions of upper crustal extension. The resultant horizontal shearing in the lower crust may be a mechanism for the initiation of low-angle extensional detachments.
INTRODUCTION
The continental lithosphere is stratified in both density and strength. In this study, we examine the implications of this stratification for large-scale extensional deformation of the litho- sphere. In a previous study, Fletcher and Hailer [1983] treated the lithosphere as a strong surface layer of uniform strength and density overlying a weaker substrate of the same density. Their study showed that unstable extension, or boudinage, results in the concentration of extension into regions with a regular spac- ing determined primarily by the thickness of the strong layer. A more realistic strength stratification of the continental litho- sphere would consist of a strong upper crust and upper mantle separated by a weak lower crust, with the density of the crust less than that of the mantle. If a strong surface layer necks at a given wavelength, then another strong region at depth may introduce a second wavelength of necking. In this study, we evaluate the conditions required for the growth of two wave- lengths of necking instability and apply this hypothesis to the Basin and Range Province, which, as we will presently describe, exhibits two scales of periodic deformation.
Strength Stratification of Continental Lithosphere
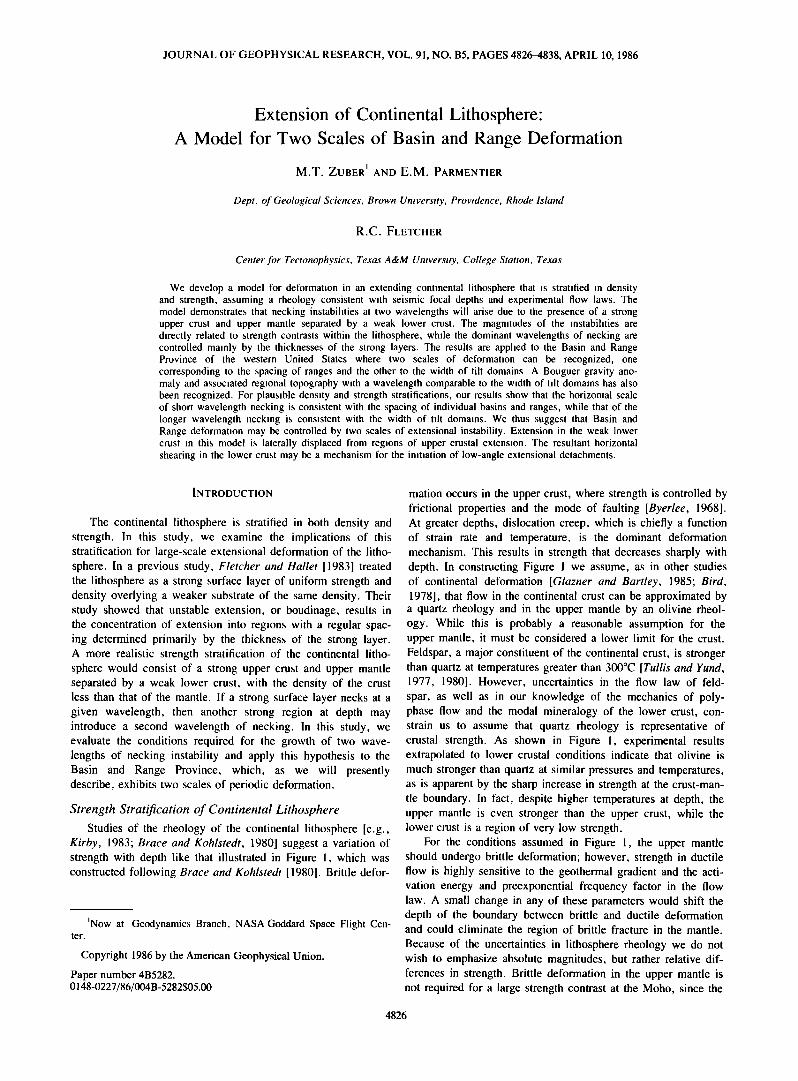
Studies of the theology of the continental lithosphere [e.g., Kirby, 1983; Brace and Kohlstedt, 1980] suggest a variation of strength with depth like that illustrated in Figure 1, which was constructed following Brace and Kohlstedt [1980]. Brittle defor-
INow at Geodynamics Branch, NASA Goddard Space Flight Cen- ter.
Copyright 1986 by the American Geophysical Union.
Paper number 4B5282. 0148-0227/86/004B-5282505.00
mation occurs in the upper crust, where strength is controlled by frictional properties and the mode of faulting [Byerlee, 1968]. At greater depths, dislocation creep, which is chiefly a function of strain rate and temperature, is the dominant deformation mechanism. This results in strength that decreases sharply with depth. In constructing Figure 1 we assume, as in other studies of continental deformation [Glazner and Bartley, 1985; Bird, 1978], that flow in the continental crust can be approximated by a quartz theology and in the upper mantle by an olivine theol- ogy. While this is probably a reasonable assumption for the upper mantle, it must be considered a lower limit for the crust. Feldspar, a major constituent of the continental crust, is stronger than quartz at temperatures greater than 300øC [Tu!!is and Yund, 1977, 1980]. However, uncertainties in the flow law of feld-
spar, as well as in our knowledge of the mechanics of poly- phase flow and the modal mineralogy of the lower crust, con- strain us to assume that quartz theology is representative of crustal strength. As shown in Figure 1, experimental results extrapolated to lower crustal conditions indicate that olivine is much stronger than quartz at similar pressures and temperatures, as is apparent by the sharp increase in strength at the crust-man- tle boundary. In fact, despite higher temperatures at depth, the upper mantle is even stronger than the upper crust, while the lower crust is a region of very low strength.
For the conditions assumed in Figure 1, the upper mantle should undergo brittle deformation; however, strength in ductile flow is highly sensitive to the geothermal gradient and the acti- vation energy and preexponential frequency factor in the flow law. A small change in any of these parameters would shift the depth of the boundary between brittle and ductile deformation and could eliminate the region of brittle fracture in the mantle. Because of the uncertainties in lithosphere theology we do not wish to emphasize absolute magnitudes, but rather relative dif- ferences in strength. Brittle deformation in the upper mantle is not required for a large strength contrast at the Moho, since the
4826

ZUBER ET AL ' EXTENSION OF CONTINENTAL LITHOSPHERE 4827
LITHOSPHERIC STRENGTH
•- o':5 (MPa) -,soo -,ooo -500 o 500 ooo
ß ß ß ß E ß ß ß ! 1
compress tension
60
Fig. 1. Strength of the continental lithosphere with a crustal thickness of 30 km, •;•x= 10 -•s s -• and a geothermal gradient of 15 ø K km • Flow laws were taken from Brace and Kohlstedt {19801. Major contrasts in strength occur (1) between the brittle upper crust and ductile lower crust, (2) at the crust-mantle boundary, and (3) within the mantle. Such strength contrasts may lead to the growth of instability during uniform extension.
ductile strength of olivine is significantly greater than that of quartz at the same PT conditions.
A zone of low strength in the continental lithosphere is also consistent with seismic results. In a study of the distribution of earthquake focal depths in continental regions not associated with recent subduction zones, Chen and Molnar [1983] found the upper crust and upper mantle to be seismically active and the lower crust to be essentially aseismic. They interpreted the aseismic lower crest as a weak region which deforms by ductile flow. Thus both experimental and observational evidence indi- cate that the continental lithosphere will consist of a strong upper crust and mantle separated by a weak lower crust.
Basin and Range Province
As with other regions of continental extension, the Basin and Range exhibits high heat flow, extensive volcanism, regional uplift, and widespread normal faulting. Details of the structure and geophysics of this area are summarized by Eaton [1982], Zoback et al. [1981], Stewart [1978], Thompson and Burke [1974], and others. Modem Basin and Range topography, which is regularly spaced and has a crest to trough amplitude of about 1 km, initiated at about 13 Ma [Zoback et al., 1981] and trends generally N-S in the northern part of the province and NW-SE in the south. The area is also marked by a broad-scale regional tilt pattern of major Cenozoic fault blocks, which strike gener- ally parallel to the basin and range structure. Stewart [1980] recognized these alternating regions of consistent tilt directions, called tilt domains, which are continuous over distances of
50-500 km along strike. The tilt domains are separated by "antiformal" and "synformal" axes, which are shown schemati- cally in Figure 8. Within a given tilt domain, fault blocks dip away from antiformal and toward synformal axes. Transverse zones, which are characterized by an absence of major tilted blocks and by changes in fault patterns and topographic grain, strike parallel to the extension direction and separate regions of differing tilt. In some places, transverse zones follow regional
lineament patterns; however, in many cases the zones are not associated with identified structural features.
The spacings of the ranges and tilt domains are summarized in Figure 2. Tilt domain spacings, shown in the top histogram, were measured between antiformal axes and synformal axes, normal to strike, from Stewart's [1980] Figure 1. Distances between domain boundaries range from as little as 50 km to almost 500 km, but most cluster around 200 km. This is in con-
trast to the distances between individual ranges, shown at the bottom of Figure 2. This histogram, reproduced from Fletcher and Hallet [1983], shows that ranges are separated by an aver- age of about 30 km, or about 1/6 the spacing of the tilt domains.
In a previous study of large-scale extension in the Basin and Range, Fletcher and Hallet [1983] treated the lithosphere as a strong plastic layer overlying a weaker viscous substrate of the same density. Using flow laws for a range of rock types, they found that the lithosphere extends unstably producing regions of enhanced and reduced extension. This study showed that the dominant wavelength of the necking which arises due to unsta- ble extension is consistent with the spacing of individual basins and ranges.
On the basis of our results for extension of a strength and density stratified lithosphere, we suggest that tilt domains may also be the surface expression of boundinage-like deformation in the Basin and Range, with a wavelength greater than the spacing of ranges. We suggest that the development of this sec- ond, longer wavelength of instability may be related to a strong region of the upper mantle separated from the strong upper crust by a weak lower crust. Kinematic models of basin and range structure have been proposed which address the relationship between the ranges and tilt patterns [Anderson et al., 1983; Zoback et al., 1981; Stewart, 1980, 1978, 1971]. To our
knowledge, however, no mechanical models have been proposed to explain the distribution of large-scale tilted fault blocks. In the present study we examine the possibility that
SPACING OF TILT DOMAINS 8 Mean-194Km
N-27
4
cr I00 200 3,00 x(Km)
8 SPACING OF RANGES
:::::::::..I..::::::::::::::::: Mean--:51 Km 6 ::::::::::::::::::::::::: N 27
4 !ii}ii}i i 71 er and Hallet (1983)
0 '. , , •:0 ,• 6b x(Km)
Fig. 2. Spacings of large-scale deformational features in the Basin and Range Province. The spacings of tilt domains (top) are distances between successive antiformal boundaries and synformal boundaries measured from Figure I of Sten'art 11980]. Spacings between successive ranges (bottom) are reproduced from F/etcher and Ha/let 11983].

4828 ZUBER ET AL.' EXTENSION OF CONTINENTAL LITHOSPHERE
unstable extension of continental lithosphere leads to two scales of deformation, one of which corresponds to the spacing of ranges and the other to the spacing of tilt domains. We show that stresses associated with the long wavelength deformation result in differences in resolved shear stress on oppositely dip- ping high-angle normal faults forming individual basins and ranges. Greater slip on faults with higher resolved shear stress could result in the observed rotation or tilting of high-angle fault blocks. Recently, Froidevaux [1985] has suggested a boudinage- like thermal structure of the upper mantle on the basis of gravity anomaly patterns. The 200 km wavelength gravity anomaly identified on the maps of Hildenbrand et al. [1982] coincides approximately with spacing of tilt domains and thus may also be related to the longer wavelength of deformation (see Figure 8).
MODEL FORMULATION
We examine a model of the continental lithosphere which, as shown in Figure 3, is composed of three layers and a substrate. The crust consists of two layers of thickness h• and h2, each with a uniform density (@, @•=@2) and strength (x, x•>x2). The mantle consists of a layer of thickness h3 overlying either a semi-infinite half-space with uniform strength and density (J model) or a half-space in which the strength decreases exponen- tially with depth (C model). In the former case, the strong man- tle region is represented as a layer of uniform strength, and the strength decreases discontinuously to a lower uniform value in the substrate. In the latter, mantle strength is everywhere contin- uous but falls to zero at depth. Models with either uniform or exponentially varying strength were chosen because analytic solutions can b• obtained for the flow in each layer, thus avoid- ing the need for a fully numerical solution. Neither model is an exact representation of the rheological structure shown in Figure 1. Variations in the strength of the lithosphere in regions of uni- form composition are not abrupt, as suggested by the use of dis- crete layers. However, the rapid decrease in strength with depth associated with ductile flow results in a relatively rapid transition from strong to weak. As will be shown later, both models result in similar dominant wavelengths and instability growth rates.
XeU !
EXTENSION MODEL
I
I
Fig. 3. Model of a density and strength-stratified lithosphere. The lithosphere consists of a strong upper crust, weak lower crust, and a strong upper mantle over a weaker mantle substrate. Density differences occur at the free surface and crust-mantle boundary. Horizontal exten- sion causes initially planar layers to deform into sinusoidal shapes.
Instability in the lithosphere, extending horizontally at a uni- form or mean rate •;xx, occurs due to the amplification or growth of small, random disturbances along initially planar interfaces. As the disturbances grow, the interfaces deform sinu- soidally with an amplitude A. We assume (1) two-dimensional flow, and (2) the amplitude of the disturbance to be small com- pared to its wavelength. Mathematically, this is regarded as the superposition of an unstable secondary or perturbing flow on the mean or primary flow which describes the uniform extension of the medium. This linearized formulation describes only the incipient stages of unstable extension.
Linearization
In the linearized problem, stresses and strain rates for the total flow are written
(1)
where an overbar designates the mean flow and a tilde the per- turbing flow. For thermally activated creep the relationship between the principal stresses Ol and o3 and the strain rate e has the form
e = A (ol - o3) n exp(-Q/RT) (2)
where A is the frequency factor, Q is the activation energy, R is the gas constant, T is the temperature, and n is the stress expo- nent. The principal stresses and the strain rate are related by the the viscosity It as
o,-o3 = 4½• (3)
By substituting (3) into (2) to eliminate the strain rate, the vis- cosity can be defined
1/4) A (O 1 -- 03)l-n exp(Q/RT) (4)
In an isotropic viscous fluid the stress-strain rate relationships are written
% = 2[t%- p6,j (5)
where p is the hydrostatic stress. By combining the expressions for the normal stresses in (5) and the incompressibility condition (e,, = 0), the strength (x) is defined
x = (Oxx-Ozz)/2 = 2g•:xx (6)
In the present study, Ozz=0 in excess of the hydrostatic stress since the mean extension is entirely in the x direction. As described by Fletcher and Hallet [1983], the relationship between the perturbing stresses and strain rates is obtained by substituting (1) and (6) into (5), expanding, and retaining terms to first order in
Oxx = (u/n) (•;xx/•;xx) - P
Oz• = (u/n) (•zz/•xx) - P (7)
Ox•: ß (•xz/•xx)

ZUBER ET AL ' EXTENSION OF CONTINENTAL LITHOSPHERE 4829
TABLE 1. Dimensionless Parameters
Parameter Definition
Sl (•)1 -- @o)ghl/%l
S2 (02- @l)ghl/%2
S3 (03- @2)ghl/%3
S4 (04- @3)ghl/•4
R• x•/x2
R2 x•/x3
R3 Xl/X4
e •-Jhl
A solution for the perturbing flow is found by requiring that the perturbing stresses and strain rates satisfy the equilibrium equa- tions and the incompressiblity and compatibility conditions.
Growth Rate Factor
The amplitude of vertical deformation at an interface A,(k',t) is proportional to the exponential of the mean horizon- tal strain •;xxt as
A,(k',t) oc exp[(q-1)•;xxt] (8)
where q is the growth rate factor and t is time. The growth rate factor determines the rate of amplification of a disturbance with dimensionless wave number k' (=2jrh•/•,). If q>l, the litho- sphere will extend unstably, and the instability will grow fastest at the wave number at which q is maximized. At each value of the wave number there are four values of q (equal to the num- ber of interfaces); however, in general only one value will be positive and thus contribute to the growth of instability. The determination of q requires a solution of a linear system of equations to satisfy the velocity and stress matching conditions at each interface as discussed in Appendix 1.
The problem in its most general form is described by a num- ber of dimensionless parameters which are listed in Table 1. S•-S4 are ratios of buoyancy to strength at each of the interfaces. In the present problem, S2 and S4 are set to zer9 because the crust and mantle are of uniform density. In the J model, R•-R3 are the ratios of the strengths of the various regions. In the C model, the strength at the mantle layer-sub- strate interface is continuous so R3 = 1. Here fl0w is determined by the parameter or, the ratio of the viscosity decay depth in the substrate to the strong layer thickness. The values of these parameters determine whether the lithosphere will extend unsta- bly, and if so, the dominant wavelength at which necking will Occur.
To consider the implications of strength and density stratification in the continental lithosphere, we determine the growth rate spectrum q(k')• for g range of model parameters. The results are then applied, to discuss the observed wavelengths of deformation in the Basin find Range Province.
RESULTS
We consider a strength stratification for the continental litho- sphere like that shown in Figure lYn which a• strong upper crUs[
.
and mantle 19yer are separated by a weak lower crust. ,Uniform density is assumed within the crus.t (@c = 2950 kg m -3) and man- tle (@m=3200'kg m-3). The upper crust is treated as a po;Wer
law fluid in which the stress exponent nr--> oz. This approxi- mates a perfectly plastic material in which deformation can be discontinuous across sliplines, which may represent incipient faults. A perfectly plastic material may ,thus be a representative rheological model for a region which deforms by pervasive faulting [Chappie, 1978]. In this study, we use a value of n• = 10 4 for reasons discussed in Appendix 1. The lower crust and the mantle are modeled as uniform power law fluids with n2 = n3- n4 = 3, which is characteristic of deformation due ,to dis- location creep.
To examine the general character of the deformation in the strength jump (J) model, we assume that the lower crust is 100 times weaker than the upper crust, that the upper mantle is twice as strong as the upper crust, and that the mantle substrate is 50 times weaker than the upper crust. England [1983], in a study of continental extension, also assumed that the upper mantle made the greatest contribution to lithospheric strength. Strength estimates are based on experimental resul•ts and on the observed stress released in shallow earthquakes (tens of mega- pascals). In the continuous strength (C) model, the mantle layer has a thickness of 5 km and the e-folding depth of the substrate is taken to be 6 km in accordance with Figure 1.
Figure 4 shows the growth rate factor q as a function of the dimensionless wave number k' for three mantle strength stratifications: curves a and b are for lithospheres with strong upper crustal and upper mantle layers for the J and C models, respectively, and curve c is the same as curve a but without the strong mantle layer. In both curves a and b the grow•th rate spectrum has two peaks: that at the larger wave number repre- sents a short wavelength instability which arises due to necking of the strong upper crust and that at the smaller wave number is a longer wavelength instability which arises due to the presence of the strong region of the upper mantle. The J and C models have differen, t physical behavior at large wave numbers as dis- cussed in Appendix 2 for the simple case of a single strong layer. However, as shown in Figure 4, both models predict sim- ilar p,hysical behavior for wave numbers of interest (k'<Jr) and similar dominant wavelengths. The similarity of these two mod- els suggests that the existence of two wavelengths of instabilty
½
20o \
q
o I 2 3
--- J model -- C model
Fig. 4. Growth rate of the instability q as a function of dimensionless wave number k' for three mantle strength stratifications: curve a, J model with strong upper crustal and upper mantle layers (R• = 100, =0.5, R• = 50); curve b, C model with strong upper crustal and upper mantle layers (R• = 100, R, =0.5, •c = !.2): curve c, J model with a sin- gle strong surface layer (R• = 100, R 2 =R• = 1). For all models S•: 1.2, S•=0.05 S-,:S4=0, !l• = l04, and 11,=11•=114=3.

4830 ZUBER ET AL.' EXTENSION OF CONTINENTAL LITHOSPHERE
CRUSTAL DEFORMATION FIELD
Illllil!\\\\II llllllllll•\\\\• I !
Moho
b) long X
c )comb ,ned Moho
Zl I I i1•1 • Fig. 5. Displacement fields associated with {a) short, (b) long, and (c) combined wavelengths of necking instability. The short wavelength of deformation clearly shows the necking of the brittle upper crust. Note the presence of shearing within the lower crust in Figure 5c.
does not depend on details of the strength stratification. The growth rate spectrum for a single strong layer overlying a sub- strate with uniform strength (Figure 4 curve c) has a magnitude everywhere greater than that for the multilayer J model, and the dominant wave number occurs at a point intermediate between the short and long wavelength peaks. This suggests that the presence of a strong subsurface layer acts to damp out instability over a range of wave numbers with the greatest damping occurring at the minimum between the short and long wavelength peaks. The long wavelength instability is thus driven by necking of the surface layer rather than by the ten- dency of the mantle to neck. The mantle layer flexes in response to necking of the surface layer but does not itself undergo necking. Further discussion of the mechanism of long wavelength deformation is presented in Appendix 1.
Figure 5 shows the crustal displacement fields associated with the short, long, and combined dominant wavelengths for the J model. These diagrams were constructed by calculating displacements at equally spaced points on an initially rectangu- lar grid and connecting the tips of the displacement vectors. In the linearized theory, the amplitudes of the long and short wavelength deformation are each proportional to their initial amplitude. Thus the relative amplitudes are not determined by the growth rate factors alone. The amplitudes shown in Figure 5 were chosen to clearly show the character of deformation at each wavelength. In all cases the mean extension has been removed, so that areas of apparent compression are in reality areas of minimum extension. In the short wavelength case, the effect of necking of the strong upper crust, as well as the change in deformational style at the brittle-ductile transition can be clearly observed. In the longer wavelength case, the upward deflection of the crust-mantle boundary is the most obvious deformational feature. Flow in both the crust and underlying mantle can be represented in terms of the amplitude of the verti- cal velocity W(k',z) at a given wave number. W(k',z), normal- ized to unity at the surface (z--0), is shown in Figure 6 for the two dominant wave numbers in the J model. For the short
wavelength deformation, the vertical velocity at the base of the crust and in the underlying mantle is small, as reflected in the small relief on the crust mantle boundary in Figure 5a. The ver- tical velocity of the long wavelength deformation reaches a
maximum within the strong mantle layer, and its magnitude decays exponentially with depth. The deformation penetrates to a depth comparable to its wavelength.
Our interpretation of these results in the context of Basin and Range deformation is that the shorter wavelength instability may control the spacing of individual ranges, and the longer wave- length may control the spacings of long wavelength topography and the tilt domains. In the short wavelength case, regions of enhanced extension and thinning correspond to basins, and regions of apparent thickening correspond to ranges. In the long wavelength case, the peaks and troughs in the long wavelength displacement profile define regions in which fault blocks change tilt directions as determined by the sense of horizontal shear. Regions of alternating positive and negative surface gradient correspond to Stewart's tilt domains.
We will now consider the influence of lithosphere structure and theology on the the predicted wavelengths of deformation focusing primarily on the J model. In an extending layered medium, an increase in density with depth across an interface reduces the vertical component of the perturbing flow and acts to confine deformation to within regions of uniform density. This effect is most notable at short wavelengths where, as illus- trated in Figure 5, the relative magnitude of deformation at the surface and at the crust-mantle boundary is significantly different for the long and short wavelength deformation. The long wavelength deformation has a large amplitude at the crust- mantle boundary relative to that at the surface. In contrast, the short wavelength deformation nearly vanishes at the crust-mantle boundary. This result, which predicts a flat Moho on a scale of tens of kilometers, holds for any reasonable range of crust-mantle density contrasts (i.e., @ .... t<@ .... fie). The density increase across the crust-mantle boundary also acts to decrease the overall magnitude of the growth rate spectrum, but for the range of physically realistic conditions the effect is small.
The amplitudes of the peaks in the growth rate spectrum are directly related to the strengths of the strong layers. The effects of variations in lithospheric strength on the behavior of the growth rate function in the absence of buoyancy forces and with h• = h2 = h• = 15 km for the J model are summarized in Table 2.
a) W(k -I 0
6O
90
z) b) W(k',z)
crust
mantle 30
6O
90
Fig. 6. Vertical velocity as a function of depth for (a) short and (b) long wavelengths of instability. Amplitudes are normalized to a sur- face value of unity. Note that for the short wavelength case defor- mation is a maximum in midcrustal regions, while for the long wave- length case deformation peaks in the lower crust and strong upper mantle.

ZUBER ET AL..' EXTENSION OF CONTINENTAL LITHOSPHERE 4831
TABLE 2. Effect of Strength Contrasts on the Dominant Growth Rate Factor
R1 R2 R3 qai qd 2 kal' kd2' •ai,km •a2,km
100 0.5 50
100 1 50 100 1 100
100 0.5 100
100 2 50
100 2 100
50 0.5 50
50 1 50
50 2 50
25 0.5 25
25 0.5 50
25 1 25
25 1 50
25 1 25 20 0.5 50 20 1 50
20 2 50
20 1 20
10 0.5 50
10 1 50
10 1 100
10 0.5 100
10 2 100 10 2 50
10 1 10
5 1 5
2 2 2
1 1 1
91.13
105.14
117.85
97.13
119.71
140 65
59 38
70 91
82 26
35 64
39 93
41 33
48.90
41.33
35.34
43.34
51.06
34.54
23.89
29.12 32.05
25.59
38.33
33.86
19.20
10.35
4.48
2.00
167.19 0.60 2.30
167.94 0.60 2.30 167.94 0.60 2.30
167.19 0.60 2.30
169.40 0.65 2.30
169.42 0.65 2.30
85.42 0.60 2.30
86.18 0.65 2.30
87.65 0.70 2.30
43.43 0.65 2.30
43.43 0.60 2.30
44.17 0.70 2.30
44.17 0.65 2.30
44.17 0.70 2.30
34.94 0.65 2.30
35.70 0.65 2.25
37.23 0.70 2.25 35.68 0.70 2.25
17.86 0.65 2.25
18.61 0.70 2.25
18.61 0.65 2.25
17.86 0.65 2.25
20.13 0.70 2.15
20.12 0.75 2.15
18.58 0.75 2.25
9.91 0.80 2.15 4.52 1.10 1.85
-- 1.55
157 41
157 41
157 41
157 41
145 41
145 41
157 41
145 41
135 41
145 41
157 41
135 41
145 41
135 41
145 41
145 42
135 42
135 42
145 42
135 42
145 42
145 42
135 44
126 44
126 42 118 44
86 51
61 --
R•, R2, and R 3 are defined in Table 1. qd, kd', and ka are the dominant growth rate factor, wave number, and wavelength, respectively.
The function is most sensitive to changes in the strength of the upper crust relative to that of the other regions. An increase in the relative strength of the upper crust increases the amplitudes of both short and long wavelength peaks but increases the shorter wavelength peak to a greater extent. A relative increase in the strength of the strong upper mantle region decreases the amplitudes of both peaks, but the decrease is less for the shorter wavelength peak. The variation in the dominant wavelengths due to the differences in assigned layer strength is not significant.
The presence of a weak lower crust between a strong upper crust and mantle is a prerequisite for a second wavelength of instability. As shown in Figure 4, a single strong layer over a uniform viscous substrate has a growth rate spectrum with a sin- gle maximum. A strength-stratified crust overlying a uniformly strong mantle is an insufficient condition for two scales of insta- bility; the mantle must contain a region of high strength, though as shown by the growth rate spectrum for the C model, a dis- continuity in strength within the mantle is not required.
If the lower crust and mantle deform by steady state creep the value of n is probably about 3, but variations within the range 1-3 have a negligible effect on instability growth rate. For a single layer embedded in a weaker medium both with n---1, the growth rate is less than unity in the absence of an unstable density stratification [Smith 1977]. On this basis it might be expected that no necking instability would occur in a strong upper mantle with a linear theology. However, a strong upper mantle region with n3-I beneath a surface layer with large n• does show a weak long wavelength instability, which supports the contention that this instability is driven by necking of the surface layer (see Appendix 1). If brittle deformation occurs in the upper mantle, as suggested in Figure 1, then flow in this region may be best described by a large stress exponent.
Increasing n in the strong part of the mantle enhances the insta- bility of the longer wavelength of deformation.
Dominant wavelengths are determined primarily by layer thicknesses. Smith [1979] showed that a single layer with large n embedded in a weaker medium with n= 1 extends unstably with a wavelength to layer thickness ratio of •./h--•4. While our results agree with Smith's for the limiting case, the presence of another strong layer (with finite n) and the inclusion of buoy- ancy forces at the interfaces markedly change this ratio. Table 3 is a compilation of the dominant wavelengths of instability for a range of layer thicknesses with R• = 100, R2 = 0.5, and R3 = 50 for the J model. Buoyancy effects have been included here because the dimensionless parameters S•-S4 are a function of layer thickness. Results show that •./h• ranges from approximately 2.8 to 3 for the shorter wavelength instability and from about 11 to 15 for the longer wavelength instability. However, •./(h• + h2 + h3)'-•4 for the longer wavelength.
Increasing the thickness of the surface layer, keeping the thicknesses of the other layers constant, increases both dominant wavelengths. A decrease in the thickness of the strong upper mantle increases the longer dominant wavelength but has no apparent effect on the shorter wavelength. A decrease in the thickness of the weak lower crust may slightly decrease the dominant wavelength for the longer wavelength peak, but again the shorter wavelength peak is unaffected. These results show that the lower crustal and upper mantle layers influence the behavior of the growth rate spectrum to a lesser extent than does the surface layer.
APPLICATION TO THE BASIN AND RANGE PROVINCE
We will now consider the observed structure of the Basin
and Range Province in terms of these results and examine possi-

4832 ZUBER ET AL.' EXTENSION OF CONTINENTAL LITHOSPHERE
TABLE 3. Dominant Wavelengths for a Range of Layer Thicknesses
h•,km h2,km h3,km
5 5 5
kdl' kd2' kd!,km ka,,km _
2..•'•6• 58 14 o si
kd2/hl
2.78
10 5 5
10 10 5 10 5 10
5 5 10
5 10 5
5 10 10
10 10 10
15 10 10
15 15 10
15 10 15
10 10 15
10 20 10
10 15 15
15 15 15 20 15 15 20 20 15
20 15 20
15 15 20
15 20 15 15 20 20
20 20 20
20 10 10
20 20 10
20 10 20 10 10 20
10 20 10
10 20 20
25 20 20
25 25 20 25 20 25 20 20 25
20 25 20
20 25 25
25 25 25
0 5o
0 46
052
0 56
052
0 54
0 5o
0.48
0.46
0.50
0.52
0.48
0.50
0.48
0.46
0.44
0.46
0.48
0.46
0.48
0.46
0.46
0.42
0.50
0.52
0.46
0.50
0.46
0.44
0.46
0.48
0.44
0.46
0.46
224 2 24 2 22
2 26
2 26
2 26
2 20
2:20 2.20
2.20
2.22
2.22
2.22
2.20
2.16
2.16
2.16
2.20
2.18
2.18
2.16
2.16
2.16
2.16
2.22
2.22
2.22
2.12
2.12
2.12
2.16
2.16
2.16
2.12
126 28 137 28 121 28
56 14
60 14
58 14
126 28
196 43
205 43
188 43 121 28
131 28
126 28
196 43
273 58
286 58
273 58
196 43
205 43 196 43
273 58
273 58
299 58
251 58 121 28
137 28
126 28
341 74
357 74
341 74 262 58
286 58
273 58
341 74
12.56 •.b6 12.08 11.22
12.08
11.64
12.57
13.09
13.66
12.57
12.08
13.09
12.57
13.09
13.65
14.28 13.66
13.09
13.66
13.09
13.66
13 66
14 96
12 57
12 08
13 66 12 57
13 66
14 28
13 66
13.09
i4.28
13.66
13.66
2.80
2.80
2.83
2.78
2.78
2.78
2.83
2.86
2.86
2.86
2.83
2.83
2.83
2.86
2.91
2.91
2.91
2.86
2.88
2.88
2.91
291
291
291
283
283
283
2 96
2 96
2 96
291
291
291
2 96
hi, h 2, and h3 are the thicknesses of the strong upper crust, weak lower crust, and strong upper mantle layers. kd' and k d are the dominant wave number and wavelength.
ble structural and geophysical implications of the style of defor- mation i'esulting from the superposition of the long and short wavelength instabilities. A 15 km thickness for the strong upper crust is reasonable both from the flow law of quartz [Brace and Kohlstedt, 1980] and the depth to which earthquakes are observed in the Basin and Range [Eaton, 1982; Smith, 1978]. For a total crustal thickness of 30 km [Eaton, 1982; Smith, 1978; Thompson and Burke, 1974] the thickness of the weak lower crest is also about 15 km. The thickness of the region of high strength in the upper mantle for both the J and C models is based on the flow law of olivine [Brace and Kohlstedt, 1980]. In the former case, a 15 km thick layer is chosen to represent a region of high strength in the mantle. In the latter case, a mantle layer thickness of 5 km and an e-folding depth of 6 km are chosen on the basis of Figure 1.
Two Scales of Deformation
The shape of the growth rate spectrum depends not on the actual strength of the layers but on their strength ratios R•, R2, and R3. For the variations in strength assumed in Table 3 and Figure 4 for the J model (R• - 100, R2 = 0.5, R3 - 50), layer thick- nesses of about 15 km correspond to wavelengths of deformation which reasonably match the observed spacings of ranges and tilt domains. The dominant wave numbers of the peaks in the growth rate spectrum in Figure 4 correspond to dis- tances of 42 and 40 km between ranges and 170 and 157 km between antiformal boundaries for the J and C models, respec-
tively. The difference is greater for the long wavelength insta- bility because longer wavelengths of deformation penetrate to greater depth and therefore sense the different mantle strength stratification in the models. In both models, the scale of the
short wavelength disturbance is overestimated and that of the long wavelength disturbance is underestimated. Better agree- ment would be obtained for a thihner brittle surface lfiyer and a thicker strong mantle layer. Strong crustal layer thicknesses of about 10 and 11 km and mantle layer thicknesses of about 18 and 8 km would be required to match the observations for the J and C models, respectively. However, given the major uncer- tainties in lithosphere rheology discussed earlier, we emphasize the existence of two wavelengths of instability rather than the parameter values which provide a numerical best fit. Since con- trasts in strength affect mainly the amplitude and not the wave- length of instability, uncertainties in our choices of S values does not strongly influence these estimates of layer thickhesses.
Amplitudes are more difficult to estimate on the basis of the present linearized model because they depend directly on initial amplitudes. It is, however, possible to establish a lower limit of the dominant growth rate factor requii'ed to produce the approxi- mate structural relief of the ranges and the largest tilt domains. For a lower limit of total Basin and Range ext•hsion of 10% and initial vertical surface perturbations in the range i0-100 m, dominant growth rate factors of qd--24 and 47 will result in ver- tical surface deformation of the order of 1 km. As summarized
in Table 2, the minimum lithospheric strength contrasts required

ZUBER ET AL.: EXTENSION OF CONTINENTAL LITHOSPHERE 4833
for qa in this range are consistent with the strength profile shown in Figure 1. We have not considered the effect of fluid pressure, which would act to reduce the effective frictional strength of the upper crust; however, for a hydrostatic value the decrease in average crustal strength would not be great enough to suppress the growth of either wavelength of instability.
Crust and Mantle Deformation
Figure 5c is a plot of the superposition of the crustal dis- placement fields and shows the combined deformation from the two wavelengths of instability. A contrast in the style of defor- mation between the plastic surface layer and the ductile lower crust is clearly visible. Regions of maximum extension are of particular interest since faulting should localize in these areas. At the surface, localized extension occurs in the short wave-
length basins. The near-surface region at the center of the dia- gram exhibits enhanced thinning because the extension for both the long and short wavelength components is a maximum there. This model thus predicts localized highly extended regions spaced of the order of the long wavelength instability. In the lower crust, areas of greatest extension occur primarily beneath ranges and are horizontally removed from regions of near-sur- face extension.
Another interesting aspect of Figure 5c is the style of defor- mation in the vicinity of the brittle-ductile transition. The super- posed long and short wavelength deformation results in enhanced horizontal shearing near the base of the strong upper crust. Localized shearing at midcrustal depths could be a mech- anism for the formation of low-angle normal faults. The location of horizontal shearing within the crust in Figure 5c is consistent with suggestions by Anderson et at. [1983] and Wer- nicke [1981] that these features root far from regions of near- surface, thin-skinned deformation. In addition, seismic reflection
profiles in the Basin and Range [Allmendinger et at., 1983, 1985] and in the Scottish Caledonides [Smythe et at., 1982] show low-angle reflectors which penetrate to midcrustal depths. Anderson et al. [1983] have suggested that the zone of decou- pling for detachments in regions such as the Sevier Desert and Raft River Valley may be the brittle-ductile transition. In this model the brittle-ductile transition is not an actual surface of
mechanical decoupling; instead, shearing is vertically distributed in the upper part of the ductile lower crust.
Shear stresses associated with the long wavelength deforma- tion provide an explanation for the tilt domains. In each tilt domain, high-angle fault blocks associated with the short wave- length deformation show a consistent direction of tilting or rota- tion. Assume that conjugate, high-angle normal faults, dipping at 550-60 ø , form initially in response to the uniform horizontal extension. Shear stresses due to the growing long wavelength deformation will cause differences in resolved shear stress on
these oppositely dipping faults. As illustrated in Figure 7, a counterclockwise shear couple on horizontal planes at depth in the crust occurs in areas where the surface slopes down to the right. Shear stresses of this sense increase the resolved shear stress on high-angle fault planes dipping to the right and reduce it on fault planes dipping to the left. The converse is true if the surface dips to the left. Therefore, motion on faults dipping in the downslope direction of the surface is preferred. Thus, in Stewart's [1980] terminology, synformal and antiformal bounda- ries will coincide with crests and troughs, respectively, of the long wavelength surface deformation.
The present model cannot be applied to explain all aspects of finite deformation, for example, features which form along
Fig. 7. Asymmetry of resolved shear stress on conjugate (dip=60 ø) faults (heavy lines) associated with surface topography which dips down to the right. The resolved shear stress is greater on the fault plane which dips in the direction of the surface topography. See text tk)r implica- tions.
preexisting structural weaknesses, such as reactivated Mesozoic thrusts. Also, the linearized model developed here can treat only the initial growth of structures and cannot account in detail for small scale features formed in areas of large horizontal exten- sion. Finally, because the model is two-dimensional, it cannot explain the presence of the transverse zones. Stewart [1980] suggests that these zones mark the northward migration of Basin and Range deformation with time and are likely related to tec- tonic stresses associated with changes in the plate boundary geometry of the western margin of North America during the Cenozoic.
Relation of Gravity Anomalies to Extensional Deformation
Gravity studies [Eaton et al., 1978] show that most of the regional topography in the Basin and Range is in approximate isostatic equilibrium. The regional Bouguer gravity signature, as depicted in maps of the filtered Bouguer gravity field of the United States [Hildenbrand et al., 1982], exhibits a N-S striking 200 km wavelength undulation which correlates with the long wavelength regional topography of the province [Eaton et al., 1978]. Eaton et al. have suggested that these long wavelength gravity anomalies are at least partially due to temperature varia- tions in the mantle. Froidevaux [1985] estimates that about 7 km of relief on the crust-mantle boundary would be required to explain the amplitude of the observed anomalies by crustal thickness variations alone. Since seismic reflection studies in
the Basin and Range [Allmendinger et al., 1983, 1985] show a relatively flat Moho, he concludes that density variations in the mantle must be responsible for the observed long wavelength gravity anomaly and estimates that about a 50 km vertical dis- placement of mantle isotherms would be required to account for the observed anomaly.
The short wavelength deformation is consistent with large vertical relief at the surface compared to that at the crust-mantle boundary. However, if the Moho also has relatively small relief at long wavelengths, ductile extension alone cannot account for the amplitude of the observed gravity anomaly. As shown in Figure 6, the vertical velocity for the long wavelength deforma- tion at the Moho is approximately equal to the maximum value in the underlying mantle. Thus the vertical relief on initially horizontal surfaces would be nearly a maximum at the Moho. if

4834 ZUBER ET AL.; EXTENSION OF CONTINENTAL LITHOSPHERE
44• I1•ø 1 I1• I1•)ø 10'6• --Syn
antiformal boundary synformal boundary Fig. 8. Tilt domains and Bouguer gravity in the Basin and Range Province. Dashed and solid lines correspond to synformal and antitk•r- mal boundaries traced from St(,n'•trt's [1980[ Figure 1. Dotted and hatched regions correspond to gravity highs and lows, respectively, taken from the map by Hihh'nbraml ctal. [1982] for all wavelengths less than 250 km. Anomalies range from approximately +35 to -35 mGals. Note that the longest and most continuous synlbrmal and anti- formal boundaries tire associaled with with gravity lows and highs, respectively.
the long wavelength gravity anomaly is due to density variations in the mantle, this suggests, in constrast to the view of Froide- vaux [1985], that convective flow generated by density differ- ences in the mantle may be required to account for the magni- tude of the anomaly. However, the long wavelength necking instability may determine the horizontal scale at which this con- vective motion subsequently occurs.
The large-scale tilt pattern, represented by synformal and antiformal boundaries, and the pattern of long wavelength grav- ity anomalies are shown in Figure 8. Although the surface struc- tures are more complicated than the gravity field, the longest, most continuous synformal and antiformal boundaries occur in areas of negative and positive gravity anomaly respectively. Seismic reflection studies help to define the shallow structure created by faulting or brittle deformation but cannot resolve deeper ductile deformation which produces no well-defined reflectors. There is thus no direct evidence that tilt domains at
the surface correspond to deeper ductile deformation. However, the spatial relationship of long wavelength gravity anomalies to surface structures suggests that these structures may be related to ductile deformation at depth.
CONCLUSIONS
An extending continental lithosphere with a density and strength stratification that is consistent with seismicity observa- tions and experimental rock deformation studies is unstable with respect to necking and will deform with two wavelengths of instability. Short and long wavelengths of deformation arise due to the presence of the strong upper crust and upper mantle regions of the lithosphere. In simple layered models of the litho-
sphere, the dominant wavelengths of necking are most strongly controlled by the layer thicknesses. The relative strengths of the layers control the amplitudes of the instabilities but only weakly affect the dominant wavelengths.
In the lower crust and mantle where dislocation creep domi- nates deformation, varying the stress-exponent in the range of 1-3 has a negligible effect on instability growth rate. In contrast to the case of a single layer in a weaker viscous material both with n= 1 which always extends stably, a strong mantle layer with n3 = 1 exhibits a weak long wavelength instability because mantle deformation is driven by unstable extension of the upper crust.
The two wavelengths of necking instability that result from strength stratification of the lithosphere may explain the forma- tion of ranges and tilt domains in the Basin and Range Prov- ince. For a discontinuous strength (J) model, thicknesses of the strong upper crust, weak lower crust, and strong upper mantle regions of the continental lithosphere of about 15 km, which are in agreement with experimental flow laws and seismic results, produce structures with wavelengths consistent with the spacings of ranges and tilt domains. Regions of localized extension at depth which arise due to necking of the strong upper crust are laterally displaced from regions of near-surface extension. The resulting localization of horizontal shearing in the upper part of the weak lower crust predicted by this model may represent incipient low-angle extensional detachments.
For short wavelength deformation, the model predicts smaller vertical relief at the crust-mantle boundary than at the surface. This is consistent with the results of recent COCORP
reflection profiling which show a relatively flat Moho in the Basin and Range. However, for long wavelength deformation, the model predicts larger vertical relief at the crust-mantle boundary than at the surface, and the vertical displacement which occurs at the Moho is nearly equal to the maximum value that occurs in the mantle. If the long wavelength gravity ano- maly in the Basin and Range cannot be attributed to variations in crustal thickness, then horizontal temperature variations due to uplift of isotherms in the necking lithosphere may provide the required density variations. However, our models predict that if relief on the Moho is small at long wavelength, unstable exten- sion of the mantle alone cannot account for the amplitude of deformation required. This suggests that convective motions in the mantle, possibly with a wavelength controlled by the neck- ing instability, may be responsible for the long wavelength gravity anomaly.
APPENDIX l: SOLUTION OF THE PERTURBING
MULTILAYER FLOW PROBLEM
We wish to determine the perturbing flow in an extending medium consisting of three viscous layers over a viscous sub- strate, each with a uniform strength. The equation for the flow in a single viscous layer with uniform effective viscosity is
D4W - 2k2(2/n•- 1)D2W + k4W -0 (AI)
where D=d/dz, k (=2r[/k) is the wave number, and W is the stream function satisfied by
cos kx
fi =-k -•Dwsinkx (A2)

ZUBER ET AL.' EXTENSION OF CONTINENTAL LITHOSPHERE 4835
where a and • are the horizontal and vertical components, respectively, of the perturbing velocity field. Equation (A1) has the general solution [Fletcher and Hailer, 1983]
W(k,z) = (A•cos 13•kz + A2sin 13•kz)exp(ot•kz)
+ (Aacos 13•kz + A4sin 13•kz)exp(-ot•kz) (A3)
where ct• = (1/n•)•/2 and 13• = (1 - 1/n•)•/2. This solution is valid for all of the layers and the substrate, but each region has a dif- ferent set of constants A•-A4 (upper crust), B•-B4 (lower crust), C•-C4 (upper mantle), and D•-D4 (mantle substrate). In the viscous substrate the stresses and velocities must be bounded as
z---->•, therefore D3 and D4 vanish. The perturbing velocity and stress components within the upper crust are
/q = [(A•cos [3•kz + A2sin [3•kz)exp(ct•kz)
+ (A3cos [3•kz + A4sin [3•kz)exp(-cttkz)] cos kx
fi = -ct•{[(A• + 6•A2) cos [3•kz
+ (A2-6•A•) sin [31kz]exp(ct•kz)
- [(A3- 6•A4) cos [3•kz
+ (A4 + 6•A3) sin [3•kz]exp(-ct•kz)} sin kx
Ozz = •:•ct•k[(A•cos [3•kz + A2sin [3•kz)exp(ct•kz)
-(A3cos [3•kz + A4sin [3•kz)exp(-ct•kz)] cos kx
(A4)
Oxz = -x•k{[(A• + 61A2) cos [3tkz
+ (A2- 6•A•) sin [3•kz]exp(ct•kz)
+ [(A3- 6•A4) cos [3•kz
+ (A4 + 6•A3) sin [3•kz]exp(-ct•kz)} sin kx
where 6• = (n• - 1)•/2. The linearization to first order in kA requires that
Oxz(X,dl) = 2'rkA I sin kx (A5)
where A I is the maximum amplitude at the ith disturbed inter- face at depth d,. The difference in density across an interface requires
(Jzz(X,dl) = (•l-I - Q,)gAi cos kx (A6)
The normal stresses are continuous, and the shear stress van- ishes at the free surface, while at the other interfaces both the stresses and velocities are continuous. This provides 14 match- ing conditions from which the coefficients can be obtained.
The rate of amplitude growth at each of the interfaces intro- duces a system of four differential equations
/•1-"'-g2xxAi + /q,(0,d•) (A7)
where ,• =dA/dt. The number of values of the growth rate factor obtained at a given wave number equals the number of equa- tions in (A7), though in general only one value of q will be greater than one and thus contribute to the growth of instability. The shape of the perturbed interface will change with time as
A I - Al(0)exp[(q-1)•;xxt], where q is the growth rate factor. By substituting the form of the perturbed interface and normalizing with respect to the mean strain rate •;xx, we rewrite (A7) as
(-1-q) A, + '&(0,dl)--0 (A8)
We wish to solve for the coefficients and the values of the
growth rate parameter, which requires the simultaneous solution of the matching conditions and the growth rate equations (A8). The coupled problem is solved by the method of static conden- sation [Bathe, 1982]. We begin with the 18x18 matrix system
Kq) -- qMq) (A9)
where K is the matrix of matching conditions and vertical velocities, q is the matrix containing the eigenvalues (growth rate factors), M is the matrix containing the coefficients of the eigenvalues, and q) is a vector of the coefficients and ampli- tudes. This system can be rewritten
aa Ka•] I(])l = q rma i1 I(]) 1 ca Kc d L 0 where ma is a 4x4 identity matrix. From (A10)
(A10)
Kcaqba + Kccq)c = 0 (A11)
and
qbc = -K•-•K•aqb• (A12)
Substitution of (A12) into (AI0) transforms the system into the standard eigenproblem
(Ka-qMa)q)a - 0 (AI3)
where
Ka = Kaa- KacKcc-•Kca (A14)
We solve (AI3) by a QR orthogonalization algorithm [Dahlquist and BjOrk, 1974]. To determine the coefficients and amplitudes, we eliminate A• from (AI0) and substitute the growth rate fac- tor obtained above. The resulting linear system can then be solved by standard methods.
The magnitude of the growth rate factor obtained from (A13) is a strong function of the stress exponent in the surface layer. In this study, we adopted a large n to approximate a perfectly plastic material, and it is useful to examine the consequences of this choice of rheology. Figure A l, which plots qd for both dominant wavelengths as a function of n•, shows that increasing n in the strong layer enhances the instability of both the long and short wavelength features. Limiting behavior is not approached until n•103 for the long wavelength instability and nl•104 for the short wavelength instability, which agrees with the results of Fletcher and Hallet [ 1983].
A decrease in n• shifts the maxima to longer wavelengths and decreases the magnitude of the growth rate spectrum at all wave numbers. The amplitude of the shorter wavelength peak is decreased significantly relative to the longer wavelength peak. As noted in the results section, a strong mantle layer stabilizes

4836 ZUBER ET AL.' EXTENSION OF CONTINENTAL LITHOSPHERE
150,
125
IOO
75
25
LIMITING BEHAVIOR
o' ....... .......
short •.'
long X
Fig. A1. Magnitude of the rate growth rate factor q as a function of the stress exponent in the surface layer n• for the conditions S• = 1.2, S• = 0.05, S_, =S4 =0, R• = 100, R_, = 0.5, and Rs = 50. Limiting behavior is not reached until nr-->104 and l0 s for the short and long wavelength maxima, respectively.
the system with respect to necking over a limited range of wave numbers, with the maximum stabilization occurring at the rela- tive minimum in q. This is suggested because, as illustrated for the J model in Figure 4, the growth rate spectrum for an extending, strong surface layer over a uniform viscous substrate envelopes and is everywhere greater than that for an extending medium with two strong layers. If the strong upper mantle acts to stabilize the flow, then both wavelengths of deformation must arise in response to necking of the surface layer. An exception to this occurs if the upper mantle, instead of the upper crust, is characterized by large n. A layered medium in which nl = n2 = n4--3 and n3---> oc has a single long wavelength instabil- ity which results in pinch and swell deformation of the mantle. In the J model, if both the surface and upper mantle layer have a large n, the growth rate spectrum exhibits a single short wave- length maximum and an inflection point at longer wavelengths. We have not been able to identify conditions which result in two discrete maxima. However, in the C model two wave-
lengths of instability will occur if both n• and n3 are large, but it is not clear whether deformation in this case is driven by simultaneous necking of the strong layers or simply by necking of the upper crust.
APPENDIX 2: COMPARISON OF MODELS WITH CONTINUOUS
AND DISCONTINUOUS STRENGTH STRATIfiCATION
In this appendix we compare models in which the strength of the substrate beneath a single strong layer (1) decreases expo- nentially with depth (C model) or (2) decreases discontinuously to a lower uniform value at the bottom of the layer (d model). The variation of strength with depth for each model is illustrated in Figure A2.
Plots of the growth rate factor as a function of wave number are shown for the continuous strength (C) model and the strength jump (d) model in Figure A3. The C model is charac- terized by two parameters, ct, the ratio of the depth • in which the effective viscosity in the substrate falls off by 1/e to the layer thickness h, and S•--(Player- @o)gh/•;, the ratio of the lit- hostatic stress at the base of the layer to the layer strength. The J model is characterized by S• and the ratio of layer strength to substrate strength, R•. Results for the J model are obtained from an analytical solution while those for the C model are. determined numerically. The two cases examined in each model are for S• =0, which corresponds to the limit of a very strong
crustal layer, and S• =6, which corresponds to a layer with finite strength, and with 0t = 0.1 and R• = 10.
In the C model, the short wavelength (k' large) components in the perturbation are greatly damped relative to the J model. For S•--0, the range of instability is 1.4 - k' - 2.9, with q reaching a maximum of about 85 at ka' - 1.9 or X/h = 3.3. Addi- tional regions of instability are separated by regions of damping, and the magnitudes of subsidiary peaks decrease sharply. The effect of finite strength in the layer is to decrease instability or increase damping at all wave numbers. For S• =6, the region of instability is reduced to a small interval 1.5 --< k' - 1.9 about the maximum at ka '= 1.6 or X/h=3.9. The maximum in the growth rate function is qa = 20.
In the J model, for the strong layer case, intervals of insta- bility are centered at ka '= (n + 1) yr/2, n=0, 1, 2,..., and for all peaks qa = 20. The value R•-- 10 used was not expected to yield the closest correspondence in qa and ka' with the C model, but was simply chosen arbitrarily in order to compare the overall behavior of the two models. The character of the structures pro- duced in each instability interval of the J model is different: ka' in the range 0 - ka' - •t results in a structure where vertical displacements at the surface and the layer-substrate interface are opposite in sign, while ka' in the range •t _ ka' - 2•t results in a structure where vertical displacements at the surface and the layer-substrate interface have the same sign. The effect of finite layer strength in the J model is to reduce in the magnitude of the instability. Although, as in the C model, the region of insta- bility in each interval is shifted toward lower k' values (longer wavelengths), the effect diminishes in successive intervals.
In the C model, the presence of a single, prominent maximum over the range of wave numbers provides an obvious choice for the wavelength of maximum instability. In the J model, we have assumed that maxima which fall in the first interval of instability, 0 - ka' - •t, correspond to features of interest, and this requires some rationalization. From a physical standpoint, the maxima at large ka' correspond to very short wavelength features, which are not observed in natural struc- ture. In the multilayered problem, the vertical stratification in strength results in two maxima in the range 0 - ka' - •t. Analysis of the variations in physical properties of the litho- sphere (strength, density, stress exponent, layer thickness)
C-Model J-Model
Fig. A2. Models of a lithosphere with a continuous decrease in strength (C model) and a jump in strength (J model) across the brittle- ductile transition.

ZUBER ET AL.' EXTENSION OF CONTINENTAL LITHOSPHERE 4837
80
40
-40
-80
IO
q
o
C-Model
' I J-Model
4 6 e k ø
Fig. A3. Magnitude of the growth rate factor q as a function of wave number k' for the C and J models with (t=().l and R• = 10. For both models S•=0 (strong layer) and =6 (finite strength layer), S2=0, ill ...... = 104, and n,,,/ ........ = 1.
described in the results section clearly associate the lower and higher wave number peaks in this range with the presence of a strong upper crust and upper mantle. Only variations in the physical properties of the surface layer affect the character of the maxima for kd'>J1;. As nlmer---• oc, the viscous resistance to deformation decreases dramatically, and the disturbance pro- duced at an interface decays slowly away from the interface and is partially reflected at the other interfaces. In this manner, deformation is controlled by a resonance effect [Smith, 1979] in which the secondary flow at an interface drives deformation at the other interfaces. It is this effect which is responsible for the presence of the higher-order peaks in the J model. The magni- tudes of successive higher-order maxima decrease exponentially when n in the surface layer has a finite value. Hence, the large wave number peaks in the J model are a consequence of the assumption of perfectly plastic behavior in the upper crust.
It is not possible to develop a comparative understanding of the nature of the instabilities of the two models because a
simple analytical solution cannot be obtained for the C model [cf. Fletcher and Hailer, 1983]. Therefore, in order to examine the similarity in behavior of the C and J models, one must rely on general numerical results for a range of parameters. In both models, kd/h increases as S! increases and falls in the narrow range rc -< kd/h • 4 for the C model and 4 -< kd/h • 8 for the J model. This ratio has a weak dependence on c• in the C model and on Ri in the J model. For both models, the magnitude of the growth rate function decreases as S• increases. In the C model, instability occurs where S I • (2Or) -I, while the J model is unstable for all S i. The latter is due to the fact that the
strength contrasts at both the upper and lower interfaces drive the instability, and necking will take place regardless of the magnitude of S•. The magnitude of the growth rate function in the C model depends on both S• and or, while for the J model, q has a weak S i dependence and a strong R l dependence. Because there is no physical connection between R i and or, it is not possible to obtain a simple relationship that describes what values of these parameters give the same qd or kd. However, both models yield qd values of the same order of magnitude for similar R• and ot -I. The above comparison indicates that though the nature of the instabilities may be different, the over-
all behavior of the models is similar within the first (small wave
number) interval of instability. The falloff in the magnitudes of higher-order peaks in the C
model may thus justify the exclusion of these peaks in the J model. We have used a strength jump to approximate a continu- ous decrease in strength with depth in the lithosphere and are therefore interested in that part of the behavior of the J model which best approximates the behavior of the C model; this occurs in the first instability interval.
Acknowledgments. This research was supported by NASA grant NSG-7605. Comments by Leigh Royden and George Thompson improved the paper. We are grateful to Bob Simpson for providing us with maps of the Bouguer gravity field in the United States.
REFERENCES
Allmendinger, R.W., H. Farmar, E. Hauser, J. Sharp, D. Von Tish, J. Oliver, and S. Kaufman, Phanerozoic tectonics of the Basin and Range-Colorado Plateau transition from COCORP data and geologic data, in Reflection Seismology and the Continental Crust: A Global Perspective, Geodynamics Set., edited by M. Barazangi and L. Brown, AGU, Washington, D.D., in press, 1985.
Allmendinger, R.W., J.W. Sharp, D. Von Tish, L. Serpa, L. Brown, S. Kaufman, J. Oliver, and R.B. Smith, Cenozoic and Mesozoic structure of the eastern Basin and Range Province, Utah, from COCORP seismic-reflection data, Geology, 11,532-536, 1983.
Anderson, R.E., M.L. Zoback, and G.A. Thompson, Implications of selected subsurface data on the structural form and evolution of some
basins in the northern Basin and Range Province, Nevada and Utah, Geol. Soc. Am. Bull., 94, 1055-1072, 1983.
Bathe, K.-J., Finite Element Procedures in Engineering Analysis, pp. 573-586, Prentice Hall, Englewood Cliffs, N.J., 1982.
Bird, P., Inititiation of intracontinental subduction in the Himalaya, d. Geophys. Res., 83, 4975-4987, 1978.
Brace, W.F., and D.L. Kohlstedt, Limits on lithospheric stress imposed by laboratory experiments, J. Geophys. Res., 85, 6248-6252, 1980.
Byerlee, J.D., Brittle-ductile transition in rocks, J. Geophys. Res., 73, 4741-4750, 1968.
Chappie, W.M., Mechanics of thin-skinned fold and thrust belts, Geol. Soc. Am, Bull., 89, 1189-1198, 1978.
Chen, W.P., and P. Molnar, Focal depths of intracontinental and intrap- late earthquakes and their implications for the thermal and mechanical properties of the lithosphere, J. Geophys. Res., 88, 4183-4214, 1983.
Dahlquist, G., and A. Bj6rk, Numerical Methods, pp. 216-217, Pren- tice-Hall, Englewood Cliffs, N.J., 1974.
Eaton, G.P., The Basin and Range province: Origin and tectonic significance, Annu. Rev. Earth Planet. Sci., 10, 409-440, 1982.
Eaton, G.P., R.R. Wahl, H.J. Prostka, D.R. Mabey, and M.D. Klein- kopf, Regional gravity and tectonic patterns: Their relation to late Cenozoic epeirogeny and lateral spreading in the Western Cordillera, Geol. Soc. Am. Mem. 152, 51-91, 1978.
England, P., Constraints on extension of continental lithosphere, J. Geophys. Res., 88, 1145-1152, 1983.
Fletcher, R.C., and B. Hallet, Unstable extension of the lithosphere: A mechanical model for Basin and Range structure, J. Geophys. Res., 88, 7457-7466, 1983.
Froidevaux, C., Basin and Range large-scale tectonics: Constraints from gravity and reflection seismology, J. Geophys. Res., in press, 1985.
Glazner, A.F., and J.M. Bartley, Evolution of lithospheric strength after thrusting, Geology, 13, 42-45, 1985.
Goetze, C., and B. Evans, Stress and temperature in the bending litho- sphere as constrained by experimental rock mechanics, Geophys. J. R. Astr. Soc., 59, 463-478, 1979.
Hildenbrand, T.G., R.W. Simpson, R.H. Godson, and M.F. Kane, Digital colored residual and regional Bouguer gravity maps of the conterminous United States with cut-off wavelengths of 250 km and 1000 km, U.S. Geol. Surv. Geophys. Invest. Map, GP-953-A, 1982.
Kirby, S.H., Rheology of the lithosphere, Rev. Geophys., 21, 1458-1487, 1983.
Proffett, J.M., Jr., Cenozoic geology of the Yerington district, Nevada, and implications for the nature and origin of Basin and Range fault- ing, Geol. Soc. Am. Bull., 88, 247-266, 1977.

4838 ZUBER ET AL.: EXTENSION OF CONTINENTAL LITHOSPHERE
Smith, Robert B., Seismicity, crustal structure, and intraplate tectonics of the interior of the western Cordillera, Mem. Geol. Soc. Am., 152, 111-144, 1978.
Smith, Ronald B., Formation-of folds, boudinage, and mullions in non-Newtonian materials, Geol. Soc. Am. Bull., 88, 312-320, 1977.
Smith, Ronald B., The folding of a strongly non-Newtonian layer, Am. J. Sci., 279, 272-287, 1979.
Smythe, D.K., A. Dobinson, R. McQuillan, J.A. Brewer, D.H. Mat- thews, D.J. Blundell, and B. Kelk, Deep structure of the Scottish Caledonides revealed by the MOIST reflection profile, Nature, 299, 338-340, 1982.
Stewart, J.H., Basin and Range structure: A system of horsts and gra- bens produced by deep-seated extension, Geol. Soc. Am. Bull., 82, 1019-1044, 1971.
Stewart, J.H., Basin-range structure in western North America: A review, Mem. Geol. Soc. Am., 152, 1-31, 1978.
Stewart, J.H., Regional tilt patterns of late Cenozoic basin-range fault blocks, western United States, Geol. Soc. Am. Bull., 91, 460-464, •980.
Thompson, G.A., and B.B Burke, Regional geophysics of the Basin and Range Province, Ann. Rev. Earth Planet. Sci. , 2,213-238, 1974.
Tullis, J., and R.A. Yund, Experimental deformation of dry Westerly granite, J. Geophys. Res., 82, 5705-5718, 1977.
Tullis, J., and R.A. Yund, Hydrolytic weakening of experimentally deformed Westerly granite and Hale albite rock, J. Struct. Geol., 2, 439-451, 1980.
Wernicke, B., Low-angle normal faults in the Basin and Range Prov- ince: Nappe tectonics in an extending orogen, Nattire, 291, 645-648, 1981.
Zoback, M.L., R.E. Anderson, and G.A. Thompson, Cainozoic evolu- tion of the state of stress and style of tectonism of the Basin and Range province of the western United States, Philos. Trans. R. Soc. London Ser. A, 300, 407-434, 1981.
R. C. Fletcher, Center for Tectonophysics, Texas A&M University, College Station, TX 77843.
E. M. Parmentier, Department of Geological Sciences, Brown Uni- versity, Providence, R102912.
M. T. Zuber, Geodynamics Branch, Code 621, NASA/Goddard Space Flight Center, Greenbelt, MD 20771.
(Received September 20, 1984; revised July 31, 1985;
accepted August 1, 1985.)