extension of ammonium and nitrate wet-fall deposition
TRANSCRIPT

2014 Extension of Ammonium and Nitrate Wet Deposition Models for the Chesapeake Bay
Watershed and Tidal Waters
Jeffrey W. Grimm, The Pennsylvania State University

Objective
Provide updated and refined estimates of nitrate and ammonium wet deposition to the Chesapeake Bay Watershed and tidal waters for the period 1983 through 2013 using revised and expanded data sourcesfor:
• Nitrous oxide and ammonia emissions and emissions transport
• Land cover and land use
• Agricultural and anthropogenic activity including fertilizedapplication and transportation
• Rainfall and other meteorological parameters
• NADP/NTN, AirMON, and PADM Precipitation chemistryobservations
Modeling effort will build upon models developed by Grimm and Lynch, 2007 for the 1985 though 2005 time span.

Subsection of 1992 National Land Cover Data set covering the central portion of the Chesapeake Bay Watershed modeling region.

Transportation Corridors and Industrial Areas Classified from NLCD Dataset

Probable Livestock Production Areas Classified from NLCD Dataset
PoultryCattleSwine

Transportation Crop Production
Swine ProductionIndustrial Development
Various NLCD Classifications Summarized to Corresponding 1km Percent Composition Layers
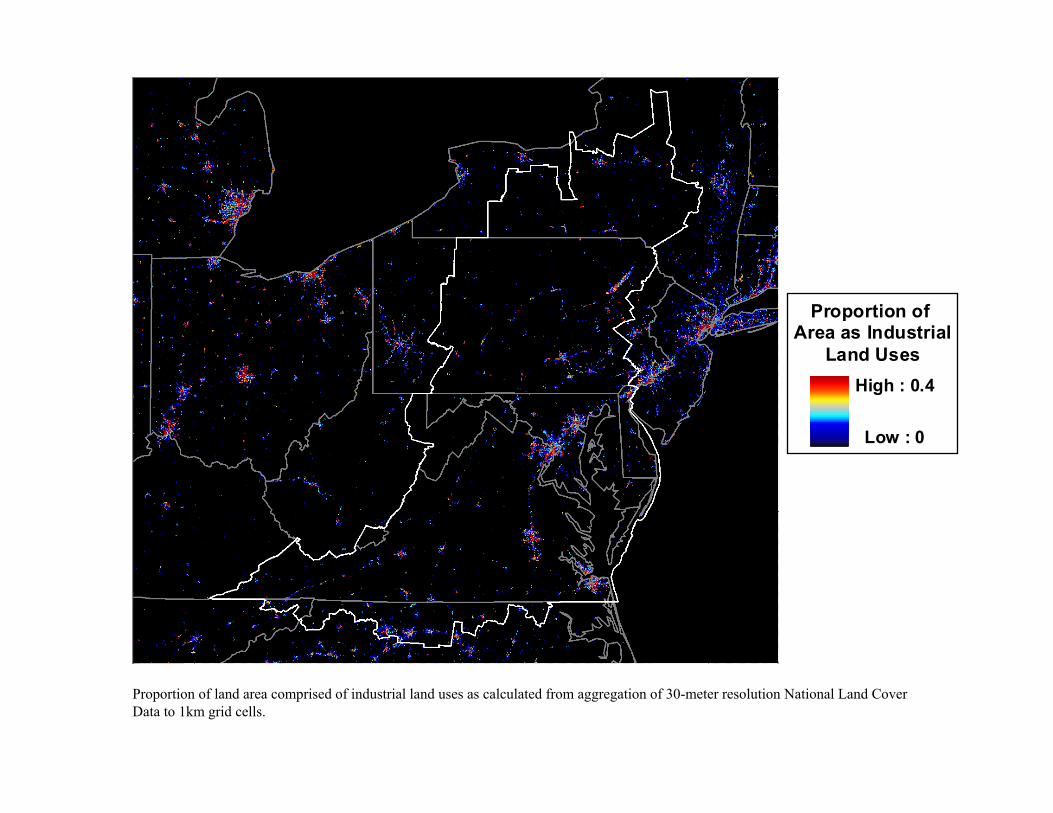
Proportion of land area comprised of industrial land uses as calculated from aggregation of 30-meter resolution National Land Cover Data to 1km grid cells.
Proportion of Area as Industrial
Land UsesHigh : 0.4
Low : 0

Proportion of land area comprised of major highways as calculated from aggregation and interpretation of 30-meter resolution National Land Cover Data to 1km grid cells.
Proportion of Area as Major
Highways
High : 0.3
Low : 0

Proportionof Area asCropland
High : 0.8
Low : 0
Proportion of land area classified as cropland as calculated from aggregation of 30-meter resolution National Land Cover Data to 1km grid cells.

Proportion of land area classified as probable livestock production areas as calculated from aggregation and interpretation of 30-meter resolution National Land Cover Data to 1km grid cells.
Proportion of Area as
Livestock Production Areas
High : 0.7
Low : 0

Allocation of 1999 transportation-related annual nitrous oxides emissions from the EPA National Emissions Inventory database to National Land Cover Data set grid cells that represent transportation, residential, and industrial/commercial land uses.
Annual Nitrous Oxides Emissions
from Transportation
Sources(tons/sq. km)
High : 50
Low : 0
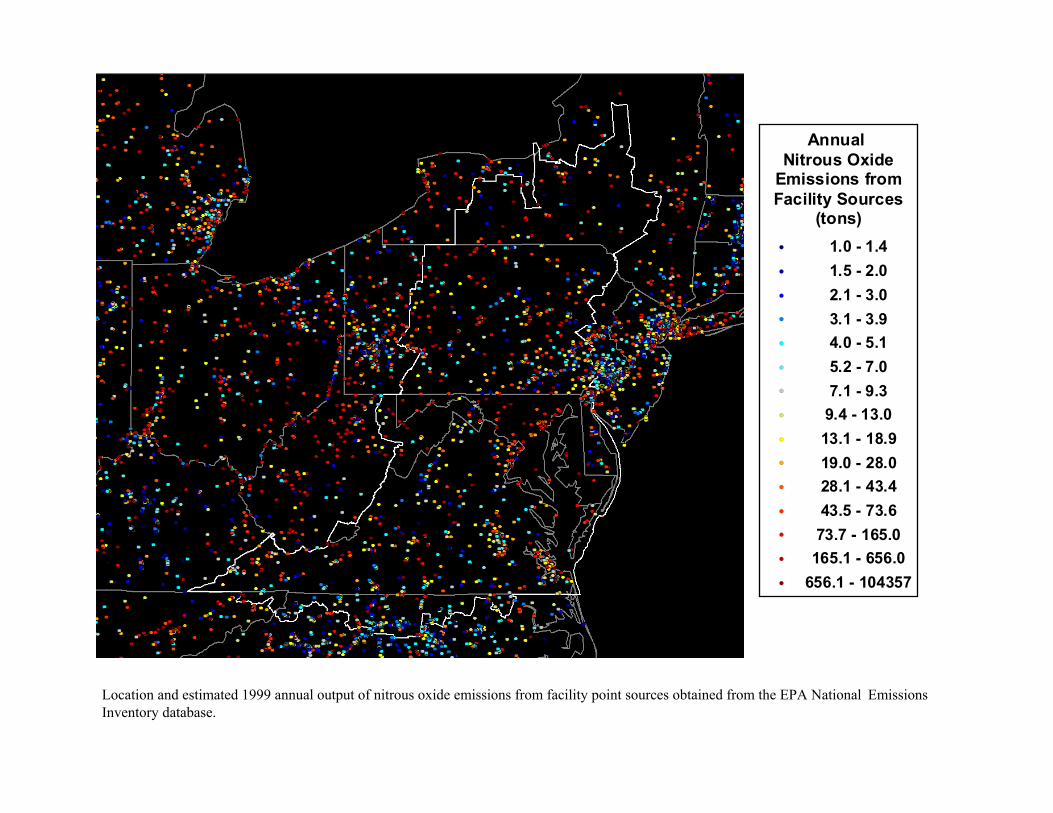
Annual Nitrous Oxide
Emissions fromFacility Sources
(tons)!( 1.0 - 1.4!( 1.5 - 2.0!( 2.1 - 3.0!( 3.1 - 3.9!( 4.0 - 5.1!( 5.2 - 7.0!( 7.1 - 9.3!( 9.4 - 13.0!( 13.1 - 18.9!( 19.0 - 28.0!( 28.1 - 43.4!( 43.5 - 73.6!( 73.7 - 165.0!( 165.1 - 656.0!( 656.1 - 104357
Location and estimated 1999 annual output of nitrous oxide emissions from facility point sources obtained from the EPA National Emissions Inventory database.

Allocation of 1999 annual ammonia area source emissions from the EPA National Emissions Inventory database to 1992 National Land Cover Data set grid cells that represent agricultural land uses (i.e., livestock production and cropland).
Annual AmmoniaEmissions from
AgriculturalSources
(tons/sq. km)High : 15
Low : 0

Annual Ammonia Emissions from
Facility Point Sources (tons)
!( 0.00 - 0.02!( 0.03 - 0.06!( 0.07 - 0.13!( 0.14 - 0.23!( 0.24 - 0.33!( 0.34 - 0.47!( 0.48 - 0.64!( 0.65 - 0.91!( 0.92 - 1.28!( 1.29 - 1.74!( 1.75 - 2.58!( 2.59 - 3.90!( 3.91 - 8.14!( 8.15 - 36.15!( 36.16 - 3614
Location and estimated 1999 annual output of ammonia emissions from facility point sources obtained from the EPA National Emissions Inventory database.

-1.25
-1.00
-0.75
-0.50
-0.25
0.00
0.25
0.50
0.75
1.00
1.25
-1.25 -1.00 -0.75 -0.50 -0.25 0.00 0.25 0.50 0.75 1.00 1.25
Predicted log10(Nitrate Concentration (mg/L))
Ob
serv
ed
log
10
(Nit
rate
Co
nc
en
tra
tio
n (
mg
/L))
Phase 1 Nitrate Wet-Fall Concentration Model Phase 2 Nitrate Wet-Fall Concentration Model
-1.25
-1.00
-0.75
-0.50
-0.25
0.00
0.25
0.50
0.75
1.00
1.25
-1.25 -1.00 -0.75 -0.50 -0.25 0.00 0.25 0.50 0.75 1.00 1.25
Predicted log10(Nitrate Concentration (mg/L))
Ob
serv
ed
log
10
(Nit
rate
Co
nc
en
tra
tio
n (
mg
/L))
Figure 27. A comparison of the of estimates from the Phase 1 and 2 daily nitrate (NO3-) wet-fall concentration model to measurements of
nitrate concentration in single event precipitation samples collected at 39 NADP/NTN sites in the Chesapeake Bay Watershed region during 1984-2005.
r2=0.4888 r2=0.5540

-2.25
-2.00
-1.75
-1.50
-1.25
-1.00
-0.75
-0.50
-0.25
0.00
0.25
0.50
-2.25 -2.00 -1.75 -1.50 -1.25 -1.00 -0.75 -0.50 -0.25 0.00 0.25 0.50
Predicted log10(Ammonium Concentration (mg/L))
Ob
serv
ed
log
10
(Am
mo
niu
m C
on
ce
ntr
ati
on
(m
g/L
))
Phase 1 Ammonium Wet-Fall Concentration Model Phase 2 Ammonium Wet-Fall Concentration Model
A comparison of the of estimates from the Phase 1 and 2 daily ammonium (NH4+) wet-fall concentration model to measurements of ammonium concentration in single event precipitation samples collected at 39 NADP/NTN sites in the Chesapeake Bay Watershed region during 1984-2005.
-2.25
-2.00
-1.75
-1.50
-1.25
-1.00
-0.75
-0.50
-0.25
0.00
0.25
0.50
-2.25 -2.00 -1.75 -1.50 -1.25 -1.00 -0.75 -0.50 -0.25 0.00 0.25
Predicted log10(Ammonium Concentration (mg/L))
Ob
serv
ed
log
10
(Am
mo
niu
m C
on
ce
ntr
ati
on
(m
g/L
)) r2=0.3878 r2=0.4763
Below NADP/NTN Analytical Detection Limit
Below NADP/NTN Analytical Detection Limit

Seasonal mean nitrate-nitrogen (NO3-N) wet-fall concentrations across the Chesapeake Bay Watershed region during 2001-2005 as estimated by the Phase 2 daily nitrate wet-fall concentration model.

Mean annual nitrate-nitrogen (NO3-N) wet-fall concentrations across the Chesapeake Bay Watershed region during four, 5-year summary periods as estimated by the Phase 2 daily nitrate wet-fall concentration model.
2001 - 2005
1990 - 1994
1995 - 1999
1984 - 1988

Seasonal mean ammonium-nitrogen (NH4-N) wet-fall concentrations across the Chesapeake Bay Watershed region during 2001-2005 as estimated by the Phase 2 daily ammonium wet-fall concentration model.

Mean annual ammonium-nitrogen (NH4-N) wet-fall concentrations across the Chesapeake Bay Watershed region during four, 5-year summary periods as estimated by the Phase 2 daily ammonium wet-fall concentration model.
1984 - 1988
1995 - 1999
1990 - 1994
2001 - 2005

What is New in the Proposed 2014 Update
• Model output time span increased from 1984 through 2005 to 1983 through 2013
• Extended precipitation chemistry data include observations since 2005
• Precipitation and surface meteorological parameters standardized to NLDAS
• New NLCD data issues for 2001, 2006, and 2011 will improve land use characterization during the latter part of modeling period and correct issues in 1992 NLCD. Additional cropland specific information will be taken from NASS Cropland Data Layer (CDL).
• Emissions data from post-2005 NEI data releases will be incorporated. Additional emissions data from sources such as Mobile-4 and CMAQ emissions inventories will be evaluated for use in model development.
• Updated fertilizer application data sets will be incorporated. The spatial and temporal distribution of fertilizer applications will also be refined using NASS crop phenology data.
• Representation of boundary-layer effects on emissions movement will be improved in the transport model.
• Model verification will be expanded to include representation of trends at long-term precipitation chemistry monitoring stations.