extension and outreach/department of economics update on cash crops coleman research group...
TRANSCRIPT

Extension and Outreach/Department of Economics
Update on Cash Crops
Coleman Research Group PresentationMar. 20, 2015
Chad HartAssociate Professor/Crop Markets Specialist

Extension and Outreach/Department of Economics
U.S. Corn Supply and Use2011 2012 2013 2014 2015
Area Planted (mil. acres) 91.9 97.3 95.4 90.6 89.0
Yield (bu./acre) 147.2 123.1 158.1 171.0 166.8
Production (mil. bu.) 12,360 10,755 13,829 14,216 13,595
Beg. Stocks (mil. bu.) 1,128 989 821 1,232 1,777
Imports (mil. bu.) 29 160 36 25 25
Total Supply (mil. bu.) 13,517 11,904 14,686 15,472 15,397
Feed & Residual (mil. bu.) 4,557 4,315 5,036 5,300 5,275
Ethanol (mil. bu.) 5,000 4,641 5,134 5,200 5,225
Food, Seed, & Other (mil. bu.) 1,428 1,397 1,367 1,395 1,410
Exports (mil. bu.) 1,543 730 1,917 1,800 1,850
Total Use (mil. bu.) 12,528 11,083 13,454 13,695 13,760
Ending Stocks (mil. bu.) 989 821 1,232 1,777 1,637
Season-Average Price ($/bu.) 6.22 6.89 4.46 3.70 3.50
Source: USDA-WAOB

Extension and Outreach/Department of Economics
U.S. Soybean Supply and Use2011 2012 2013 2014 2015
Area Planted (mil. acres) 75.0 77.2 76.8 83.7 83.5
Yield (bu./acre) 41.9 40.0 44.0 47.8 46.0
Production (mil. bu.) 3,094 3,042 3,358 3,969 3,800
Beg. Stocks (mil. bu.) 215 169 141 92 385
Imports (mil. bu.) 16 41 72 25 20
Total Supply (mil. bu.) 3,325 3,252 3,570 4,086 4,205
Crush (mil. bu.) 1,703 1,689 1,734 1,795 1,840
Seed & Residual (mil. bu.) 88 105 97 116 116
Exports (mil. bu.) 1,365 1,317 1,647 1,790 1,820
Total Use (mil. bu.) 3,155 3,111 3,478 3,701 3,775
Ending Stocks (mil. bu.) 169 141 92 385 430
Season-Average Price ($/bu.) 12.50 14.40 13.00 10.20 9.00
Source: USDA-WAOB

Extension and Outreach/Department of Economics
U.S. Wheat Supply and Use2011 2012 2013 2014 2015
Area Planted (mil. acres) 54.4 55.3 56.2 56.8 55.5
Yield (bu./acre) 43.7 46.2 47.1 43.7 45.2
Production (mil. bu.) 1,999 2,252 2,135 2,026 2,125
Beg. Stocks (mil. bu.) 862 743 718 590 691
Imports (mil. bu.) 112 123 169 160 150
Total Supply (mil. bu.) 2,974 3,118 3,021 2,776 2,966
Food (mil. bu.) 941 945 952 960 966
Seed (mil. bu.) 76 73 77 75 73
Feed & Residual (mil. bu.) 162 370 226 150 190
Exports (mil. bu.) 1,051 1,012 1,176 900 975
Total Use (mil. bu.) 2,231 2,400 2,431 2,085 2,204
Ending Stocks (mil. bu.) 743 718 590 691 762
Season-Average Price ($/bu.) 7.24 7.77 6.87 6.00 5.10
Source: USDA-WAOB

Extension and Outreach/Department of Economics
Top: 2014 YieldBottom: Change from last year
Units: Bu/acre
Corn Yields
Source: USDA-NASS
Extension and Outreach/Department of Economics
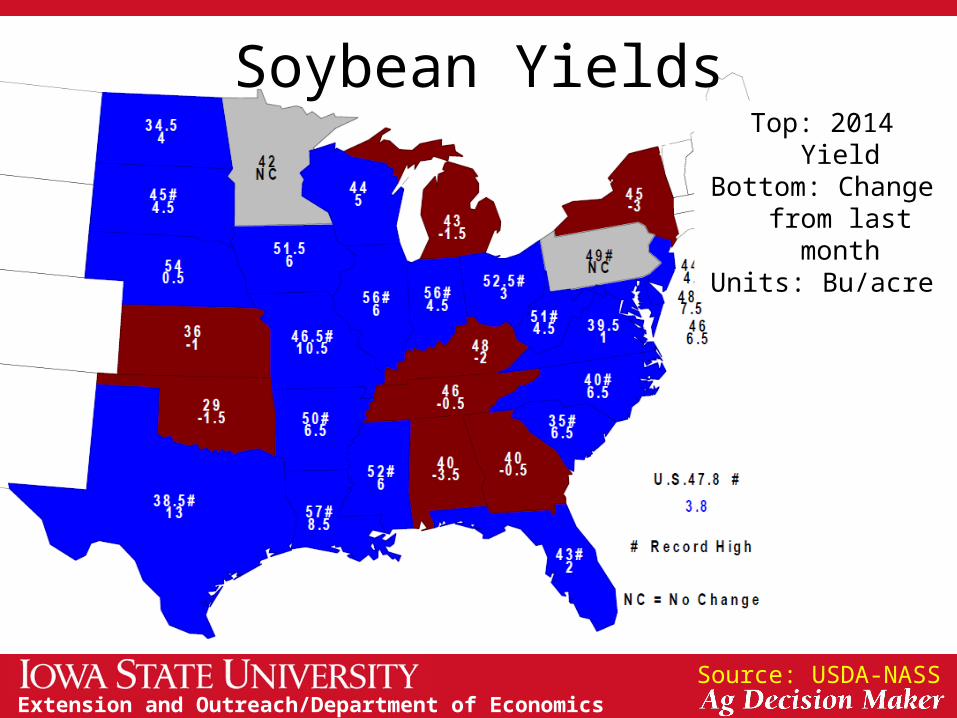
Top: 2014 YieldBottom: Change
from last monthUnits: Bu/acre
Soybean Yields
Source: USDA-NASS

Extension and Outreach/Department of Economics
Winter Wheat Acreage
Source: USDA-NASS
Top: 2015 Planted AcreageBottom: Change from last year
Units: Thousand acres

Extension and Outreach/Department of Economics
Small Grains Summary
Source: USDA-NASS
Sorghum Barley Oats
2013 2014 2013 2014 2013 2014
Area Planted (mil. acres) 8.1 7.1 3.5 3.0 3.0 2.7
Yield (bu./acre) 59.6 67.6 71.3 72.4 64.1 67.7
Production (mil. bu.) 392 433 217 177 65 70
Beg. Stocks (mil. bu.) 15 34 80 82 36 25
Imports (mil. bu.) 0 0 19 23 97 100
Total Supply (mil. bu.) 408 467 316 282 198 194
Feed & Residual (mil. bu.) 92 110 65 45 97 85
Food, Seed, & Other (mil. bu.) 70 30 155 152 75 77
Exports (mil. bu.) 212 300 14 12 2 2
Total Use (mil. bu.) 374 440 234 209 173 164
Ending Stocks (mil. bu.) 34 27 82 73 25 30
Season-Average Price ($/bu.) 4.28 3.90 6.06 5.35 3.75 3.25

Extension and Outreach/Department of Economics
World Corn Production
Source: USDA-WAOB
Country or Region2013/14 estimate
2014/15 forecast
Change from February 10
Change from 2013/14
Million Tons Percent Percent
World 989.6 989.7 -0.2 0.0United States 351.3 361.1 0.0 2.8
Foreign 638.3 628.6 -0.3 -1.5Argentina 26.0 23.5 2.2 -9.6Brazil 80.0 75.0 0.0 -6.3Mexico 22.9 23.2 0.0 1.4Canada 14.2 11.5 0.0 -19.0European Union 64.3 74.2 0.0 15.4FSU-12 46.9 43.6 -0.3 -6.9Ukraine 30.9 28.5 0.0 -7.9Russia 11.6 11.5 0.0 -1.2
South Africa 15.0 11.5 -14.8 -23.2China 218.5 215.5 0.0 -1.4India 24.3 22.5 0.0 -7.3

Extension and Outreach/Department of Economics
World Soybean Production
Source: USDA-WAOB
Country or Region
2013/14 estimate
2014/15 forecast
Change from February 10
Change from 2013/14
Million Tons Percent Percent
World 283.7 315.1 0.0 11.0United States 91.4 108.0 0.0 18.2
Foreign 192.3 207.0 0.0 7.6Argentina 54.0 56.0 0.0 3.7Brazil 86.7 94.5 0.0 9.0Paraguay 8.2 8.5 0.0 3.7Ukraine 2.8 3.9 0.0 40.6India 9.5 10.5 0.0 10.5China 12.2 12.4 0.0 1.2

Extension and Outreach/Department of Economics
World Wheat Production
Source: USDA-WAOB
Country or Region2013/14 estimate
2014/15 forecast
Change from February 10
Change from 2013/14
Million Tons Percent Percent
World 716.1 724.8 0.0 1.2United States 58.1 55.1 0.0 -5.1
Foreign 658.0 669.6 0.0 1.8Argentina 10.5 12.5 0.0 19.0Canada 37.5 29.3 0.0 -21.9Australia 26.9 24.0 0.0 -10.9European Union 143.5 155.7 0.0 8.5Russia 52.1 59.0 0.0 13.3Ukraine 22.3 24.8 0.0 11.1Kazakhstan 13.9 13.0 0.0 -6.8China 121.9 126.0 0.0 3.3India 93.5 95.9 -0.1 2.5

Extension and Outreach/Department of Economics
World Weather
Source: USDC and USDA

Extension and Outreach/Department of Economics
Hog Crush Margin
Source: ISU Extension
The Crush Margin is the return after the pig, corn and soybean meal costs.Carcass weight: 200 pounds Pig price: 50% of 5 mth out lean hog futures
Corn: 10 bushels per pig Soybean meal: 150 pounds per pig

Extension and Outreach/Department of Economics
Cattle Crush Margin
Source: ISU Extension
The Crush Margin is the return after the feeder steer and corn costs.Live weight: 1250 pounds Feeder weight: 750 pounds
Corn: 50 bushels per head

Extension and Outreach/Department of Economics
U.S. Meat Production & Prices
Source: USDA-WAOB
2014 estimate
2015 forecast
Change from February 10
Change from 2014
Production Billion pounds Percent PercentBeef 24.25 24.06 -0.7 -0.8Pork 22.84 24.12 0.1 5.6Broilers 38.55 40.03 0.2 3.8Turkey 5.76 6.08 0.0 5.5Total meat 92.17 95.07 -0.1 3.1
Prices Dollars/cwtSteers 154.56 161.88 -0.1 4.7Hogs 76.03 55.13 -1.6 -27.5
Cents/lbBroilers 104.9 99.1 -1.1 -5.5Turkey 107.6 104.9 -0.1 -2.5

Extension and Outreach/Department of Economics
Corn Export Shifts
Source: USDA-FAS

Extension and Outreach/Department of Economics
Corn Export Sales
Source: USDA-FAS

Extension and Outreach/Department of Economics
Soybean Export Sales
Source: USDA-FAS

Extension and Outreach/Department of Economics
Soy Export Shifts
Source: USDA-FAS

Extension and Outreach/Department of Economics
Wheat Export Pace
Source: USDA-FAS

Extension and Outreach/Department of Economics
Wheat Export Shifts
Source: USDA-FAS

Extension and Outreach/Department of Economics
Corn Grind for Ethanol

Extension and Outreach/Department of Economics
Renewable Fuels Standard (RFS)
Extension and Outreach/Department of Economics
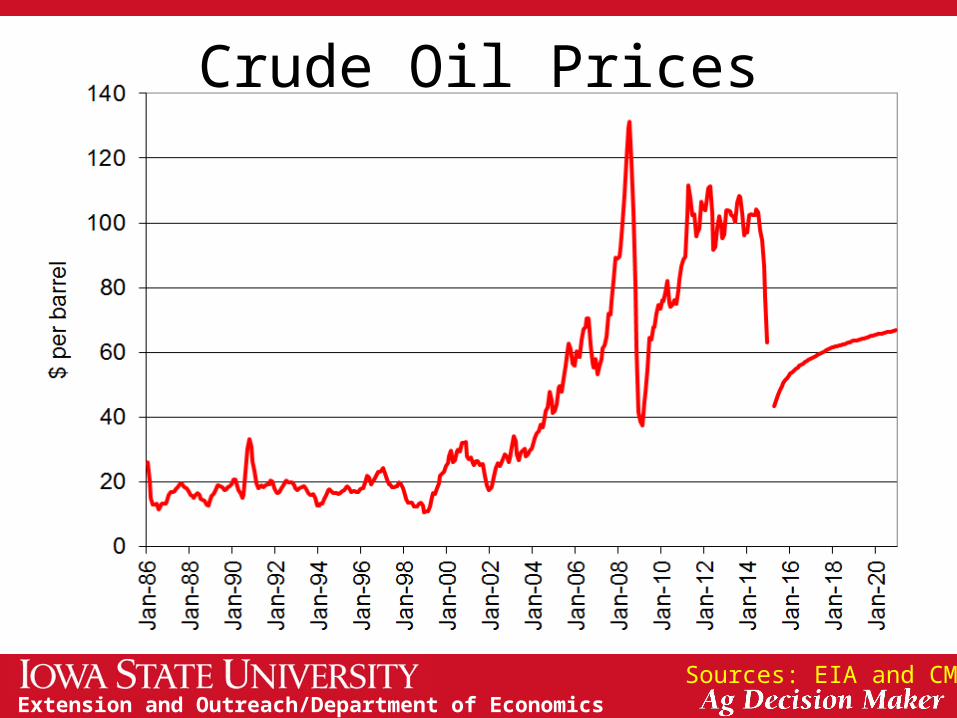
Crude Oil Prices
Sources: EIA and CME
Extension and Outreach/Department of Economics
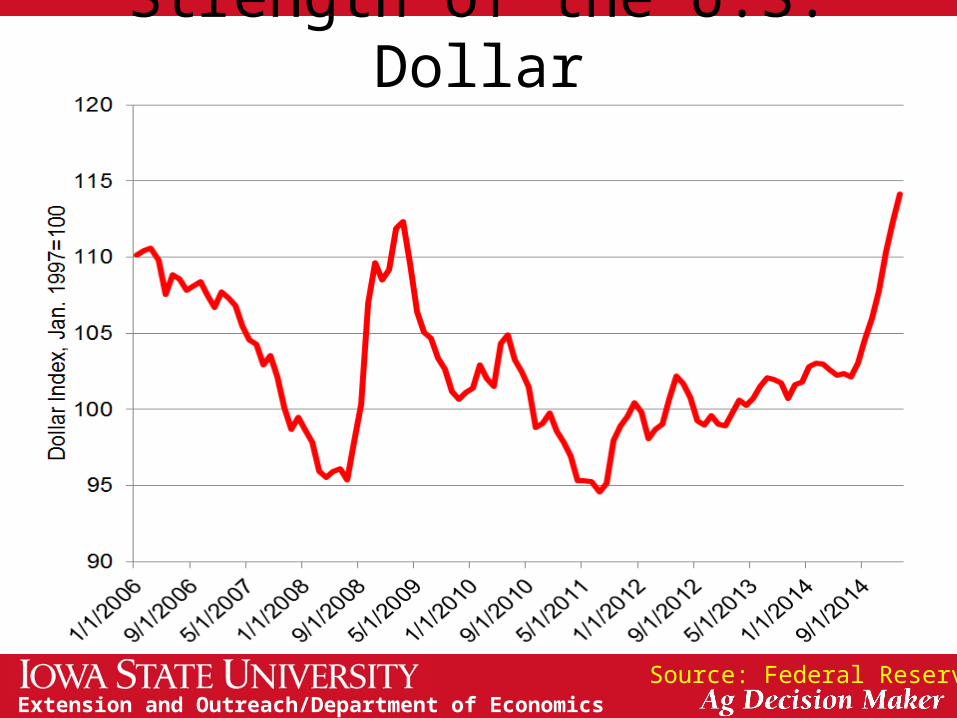
Strength of the U.S. Dollar
Source: Federal Reserve

Extension and Outreach/Department of Economics
Current Corn Futures
Source: CME Group, 3/17/2015
3.66
3.79

Extension and Outreach/Department of Economics
Current Soybean Futures
Source: CME Group, 3/17/2015
9.94
9.05
Extension and Outreach/Department of Economics
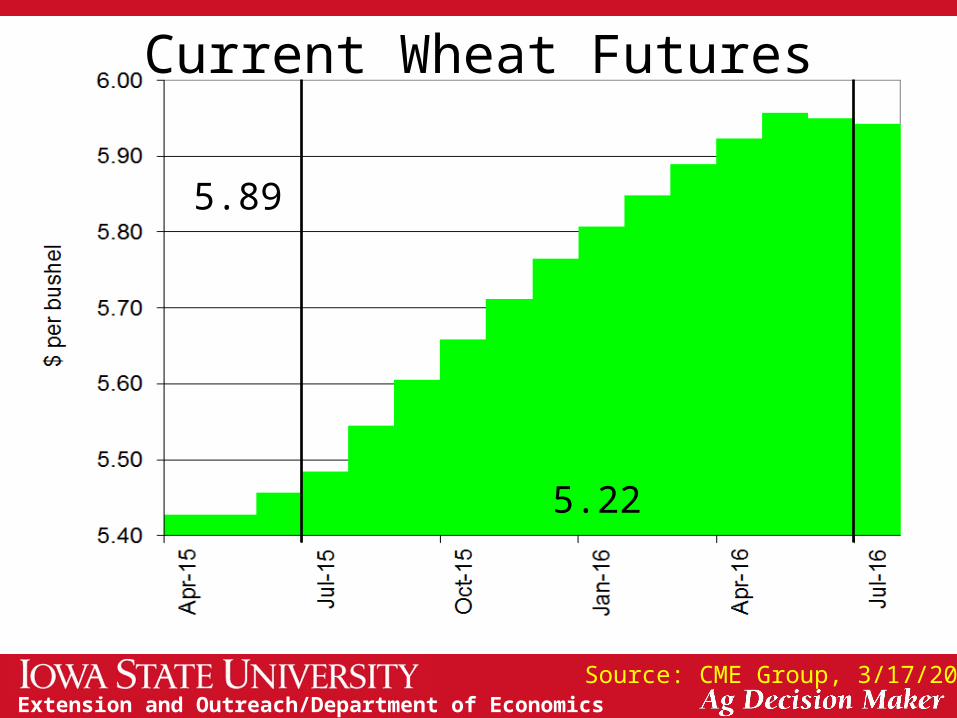
Current Wheat Futures
Source: CME Group, 3/17/2015
5.89
5.22

Extension and Outreach/Department of Economics
Crop Acreage
Source: USDA-NASS

Extension and Outreach/Department of Economics
Crop Shifts
Source: USDA-NASS

Extension and Outreach/Department of Economics
Thoughts for 2015 and BeyondSupply/demand concerns
Biofuel production and policy, broader energy demandExport strength/weakness, China’s moves in the corn & wheat marketsAcreage allocation for 2015, Where do the extra acres go?
2014/15
USDA
2015/16
USDA
2015/16
Futures
(3/17/15)
Corn $3.70 $3.50 $3.79
Soybeans $10.20 $9.00 $9.05
Wheat $6.00 $5.10 $5.22

Extension and Outreach/Department of Economics
Thank you for your time!
Any questions?
My web site:http://www.econ.iastate.edu/~chart/
Iowa Farm Outlook:http://www.econ.iastate.edu/ifo/
Ag Decision Maker:http://www.extension.iastate.edu/agdm/