extending technology roadmap through fuzzy cognitive map
TRANSCRIPT

Portland State University Portland State University
PDXScholar PDXScholar
Dissertations and Theses Dissertations and Theses
Spring 5-9-2013
Extending Technology Roadmap through Fuzzy Extending Technology Roadmap through Fuzzy
Cognitive Map-based Scenarios: The Case of the Cognitive Map-based Scenarios: The Case of the
Wind Energy Sector of Pakistan Wind Energy Sector of Pakistan
Muhammad Amer Portland State University
Follow this and additional works at: https://pdxscholar.library.pdx.edu/open_access_etds
Part of the Oil, Gas, and Energy Commons, Other Civil and Environmental Engineering Commons, and
the Other Computer Sciences Commons
Let us know how access to this document benefits you.
Recommended Citation Recommended Citation Amer, Muhammad, "Extending Technology Roadmap through Fuzzy Cognitive Map-based Scenarios: The Case of the Wind Energy Sector of Pakistan" (2013). Dissertations and Theses. Paper 999. https://doi.org/10.15760/etd.999
This Dissertation is brought to you for free and open access. It has been accepted for inclusion in Dissertations and Theses by an authorized administrator of PDXScholar. Please contact us if we can make this document more accessible: [email protected].

Extending Technology Roadmap through Fuzzy Cognitive Map-based
Scenarios: The Case of the Wind Energy Sector of Pakistan
by
Muhammad Amer
A dissertation submitted in partial fulfillment of the
requirements for the degree of
Doctor of Philosophy in
Technology Management
Dissertation Committee: Tugrul U. Daim, Chair Timothy R. Anderson
Robert D. Dryden Antonie J. Jetter David J. Sailor
Portland State University
2013

i
ABSTRACT
In this modern era, energy is a key element required for sustainable
development and prosperity of a society. Pakistan is an energy deficient country
facing problems due to the shortage of over 4000 MW of electricity. The national
energy sector is heavily dependent on imported fossil-fuel resources. The energy
crisis is negatively affecting all economic and business activities, and it is widely
recognized as a severe obstacle to growth and poverty reduction in the country.
Establishment of wind farms can help to overcome the energy crisis.
In this research, a national level wind energy roadmap is developed through
scenario planning. Multiple future scenarios are developed using the fuzzy
cognitive maps (FCM) approach. This research has extended technology
roadmapping through FCM-based scenario analysis. Building scenarios with
FCM is a very new approach, and for the first time FCM-based scenarios are
developed for the wind energy sector of Pakistan. Based on these multiple
scenarios, a technology roadmap has been developed. This research approach
is applied to the wind energy sector of Pakistan as a case study.
This approach has been used to establish objectives and national targets of
the roadmap. Then in a systematic way, critical roadmap barriers are identified
against each scenario, and appropriate action items have been proposed to
overcome barriers and promote deployment of wind energy projects in Pakistan.

ii
The objectives and targets of the roadmap have been translated into action
items. The technology roadmap has four layers: strategic objectives, targets,
barriers, and action items. Expert panels have been utilized to develop scenarios
and technology roadmaps. Validation of this research is also carried out using
experts. This new approach has helped to develop a robust roadmap and
enabled anticipation of a wide range of possible future outcomes.
This research fills an important gap by combining scenario planning and
technology roadmapping techniques in future studies, and it has enhanced
flexibility of the developed roadmap. Moreover, for the first time multiple and
plausible FCM-based scenarios are developed, which combine the benefits of
both qualitative and quantitative analysis. Moreover, the technology roadmap for
the wind energy sector of Pakistan is developed with a comprehensive study of
practical obstacles and barriers towards deployment of wind energy technology.
The research findings suggest that policy, financial, economic, lack of
competition with conventional power plants, and technical are the most critical
barriers towards deployment of wind energy projects in the country. Appropriate
action items required to overcome the roadmap barriers against each scenario
are also proposed in the developed roadmap. The experts also assigned
responsibilities for the key roadmap action items to the major stakeholders.

iii
ACKNOWLEDGEMENTS
I express my deepest gratitude to my advisor and chairman of my dissertation
committee Dr. Tugrul Daim for his excellent guidance, support, and
encouragement during my research. His vision has helped me to overcome all of
the challenges I faced during my PhD research at Portland State University. I
learned a lot from his guidance.
I am also extremely grateful to Dr. Antonie Jetter for being a great mentor for
me. I highly appreciate her support and guidance throughout my PhD studies.
I would also like to thank my PhD dissertation committee members, Dr.
Timothy Anderson, Dr. Robert Dryden, and Dr. David Sailor for serving on my
committee and giving me constructive and valuable feedback. I am also grateful
to Dr. Dundar Kocaoglu for his continuous support throughout my studies at the
Engineering and Technology Management Department.
I thank all members of the expert panels for their time, participation in the
workshops and follow-up surveys, and provision of vital information.
I would like to acknowledge the continuing support from the Fulbright
Foundation, Institute of International Education (IIE), and U.S. Education
Foundation in Pakistan (USEFP). Their support is gratefully acknowledged.
I express my appreciation to the fellow students, Ibrahim Iskin, Nima
Behkami, and Kelly Cowan for mutual support and discussions during my stay at

iv
Portland State University. I also want to thank the ETM staff Shawn Wall, Ann
White, and others for their support.
Finally, my most heartfelt gratitude is for my mother and family for
encouraging me, and giving me love and care throughout my career. I would like
to acknowledge their struggle and sacrifice in providing me with a good
education. My deepest love and gratitude must go to my mother, wife, daughter,
and sisters for their love, understanding and patience during my PhD studies at
Portland State University.

v
TABLE OF CONTENTS
ABSTRACT ........................................................................................................... I
ACKNOWLEDGEMENTS ................................................................................... III
LIST OF TABLES ............................................................................................... XI
LIST OF FIGURES ............................................................................................ XIII
1 INTRODUCTION ..................................................................................... 1
1.1 Research Objectives ................................................................................... 1
1.2 Literature Background ................................................................................ 2
1.3 Outline of Dissertation ................................................................................ 4
1.4 Publications Arising from this Dissertation .................................................... 5
2 LITERATURE REVIEW ........................................................................... 7
2.1 Scenario Planning ...................................................................................... 7
2.1.1 Scenario Planning as a Tool for Strategic Foresight .................................... 13
2.1.2 Benefits and Limitations of Scenario Planning ............................................ 15
2.1.3 Application of Scenario Planning in Energy Sector ...................................... 17
2.2 Quantitative Scenario Development Methods ............................................... 19
i
iii
xi
xiii

vi
2.2.1 Interactive Cross Impact Simulation (INTERAX) ......................................... 19
2.2.2 Interactive Future Simulations (IFS) ......................................................... 21
2.2.3 Trend Impact Analysis (TIA) ................................................................... 23
2.2.4 Limitations of Quantitative Scenario Methods ............................................. 25
2.3 Fuzzy Cognitive Maps (FCM) based Scenarios ............................................. 27
2.3.1 Theoretical Background ........................................................................ 28
2.3.2 FCM-based Scenario Development Process .............................................. 30
2.3.3 Benefits of FCM-based Scenario ............................................................. 33
2.3.4 Scenario Selection and Appropriate Number of Scenarios ............................ 36
2.3.5 Scenario Validation .............................................................................. 43
2.4 Technology Roadmaps .............................................................................. 47
2.4.1 TRM Process ...................................................................................... 50
2.4.2 Application of Technology Roadmaps ...................................................... 52
2.4.3 TRM in Energy Sector .......................................................................... 54
2.4.4 Benefits of Combining Scenarios and Roadmaps ........................................ 57
2.5 Expert Judgment ...................................................................................... 59
2.5.1 The Delphi Method ............................................................................... 61
2.5.2 Other Expert Judgment Methods ............................................................. 68
2.5.3 Selection of an Appropriate Research Method ........................................... 73
2.5.4 Formation of Expert Panel and Selection of Experts .................................... 77
2.6 Research Gaps ......................................................................................... 82

vii
3 RESEARCH APPROACH ..................................................................... 86
3.1 Research Objectives and Goals .................................................................. 86
3.2 Research Framework ................................................................................ 90
3.2.1 Expert Panels ..................................................................................... 91
3.2.2 FCM-based Scenario Development ......................................................... 96
3.2.3 Technology Roadmap Development ...................................................... 103
3.2.4 Consistency of Expert Judgments ......................................................... 108
3.2.5 Disagreement among Experts .............................................................. 111
3.3 Research Assumptions ........................................................................... 114
4 BACKGROUND FOR SPECIFIC CASE ............................................. 116
4.1 Overview of Pakistan .............................................................................. 116
4.2 Overview of National Energy Sector .......................................................... 117
4.3 Energy Crisis in the Country .................................................................... 120
4.4 Importance of Wind Energy ...................................................................... 122
4.5 Institutional Support from the Government ................................................ 126
4.6 Wind Energy in Pakistan .......................................................................... 128
4.7 Wind Energy Deployment and Integration Challenges ................................. 133

viii
5 DATA COLLECTION AND RESEARCH VALIDATION ...................... 135
5.1 Data Collection for FCM-based Scenario Development ................................ 135
5.1.1 Development of the Integrated FCM ...................................................... 135
5.1.2 Prioritization of Concepts ..................................................................... 143
5.1.3 Development of Input Vectors............................................................... 144
5.1.4 FCM Simulation and Analysis ............................................................... 145
5.1.5 Discussion ....................................................................................... 153
5.2 Data Collection for Technology Roadmap Development .............................. 171
5.2.1 Roadmap Objectives and Targets Workshop ........................................... 171
5.2.2 Roadmap Barriers Workshop ............................................................... 174
5.2.3 Prioritization of the Roadmap Barriers against each Scenario ...................... 185
5.2.4 Roadmap Action Items Workshop ......................................................... 189
5.3 Research Validation ................................................................................ 201
5.3.1 FCM Validation ................................................................................. 201
5.3.2 Roadmap Validation ........................................................................... 204
5.3.3 Content Validity ................................................................................. 205
5.3.4 Construct Validity ............................................................................... 206
5.3.5 Criterion-Related Validity ..................................................................... 207
6 ANALYSIS AND DISCUSSION .......................................................... 213
6.1 Scenarios and Important Barriers ............................................................. 214

ix
6.1.1 Scenario A: Economic Growth & Growing Energy Demand ......................... 215
6.1.2 Scenario B: Favoring Policies and Government Support ............................. 216
6.1.3 Scenario C: Environmental Concerns ..................................................... 218
6.1.4 Worst-case Scenario for Wind Energy Deployment ................................... 219
6.2 Analysis of the Research Approach .......................................................... 220
6.2.1 Strengths of FCM-based Scenario Development Approach ......................... 220
6.2.2 Weaknesses of the integrated FCM Model (Research Case) ....................... 224
6.2.3 Recommendations ............................................................................. 227
6.3 Wind Energy Technology Roadmap .......................................................... 230
7 CONCLUSION .................................................................................... 241
7.1 Research Outcome ................................................................................. 241
7.1.1 Use of FCM to Develop Scenarios for Wind Energy ................................... 242
7.1.2 Integration of Scenario Planning with Technology Roadmapping .................. 243
7.1.3 Barriers towards the Deployment of Wind Energy ..................................... 244
7.1.4 Roadmap Action Items ........................................................................ 246
7.2 Research Contributions ........................................................................... 248
7.3 Research Limitations .............................................................................. 250
7.4 Future Research ..................................................................................... 252
REFERENCES ................................................................................................. 256

x
APPENDICES …………………………………………………………………….. 281
Appendix A: FCM-based Scenario Workshop …………………….…….… 282
Appendix B: Techniques for Combining Multiple FCMs …………….…….. 289
Appendix C: Roadmap Objectives and Targets Workshop………………... 294
Appendix D: Roadmap Barriers Workshop …..………………….…………... 296
Appendix E: Follow-up Survey for Ranking of Roadmap Barriers ........… 304
Appendix F: Roadmap Action Items Workshop ………………….........…… 306
Appendix G: Stability Test Between First and Second Round of Delphi…..
……….………………………………………………..……………………………… 309
Appendix H: Cluster Analysis …………………....……………....………......... 311
Appendix I: FCM Simulation …….………..………….....…….…………........ 314

xi
LIST OF TABLES
Table 1: Difference between projection and scenario [249] ................................ 12
Table 2: Weaknesses of quantitative scenarios planning techniques ................. 26
Table 3: Comparison of strategic foresight framework with prominent scenario
models ................................................................................................................ 35
Table 4: Recommended number of scenarios & scenario selection approaches 37
Table 5: Evaluation of number of scenarios in a project [249] ............................ 38
Table 6: Summary of scenario validation criteria ................................................ 45
Table 7: Three phases in the TRM process [31] ................................................. 51
Table 8: Major differences between national and industry roadmaps ................. 56
Table 9: Comparison of scenarios and roadmaps [286]. .................................... 58
Table 10: Research Gaps ................................................................................... 85
Table 11: Research goals and research questions ............................................ 88
Table 12: Background of the TRM EP1 .............................................................. 93
Table 13: Background of the TRM EP2 .............................................................. 94
Table 14: Background of the FCM Expert Panel ................................................ 95
Table 15: Observed and expected individual frequencies ................................ 110
Table 16: Levels of agreement in Delphi studies [67] ....................................... 112
Table 17: Comparison of the average levelized system cost in 2016 [80] ........ 124
Table 18: Good-to-Excellent wind resource [82] ............................................... 132
Table 19: Description of concepts in the integrated FCM ................................. 139
Table 20: Results of the FCM simulation for the first input vector ..................... 146

xii
Table 21: Results of the FCM simulation for the second input vector ............... 148
Table 22: Results of the FCM simulation for the fourth input vector ................. 150
Table 23: Results of the FCM Simulation for the modified fourth input vector .. 151
Table 24: Results of the FCM simulation for the first input vector ..................... 158
Table 25: Results of the FCM simulation for the second input vector ............... 159
Table 26: Results of the FCM simulation for the fourth input vector ................. 161
Table 27: Results of the FCM Simulation for the modified fourth input vector .. 162
Table 28: Differences in the simulation outcome with different squashing
functions ........................................................................................................... 164
Table 29: Results of the FCM simulation for concept C10 ................................ 164
Table 30: Results of the FCM simulation with the wild cards ............................ 168
Table 31: Cluster analysis to group the roadmap barriers for each scenario .... 187
Table 32: Comparison of the roadmap barriers ................................................ 210
Table 33: Comparison of the roadmap action items ......................................... 211
Table 34: Research validation [17, 252, 283] ................................................... 212
Table 35: Strengths of the research approach ................................................. 223
Table 36: Weaknesses and implementation challenges ................................... 227

xiii
LIST OF FIGURES
Figure 1: Scenario cone showing multiple possibilities [249] .............................. 11
Figure 2: Qualitative verses quantitative scenario development techniques [249]26
Figure 3: Minimal approach to develop scenarios [249] ..................................... 40
Figure 4: Use of Wilson Matrix to prioritize scenario drivers [7] .......................... 41
Figure 5: Morphological analysis to generate input vectors [7] ........................... 42
Figure 6: Generic multi-layered graphical roadmap ............................................ 49
Figure 7: Judgment methods in order of increasing accuracy [360] ................... 66
Figure 8: Literature gaps, research goals and research questions ..................... 89
Figure 9: Overview of the research framework ................................................... 90
Figure 10: Integrated causal map/FCM for deployment of wind energy ........... 100
Figure 11: TRM process for the roadmap ......................................................... 107
Figure 12: Share of Pakistan’s primary energy supplies by various sources .... 118
Figure 13: Share of Pakistan’s electricity from various sources [1]. .................. 119
Figure 14: Wind map of Pakistan [229] ............................................................. 130
Figure 15: Revised integrated FCM for deployment of wind energy ................. 138
Figure 16: Concepts highlighted by each expert in their FCMs ........................ 142
Figure 17: Wilson Matrix used to prioritize concepts (drivers) .......................... 143
Figure 18: Morphological analysis for generating the input vectors .................. 145
Figure 19: Hyperbolic Tangent Function drawn for values between -1 to 1 ...... 157
Figure 20: Integration of the wild cards in the FCM model ............................... 167
Figure 21: Approval process for a new wind farm in Pakistan .......................... 178

xiv
Figure 22: Ranking of the roadmap barriers against each scenario ................. 188
Figure 23: Action items required to overcome the barriers for scenario A: Growth
of Economy and Energy Demand ..................................................................... 233
Figure 24: Key roadmap action items with timeline for scenario A: Growth of
Economy and Energy Demand ......................................................................... 234
Figure 25: Action items required to overcome the barriers for scenario B:
Favoring Policies and Government Support ..................................................... 235
Figure 26: Key roadmap action items with timeline for scenario B: Favoring
Policies and Government Support .................................................................... 236
Figure 27: Action items required to overcome the barriers for scenario C:
Environmental Concerns .................................................................................. 237
Figure 28: Key roadmap action items with timeline for scenario C: Environmental
Concerns .......................................................................................................... 238
Figure 29: Action items required to overcome the barriers for the worst-case
scenario ............................................................................................................ 239
Figure 30: Key roadmap action items with timeline for the worst-case scenario240
Figure 31: Integration of scenario planning with technology roadmapping ....... 244
Figure 32: Overview of the proposed Hierarchical Decision Model .................. 254
Figure 33: Model for calculating the TRM status signal [333] ........................... 255

1
1 Introduction
1.1 Research Objectives
The objective of this research is to develop a national level wind energy
roadmap through scenario planning. Fuzzy cognitive maps (FCM) based
scenarios are developed for the deployment of wind energy. This has extended
the technology roadmapping through FCM-based scenario analysis. Developing
scenarios with FCM is a very new approach combining the benefits of both
qualitative and quantitative analysis. Scenario analysis has helped to develop a
robust roadmap and enable anticipation of a wide range of possible future
outcomes. This research uses the wind energy sector of Pakistan as a case
study. The research objectives are grouped into the following two categories:
i. Method development:
a. Develop multiple and plausible FCM-based scenarios for wind
energy deployment; and
b. Combine the FCM-based scenario planning and technology
roadmapping process.
ii. Application of the new method:
a. Development of the national wind energy roadmap to address the
strategic objectives of the country;
b. Identify practical insights on factors supporting and hindering
deployment of wind energy projects in the country; and

2
c. Propose action items and plans for deploying wind energy on a
large scale in the country.
1.2 Literature Background
As background for this research, a detailed literature review was conducted to
address the following research questions:
Q1: How can FCM be used to develop plausible scenarios for wind energy?
Q2: How can the FCM-based scenario planning approach be integrated with
technology roadmapping process?
Q3: What are the factors supporting and hindering the deployment of wind
energy projects in the country?
Q4: How can the wind energy integration challenges be managed by a
developing country?
Q5: What are the required action items and plans for implementing wind
energy projects in the country?
A detailed literature review is presented in Chapter Two, covering topics
related to technology roadmapping, scenario planning, expert judgment,
sustainable energy roadmaps, and energy foresight. The following key
takeaways and gaps were identified.
There is a need to combine scenario planning and technology roadmapping
techniques in future studies [209, 286, 319], and this combination will enhance

3
the usefulness of the technology roadmaps [286, 295, 319]. Therefore, it has
been recommended to evaluate a concise mix of methods for future studies
[209].
There is a weak link between qualitative and quantitative scenarios, which
has been cited as a major obstacle towards development of integrated scenarios
[170], whereas building FCM-based scenarios is a unique approach that can
combine the benefits of both qualitative and quantitative analysis.
A literature review of 135 public-domain sustainable energy roadmaps [8]
revealed that in these roadmaps, scenarios are generally created based on a few
hypothetical assumptions without much deliberation, logical reasoning, and
consideration of the causal relationships among various variables.
The literature review on the renewable energy sector in Pakistan reveals that
it is limited to highlighting potential renewable energy resources and some
generic barriers. There is no roadmap, scenario planning or implementation plan
for wind energy projects in the literature. Moreover, the practical obstacles
towards deployment of wind energy technology are also not thoroughly studied.
Wind energy is a variable and uncertain power source, and its deployment on
a large scale requires significant changes in the power grid in order to make it
more vibrant and interactive. This research will address the integration
challenges associated with the deployment of wind energy on a large scale in a
developing country.

4
1.3 Outline of Dissertation
This dissertation is organized into seven chapters and seven appendices.
Chapter One presents the introduction and overview of this dissertation.
Chapter Two highlights a literature review of scenario planning, FCM-based
scenario planning, technology roadmapping, expert judgment, sustainable
energy roadmaps, and energy foresight. At the end of this chapter, gaps in the
existing literature are identified.
Chapter Three introduces the research methodology and describes the
research objectives, goals, and questions. It describes the research design and
data collection methodology used for this research. Each research step and role
of the expert panels for this research are also explained in this chapter.
Chapter Four describes the background of the research case. It provides an
overview of the national energy sector, energy crisis, role of the government, and
wind energy sector of Pakistan.
Chapter Five highlights the data collection and data analysis process and
research validation approach. It includes details of the research steps taken for
the development of scenarios and roadmaps.
Chapter Six presents analysis and discussion. Data obtained from the expert
panels is thoroughly analyzed. The developed roadmaps are also presented in
this chapter.

5
Finally, Chapter Seven provides the conclusion. It also discusses the
research contributions, research limitations, and future research prospects.
Appendices included are: Appendix A, Agenda and Handout for the FCM
Scenario Workshop; Appendix B, description of techniques for combining
multiple FCMs; Appendix C, Agenda and Handout for Roadmap Objectives and
Targets Workshop; Appendix D, Agenda and Handout for Roadmap Barriers
Workshop; Appendix E, follow-up survey for ranking of roadmap barriers;
Appendix F, Agenda and Handout for Roadmap Action Items Workshop;
Appendix G, example of stability test (chi-square test) performed on the data of
follow-up surveys for priortization of the roadmap barriers; Appendix H, details of
the cluster analysis performed to group the roadmap barriers; and Appendix I,
details of the FCM Simulation.
1.4 Publications Arising from this Dissertation
At the time of completion of this research, several papers related to this
dissertation have been published in journals, accepted for publication, and
presented at conferences. Some further papers are planned and under way.
Following are the peer-reviewed papers related to this dissertation, which have
been published and presented at international conferences on technology
management:

6
Application of Technology Roadmaps for Renewable Energy Sector,
Technological Forecasting and Social Change, Vol. 77, No. 8, pp. 1355-
1370, 2010.
Development of Fuzzy Cognitive Map (FCM) based Scenarios for Wind
Energy, International Journal of Energy Sector Management, Vol. 5, No. 4,
2011.
Selection of Renewable Energy Technologies for a Developing Country: A
Case Study of Pakistan, Energy for Sustainable Development, Vol. 15,
No. 4, pp. 420-435, 2011.
Technology Roadmapping for Wind Energy: The Case of the Pacific
Northwest, Journal of Cleaner Production, Vol. 20, pp. 27-37, 2012.
Technology and Science Policies in Transitional Economy, Science,
Technology & Society, Vol. 17, No. 2, pp. 297-321, 2012.
A Review of Scenario Planning, Futures, Vol. 46, No. 1, pp. 23-40, 2013.
Development of fuzzy cognitive map (FCM) based scenarios, in Portland
International Conference for Management of Engineering and Technology
(PICMET), Portland, OR, 2011, pp. 2695-2709.
Scenario Planning for the National Wind Energy Sector through Fuzzy
Cognitive Maps, in Portland International Conference for Management of
Engineering and Technology (PICMET), Portland, OR, 2013, Accepted
Manuscript.

7
2 Literature Review
The detailed literature review was conducted along four perspectives: 1)
scenario planning; 2) technology roadmapping; 3) expert judgment; 4)
sustainable energy roadmaps and energy foresight.
2.1 Scenario Planning
During the last 60 years, scenario planning has been used in an increasing
number of fields and domains [267]. Exploring uncertainty in the business
environment is the key element of scenario planning studies [37]. Uncertainty is
defined as “an individual's perceived inability to predict something accurately”
[37]. In the present era, characterized by uncertainty, innovation and change,
increasing emphasis is being placed on the use of scenario planning techniques
because of its usefulness in times of uncertainty and complexity [291]. Scenario
planning stimulates strategic thinking and helps to overcome thinking limitations
by creating multiple futures. Scenarios outline some aspects of the future and,
generally the word scenario refers to an outline of the plot of a dramatic work, or
the script of a motion picture or television program [158]. Herman Kahn,
considered one of the founders of futures studies and father of scenario planning,
defines a scenario as “a set of hypothetical events set in the future constructed to
clarify a possible chain of causal events as well as their decision points” [160].
Godet defines scenario as a description of a future situation and the course of

8
events which allows one to move forward from the actual to the future situation
[107].
Scenarios are alternative, plausible and consistent images of the future and
highlight the large scale forces that push the future in different directions [298].
Scenarios are useful whenever the problem is complex, uncertain and has a
long-term effect [209]. Scenarios provide an intelligible description of a possible
situation in the future, based on a complex network of influence factors [96].
Scenario planning techniques are frequently used by managers to articulate their
mental models about the future in order to make better decisions [196]. Scenario
planning has increasingly been applied as a useful tool for improving decision
making processes and dealing with uncertainty by considering a number of
possible future environments [338]. Therefore, scenarios significantly enhance
the ability to deal with uncertainty and increase the usefulness of the overall
decision making process [333, 339].
Systematic use of scenarios for clarifying thinking about the future started
after World War II when the US Department of Defense used them as a method
for military planning in the 1950s at the RAND Corporation [22, 50, 79, 158, 160,
333]. After that the scenario methodology was extensively used for social
forecasting, public policy analysis, and decision making in the 1960s. Future
scenarios exert a strong influence on human thinking and the decision making
process, and they can help initiate public debate [121]. Schoemaker describes
that scenario planning must outline the possible futures, capture a wide range of

9
options, stimulate thinking about the future, and challenge the prevailing mindset
and status quo [291, 292]. Futures studies help to see the present differently, and
according to some futurists, these are a devise for “disturbing the present” [61].
Therefore, during the process of scenario building, it is important to encourage
the participants to consider options beyond the traditional operational and
conceptual comfort zone of the organization [49, 69, 319]. This encouragement
will help in the exploration of new possibilities and unique insights.
Consideration of multiple possible future alternatives helps in conducting
future planning in a holistic manner [153], significantly enhancing the ability to
deal with uncertainty, and improving the usefulness of the overall decision
making process [333, 339]. Scenarios are a useful way of looking at the future
because due to cognitive limitations, people can only conceive a limited part of
future possibilities [254]. Moreover, scenario planning presents all complex
elements together in a coherent, systematic, comprehensive, and plausible
manner [158]. Scenarios are also very useful for highlighting implications of
possible future system discontinuations, identifying the nature and timing of these
implications, and projecting consequences of a particular choice or policy
decision [319]. Scenario provides a description of a future situation and portrays
the path that leads us out of today and into the future [249]. Schwab, Cerutti, and
von Reibnitz also state that the scenario approach develops the future situations
and describes the path from any given present to these future situations [297].
Thus, the scenario planning process helps to make the desirable future real

10
[282]. Researchers also report a direct link between scenario planning activities
and innovation [288].
Research indicates that there is a correlation between the adoption of
scenario planning techniques and uncertainty, unpredictability, and instability of
the overall business environment [194]. Increasing uncertainty has increased the
importance of identifying the future trends and expected business landscape.
Therefore, utilization of scenario has increased due to greater complexity and
uncertainty in the business environment. In general scenarios can be developed
for any time frame, but they provide greater usefulness if developed for the long-
term [196]. Usage of scenario planning for long range planning and strategic
foresight facilitates one to adapt quickly to the major changes [339]. Future
uncertainty increases as we move away from the present and look further into
the future. Figure 1 highlights the widening of scenario cone and broadening of
the realm of future possibilities [249]. Various factors which may influence the
direction of future development of an enterprise are also shown in Figure 1.
There are several internal factors like decisions, strategies, vision, values, and
knowledge as well as external factors like rules, regulations, and influences.

11
Figure 1: Scenario cone showing multiple possibilities [249]
There has been significant growth in the use of scenario planning, especially
in the decade up to the year 2010 [263, 339]. Scenario planning has been
extensively used at the corporate level, and in many cases it has been applied at
the national level [50, 253, 287]. The scenario building process also contributes
towards organizational learning [51]. Shell was one of the first companies to use
scenarios at the corporate level, and usage of scenarios helped the company to
cope with the oil shock and other uncertain events in the 1970s [50, 158, 294].
Scenarios are considered a valuable tool that helps organizations to prepare for
possible eventualities, and makes them more flexible and more innovative [129].
Empirical research conducted by Linneman and Klein indicates that after the first
oil crisis in the early 1970s, the number of U.S. companies using scenario
planning techniques doubled [186, 187]. It was observed that at the corporate
level the scenario planning approach was more popular among large companies,

12
scenarios were generally used for long range planning (10 years or more), and
the majority of scenario users belong to capital intensive industries like
aerospace and petroleum. They further reveal that almost 50% of all US Fortune
1000 companies were actively using scenarios in the early 1980s [186, 187].
Pierre Wack presents scenario building criteria based on three main
principles: identification of the predetermined elements in the environment, the
ability to change mindset in order to re-perceive reality, and developing a
macroscopic view of the business environment [37, 78, 345, 346]. A scenario
does not predict the future, but it explores multiple plausible future situations with
the purpose of extending the sphere of thinking of the participants in the scenario
development process [106, 290]. Thus, scenario planning creates a set of
plausible futures [353]. Table 1 highlights the important differences between
scenario planning and future projections.
Table 1: Difference between projection and scenario [249]
Projection Scenario
Features Attempt at an exact prediction of events, oriented to the past
Attempts to represent cross section of the future as alternatives, oriented to the future
Basis Based on probabilities Based on possible and imaginable
Temporal Scope
Short- to medium-term Medium- to long-term
Decision Factor
Deterministic Alternative scenarios as a basis for decision making
Variables Facts, quantitative, objective, known Objective and subjective, known and unknown, qualitative and quantitative

13
The literature on scenario planning indicates that scenarios mean different
things for different users, and often scenarios are developed for various purposes
[29]. On the basis of perspective, scenarios are classified into descriptive and
normative scenarios [253]. The descriptive scenarios are extrapolative in nature
and present a range of future likely alternative events. The normative scenarios
are goal directed and respond to policy planning concerns in order to achieve the
desired targets. Scenarios are also classified on the basis of scenario topic
(problem specific verses global scenarios), breadth of the scenario scope (one
sector verses multi-sector scenarios), focus of action (environmental verses
policy scenarios), and level of aggregation (micro verses macro scenarios) [209].
2.1.1 Scenario Planning as a Tool for Strategic Foresight
Scenario planning is the most popular and commonly used tool for a strategic
foresight project [79, 141, 209]. The word foresight generally describes long
range forward-looking activities [210]. Strategic foresight is defined as “the ability
to create and maintain a high-quality, coherent and functional forward view, and
to use the insights arising in useful organizational ways” [312]. Martin states that
technology foresight is a process to identify the strategic research areas likely to
yield the greatest economic and social benefits by systematically looking into the
longer-term future of science, technology, economy, and society [197]. In a
foresight project, the scenario planning helps to better prepare for the future and
improve perception of opportunities and options [42].

14
Scenario planning can significantly enhance the usefulness of a strategic
foresight project and compliment the foresight process [22]. Bishop et al. state
that the scenario development activities are the heart of a futures study [25]. An
analysis of 860 future studies revealed that scenario planning is among the most
commonly used technique employed in these foresight studies [54].
In strategic foresight projects, scenarios are employed to accomplish a broad
range of objectives [22]. Important aspects of foresight are to look into a range of
possible futures [311] and various strategic options [209, 343]. Scenario analysis
helps to explore these alternative futures and systematically formulate and
analyze various strategic options. Moreover, exploring the future uncertainty is a
critical part of a strategic foresight project which can be accomplished through
scenarios [22, 78]. The future uncertainty can be evaluated by considering
multiple options across a number of scenarios each depicting a glimpse of the
probable future [69, 79]. In future studies, scenarios highlight implications of
possible future system discontinues and their implications [319]. Ringland
describes two important roles of scenarios in supporting the foresight studies:
providing a well understood methodology to explore the future and presenting a
set of mental models [268]. Cairns et al. state that scenario methods offer an
enabling mechanism to promote the foresight activities across multiple agencies
[39]. Therefore, it can be concluded that scenario planning is a highly
complementary technique and it is widely used in strategic foresight studies.

15
2.1.2 Benefits and Limitations of Scenario Planning
The literature on scenario planning reveals that there are numerous benefits
of using this approach. Some of the major benefits of scenario planning are listed
below:
Clarifying thinking about the future [22, 50, 79, 158, 333];
Exploring the uncertainties in a business environment [37, 338];
Understanding nature and impact of the most critical and uncertain
driving forces i.e. scenario drivers/trends [249];
Providing a creative yet structured approach to explore what the future
might look like [333];
Improving the decision making process [196, 333, 339];
Projecting the consequences of a particular choice or policy decision
[319];
Helping organizations to test their strategy [129];
Identifying the emerging areas of strategic importance which leads to
significant benefits and taking advantage of unexpected opportunities
[293];
Extending the traditional planning time horizons, conducting long-term
strategic planning in a holistic manner, and making flexible long-term
plans [153, 298];
Enabling an organization to adapt quickly to major changes [339];

16
Providing the ability to learn faster than competitors and gain a
competitive advantage [36, 38];
Highlighting the path from present to the future situations (scenarios)
[249, 297];
Challenging the prevailing mindset and status quo by encouraging to
think the unthinkable [49, 69, 291, 292, 319]; and
Extending the sphere of thinking of the participants in the scenario
development process [106, 290].
In contrast to the above-mentioned benefits, scenario planning techniques
have several weaknesses as well:
Scenario planning is a very time consuming activity [206, 209];
Due to limited expertise, scenario planning is unavailable to many
companies [50];
Scenarios are open ended and Describe a set of future circumstances,
but do not give a pathway into the future [277];
It is crtiical to ensure selection of suitable experts, and in somecases
this could be a difficult task to fulfil [135, 209];
Due to intensity of involvement, sometimes only the most financially
secure companies use scenario planning [345, 346];
Indepth knowledge of the field under investigation is necessary [209];

17
In some scenario planning techniques, the possible impacts of
scenario drivers on each other are not considered [135]; and
Sometimes scenario work is undertaken on the basis of non-existing or
very weak reasoning [38].
2.1.3 Application of Scenario Planning in Energy Sector
The scenario planning approach has been widely used in the energy and
renewable energy sectors. As mentioned earlier, scenario planning helps to
improve the decision making and learning process, long-term future planning,
and identification of new challenges and problems which may arise in the future
[121, 339]. Scenario planning helps to analyze the emerging issues in a complex
energy system [27]. In the energy sector, some cases of scenario planning
application are mentioned below:
Assessment of energy resources [309];
Reduction of global CO2 emissions and increase the share of
renewable energy to meet the worldwide energy needs [175];
Assessment of the future energy consumption, composition of
electricity generation, energy diversity, and greenhouse gases
emissions [103];
Improvement of the energy efficiency measures and reduction of
energy consumption in the commercial buildings [362];

18
Projection of the future energy consumption in the transport sector
[323];
Impact assessment of rural energy consumption in different sectors
[277];
Analysis of energy consumption mix and potential of energy exports
[162];
Analysis of the energy policy alternatives and assessment of the
ecological footprint of energy consumption [34];
Development of the hydrogen energy infrastructure [315, 352, 359];
Deployment [55] and integration of renewable energy resources [12,
350];
Analysis of promising opportunities for achieving alternative energy
pathways like energy savings, renewable energy, and transportation
activities [103];
Evaluation of the future energy demand and share of renewable
energy resources in the future [166];
Assessment of future energy market to use industrial excess heat from
the economic and CO2 emissions perspectives [157];
Analysis of the national level future primary energy demand [75, 166];
Energy foresight and long-term energy planning at the national level
[63]; and
Renewable energy portfolio planning [48, 192, 219, 337].

19
2.2 Quantitative Scenario Development Methods
There are several methodologies for developing scenarios with many
common characteristics [30, 50, 158, 339]. Bradfield et al., Keough et al., and
Chermack et al. review various methodological approaches and guidelines
presented in the literature for scenario building [30, 50, 167]. Due to the large
number of scenario development techniques and models presented in the
literature, some authors describe it as “methodological chaos” [30, 196]. The
following methods are considered the most popular and widely used quantitative
techniques for building scenarios [30, 115, 134-136, 209]. These methods are
considered state of the art for developing the quantitative scenarios.
Interactive Cross Impact Simulation (INTERAX);
Interactive Future Simulations (IFS); and
Trend Impact Analysis (TIA).
2.2.1 Interactive Cross Impact Simulation (INTERAX)
The INTERAX (Interactive Cross-Impact Simulation) methodology was
developed by Enzer at the Center for Futures Research (CFR), Graduate School
of Business Administration, University of Southern California [30, 83, 134, 136].
This technique uses both analytical models and expert judgment to develop a
better understanding of alternative future environments. A comprehensive
database containing important information of future trends and events is

20
developed through a Delphi study of 500 experts to support the scenario building
activities [83, 84, 135, 136]. This database contains information of 100 events
and 50 trend forecasts and it is updated periodically. The database was
developed due to the assumption that the macro societal conditions are common
to most of the strategic issues; therefore, one environmental scan can be used to
support several issues [84]. CFR highlights that scenarios developed using the
INTERAX approach can help companies with major decisions for a large range of
issues, including new product and market opportunities, capital investments,
plant and equipment acquisitions, mergers and acquisitions, and R&D planning
[134].
Huss and Honton state that the INTERAX approach consists of the following
eight steps [135, 136]:
Step 1: Define the issue and time period of analysis: Clarify the issue,
time frame of analysis, and scope of the scenario project;
Step 2: Identify the key indicators: Key indicators are the primary
variables relevant to the forecasting. These are the characteristics of a
system which can be measured, counted, or estimated at any point in
time;
Step 3: Project the key indicators: Develop a model which independently
forecast the indicators based on current and past data using econometric
and time series techniques as well as forecasts available from the
literature;

21
Step 4: Identify the impacting events: Identify the possible future events
whose occurrence would significantly affect one or more of the key
indicators using the INTERAX database, expert opinion, or any other
source;
Step 5: Develop event probability distributions: Divide the forecast horizon
into smaller time periods and estimate the cumulative probabilities that
each event will occur prior to expiration of the time period;
Step 6: Estimate the impacts of events on trends: The models developed
in step 3 are used to estimate the expected value of each indicator
variable (trend) over the time period of interest;
Step 7: Complete the cross-impact analysis: The cross impacts of events
on events and the trend impacts of events on trends are estimated; and
Step 8: Run the model: Last step is to perform the simulation and an
envelope of uncertainty is created of the range of possible future paths for
the key indicators.
2.2.2 Interactive Future Simulations (IFS)
Interactive Future Simulations (IFS) technique was previously known as
BASICS (BATTELLE Scenario Inputs to Corporate Strategies) and it was
developed by the Battelle Memorial Institute in the 1970s [25, 30, 135, 136]. The
main differences between IFS and INTERAX techniques are that IFS does not
use Monte Carlo simulation, and it does not require an independent forecast of
the key indicators or variables [135, 136].

22
The IFS methodology consists of the following seven steps [135, 136]:
Step 1: Define and structure the topic, including unit of measure, time
frame, and geographic scope;
Step 2: Identify and structure the areas of influence;
Step 3: Define the descriptors, write essays for each descriptor, and
assign initial probabilities of occurrence to each descriptor state;
Step 4: Complete the cross-impact matrix and run the program; Step 5: Select scenarios for further study and write the narratives;
Step 6: Introduce the low probability and high impact events and conduct
the sensitivity analysis; and
Step 7: Make forecasts and study the implications of scenarios, and
identify what strategies should be developed to take advantage of the
opportunities presented while reducing potential threats.
The IFS methodology emphasizes the market and customer orientation,
promotes a long range perspective and provides insights in the business
dynamics using cause and effect relationships [30, 135, 136]. Additionally, this
process identifies the novel and diverse ideas, encourages contingency planning,
and provides an early warning system of any major changes in the business
environment [135].

23
2.2.3 Trend Impact Analysis (TIA)
Trend Impact Analysis (TIA) is another quantitative approach for building
scenarios developed in the 1970s. TIA is a combination of statistical
extrapolations with probabilities. It provides a systematic approach to combine
extrapolation based upon the historical trends with judgment about the
probabilities and impacts of the selected future events [30, 50, 115, 135]. Thus,
TIA considers the effects of the unprecedented events which may occur in the
future. An unprecedented event with higher impact is likely to swing the trend
relatively far in any direction from its un-impacted course based on the historical
trends. Gordon describes that the following two principal steps are necessary to
conduct the trend impact analysis [115]:
i. A curve is fitted to the historical data in order to calculate the future trend;
and
ii. Expert judgments are used to identify a set of future events that could
cause deviations from the extrapolation of the historical data. The experts
judge the probability of occurrence as a function of time and its expected
impact.
The Futures Group has proposed a detailed TIA methodology consisting of
the following eight steps [135, 136]:

24
Step 1: Select the topic and identify the key scenario drivers;
Step 2: Create a scenario space by selecting a subset of multiple
alternative scenarios;
Step 3: Identify the important impacting trends and collect time series data;
Step 4: Prepare a naive extrapolation based upon the historical data;
Step 5: Establish a list of the impacting events by a Delphi study, literature
review, expert panel, or STEEP analysis;
Step 6: Establish probabilities of events occurring over time: years to
maximum impact, level of maximum impact, years to steady state impact,
and level of steady state impact;
Step 7: Modify the extrapolation and combine the impact and event
probability judgments to produce an adjusted extrapolation with upper and
lower quartile limits; and
Step 8: Write the narratives for each scenario within the scenario space
based on the results of the trend impact analysis.
According to Gordon, the TIA method has been used frequently and it has
been applied to determine future of the healthcare sector, pharmaceutical market
future, and forecast petroleum consumption in the transport sector to assess
effectiveness of several policies [115]. This approach has been used by many
US federal agencies including the Federal Aviation Administration, Federal
Bureau of Investigation, National Science Foundation, Department of Energy,
Department of Transportation, and State of California [115].

25
2.2.4 Limitations of Quantitative Scenario Methods
The scenario building techniques have evolved due to the change in the
futures research paradigm from a more quantitative approach (in the 1970s)
towards a more qualitative and process-oriented one [209]. Strictly quantitative
methods are often criticized because these methods rely solely on the historical
data and assume that the same trends will prevail in the future [115]. Thus,
relying only on the quantitative data may result in an inaccurate forecast.
Generally, the quantitative methods are considered useful for the narrowly
focused projects having short time horizon, whereas the qualitative methods are
considered appropriate for the projects having large scope and long time horizon.
It is very likely that the current trends may change in the future [249]. It is
highlighted in Figure 2, that usefulness of the quantitative methods declines
steadily as we look further into the future, whereas usefulness of the qualitative
approaches increases in this case [249]. Therefore, it can be concluded that both
qualitative and quantitative approaches are complementary and strengthen each
other when used together. However, some researchers has pointed out that
there is a weak link between qualitative and quantitative scenario development
approaches and it is considered a major obstacle towards development of
integrated scenarios [170].

p
T
d
o
te
TImA
Figu
The sce
rominent q
These wea
evelopmen
vercome t
echniques.
Method
rend mpact Analysis
ure 2: Qualita
enario pla
uantitative
knesses a
nt approach
the weakn
Table 2: W
Weak
This methodimpacts whicother. Designed prdecision or fquantitative Process isunavailability
ative verses q
nning liter
methods fo
are summa
h (describe
nesses the
Weaknesses o
knesses of QPlanning Te
d does not evach the events
rimarily for theforecast variaand have the sometimesy of reliable h
uantitative sc
rature high
or scenario
arized in T
ed in the
ese promin
of quantitative
Quantitative Sechniques aluate the pos may have on
e evaluation oable, which is e historical infs constrainedhistoric time s
cenario develo
hlights so
developme
Table 2. T
next secti
nent quant
e scenarios pl
Scenario
ssible n each
of one key
formation. d due to eries data.
opment techn
me weakn
ent [30, 50,
The FCM-b
ion) has th
titative sce
lanning techn
FCM-bas
Causal linksof concepts
All drivers anthe FCM arescenario devHistoric timeimportant required.
niques [249]
nesses of
, 115, 134-
based scen
he potentia
enario bui
niques
sed Scenario
highlights imon each othe
nd causal linke considered fvelopment e series data
trends is
26
the
136].
nario
al to
lding
os
mpact er
ks in for
of the not

27
Interactive Future Simulations
It is a probabilistic forecasting tool and computer algorithm generates scenarios, i.e. descriptions of a business environment likely to occur at the end of the forecast horizon.
Simulation examines how the scenario drivers will change based on the causal relationships among them.
The user must use some creativity to incorporate the time dynamics.
Through activation of concepts time dynamics are incorporated
INTERAX Needs an extensive database consisting of the most important events and trends.
Database of important events and trends is not required.
The selection of events which occur in the first interval is based solely on a random selection using the initial user entered probabilities.
FCM simulation is conducted with input vectors consisting of the scenario drivers having the highest impact and uncertainty.
2.3 Fuzzy Cognitive Maps (FCM) based Scenarios
FCMs can be used for the development of scenarios and this approach has
the ability to overcome the weaknesses of the quantitative scenarios building
techniques. Building FCM-based scenario is a very new approach and recently
Jetter et al. [152] and van Vliet et al. [334] propose the viability of FCM as a
method for scenario development. Kok and van Delden identify that the weak link
between qualitative and quantitative scenarios is a major obstacle towards
development of integrated scenarios [170]. Literature also highlights the
importance using imagination followed by a causal analysis for the scenario
building process [353]. FCM uses the fuzzy logic and it can integrate qualitative
knowledge with quantitative analysis. Thus, the FCM-based scenario
development approach has the potential to combine qualitative approach with
quantitative models [334]. Research also indicates that integration of multiple
approaches in the scenario building process results in robust scenarios [36, 249].

28
2.3.1 Theoretical Background
Robert Axelrod introduced cognitive maps in the 1970s to represent social
scientific knowledge as an interconnected and directed graph consisting of nodes
and edges/arrows [163, 171]. Causal cognitive maps are widely used to capture
causal knowledge and mental model models of the experts on the complex
matters [154, 156]. Nodes represent various concepts and arrows highlight the
causal relationship between various concepts. Every concept is influenced by the
interconnected concepts based on the value of the corresponding causal
weights. The visual nature of these maps facilitates understanding of the existing
dependencies and contingencies between various concepts. Thus, the graphical
nature and relative simplicity make the causal cognitive maps a useful tool for
visualization and communication [156]. These maps are also used for developing
scenarios [109]. In this approach diverse mental models are captured from
multiple experts and this process helps the experts to identify the key issues of
the scenario domain and explore the alternative futures [152]. The mapping
process fosters system thinking and allows the experts to better assess their own
mental models and indicate their subjective knowledge [152].
Kosko invented Fuzzy Cognitive Maps (FCM) as an extension and
enhancement of a cognitive map with the additional capability to model the
complex chains of the causal relationships through weighted causal links [172].
FCM is a modeling approach that makes the qualitative causal maps computable
[156]. A link between the concepts is assigned weights to quantify the strength of

29
their causal relationships. FCMs are mainly used to analyze and aid the decision
making process by investigating the causal links among the relevant concepts
[171].
FCMs can overcome the indeterminacy problems of the causal cognitive
maps which occurs when one concept is influenced by an equal number of
negative and positive ingoing arrows [296]. The causal maps encode the
dynamic behavior ("something happens because and after something else has
happened"), but sometimes due to complexity and cognitive limitations, causal
behavior cannot be easily inferred from the maps [154, 156]. Moreover, applying
the causal cognitive map can lead to a large and complex model and
subsequently it becomes very difficult to analyze the indirect effects, feedback
loops, and time lags [152]. Development of FCM involves the following three
steps [201]:
Identification of the key domain issues or concepts;
Identification of the causal relationships among these concepts; and
Estimation of the strength of the causal relationships.
FCM analyze interrelations between phenomena that are graphically
represented in causal cognitive maps or influence diagrams [153]. Thus, it
graphically models the cause and effect relationships in a decision environment.
In general each concept (node) in a FCM model may reflect a state, variable,
event, action, goal, objective, value, or other system component. These concepts
are non-linear functions that transform the path weighted activation towards their

30
causes. A finite number of FCMs can be combined together to produce a joint
effect and capture opinion of multiple experts together in one collective map
[163]. Therefore, the integrated FCM provides a more holistic overview of the
pertinent issues surrounding the subject area [313]. Moreover, these maps allow
systematic integration of multiple perspectives when considering the long-term
planning [313]. Taber and Siegel propose estimation of expert credibility weights
in order to combine multiple FCMs [325].
The FCM-based research approach has been used in a much wider range of
applications in different domains [2]. It has been used to study and analyze
foreign policy, stock-investment, software adoption, modeling IT project
management, designing and improving information system evaluation (ISE),
product planning, manufacturing problems, fault detection and troubleshooting for
electronic circuits, supervisory system control analysis, web data mining, socio-
economic modeling, ecosystem and water quality issues, immigration issues,
drug control, child labor issues, and community mobilization against the AIDS
epidemic [59, 130, 153, 163, 179, 236, 270, 279, 284, 303, 320, 324].
2.3.2 FCM-based Scenario Development Process
The following framework has been proposed for the development of FCM-
based scenarios by integrating the scenario planning and FCM modeling
processes [152]:

31
Step 1: Scenario Preparation: Clarification of the objective, time frame,
and boundaries of the scenario project;
Step 2: Knowledge Capture: Identify the relevant concepts / potential
scenario drivers through the experts and literature review, merge mental
models of multiple experts, and subsequently translate these into a
conceptual FCM scenario model;
Step 3: Scenario Modeling: Streamline the causal links and assign
weights and signs to all links, choose the squashing functions for all the
concepts;
Step 4: Scenario Development: Calculate the FCM model for different
input vectors that represent plausible combinations of concept states;
Step 5: Scenario Selection and Refinement: The raw scenarios developed
after step 4 are further assessed and refined; and
Step 6: Strategic Decisions: The developed scenarios are used for
making the long-term strategic decisions.
The FCM-based scenario planning process is conducted with the help of an
expert panel. Identification of the experts is considered the first step of the
knowledge elicitation process [155]. Knowledge of the experts is captured in a
weighted causal map/FCM model to identify the crucial concepts/factors. The
expert panel member would be an experienced person having knowledge in the
subject area along with some professional credentials and domain experience.

32
The map building process facilitates and encourages debate and discussion
among the key stakeholders regarding the scenario theme [313]. Moreover,
participation of the stakeholders in this process increases their input in the model
and facilitates to develop consensus among them. The experts also help to
identify the input vectors that represent plausible combinations of the conceivable
concept states. Thus, FCM-based scenarios provide the benefits of intuitive
scenario methods with quantitative analysis. The utility and usefulness of FCM-
based scenarios significantly depend on the quality of the underlying causal map.
Therefore, it is critical to select knowledgeable experts, and carefully examine the
causal relationships, uncertainties, and assumptions of the FCM model. FCM-
based scenarios are developed after collecting and combining the mental models
of multiple experts. The literature also highlights the importance of capturing
multiple mental models in foresight projects [69, 268].
The FCM-based scenario building approach is a very new method proposed
in the year 2011; thus, it has not been applied to a variety of fields. The limited
use of this method may be considered as a limitation. However, the researcher
has conducted a pilot study of this approach and published the research findings
in International Journal of Energy Sector Management [11]. The research
framework was also presented at Portland International Conference for
Management of Engineering and Technology (PICMET), 2011 [7]. The
participants in the conference discussed and appreciated this research
framework.

33
2.3.3 Benefits of FCM-based Scenario
It can be inferred from Table 2 that there are several critical weaknesses of
the prominent quantitative scenario building techniques. However, the FCM-
based scenario development approach has the capability to overcome these
weaknesses and it offers several benefits. Moreover, FCM-based scenarios are
based on the combination of both creative (qualitative) and more structuring
(semi-quantitative) approaches and it also allows the stakeholders to play a vital
role. Unlike the use of an extrapolation model, in the FCM modeling the
researcher excite the FCM matrix and examine how the scenario drivers will
change based on the causal relationships between them. This approach
develops alternative, plausible, and consistent future scenarios which consist of
logically suited premises. Therefore, FCM is a comprehensive technique for
developing scenarios and we can conclude that this approach has the ability to
overcome the weaknesses of the other quantitative scenario building methods.
Following are the major benefits of using FCMs for scenario development [2,
152, 170, 171, 334]:
This approach can bridge the gap between the qualitative scenario
development approaches and quantitative models;
FCMs are based on causal cognitive maps which is an accepted intuitive
method;
FCMs can overcome the limitations of simple causal cognitive maps such
as indeterminacy issues in cognitive maps;

34
It incorporates system concept and the mapping process fosters system
thinking;
FCM-based scenarios can combine the benefits of intuitive scenario
building methods with a quantitative analysis;
FCMs represent knowledge in a symbolic manner and behavior of a
system can be observed quickly, without the services of an operations
research expert or an expensive and proprietary software tool;
It is relatively easy to use FCMs for representing the structured knowledge
and the subsequent inferences can be computed by numeric matrix
operation;
It can be performed in a short amount of time;
It has a high-level of integration because the causal maps and the
resulting FCMs can be easily modified or extended by adding new
concepts, causal links, or changing the weights assigned to the causal
links;
The quantitative analysis of causal cognitive maps significantly helps to
improve the quality of scenarios. After deciding the plausible combinations
of input values for all independent FCM variables, the scenario planner
calculates the alternative stable states of the FCM model when it settles
down; and
This approach can be used to analyze both the static and dynamic
scenarios evolving with time.

35
Scenario planning is among the most frequently used method in the strategic
foresight studies [18, 54, 190, 268, 286, 343]. Coates presents a generalized
framework consisting of 11 steps to conduct a strategic foresight study [54]. A
comparison is made of the FCM-based scenario development technique with the
most prominent intuitive scenario building models presented by Schoemaker and
Schwartz against the strategic foresight framework proposed by Coates in Table
3. Schoemaker presented a very comprehensive scenario building model
consisting of 10 steps [292-294]. Peter Schwartz introduced the scenario
methodology for the first time in “The Art of the Long View” and his model
consists of eight steps which is also very popular and often used for building
scenarios [36, 167, 298].
Table 3: Comparison of strategic foresight framework with prominent scenario models
S No
Strategic Foresight framework [54]
Schoemaker’s scenario building model [292, 294]
Schwartz’s scenario building model [298]
FCM-based scenario building [152]
1 Describe the system to be studied
X X X
2 Identify the key actors and all stakeholders
X X X
3 Define key elements of the system
X
4 Create a systems diagram X 5 Identify the driving forces X X
6 Identify trends in the driving forces
X X X
7 Explore potential for change X X X
8 Develop images of the alternative future
X X X
9 Define the desired future
10 Identify policy, plans and actions
11 Draw out implications X X X

36
As shown in Table 3, the FCM-based scenario development technique covers
most of the elements of the strategic foresight framework. Thus, it can be inferred
that the FCM-based scenarios will significantly augment the strategic foresight
process and improve future studies than the scenarios developed by any other
scenario building model.
2.3.4 Scenario Selection and Appropriate Number of Scenarios
It is very important to develop an appropriate number of scenarios for a study,
but there is no precise response to the question of how many future scenarios
are optimal in the scenario planning literature. Various researchers and scenario
planners have recommended different number of alternative scenarios ranging
from three to six [10]. The scenario planners recognize that there can be
innumerable plausible futures. However, it is critical to develop a manageable
number of scenarios, in a logical manner, that best captures the dynamics of the
situation and effectively communicates the core issues [209]. Durance and Godet
recommend to develop scenarios around four to six fundamental hypotheses,
otherwise the sheer magnitude of possible combinations will be overwhelming
[79]. Some researchers recommend that the ideal set of scenarios consist three
or four narratives, which should be structurally or qualitatively different [69].
Bezold suggests that scenarios should be developed by considering the most
likely (expectable), challenging (what could go wrong), and visionary (surprisingly
successful) possibilities [22]. Wilson states that the number of scenarios should

37
not be fewer than two and more than four [354]. Schwab et al. recommend to
develop three scenarios in the scenario building process: trend extrapolation,
best-case, and worst-case scenario [297]. Schnaars reviews the scenario
planning literature and states that the majority of researchers conclude that
developing three scenarios is the best approach [290]. Table 4 provides a
comparison of the recommended number of scenarios and scenario selection
approach proposed by different researchers in the scenario planning literature.
Table 4: Recommended number of scenarios and scenario selection approaches
Source Recommended number of scenarios
How do the scenario planners select scenarios?
Harold Becker [19] 3 Select plausible combinations of the key factors
Clement Bezold [22] 3 Develop scenarios for the most likely, challenging, and visionary possibilities
Durance and Godet [79] 4 to 6 Develop the fundamental hypotheses Cornelis de Kluyver [70] 3 Judgmental translation into the optimistic,
pessimistic, and most likely possibilities Linneman and Klein [186] 3 to 4 Select plausible combinations of the key
factors Christine Ralph MacNulty [191]
3 to 4 Judgmental integration of trends and intuition
Vanston, Frisbie, Lopreato and Boston [336]
3 to 6 To conform the scenario themes
Van der Heijden [333] 2 or more Identify the driving forces, mega trends, and critical uncertainties
Paul Schoemaker [292] More than 2 Identify the key decision variables, trends, predetermined elements, and major uncertainties
Peter Schwartz [298, 299] 4 Rank the focal issues and key factors on the basis of their importance and uncertainty in a 2x2 matrix
Ian Wilson [355, 356] 3 to 4 Scenario writing and Cross Impact Analysis Bradfield et al. (Intuitive Logics Methodology) [30]
2 to 4 Intuition, expert opinion, STEEP analysis, and brainstorming techniques
Bradfield et al. (PMT Methodology) [30]
3 to 6 Quantitative trend analysis and the use of expert judgment
Miles and Keenan [211] 3 to 5 Through scenario workshops and focusing on the key driving forces, likely developments, and desired outcomes

38
James Dator [68] 4 Develop alternative futures based on four scenario archetypes: Continued growth, Collapse, Steady state, and Transformation
Sohail Inayatullah [142, 143]
3 to 5 Develop scenarios through Causal Layered Analysis
Galtung [94] 4 Identify two major uncertainties and develops scenarios based on these uncertainties
Therefore, based on the literature review presented in Table 4, it can be
concluded that development of 3 to 5 future scenarios is considered appropriate
by the majority of researchers. Pillkahn discusses the number of scenarios and
their implications, presented in Table 5 [249]. Generally, less than three
scenarios are considered inappropriate and cannot highlight all the possible
alternatives. Similarly, it is difficult to manage a large number of scenarios.
Mietzner and Reger state that only a limited number of scenarios can be
developed in detail, otherwise the process dissipates [209]. Moreover, in case of
generating more than five scenarios, the cost of drafting and evaluating a large
number of scenarios will be very high and not justifiable.
Table 5: Evaluation of number of scenarios in a project [249]
Number of Scenarios
Implications
1 It will be the most likely scenario, though it is convenient for the strategy formulation, but one scenario will not yield any alternate future or options
2 Two scenarios are usually based on two extreme situations (optimistic verses pessimistic) which are difficult to handle in the context of evaluation
3 Recommended by many researchers, but there is a risk of focusing on the middle (most likely) scenario
4 Possible and offering good cost-benefit ratio
5 Possible
More than 5 Possible, but cost of drafting and evaluating a large number of scenarios will be very high and not justifiable

39
Some useful tools presented in the scenario planning literature for the
selection and development of scenarios are explained with examples. Since the
FCM-based scenario development approach is a very new technique; therefore,
it is proposed to use some well-established tools to facilitate and augment the
FCM-based scenario building process.
Four Quadrants Matrix (Minimal Approach)
This approach is appropriate when the overview of all elements in an
environment reveals that only two drivers or factors are enough and can be used
to determine the future developments [248, 249, 298]. Scenarios are developed
in each quadrant of a grid representing the most important and uncertain
scenario drivers [298]. Thus, this approach helps to target the key drivers and
organize the scenarios around them. Curry and Schultz state that reducing the
focus on two drivers simplify the effort, but requires great care to choose the
appropriate factors that are sufficiently different from one another in order to
generate a strategic conversation [62].
Figure 3 illustrates an example of generating scenarios for the introduction of
a new product. In this example, one driver is demand and the other driver is
supply and it is assumed that the both factors can describe the future business
landscape. It results in generation of four scenarios represented by each
quadrant of the matrix shown in Figure 3.

40
S
up
ply
L
ow
Hig
h
Surplus supply
Market growth,
increased competition
No-man’s land
Enormous Opportunities
Low High Demand
Figure 3: Minimal approach to develop scenarios [249]
Wilson Matrix
The scenario planning literature highlights the importance of identifying and
prioritizing the most interesting, uncertain, and important scenario drivers [298].
Wilson matrix is used to evaluate and prioritize the influence/impact and
uncertainty of each scenario driver. It ranks all drivers against two dimensions:
potential impact and probability that the driver/trend will develop in to a significant
issue. Therefore, it determines the degree of uncertainty and their potential
impact on the future [249].
An example of the Wilson matrix used in a scenario case study is shown in
Figure 4. The most important scenario drivers are assigned the highest priority
and placed in the upper right side of the matrix highlighted in blue color. Similarly,
the drivers of low priority are placed in the lower right left side of the matrix
shown in green color.

41
D
evel
opm
ent
Pro
babi
lity
Low
M
ediu
m
H
igh
C11, C12, C18, C19
High Priority C2
C14 Medium Priority C3, C7, C9, C13, C16
C1, C4, C5, C8
Low Priority
C6, C15, C20 C17
Low Medium High
Potential impact
Figure 4: Use of Wilson Matrix to prioritize scenario drivers [7]
Van der Heijden also presents a similar concept in his impact-predictability
matrix that resembles the Wilson matrix [333]. He recommends to select scenario
elements that are expected to have the significant impact on the
business/organization and also exhibit a higher degree of uncertainty [333].
Morphological Analysis
Fritz Zwicky proposed the morphological analysis in the 1960s to analyze the
structure of a problem and explore the different possible solutions to a multi-
dimensional and non-quantifiable problem [363]. It has been used by a large
number of researchers in the field of futures studies, technological forecasting,
and development of scenarios [29, 58, 79, 269]. This process is considered an
improvement to the scenario selection and refinement activities [78]. Jenkins
recommends using the morphological analysis to eliminate the incompatible

c
m
b
re
th
th
h
a
ombination
morphologic
e subsequ
ecommend
Step
colum
Step
least
Step
Figure 5
hree input v
hese comb
elps to visu
nd ensure
ns of the
cal analysis
ently used
ed in the lit
1: Enter t
mn;
2: Identify
two) of eac
3: Combin
highlights
vectors. Th
inations sh
ually analyz
plausibility.
Figure 5:
scenario d
s can be use
to generat
terature to c
he critical
y the numb
ch scenario
e the devel
an examp
is process
own in gre
ze the comb
.
Morphologic
drivers [15
ed to gener
te the scen
conduct the
scenario d
ber of con
o driver; and
lopment va
le of the m
helps to en
en, red, an
binations of
al analysis to
1]. For FC
rate plausib
narios. The
e morpholog
drivers (con
ceivable d
d
riations into
morphologic
nsure that t
nd purple co
f conceivab
o generate inp
CM-based
ble input ve
e following
gical analys
ncepts) at t
evelopmen
o plausible
cal analysis
there is no
olor. It is a
ble develop
put vectors [7]
scenarios,
ectors which
three steps
sis [249]:
the top of
nt variations
strands.
s for gener
contradictio
useful tool
pment varia
]
42
, the
h will
s are
each
s (at
ating
on in
l and
ations

43
2.3.5 Scenario Validation
In the scenario planning literature several researchers and scenario planners
have identified the scenario validation criteria. Chermack et al. highlight the
importance of the scenario validation [50]. Wilson suggests the following
scenario selection criteria [354]:
Plausibility: The selected scenarios have to be capable of happening;
Consistency: The combination of logics in a scenario has to ensure that
there is no built-in internal inconsistency and contradiction;
Utility/Relevance: Each scenario should contribute specific insights into
the future that help to make the decisions;
Challenge/Novelty: The scenarios should challenge the organization’s
conventional wisdom about the future; and
Differentiation: They should be structurally different and not simple
variations on the same theme.
Schoemaker highlights the importance of consistency of the scenario
outcome [293]. He further explains that the scenario developer should ensure
that the trends are compatible within the chosen time frame and the scenario
outcome should be plausible (all events presented in the scenario outcome can
indeed exist together without a contradiction) [293]. Schoemaker emphasizes the
importance of consistency and plausibility in the scenario building activities [292].

44
Similarly, van der Heijden presents the following criteria for scenario validation in
his seminal work [333]:
At least two scenarios are needed to reflect uncertainity;
Each scenario must be plausible;
Scenarios must be internally consistent;
Each scenario must be relevant to the client’s concerns; and
Scenarios must produce a new and original perspective on the issues.
Durance and Godet argue that scenarios should meet five conditions:
pertinence, coherency, likelihood, importance, and transparency in order to be
credible and useful [79]. They further state that the transparency is an important
condition and without it the intended audience will not consider the scenarios
[79]. Alcamo and Henrichs also propose to evaluate the scenarios on the basis of
plausibility, consistency, creativity, and relevance [5].
Bradfield et al. emphasize that regardless of the scenario development
methodology; the coherence, plausibility, internal consistency, and logical
underpinning are the common baseline criteria for scenarios validation [30]. Burt
describes that a scenario should has a description of the plausible future and
internally consistent account of how the future world unfolds [36]. de Brabandere
and Alan Iny argue that good scenarios must be relevant to the decisions to be
taken, coherent, plausible, convincing, transparent, easy to recount, and illustrate
[69]. Foster states that ensuring consistency is the cardinal rule for scenario

45
planning [92]. Porter et al. also highlight the importance of the internal
consistency, plausibility, and quality of information used for scenario
development to ensure scenario validation [253]. Table 6 provides a summary of
the scenarios validation criteria from the literature.
Table 6: Summary of scenario validation criteria
Source
Scenario validation criteria P
laus
ibili
ty
Con
sist
ency
/ C
oher
ence
Cre
ativ
ity/
Nov
elty
Rel
evan
ce/
Per
tinen
ce
Impo
rtan
ce
Tra
nspa
renc
y
Com
plet
enes
s/
Cor
rect
ness
Alcamo and Henrichs [5]
X X X X
Van der Heijden [333] X X X X Durance and Godet [79]
X X X X X
Bradfield et al. [30] X X X Porter et al. [253] X X X Intuitive Logics Methodology [30]
X X X X X
La prospective Methodology [30]
X X X
George Burt [36] X X de Brabandere and Alan [69]
X X X X X
Paul Schoemaker [292, 293]
X X
Peter Schwartz [50, 298]
X X X
Gausemeier et al. [96] X X Peterson et al. [237] X X Ian Wilson [354] X X X X Vanston, Frisbie, Lopreato and Boston [336]
X X X
Kosow and Gaßner [168]
X X X X

46
A summary of the scenario validation criteria presented in Table 6 highlights
that the consistency, choerence, and plausibility are the most important criteria
for scenario validation. Creativity, relevance, and correctness of the information
presented in a scenario are also quite important. However, it can be conclude
that the consistency and plausibility are the decisive conditions for assessing
validity of scenarios. Moreover, the use of some well-established tools presented
in the scenario planning literature also helps to ensure validation. In this
research, the Wilson matrix is used to evaluate and prioritize the scenario drivers
and morphological analysis is used to develop input vectors and access their
plausibility.
In future research studies like scenario planning, the issue of scientific
validation has always been problematic [260]. Despite the utilization of
sophisticated tools and advanced simulation techniques, scenario development
is still considered a highly subjective art [200]. The futures research is considered
more an art than science, and good futurists rely more upon their skills and
experience to ensure validation [209]. Vanston et al. states that experts should
be asked to review the scenarios in order to ensure consistency, clarity, and
completeness of scenarios [336]. Therefore, scenario validation is a very
subjective process and it is based upon the gut feel and supposition of the
experts and scenario planner. However, it is important to consider the scenario
validation criteria given in Table 6 for building future scenarios.

47
For FCM-based scenarios, the scenario developer can ensure validity by
following the standard modeling practices, cross checking with the experts, and
proper translation of the experts' knowledge. The specific steps taken to ensure
validity of FCM-based scenarios are explained in Section 5.3.1.
2.4 Technology Roadmaps
Technology roadmap is a practical tool used for strategic and technology
planning and it is defined as “A future based strategic planning device that
outlines the goals, barriers, strategies necessary for achieving a given vision of
technological advancement and market penetrations” [357]. Technology
roadmaps are extensively used in many diverse fields at the product, technology,
organization, industry, and national levels. Roadmap is a high-level planning tool
used to support the development and implementation of strategy and action
plans, and it is also used for communication of the plan [239]. Roadmaps explore
challenges and opportunities associated with the deployment of a technology or
introduction of new products [174]. Roadmaps define strategic objectives,
establish both long-term and short-term goals, prioritize various action items, and
estimate resources requirement [31, 246]. Moreover, detailed action plans are
elaborated for achieving the targets and implementing the desired future in a very
systematic way. This tool is also very popular among the technologists to
develop roadmap of a particular technology and roadmap acts as a focal point for
the subsequent R&D efforts [173]. An increasing number of articles published on

48
technology roadmaps indicates the growing popularity of this tool among the
researchers from academia, industry, and government [8].
Roadmaps portray future market directions, technological developments, and
help to make strategic decisions. Generally, roadmaps are used to answer three
fundamental questions: (a) Where are we going? i.e. what are our vision,
mission, objectives, goals, and targets; (b) Where are we now? i.e. present state
of technology, products, markets; and (c) How can we get there? i.e. policy
measures, R&D programs, action items, long-term and short-term strategies
[238, 243, 246, 256].
TRM provides a framework to link the business and product plans directly to a
technology by establishing linkages between the technological and commercial
functions [31, 174, 224, 238]. Thus, TRM concepts integrate technology
developments and business planning in order to achieve the overall business
objectives. Roadmaps can facilitate the decisions of resource allocation and
ensure better investment decisions in the right technologies over the lifecycle of
products and businesses [238, 246, 256, 358]. Roadmaps also assist in filtering
alternate technological options and as a result of this process, decision makers
can focus on the promising technologies [174].
Technology roadmaps portray a concise and high-level integrated view of the
future course of action. Usually roadmaps use a graphical approach that allows
the managers and decision makers to visualize the complete technology and

m
2
d
v
re
p
m
ro
c
v
(m
m
market statu
45, 246].
ifferent fun
isually high
esources a
otential pro
multi-layered
oadmap inc
omplex info
ersatile too
Roadma
market pull
may result
us, key mile
The graph
ctions and
hlights the l
and infrastr
oblems, an
d roadmap
cluding eas
ormation in
ol and it can
Figu
ps may b
l approach
in new bu
estones, an
ical roadm
perspectiv
linkages am
ructure; an
nd action it
. There are
se of under
to a small
n encompas
ure 6: Generic
e develope
) or trying
usiness op
nd action it
maps consis
ves against
mong mark
nd identifie
tems [238,
e several be
rstanding an
space [244
ss a very br
c multi-layere
ed by aim
to exploit
pportunities
tems on a
st of a ch
an agreed
kets, produc
es the gap
256]. Figu
enefits due
nd ability to
4, 246]. The
road scope
ed graphical ro
ming at the
the techno
s (technolo
sheet of p
hart having
d timeline. A
cts, techno
ps, opportu
ure 6 highl
e to graphic
o compress
erefore, roa
e of issues.
oadmap
e custome
ological inn
ogy push a
aper [238,
informatio
A roadmap
ologies, poli
nities, barr
ights a ge
cal aspects
s extensive
admap is a
er requirem
novations w
approach).
49
242,
on of
also
icies,
riers,
neric
s of a
e and
very
ments
which
The

50
development of a good and effective roadmap requires simultaneous
consideration of market pull and technology push, and it is required to carefully
balance the both aspects [120, 238, 246]. Most of the successful roadmapping
efforts integrate both technology push and market pull perspectives [224]. Garcia
et al. defined technology roadmapping as a needs-driven technology planning
process which helps to identify, select, and develop technology alternatives for
meeting the product needs [95].
2.4.1 TRM Process
There are multiple methods and approaches published in the literature for
developing a technology roadmap and it has been recommended to use an
appropriate methodology depending upon the overall goal and objective of the
roadmap [31, 174, 180, 240]. Research based on an analysis of 80 different
roadmapping exercises concluded that there are several good practices to
implement TRM and it is not possible to declare one single best method or
approach [71]. Moreover, different perspectives can be used to develop a
technology roadmap [173]. However, most of the TRM literature emphasize that
the roadmapping process should start by identifying the stakeholder (within a
company/corporation in case of organizational roadmap or from the entire
industry or sector in case of multi-organizational industry roadmap), bringing
them together in the roadmapping workshops to share their ideas for the future,
and defining the scope of the roadmap [238, 242, 243, 246, 357, 358]. Therefore,
roadmaps provide a useful means for integrating multiple perspectives for

51
strategic planning and innovation processes. Harmon et al. highlighted the
importance multi-perspective approach for evaluation, assessment, and
forecasting of promising technologies to address nergy issues [123].
The TRM process also results in building consensus across the company or
entire industry/sector by bringing together all the key stakeholders and develops
a vision of the future. The TRM process significantly enhances the
communication within the company or industry which is a valuable benefit [99]. It
is also recommended that the team members responsible for developing a
roadmap should have an overview of the concepts and techniques of the
roadmapping process. Generally, a facilitator having good knowledge of the TRM
process manages the entire process and keeps the participants focused. Bray
and Garcia presented the following three major phases in the technology
roadmapping process shown in Table 7 [31]:
Table 7: Three phases in the TRM process [31]
Roadmap Phase Activity in each Roadmap Phase
Phases 1 Preliminary Activity
Define the scope and boundaries for the technology roadmap
Satisfy essential conditions Provide leadership/sponsorship
Phase 2 Tech Roadmap development
Identify the “product” that will be the focus of the roadmap
Identify the critical system requirements and their targets Specify the major technology areas Specify the technology drivers and their targets Identify technology alternatives and their time lines Recommend the technology alternatives that should be
pursued Create the technology roadmap report
Phase 3 Follow-up activity
Critique and validate the roadmap Develop an implementation plan

52
Industry Canada also presented the guidelines for the development and
evaluation of industry roadmaps after developing 26 industry roadmaps [144,
145]. Three phases of TRM are described in the guidelines with detailed
recommendations for the role of government and industry. It has been
recommended that government should facilitate the development of industry
roadmaps and provide necessary support throughout the TRM process [145]. It is
also important to monitor participation of the government and industry in the TRM
Process and analyze the results of a roadmap [144].
2.4.2 Application of Technology Roadmaps
Technology roadmaps are used for the business strategy development, policy
formulation, product and technology planning, strategy planning, understanding
technology trends, keeping track of product and technology breakthroughs, and
prioritization of R&D and product development projects. Technology roadmaps
are also used for enhancing communication and information sharing within a
company or entire industry, defining problems and needs, identifying barriers and
hindrances, investigating technology and market gaps, establishing future vision
and strategy, deciding short and long-term action items, assessing impacts of
new technologies and market development, and helping the mangers for decision
making, resource allocation, program / policy support, and evaluation [31, 65,
174, 238, 241, 246, 358]. Therefore, by identifying the gaps in the technology

53
planning and market opportunities, companies can take better strategic decisions
and accordingly plan resources allocation.
A technology roadmap also helps the R&D managers and policy makers to
notice and track global trends in the research of promising, emerging, and
disruptive technologies that have better potential in the future. After developing a
technology roadmap, all stakeholders have a better understanding of the current
market and technology status, vision, goals, objectives, and future plans. Kostoff
et al. elaborated that roadmaps provide a comprehensive overview of the future
technological landscape with an agreed view of vision to aid the decision making
[174]. Therefore, technology roadmaps provide a vital information to the decision
makers at different levels to make better strategic decisions [95].
Technology roadmaps also provide an opportunity for discussion among the
researchers and business-oriented people from the academia, industry, and
government to find out the reasonable ways for technology development [93].
Another reason of increase in the use of the roadmapping method is due to the
fact that it can be integrated with other management techniques such as the
Delphi method, scenario planning, balanced scorecards, SWOT (strengths,
weaknesses, opportunities, and threats) analysis, quality function
deployment (QFD), innovation matrix, technology Intelligence techniques,
bibliometrics analysis, citation network analysis, patent analysis, and product
development stage gates [120, 159, 161, 173, 176, 181, 242, 246]. These tools
help to better assess the technology landscape and market situation.

54
2.4.3 TRM in Energy Sector
Technology roadmaps are extensively used in the renewable energy sector
[8]. Increasing the share of renewable energy resources in the national energy
mix is a multiple facets problem and a roadmap is considered an appropriate tool
to address this complex issue. Research also indicates that roadmaps are critical
when technology decisions are not straight forward [95]. In the energy sector, the
roadmaps are generally developed based on the needs and during the
roadmapping process, the needs are linked with the markets, industry, products,
technologies, capabilities, resources, infrastructure, constraints, limitations,
strategies, and policies [8].
In the energy sector, roadmaps can be grouped into the national,
industry/sector, and organizational level roadmaps [8]. The national level
roadmaps are developed to establish the national energy vision, goals, and
targets, provide guidelines to the policymakers, decision makers, governmental
organizations, research laboratories, and industry of the entire country or region.
In the national level roadmaps, the important national issues related to the
energy sector such as energy security, future energy dependence, policy and
regularity requirements, and environment protection are discussed. These
roadmaps usually present the high-level planning for developing or acquiring the
required technologies and provide a framework for public-private collaboration.

55
The industry/sector level roadmaps represent the collective knowledge of the
entire industry comprising of multiple companies, government departments,
research laboratories, and universities [8]. These roadmaps are intended to
communicate to a broad audience with varying levels of knowledge about the
issue. The sector level roadmaps are also used for policy debate. These
roadmaps establish the vision of an industry, provide detailed guidelines for the
R&D future of that technology, and assess the political and economic issues that
can impact the industry in the long run. The sector level roadmaps identify the
common needs, help to focus on the critical technical issues, and facilitate
collaboration for developing the required key technologies. These roadmaps also
consider the technical, political, and market constraints and future uncertainty.
The sector level roadmaps also present the long-term competitive position of
the industry and technology. The key technical and commercial issues and
barriers are analyzed with a detailed root cause analysis. Subsequently, the
issues are translated into the action items with an agreed timeline and
responsibility. These roadmaps are also used for lobbying lawmakers in order to
make favorable policies. In renewable energy sector, the industry roadmaps are
generally emerging technology roadmaps which are different from traditional
product-technology roadmaps. The emerging technology roadmaps focus more
on forecasting the development, commercialization, and deployment of a new
technology [347]. Generally, the development of an emerging technology is very
expensive or risky for one company due to the associated technical and

56
commercial risks. Thus, the sector level roadmaps facilitate and foster
cooperation and collaboration for joint technology development. Partnerships and
collaboration also accelerate the pace of technology innovations and reduce the
associated risks.
The comparison of the national and sector level roadmaps reveals that there
are some similarities and differences. These roadmaps are generally developed
for a longer time horizon, create consensus among all major stakeholders,
promote collaboration, and recommend policy measures. The major differences
between the national level and sector level roadmaps are:
Table 8: Major differences between national and industry roadmaps
Differences National Roadmaps Industry Roadmaps
Roadmap Drivers Energy security, high energy cost, global warming, environmental degradation, and enhancing national competitiveness are the main drivers for national roadmaps
Increasing energy cost, changing governmental policies, new business opportunities, desire to exploit new technologies and available resources are the main drivers for industry roadmaps
Strategies / Action Plans
Strategies are mentioned at a broad level
Detailed action plans are formulated and action items are identified
Barriers Technical and commercial barriers are briefly mentioned
Detailed technical and market analysis is performed and key challenges and barriers are identified
Targets Overall targets for energy generation from various sources / technologies are established
Detailed technology performance improvement targets and technology cost reduction milestones are established
The organizational level roadmaps are mainly used for the future technology
planning and making appropriate organizational strategy to achieve the overall
business goals. Companies use roadmaps to analyze alternatives, evaluate and
prioritize the R&D projects, facilitate the technology investment decisions, comply

57
with the policy regulations, and align the technology investments with the market
and product needs. As a result, companies formulate their technology strategy in
accordance with the organizational objectives.
2.4.4 Benefits of Combining Scenarios and Roadmaps
Literature highlights that both scenario planning and technology roadmapping
have some strengths and weaknesses, which make it more desirable to integrate
these two methods. Various ways have been devised to overcome the
disadvantages and shortcomings of these individual methods; however, the multi
method approach that uses both in a study is considered more appropriate [18,
286, 287]. Schoen et al. recommend to combine explorative and normative
elements in a foresight project [295]. Mietzner and Reger emphasize that
scenario building technique may improve if it is combined with another future
research method such as the roadmapping or the Delphi method or both [209].
Strauss and Radnor emphasize that the combined use of scenario planning with
technology roadmaps can enhance the flexibility and vision of the roadmap,
capture and convey the full context of decisions, and enable anticipation of a
broader range of possible changes [319]. A comparison of advantages and
disadvantages of scenarios and roadmaps is presented in Table 9. It indicates
that using both scenarios and roadmaps is very beneficial because both methods
are complementary; disadvantages of roadmaps can be addressed by
advantages of scenarios and vice-versa [286].

58
Table 9: Comparison of scenarios and roadmaps [286].
Scenarios Roadmaps Advantage: Scenarios can be exploratory and/or normative to explore alternative and desirable future
Disadvantage: Roadmaps are usually normative and target oriented, and focus merely on the desirable future
Advantage: Encourage open and creative thinking
Disadvantage: Suggest linear and isolated thinking
Advantage: Highly participative and interactive
Disadvantage: Sometimes difficult to communicate with non-participants
Disadvantage: Describe a set of future circumstances, but do not give a pathway into the future
Advantage: Connect the future with the present and propose short to long-term policies and actions
Disadvantage: It takes longer to understand scenarios
Advantage: Provide concise information in one single figure
Disadvantage: More open ended and may lead to many interpretations
Advantage: More precise and clear in terms of actions and strategies
A technology roadmap is generally focused on a single future with a complete
action plan. The use of scenario planning in a project can introduce thinking and
planning for multiple futures and strategic options. Thus, both approaches
complement each other and scenarios enhance the roadmapping process by
focusing on alternative futures. Pillkahn states that drafting of scenarios gives a
sketch of the future and it is important to incorporate that into the roadmap [249].
Therefore, this process brings more new knowledge to the existing roadmap by
identifying multiple alternatives of the future state of technologies, needs, policies
and environment. Some benefits of integrating the scenario planning and the
roadmapping process are summarized below [286, 287, 319]:
Setting visions for roadmaps by considering alternative futures;
Portraying alternative pathways for roadmaps;
Adding an exploratory feature to roadmaps; and
Increasing robustness of roadmaps against all scenarios.

59
The combined use of scenarios and roadmaps will identify multiple
alternatives and strategic options, cater for the future needs and uncertainties,
and facilitate development of responsive and robust action plans. Furthermore,
the combined use of multiple techniques can offer a significantly clearer and
richer insight due to the analysis from the multiple perspectives [66, 286]. In this
process, the stakeholders are encouraged to focus on the solutions likely to meet
multiple scenarios. Thus, the use of scenarios make people conscious of the
future and subsequently based on the developed scenarios, the decision makers
plan their future course of action and develop roadmaps.
2.5 Expert Judgment
Expert judgment is commonly used to develop scenarios and technology
roadmaps. Expert judgment is the data given by an expert in response to a
question or problem. Judgment is defined as an inferential cognitive process by
which an individual draws conclusions about unknown quantities or qualities on
the basis of the available information [271]. Meyer and Booker describe that
expert judgment consists of information and data obtained from the qualified
individuals that can be used to solve a problem or make decisions in various
fields and domains [207]. Expert judgement is also defined as an expression of
opinion, based on knowledge and experience, that the experts make in
responding to problems [165]. In the literature, expert judgment is also called
expert opinion, subjective judgment, expert forecast, best estimate, and educated

60
guess. Expert judgment is often obtained and considered a very reliable option
available when faced with an uncertain future and having a lack of historical data
[79, 207]. Generally, decision making in these situations with a high degree of
uncertainty about a future environment give rise to two specific needs [30]:
The need for a methodology to reliably capture the opinions of a large and
diverse group of experts; and
The need to develop models of future environments, which would permit
various policy alternatives and their consequences to be investigated.
The comparison of the various expert judgement methods reveals a set of
generic phases/steps, which are used to a greater or lesser extent in each
method depending on its objectives. Following are the generic phases of an
expert judgement method [310]:
Definition of the elicitation objectives;
Identification and selection of the experts;
Preparation of the questionnaires, instruments, and training materials;
Process of obtaining the expert opinion;
Analysis and aggregation of the expert judgments; and
Synthesis.
There are various means to obtain expert judgment, and according to
Börjeson et al. usually the Delphi method, workshops, and surveys are
conducted to obtain expert opinion for the development of scenarios and

61
roadmaps [29]. Scenarios and technology roadmaps are always developed
based upon the expert judgment obtained through the workshops, expert panels,
Delphi studies and surveys [8]. Therefore, the use of expert panels is a widely
used approach for technology roadmapping and it has also been used in several
PhD dissertations [98, 101].
Cooke provides a brief historical overview of expert judgement methods and
argues that the systematic use of expert judgement for decision making was
developed at the RAND Corporation in the United States after World War II [56].
The RAND Corporation developed the first two methods using expert judgement
that were the Delphi method and Scenario Analysis.
2.5.1 The Delphi Method
The Delphi method was developed at the RAND Corporation in the 1950s as
a spin-off of an Air Force sponsored research project, “Project Delphi” [56, 275].
The Delphi method is a popular technique for forecasting and an aid in the
decision making process based on the experts’ opinions. The need to elicit and
synthesize expert opinion inspired the development of the Delphi technique
[261]. Linstone and Turoff define Delphi “as a method for structuring a group
communication process so that the process is effective in allowing a group of
individuals, as a whole, to deal with a complex problem” [188]. It is a systematic
and interactive method relying heavily on the expert panels [199]. It is based
upon the principle that the judgments and opinions obtained from a structured

62
group of experts are better and more accurate than those obtained from an
individual or an unstructured group [275, 276]. This method has gained popularity
among the research managers, policy analysts, and corporate planners and has
been used extensively in various fields. The Delphi technique is applied to
technology forecasting and many types of policy analysis in various fields and
domains [199].
The Delphi method is based on a structured process for collecting and
distilling knowledge from an expert panel through questionnaires combined with
controlled opinion feedback. A series of sequential questionnaires or rounds is
conducted with controlled feedback in order to gain the consensus of opinion
from an expert panel [188]. The feedback and opinion of the group members is
summarized, combined, and given back to the experts after the first Delphi round
and they are again asked the same questions [188, 199]. This process is
repeated until a general consensus in the outcome is obtained or the results are
stabilized. Research on the number of Delphi rounds indicates that most changes
occur in the transition from the first to the second round when the expert panel
members change their judgment, and generally four rounds are sufficient to
reach a consensus [86]. This systematic control ensures objectivity to the
outcome of the Delphi study and provides a sharing of responsibility, which
releases the participants from group inhibition [185].
The Delphi Method also reduces the impact of the powerful members in a
group by establishing anonymous group communication and avoids imposition of

63
their point of views on the other group members [188]. Torrance states that the
power or status of the group members influences the group decisions and less
powerful members demonstrate an unwillingness to disagree with the most
powerful member, even if they have the correct solution, so this may adversely
affect the quality of the decisions [328]. Moreover, in highly structured cultures
individuals may refrain from expressing their opinions freely, so Delphi can be
used as a useful approach to overcome these cultural barriers [101]. The Delphi
method is also used as a useful communication tool to generate a debate [255].
The following three characteristics of the Delphi method distinguish it from the
conventional face-to-face interaction [199, 276, 360]:
Anonymity
The experts give their answers to the questions in an independent and
anonymous way without any undue social pressures. The group members
do not know who else is in the group. This gives an opportunity to the
experts to freely express their opinion on the basis of merit alone.
Iteration with controlled feedback
The process is reiterated until a degree of consensus is reached or results
are stabilized. Iterations allow the experts to change their opinions. The
controlled feedback takes place after every Delphi round, during which
each group member is informed of the opinions of the other group
members. Thus, the participants are encouraged to review their answers
in light of the combined judgment of the group.

64
Statistical group response
The set of responses (combined group judgment) is then sent back to the
experts and they are asked if they wish to revise their initial feedback. This
includes statistical information of the group response such as the mean or
median and the extent of spread of the members’ opinions.
In the first Delphi round, the expert panel members are asked questions
related to the subject matter under consideration. The moderator collects their
judgments and provides feedback of the first round to the experts. For the
second round, the experts are asked to either adjust their estimates or provide a
justification of their rationale if they differ from the majority judgment. Due to the
controlled feedback from the previous rounds, sometimes the experts tend to
achieve a consensus of opinion [149]. Therefore, this process is iterated until a
consensus is generated or the results are stabilized between two rounds.
Linstone and Turoff emphasize that the number of rounds should be based on
when the stability in the responses is attained, not when the consensus is
achieved [189]. Chi-squared test has been proposed in the literature to determine
the stability of the results from an expert panel [43, 67].
Advantages of the Delphi Method
The Delphi method helps to achieve the consensus in a given area of
uncertainty or lack of empirical evidence [72, 223]. The participants of a Delphi
study bring their extensive knowledge and vast experience to the decision

65
making process [223]. It is very useful in situations where individual judgments
must be tapped and combined to overcome an incomplete state of knowledge
[72]. The controlled feedback between the Delphi rounds stimulate new ideas
and it is also motivating for the participants [247].
The Delphi process facilitates the experts to participate in a group
communication process asynchronously at times and places convenient to them,
which is another key benefit [189]. Absence of an obligation to meet in person
improves the feasibility of the Delphi process, lowers its cost, and allows
participation from diverse geographic locations [118].
Rowe et al. suggest that the structured approach and participant anonymity
offered by the Delphi approach leads to a process gain [276]. Whereas, other
methods of obtaining expert judgment or consensus like committees are
considered to be prone to the biasing effects of personality traits, seniority,
status, and domination by the powerful individuals [149, 223]. In the face-to-face
interactive groups, there is a tendency among the low-status members to “go
along” with the opinions of the high-status members despite of contrary feelings
[328]. In contrast, the Delphi method can overcome these negative effects and in
a Delphi study the consensus reflects a normative rather than an informational
influence or tendency to follow the leader [223].
Brockhoff, Riggs, Larreche and Moinpour, and Bolger et al. state that a Delphi
procedure produces superior predictions and accurate forecasts than a normal
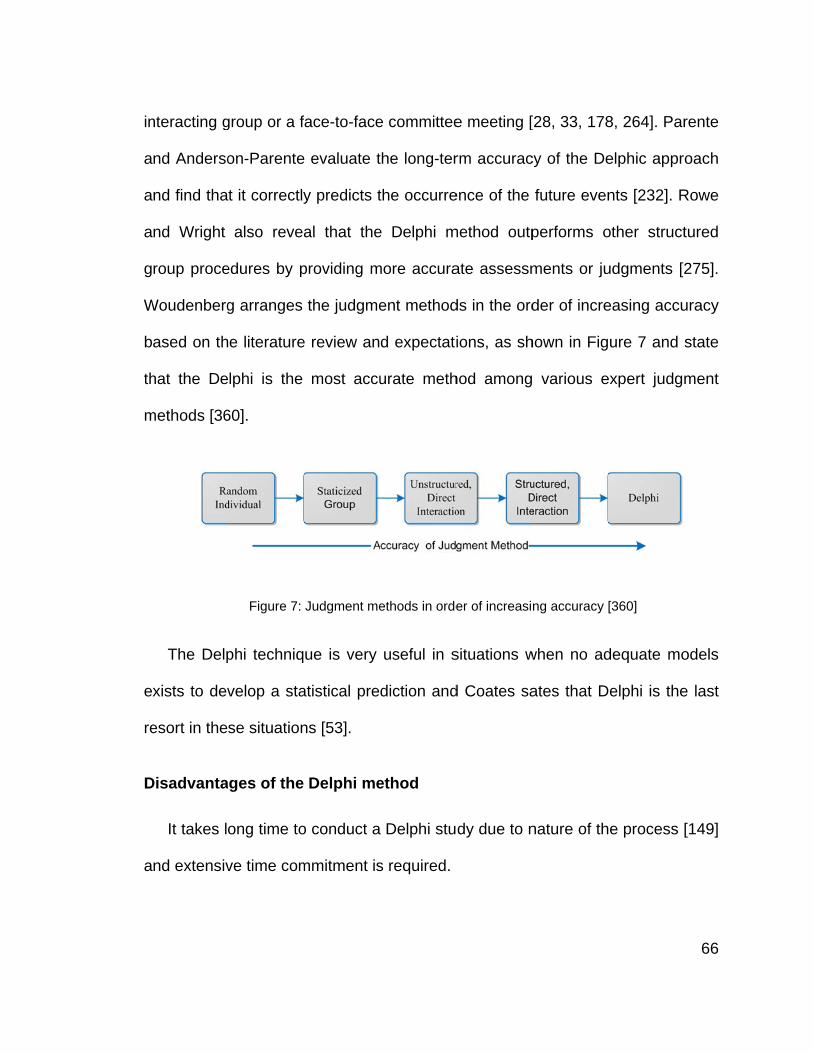
in
a
a
a
g
W
b
th
m
e
re
D
a
nteracting g
nd Anderso
nd find tha
nd Wright
roup proce
Woudenberg
ased on th
hat the De
methods [36
The Delp
xists to dev
esort in the
Disadvanta
It takes lo
nd extensiv
group or a f
on-Parente
t it correctly
also revea
edures by p
g arranges
e literature
lphi is the
60].
Figure 7:
phi techniq
velop a sta
se situation
ges of the
ong time to
ve time com
face-to-face
e evaluate t
y predicts t
al that the
providing m
the judgme
e review an
most accu
Judgment me
ue is very
atistical pre
ns [53].
Delphi me
o conduct a
mmitment is
e committee
the long-ter
the occurre
e Delphi m
more accura
ent method
d expectati
urate meth
ethods in orde
useful in s
diction and
ethod
Delphi stu
s required.
e meeting [
rm accurac
ence of the
method outp
ate assessm
ds in the ord
ions, as sh
hod among
er of increasi
situations w
d Coates sa
dy due to n
[28, 33, 178
cy of the De
future even
performs o
ments or ju
der of incre
hown in Fig
various e
ng accuracy
when no ad
ates that D
nature of th
8, 264]. Par
elphic appr
nts [232]. R
other struct
udgments [2
easing accu
ure 7 and
expert judgm
[360]
dequate mo
elphi is the
e process [
66
rente
oach
Rowe
tured
275].
uracy
state
ment
odels
e last
[149]

67
Output of a Delphi process reflects the best opinion of the experts [247], so it
is critical to choose suitable experts. Sometimes selection of an expert panel
becomes very problematic.
It is possible that in pursuing the consensus among the experts, the process
may lead to diminish some of the best opinion and the study may only generate a
set of bland statements representing the lowest common denominator [278].
It is also argued that anonymity in a Delphi study may lead to a lack of
accountability of views expressed and encourage hasty decisions [278].
However, the sequential rounds may positively discourage such action.
Sackman points out that it is difficult to determine reliability and scientific
validation of the findings [278]. It is due to the fact that the Delphi studies are
based upon intuitive judgments, collection of half formed ideas from the experts,
therefore, one cannot judge it on the same basis as a concrete measurement
[247].
Application
The initial application of the Delphi method was in the area of national
defense and after that it has been extensively used in a wide variety of
applications [188]. Martino states that it remains one of the most popular
methods for technology forecasting [200]. The Delphi method has been
successfully used in many applications and it is considered as a promising

68
technique in future roadmapping [32, 98] and scenario planning activities [24, 63,
136]. The literature highlights that it has been extensively used for the policy
analysis, healthcare, education, finance, management, marketing, human
resources, manufacturing, information systems, transportation, engineering,
national foresight planning, urban planning, energy foresight, environment,
budget allocations, service planning, analysis of professional characteristics and
competencies, and curriculum development [20, 32, 63, 122, 188, 255, 287]. The
Delphi method has also been extensively used as a useful tool for solving the
problems in the energy sector for creating energy roadmaps and conducting
energy foresight projects [63, 146, 147, 234, 266, 274, 304, 321, 332].
At the national level, the Delphi method has been extensively used in several
countries. There are examples of national level studies in Germany [26], Japan
[32, 60], France [274], Thailand [102], India [44], Poland [63], Finland [266],
Korea [308], and Austria [327]. In this research, the Delphi method was used to
obtain judgment and opinion from the experts for the development of a national
level wind energy roadmap. The experts were asked to rank and prioritize the
roadmap barriers and challenges against different scenarios in the roadmap.
2.5.2 Other Expert Judgment Methods
There are several other methods based on eliciting the expert knowledge and
judgment through a group of experts. Some methods used in the technology

69
foresight studies and based on the use of the expert knowledge are mentioned
below:
Nominal Group Technique (NGT)
Delbecq and Van deVen developed the Nominal Group Technique (NGT) in
the year 1968 and it is a structured decision making method for working towards
consensus [72]. In this method every participant of the expert panel gives their
views and ideas for the solution and these ideas are prioritized using a ranking
process [72, 212]. Its major strength is that opinions of all experts are taken into
account, so every team member has an equal voice in sharing their ideas. During
this ranking process, the duplicate solutions are eliminated and every participant
ranks the ideas as 1st, 2nd, 3rd, 4th, and so on. Thus, the output of NGT is a
prioritized list of ideas generated by a group of experts. It is critical to carefully
select the members of an expert panel, because the value of the NGT is based
on their knowledge and expertise.
This technique has gained considerable recognition and it has been applied in
the healthcare, social services, education, industry, and government
organizations [272]. The NGT process consists of the following six steps after
defining the problem [72, 272]:
Brainstorm and generate ideas in writing;
Round-robin feedback from group members to record each idea in a terse
phrase;

70
Discussion of each recorded idea for clarification and evaluation;
Individual voting to prioritize ideas by anonymous rating;
Brief discussion of the preliminary vote; and
Final individual voting through rank ordering followed by the group
discussion and group decision.
NGT is a useful approach, especially in the following situations [72, 212, 272]:
When the discussion is dominated by some individuals of the expert panel
and it may prohibit participation or creativity of the other members;
When some members are reluctant to suggest ideas and freely participate
due to apprehension of being criticized or any other reason;
When the group members think better in silence;
When some group members are new and less experienced than others or
there is a difference in their social status such as manager and
subordinate staff;
When the issue is controversial or there is a heated conflict;
When it is desired to generate a lot of ideas; and
When it is required to prioritize a few alternatives for further evaluation.
Advantages and Disadvantages of NGT
The major advantage of NGT is that it provides a balanced participation of
every member of the expert panel in the process and the final result. The NGT

71
groups perform better than other interacting groups in accuracy, better use of
group resources because all members participate, and it results in better
decisions [126]. Moreover, NGT is a simple technique and usually it takes less
than a day to complete the entire process. It is also less costly than other group
methods.
The major disadvantage of NGT is that it is overly mechanical, simplified, and
lacks flexibility [285]. It is focused on a single purpose and single topic. Only
individual brainstorming is done and cross-fertilization of ideas is constrained
[285]. NGT minimizes discussion and does not allow for the full development of
ideas; therefore, it is less stimulating group process than the other methods. It is
also quite possible that opinions may not converge and consensus is not
achieved in the voting process. Due to these shortcomings, it has been
recommended to combine NGT with other group techniques in order to overcome
its limitations [148].
Focus Groups
The focus groups are generally used for idea generation [125]. In this
technique, a group of experts focuses on a topic and they are asked about their
views, perceptions, opinions, beliefs, and attitudes towards a product, service,
concept, idea or advertisement [125, 220]. The focus questions are asked in an
interactive group setting and the experts are free to talk with other group
members in an open environment. Generally, the focus groups do not produce

72
an actual technology forecast, but may be useful in generating an insight and list
of items that may be used in conjunction with another technique. This method
usually requires some group interaction prior to the creation of a list of ideas
[212].
Brainstorming
Brainstorming is a popular and widely used tool for doing creative tasks in
organizations such as developing products, redesigning business systems, and
improving manufacturing processes [322]. Its main objective is to elicit ideas from
a group of people [211, 322]. A brainstorming session brings new ideas on how
to tackle a particular problem in a freethinking atmosphere and presents a wide
range of ideas and solutions. The participants are encouraged to freely articulate
their ideas followed by a rigorous discussion in order to stimulate creativity and
thinking “out of the box”, to let dissident viewpoints enter in the discussion at an
early stage [211]. This technique also supports the future studies, but does not
produce an actual technology forecast. An effective brainstorming session
consists of 7 to 12 participants.
Weighted Sum Method (WSM)
The Weighted Sum Method (WSM) is a commonly used approach for ranking
the alternatives, especially in a single dimensional problem [251]. It is a multi-
criteria decision making method used for evaluating a number of alternatives
against the decision criteria. The best alternative is the one with the maximum

73
score. It is the most commonly used approach in sustainable energy systems
[349]. The total value of each alternative is equal to the sum of products. If there
are m alternatives and n criteria, then the importance of each alternative is
calculated using the equation number 1 [195, 251, 314]:
for i = 1, 2, 3, ….m (1)
Where,
is the WSM score of the ith alternative,
n is the number of decision criteria,
m is the number of alternatives,
aij is the actual value of the ith alternative in terms of the jth criterion, and
wj is the weight of importance of the jth criterion.
2.5.3 Selection of an Appropriate Research Method
It is critical to choose an appropriate and accurate technique for a particular
research application [45, 182]. Levary and Han highlight that the selection of a
future research method depends on factors such as: stage of a technology
development, degree of similarity between the proposed and existing
technologies, number of forecasting variables, extent of the data availability, data
validity, and technological uncertainty [182]. Chambers et al. highlight that
selection of a method also depends on factors like the context of a research,

74
relevance and availability of the historical data, the degree of desirable accuracy,
and the time available for making an analysis [45].
Based on an in-depth analysis of nine case studies, Levary and Han conclude
that the Delphi method and scenario writing approaches are suitable in
circumstances having a very low level of similarity between the proposed
technology and existing technologies, a medium number of variables affecting
the technology development, less data availability, and low or medium degree of
data validity [182]. They further elaborate that in these circumstances, it will be a
reasonable choice to use a method based upon obtaining information from an
expert panel and employ the Delphi method and/or scenario planning approach
[182].
Rowe, Wright and Bolger argue that the Delphi process allows the experts to
make a meaningful judgment, particularly in cases where a variety of factors
(economic, technical, political, social, environmental etc.) affect the problem
under consideration and it gives an opportunity to each expert to derive benefits
from the other experts [276]. It is very useful approach, especially when no
historical data exists for judgment [276]; and it is difficult to bring experts together
due to time or cost constraints [188]. Linstone and Turoff state that sometimes it
is necessary to benefit from the subjective judgments on a collective basis,
because due to the peculiarity of a problem, it is difficult to address it with a
precise analytical technique [188]. Moreover, it is a powerful tool to engage the
stakeholders; and it is an appropriate approach in the situations having many

75
stakeholders [97]. Many other researchers have also indicated that the Delphi
approach generates accurate and reliable judgment than the other techniques
[33, 178, 198, 264].
In the recent years, the scenario planning approach has been used with the
Delphi method as an effective hybrid approach to conduct the foresight studies of
renewable energy technologies. The field of energy planning is associated with
long timescales and high uncertainties [139]. Nowack, Endrikat, and Guenther
assess the integration of the Delphi technique into scenario planning as a
promising option and conclude that it enhances the quality of a scenario study
[226]. There are several examples of Delphi based scenario studies in the
literature [13, 23, 90, 108, 116, 330]. Moreover, there are also various examples
of using these techniques for the long-term planning of sustainable energy
resources [3, 63, 103, 307, 326, 350, 352]. For example, Czaplicka-Kolarz et al.
used the scenario planning approach with the Delphi method to create the
national vision of the energy sector of Poland and formulated the long-term
strategies [63]. Similarly, Rikkonen and Tapio used scenarios with the Delphi
approach to develop future prospects of alternative energy utilization in Finland
[266] and renewable energy scenarios for Saudi Arabia [3].
Analysis of various tools and approaches used in the national level renewable
energy roadmaps during the literature review highlights that the expert panels are
very frequently used to develop the roadmaps [8]. The roadmap workshops are
conducted to develop various tiers of the roadmap. In this research, the expert

76
panels are used to develop the FCM-based scenarios and technology roadmap.
Moreover, the Delphi method is used to prioritize the roadmap barriers. Based on
the findings of the Levary and Han, both the scenario planning and the expert
judgment methods are considered the appropriate due to the following reasons:
Presently the energy sector of Pakistan is mostly dependent on the fossil-
fuels and the contribution of wind energy in the national energy mix is
almost negligible [9]. Wind energy has very low degree of similarity with
the conventional energy technologies;
Wind technology has limited data availability and a high degree of
uncertainty because it is a new technology in the national energy sector;
and
There is a medium number of variables affecting wind technological
deployment in the country [11].
Also due to the following reasons, it is appropriate to use the expert judgment
and Delphi method to support the development of technology roadmaps for this
research:
There are several external factors impacting the deployment of wind
energy technology in the country;
Due to lack of the historical data, problem has to be solved by utilizing
expert judgment;

77
Being a member of a highly structured culture, individuals (experts) may
refrain from freely expressing their opinions;
Time and cost constrains make the group meeting difficult;
Diverse expertise is required to solve the problem and members of the
expert panels belong to various organizations and sectors; and
Bandwagon effect and domination by a single person or small group may
affect the validity of research.
2.5.4 Formation of Expert Panel and Selection of Experts
It is very important to carefully select members of the expert panel because
the quality of the expert judgment is directly based upon their knowledge,
capability, and experience. The expert judgment is used to forecast the future,
utilizing information derived from the individuals who have extraordinary
familiarity with the subject under consideration [212]. An expert is a person who
has the background and knowledge in the subject area and considered qualified
to answer those questions [207]. Usually questions are posed to the experts
when they cannot be answered by any other means. The members of an expert
panel should reflect current knowledge and perception as well as be impartial to
the research findings [149].
The literature also highlights that well known experts should be selected who
are respected among their peers, and the careful selection of the experts
increases credibility to a research project [208]. Camerer and Johnson describe

78
that an expert is considered an experienced person having some professional or
social credentials and knowing a great deal about their domain [40]. McGraw and
Haribson-Briggs state that the domain experience, commitment, patience,
persistence, ability to communicate ideas and concepts, introspection of own
knowledge, honesty, and willingness to prepare for sessions are the important
personal characteristics of the experts [202]. Landeta highlights that selection of
suitable experts helps achieving reliability of the study [177] and Rowe, Wright,
and Bolger enforce this by stating that the degree of panelist expertise is a key
influencing factor on the accuracy of the group judgment [276]. The quality and
validity of the elicitation process is further improved when the experts feel that
they are knowledgeable and well-informed [155].
In the context of scenario planning, van der Heijden states that the experts
are remarkable people who have some knowledge of the related field or industry,
and are acute observers of the environment [333]. The members of a scenario
expert panel are expected to be fairly knowledgeable of the socio-economic
contexts of the region [211]. Schaller highlights the importance of competent
experts to ensure quality of a technology roadmap [289]. More qualitative
approaches require a strong emphasis on the careful selection of suitable
experts [209]. Therefore, the experts should be selected based on their
experience and knowledge in the relevant area as well as their ability to provide a
fair and objective viewpoint.

79
Usually the experts with different backgrounds are brought in the expert
panels. It is critical to ensure diversity in the expert panel so that the problem
under consideration is thoroughly analyzed from many viewpoints [208]. Murphy
et al. argue that diversity in an expert panel leads to better performance because
it helps consideration of different perspectives and a wider range of alternatives
[223]. In support of this argument, Rowe and Wright suggest that diverse
background of the members of an expert panel ensure a wide base of knowledge
[275] and group situations may inhibit creativity and bring possibility of resolving
ambiguous and conflicting issues [276]. The members of a diverse expert panel
bring a wide range of direct knowledge and experience to the decision making
processes [223]. Linstone and Turoff suggest that diversity of viewpoints helps to
generate interest and involvement among the participants of an expert panel
[188]. Diversity of experience of the experts is considered as an important asset
to the success of a scenario exercise [211]. Delbecq et al. cite that the
heterogeneous groups produce the acceptable solutions of higher quality than
the homogeneous groups [72]. In addition to the professional qualifications and
expertise, the expert panel members should be the creative thinkers, who can
bring diverse viewpoints, work well in groups, and freely express their views and
opinions [211].
Diverse backgrounds of the expert panel members also help to assure that
any bias from any member would have little impact on the overall outcome of the
study [101]. Gathering diverse experts in a panel minimizes the influence of a
80
single powerful individual. Ascher state that there is a human tendency to stick
with the status-quo and not to look outside of the comfort zone when considering
the future and utilization of multiple experts with different viewpoint helps to
overcome this human tendency [14]. An empirical study indicates that diversity
among the expert panel members can improve the perceived quality of the
decision [137]. Thus, diversity among the members of an expert panel plays a
vital role and it will lead to better quality of the judgment [14, 208].
It is critical to have the appropriate number of experts in an expert panel.
Mitchell state that the expert panel must have at least 8 to 10 members [218].
Whereas, Meyer and Booker recommend to have around 5 to 9 experts in a
group [208]. Some researchers suggest that more participants are better
because their combined opinion will increase the reliability of the composite
judgment [223]. However, if there are many participants in an expert panel, then
it will be more difficult to coordinate with them and analyze their feedback.
Therefore, it is important to balance the size of the expert panel. Research
indicates that a group of 11 to 15 experts is preferred for achieving a high
correlation [72, 199, 230]. It has been empirically proved that panel reliability
increases with increase in panel size and 11 to 15 is considered an optimum size
of an expert panel [199]. Powell emphasizes that success of a Delphi study
clearly rests on the combined expertise of the members of the expert panel and
highlights the importance of appropriate panel size [255]. The number of experts
also depends on the scope of the problem, objective of the study, and available

81
resources and sometimes a larger group may be useful if the study seeks to
increase the group support or understanding rather than decision making [72,
208].
Issues related to logistics are also important for the selection of experts such
as willingness of an expert to join the panel, willingness to devote their time for
the study, and permission from their employer to participate in the research [208].
It is very important that the expert panel members are willing and able to make a
useful contribution [188, 255]. Thus, there is a tradeoff between finding the
appropriate experts who have the expertise and organizational position; and
finding panelists who have sufficient time to participate in the complete study.
The following criteria have been proposed in the literature for the identification
and selection of the experts and formation of the expert panels [57, 64, 127, 276]
Experience in the subject/field under consideration;
Reputation in the subject/field under consideration;
Interest and willingness to participate in the study;
Availability for the project;
Publications in the field of interest;
Experts should represent a great diversity within the relevant discipline;
Familiarity with uncertainty concepts;
Balanced viewpoint in a group to compensate for individual biases on the
outcome;

82
Absence of evident conflicts among the expert panel members; and
Absence of forceful dominators by position and personality.
Meyer and Booker state that the expert panels are frequently criticized
because sometimes answers of the experts are skewed and it generally happens
if the majority of the experts are selected from one place or one organization
[208]. Therefore, it is important to select a balance group of experts from the
government, universities, research institutes, regulatory agencies, and various
segments of the industry. It will ensure that the members in the expert panel
have diverse backgrounds and they cover all segments of an industry.
2.6 Research Gaps
It has been revealed in the literature review that many researchers have
highlighted the need of combining scenario planning and technology
roadmapping techniques in the future studies [209, 286, 319]. It has been
recommended that this combination will enhance the flexibility and vision of a
roadmap, capture and convey the full context of decisions, and enable
anticipation of a broader range of possible future outcomes [286, 295, 319].
Thus, this combination will significantly improve the usefulness of a technology
roadmap. Despite these benefits, the combination of these two techniques is not
common and it is not used at the national level for long range energy planning.

83
The literature review also highlights that there is a need to evaluate a concise
mix of methods for the future studies [209]. In this research, the technology
roadmap has been developed for the national wind energy sector based on
multiple scenarios. Based on the literature review, it has been revealed that both
scenario planning and technology roadmapping techniques complement each
other and it is an appropriate approach to combine these techniques.
It has been very recently proposed to use FCMs for the development of
scenarios. In this approach, the scenarios are developed based on causal
cognitive maps. Thus, it is an intuitive scenario methods coupled with quantitative
analysis. The literature has identified that there is a weak link between qualitative
and quantitative scenarios, which has been cited as a major obstacle towards the
development of integrated scenarios [170]. Generally, the scenario based on
intuitive logics approach are qualitative in nature [25, 30]. Therefore, the
development of FCM-based scenarios is a unique approach that can combine
the benefits of both qualitative and quantitative analysis. In this research, FCM-
based scenarios have been developed for the first time for the wind energy
sector.
The literature review of 135 public-domain sustainable energy roadmaps [8]
revealed that generally in these roadmaps, scenarios are created based on a few
hypothetical assumptions without much deliberation and logical reasoning. In
contrast to this, the FCM-based scenarios are based on detailed FCMs which are
based on logical reasoning, causal relationship between various variables

84
(scenario drivers), and developed after combining individual causal maps of
several experts.
The research contributions related to the wind energy sector of Pakistan are:
For the first time scenarios and technology roadmaps are developed for the
wind energy sector of Pakistan. In spite of the fact that the national power
policies emphasize the importance of developing the indigenous renewable
energy resources, there has been no roadmap or framework developed for the
implementation of such projects. The existing literature related to the renewable
energy sector of Pakistan is also limited to identifying potential of the indigenous
renewable energy resources and highlighting some generic barriers and
challenges. There has been no scenario analysis, technology roadmap, action
plan, or strategy proposed in the literature. This research also identifies and
highlights the challenges and obstacles towards the deployment of wind energy
technology in the country. It contributes towards addressing the country’s energy
security concerns, achieving the targets of national sustainable development,
provisioning of the economic and social benefits to the people, and improving the
environmental conditions in the country.
The research has also addressed the deployment and integration challenges
associated with the deployment of wind energy projects in a developing country.
Wind energy is a variable and uncertain power resource and its deployment on a
large scale requires significant changes in the power grid operations.

85
The research gaps are identified in the literature review of topics related to
scenario planning, foresight, technology roadmapping, sustainable energy
roadmaps, and literature on the renewable energy sector of Pakistan are
summarized in Table 10:
Table 10: Research Gaps
Topic Research Gaps
Technology Roadmap Roadmaps primarily focus on the desired future without taking alternative developments into account
Scenario Planning In the existing scenario planning approaches, there is a weak link between qualitative approaches and quantitative models
Energy Roadmaps Generally, in the energy roadmaps, scenarios are created based on a few hypothetical assumptions without much deliberation and logical reasoning
Wind Integration Integration challenges associated with the deployment of wind energy on a large scale are not adequately researched for the developing countries having lower grid reliability
Literature on the renewable energy sector of Pakistan
No roadmap, concrete action plan, framework, or strategy exists in the literature for the implementation of renewable energy projects in the country

86
3 Research Approach
3.1 Research Objectives and Goals
The aim of this research is to develop a national level wind energy roadmap
through scenario planning. Multiple scenarios are developed using a fuzzy
cognitive maps (FCM) based approach. This research has extended the
technology roadmapping through FCM-based scenarios. Building scenarios with
FCM is a very new approach, and it combines the benefits of both qualitative and
quantitative analysis. FCM-based scenarios have never been developed for the
wind energy sector, however. Scenario planning facilitates development of a
responsive and robust roadmap and increases flexibility and vision of a roadmap.
In this research, a technology roadmap based on multiple scenarios is
developed. This roadmap has been used to establish the long-term and short-
term targets, investigate the barriers and challenges associated with the
deployment of wind energy technologies, and suggest appropriate action items in
order to promote deployment of wind energy projects in the country. The
research also explores the challenges associated with integration of wind energy,
which is a variable and uncertain power source, to the national grid and proposes
action items to achieve this task. The research objectives are grouped into the
following two categories:

87
i. Method development:
a. Developing multiple plausible scenarios for wind energy deployment
using fuzzy cognitive maps (FCM).
b. Combining the FCM-based scenario planning and technology
roadmapping process.
ii. Application of this new method:
a. Develop a national wind energy roadmap to address the following
strategic objectives of Pakistan [110]:
Energy security;
Economic and social benefits; and
Environmental sustainability.
b. Identify practical insights on the factors supporting and hindering
deployment of wind energy projects in the country.
c. Propose the action items and plans for the deployment of wind energy
technology on a large scale and give recommendations to the
stakeholders in order to better develop and implement wind energy
projects in the country.
Research goals and research questions are summarized in Table 11:

88
Table 11: Research goals and research questions
Research Goals Research Questions Develop a technology roadmap by combining the FCM-based scenario planning and technology roadmapping process
RQ1: How can FCM be used to develop plausible scenarios for wind energy? RQ2: How to combine the FCM-based scenario planning and the technology roadmapping process?
Develop a national wind energy roadmap to address the following strategic objectives of Pakistan:
energy security economic and social benefits environmental sustainability
RQ3: What are the factors supporting and hindering deployment of wind energy projects in the country? RQ4: How can the wind energy integration challenges be managed by a developing country? RQ5: What are the suitable / appropriate action items for implementing wind energy projects in a developing country?
Two major research goals have been established to address the literature
gaps. Figure 8 links the literature gaps to the research goals and research
questions.

89
Figuree 8: Literature gapps, research goals and research qquestions
89
89

3
e
fr
in
k
th
d
o
.2 Rese
For the
xpert pane
rom the pub
nto plausibl
nowledge f
he integrate
eveloped s
verview of
earch Fram
developme
els were fo
blic and pri
le future sc
from the ex
ed FCM is
scenarios, a
the researc
mework
ent of wind
rmulated c
vate sector
cenarios an
xperts as th
s used to f
a roadmap
ch framewo
Figure 9: Ov
d energy sc
consisting o
rs. Their mu
nd roadma
hey express
formulate p
is develop
ork is prese
verview of the
cenarios a
of experts
ultiple and
ps. FCMs
s their men
plausible sc
ped for eac
nted in Figu
research fram
nd technol
with divers
diverse inp
are develo
ntal models
cenarios. B
h scenario.
ure 9:
mework
logy roadm
se backgro
put is integr
oped to cap
. Subseque
Based upon
. The high-
90
maps,
unds
rated
pture
ently,
n the
-level

91
In this research, one FCM and two TRM expert panels were formulated to
develop the scenarios and the technology roadmaps. As stated earlier, the
quality of information obtained from the expert panel significantly depends upon
the knowledge and experience of the participants. Therefore, members of the
expert panels were carefully selected for their in-depth knowledge and
experience of the relevant fields. Based on their backgrounds and experiences,
some experts also served on two or three panels. Members of the expert panels
were selected from the government, private sector, utility companies, industry,
and academia. The role of each expert panel in the proposed research is
described in the next section. Background information of the experts and
composition of the expert panels are also explained in the next section.
3.2.1 Expert Panels
Various guidelines and criteria presented in the literature for the selection of
the experts were considered in the planning to formulate the expert panels.
Identification of the main organizations in relation to the proposed research case
is the first step towards selection of the members of the expert panels [101]. That
was followed by identification of the important personnel working in these
organizations. Review of the literature on the renewable and wind energy sector
of Pakistan was also carried out to identify the individuals who have authored
papers in peer-reviewed journals on the subject area. For this research, the
following government departments, organizations, regulatory bodies, universities,
research institutions, independent power producers, utilities, and private

92
companies were identified, and the experts were selected from these
organizations / companies:
Planning Commission (PC), Government of Pakistan;
Alternate Energy Development Board (AEDB);
Pakistan Council of Renewable Energy Technologies (PCRET);
Ministry of Science and Technology (MOST);
National University of Science and Technology (NUST), Islamabad;
National Transmission and Dispatch Company (NTDC);
University of Engineering and Technology (UET), Taxila;
University of Engineering and Technology (UET), Lahore;
Center for Advance Studies in Engineering (CASE), Islamabad;
Fauji Power Company Limited (FPCL);
Water and Power Development Authority (WAPDA);
Islamabad Electric Supply Corporation (IESCO);
National Electric Power Regulatory Authority (NEPRA);
Oil and Gas Development Company Limited (OGDCL);
Private companies working in the wind energy sector of Pakistan:
o Clean Power Limited (CPL);
o Renewable Resources Limited (RRL);
o RWR Limited; and
o Integrated Sustainable Technologies (IST).

93
TRM Expert Panel 1 (TRM EP1)
The TRM expert panel 1 was used to identify the strategic objectives and
establish the national targets of the wind energy roadmap for the next 20 years.
The TRM EP1 was composed of a group of renewable energy policy makers
responsible for planning and establishing the national renewable energy targets
and initiating wind energy projects in the country. In this expert panel,
government officials (from Planning Division, AEDB, PCRET etc.), CEOs / senior
managers from the private companies working on wind energy, and prominent
research scholars from the local universities were included. The TRM EP1
consisted of 10 experts. Table 12 highlights the background affiliations of the
members of TRM EP1.
Table 12: Background of the TRM EP1
Organization Academic Government Private Utilities AEDB X CASE X FPCL X IESCO X MOST X PC X PCRET X RRL X RWR X UET-L X Total 2 4 2 2 10
TRM Expert Panel 2 (TRM EP2)
The TRM expert panel 2 was used to identify and prioritize the roadmap
barriers and challenges hindering the deployment of wind energy projects on a

94
large scale in the country and to propose various action items required to
overcome the roadmap barriers and challenges. Thus, the TRM EP2 was used to
develop the bottom layers of the technology roadmap. In the TRM EP2,
engineers, scientists, and project managers who are working on wind energy
projects and power distribution companies in Pakistan were included. The
experts in this panel had practical knowledge of the wind technology, supporting
technologies required to implement the wind energy projects, grid operations and
limitations of the national grid, and the peculiar situation of Pakistan related to
wind energy technology.
The TRM EP2 had 15 members; most of them were professionals from the
government sector, private companies, universities, and power distribution
companies. The following Table highlights the background affiliations of the TRM
EP2.
Table 13: Background of the TRM EP2
Organization Academic Government Private Utilities AEDB X AERO X CASE X CPL X FPCL X IESCO X IST X NUST X OGDCL X PC X PCRET X RRL X RWR X UET-T X WAPDA X Total 3 5 4 3 15

95
FCM Expert Panel (FCM EP)
The FCM expert panel was used to identify the scenario drivers (concepts)
that affect the deployment of wind energy on a large scale in Pakistan, in the
form of a causal map. These maps consist of concepts which are interconnected
through the causal links representing the cause and effect relationships between
various concepts. The experts highlighted the strength (weight) of the causal
links between these factors. The FCM EP members also reviewed and critiqued
the integrated FCM, prioritized the concepts, and highlighted the input vectors
(plausible combinations of the most important concepts/trends from the
Integrated FCM) in order to create the scenarios.
The FCM EP included professionals working at the policy and strategic level
as well as technical experts working at the operational level so that they were
aware of the overall picture of all factors affecting the deployment of wind energy
in the country. Therefore, some members from both the TRM EP1 and TRM EP2
were included in the FCM EP. Table 14 highlights the background affiliations of
the FCM EP members.
Table 14: Background of the FCM Expert Panel
Organization Academic Government Private Utilities AEDB X AERO X CASE X CPL X FPCL X IESCO X IST X OGDCL X

96
PC X RRL X RWR X UET-T X Total 2 4 4 2 12
3.2.2 FCM-based Scenario Development
The expert panels were used to develop the FCM-based scenarios for wind
energy. Members of the FCM EP were asked to provide their causal maps and
highlight the factors that may affect deployment of wind energy on a large scale
in Pakistan. Miles and Keenan recommend that the researcher should provide
background material to the participants of a scenario workshop so that they have
similar background information [211]. Therefore, introductory information was
provided to the experts so that they could understand the context of the research
along with instructions to develop causal maps. The agenda and the handout
documents of the FCM scenario workshop are attached as Appendix A to this
dissertation. The handout highlights the purpose of the workshop, focus
questions, detailed instructions for the construction of causal maps, and
examples of FCMs for the experts. The agenda and the handout documents
were provided to the participants four weeks prior to the workshop.
Individual FCMs were obtained from the FCM EP members prior to the
scenario workshop. The experts were asked to look into the social, technological,
economic, environmental, and political aspects while identifying the concepts
which are likely to influence the wind energy sector of Pakistan. Subsequently, all

97
individual maps were combined into an integrated FCM by the researcher. In the
workshop, the purpose of the research, the basic principles of scenario planning,
and FCM-based scenarios were also explained to the members of the expert
panel. During the workshop, the participants reviewed and critiqued the
integrated FCM and highlighted the input vectors for creating FCM-based
scenarios.
For the development of the FCM, the following steps recommended in the
literature were followed [152, 201, 334]:
1. Identify and define the important factors:
a. Write down issues on Post-its; and
b. Cluster these issues as a map and discuss their importance.
2. Define the causal link between these factors:
a. Identify factors which are linked together;
b. Determine that the relationships is positive or negative; and
c. Define relative strength of the relationships by assigning causal
weights using a 5-point Likert-type scale, with values that range
from 1, representing a very weak causal link, to 5, representing a
very strong causal link.
3. Review and discuss the combined / integrated FCM:
a. The moderator individually obtains the FCMs from every expert
prior to the workshop and combines those into an integrated FCM.
4. Identification of the most uncertain factors in the integrated FCM:

98
a. Paste red dots on the most uncertain factors (5 red dots are
provided to every expert).
5. Identify plausible input vectors consisting of the most important factors
from the integrated FCM:
a. The moderator will provide a tabular worksheet highlighting the
critical scenario drivers at the top of the each column and indicating
the number of conceivable development variations of each scenario
driver; and
b. Combine the development variations into plausible strands (input
vectors) using markers of different colors.
Combining of Multiple FCMs
Multiple FCMs can be combined together to produce a joint effect and capture
the opinions of multiple experts together in one map for further analysis [163].
The combined FCM is considered more useful than an individual FCM because
the information is obtained from a multiplicity of sources [324]. After combining
the FCMs, the experts are asked again to review the integrated FCM and
highlight the most uncertain factors/concepts.
An example of combing multiple FCMs is shown in Figure 10, developed for a
pilot study project [11]. The central objective of this integrated FCM is to
investigate the factors that will cause the large scale deployment of wind energy
in a developing country. This integrated FCM is created after obtaining individual

99
FCMs from seven experts and taking the average of the causal weights. The
concepts highlighted by a continuous boundary line are identified by all of the
experts (from concept 1 to concept 14 and concept 16), whereas the remaining
concepts highlighted by a dotted line are identified by two experts.
Taber and Siegel proposed a method for combining multiple FCMs. This
method computes the expert credibility weights based on the Hamming distance
between the inferences vectors obtained from the FCMs of various experts [324,
325]. The integrated FCM shown in Figure 10 is composed of 20 concepts,
where 15 concepts are identified by all of the experts and two experts identified
five additional concepts highlighted by a dotted line. It was found that the
credibility weight of the two experts who identified additional concepts is reduced
because they differed from the majority. The credibility weight of the five experts,
who proposed the same concepts, is 0.90. Whereas, the credibility weight of the
two experts who identified additional important concepts in their FCMs is 0.75.
Thus, this method estimates a lesser expert credibility weight for those experts
who differ and disagree from the majority. For scenario planning, it is critical to
collect diverse input from multiple experts and identify the weak signals that have
the potential to play a vital role in the future. Therefore, this approach is not a
suitable approach for combining FCMs for scenario planning.
In the other method, multiple FCMs are combined by taking the average of
the causal weights. This is another commonly employed technique and it has
been used to combine multiple FCMs developed for building scenarios [7, 11,

100
152]. Both approaches presented in the literature for combining multiple FCMs
are explained in Appendix B.
Figure 10: Integrated causal map/FCM for deployment of wind energy
After forming the integrated FCM, the experts were asked to identify the most
uncertain and important scenario drivers (concepts), because it is important to
identify and prioritize the most critical and uncertain scenario drivers [298]. After

101
ranking the scenario drivers, the morphological analysis was used to develop the
input vectors.
FCM Simulation
The input vectors are used for conducting the simulation and generating the
FCM-based scenarios. Although, a few important scenario drivers are used to
form the input vectors; but in the FCM simulation all of the scenario drivers
(concepts) in the FCM model are considered for generating scenarios. It happens
because when a concept changes its state, it affects all concepts that are
causally dependent on it, and this process depends on the direction and strength
of the causal link [152]. The newly activated concepts may further influence other
concepts which they causally affect and this activation spreads in a non-linear
fashion in the FCM model until the system attains a stable state [152]. Due to the
meta-rules, it is also possible that in some cases several input vectors may lead
to the same final system state [156]. The FCM simulations can be used to
experiment with different input vectors and compare their outcome [156].
Therefore, it helps to deal with a complex situation and holistically evaluate all
concepts of interest. Moreover, despite using the input vectors consisting of the
critical scenario drivers, all drivers/concepts and their causal links in the FCM
model are considered during the development of FCM-based scenarios.
The FCM simulation is performed until the output vector is stabilized. It is
performed by multiplying the input vector with the FCM adjacency matrix. A

102
squashing function is applied after every multiplication as a threshold function to
the output vector. A simple binary squashing function is used which squeezes the
result of multiplication in the interval of (0, 1). For n number of concepts, the input
vector is 1 by n, the FCM adjacency matrix is n by n, and the output vector is 1
by n [324]. The new output vector is again multiplied with the FCM adjacency
matrix and this process is repeated until the multiplication results in equilibrium
[152, 296, 324]. As a result, the system is settled down and stabilized, and then
new matrix multiplications will result in the same output state vector. Implications
of the FCM model are analyzed by clamping different concepts and the vector
and adjacency matrix multiplication procedure, to assess the effects of these
perturbations on the state of a model [2]. Thus, the FCM simulation process
provides a holistic overview and investigates the internal dynamics of the model.
FCM Validation
The literature recommends that every step should be validated through the
experts as an ongoing activity [156, 317]. Participation of the experts help to
address the validity and acceptability aspects of the model [133]. It is important to
accurately translate experts’ feedback in the FCM model [156] and weak
facilitation may lead to poor quality of the model [109]. Therefore, it is critical to
strictly follow the FCM modeling guidelines through a high quality process [155,
156]. The steps taken to ensure validity of the FCM model developed for this
dissertation are explained in Section 5.1.6.

103
3.2.3 Technology Roadmap Development
A technology roadmap is a high-level planning tool used to support the
development and the implementation of strategy and plans [239]. In this
research, the roadmap is developed using multiple scenarios as an input to the
technology roadmapping process. Workshops and follow-up surveys are
conducted to obtain the expert judgment for the roadmap development. The
strategic objectives of the country are defined and the national targets for the
wind energy sector are established. The challenges and barriers associated with
the deployment of wind energy in the country are identified, explored, and
prioritized keeping in mind the constraints and limitations of the country. The
roadmap action items are proposed and gaps / needs are identified in order to
achieve the roadmap targets. As a result, the TRM approach identifies future
directions of the national wind energy sector, help to plan the energy future in a
very systematic way, and provide guidelines for the exploitation of wind energy in
the country.
The roadmap is developed using a top down approach. In the proposed
research, input from the experts is obtained through workshops and follow-up
Delphi surveys. The workshops help to bring the experts together in order to
share and brainstorm their ideas for the future and subsequently develop the
roadmap [238, 242, 243, 246, 357, 358]. The workshops are the most commonly
used technique for the development of a technology roadmap [8]. Separate
workshops are conducted to develop various tiers of the roadmap.

104
The Delphi method has also been used in many roadmapping applications
and it is considered a promising technique for the development of a technology
roadmap [32, 98]. This approach reduces the impact of the powerful members in
a group and avoids the imposition of their points of view on other group members
[188]. Online (computer-based) Delphi method increases the efficiency of the
process, shortens the time to perform a survey, accommodates the expert
availability, and reduces drop-out-rates; and this approach has been used in
multiple applications [42, 98, 105, 114]. Chi-squared test is used to determine the
stability of results of an expert panel [43]. The Delphi method is used to prioritize
the barriers and challenges of this roadmap against each scenario.
The national level wind energy roadmap is developed for multiple scenarios.
The experts identified the most critical barriers and challenges against each
scenario. This approach has significantly improved the usefulness, flexibility, and
vision of the roadmap, and enabled anticipation of a wide range of possible future
outcomes. The roadmap objectives and targets are shown in the upper layers.
Whereas, the roadmap barriers and detailed action items proposed to overcome
these barriers against each scenario are portrayed in the lower layers.
In this research, two expert panels were formulated to develop the
technology roadmap. A top-down approach was used and the following steps
were taken for the development of this roadmap:
105
Step 1: Strategic Objectives of the Roadmap: TRM Expert Panel 1
Identify the strategic objectives of the roadmap in accordance with the
national renewable energy policy. The experts are asked to discuss,
deliberate, and brainstorm the strategic objectives.
Step 2: Targets of the Roadmap: TRM Expert Panel 1
Establish the national targets of the wind energy roadmap for the next 20
years. Again, the national renewable energy policy of Pakistan is used as
a baseline document for establishing the roadmap targets. The agenda
and handout documents for the roadmap objectives and targets workshop
are attached as Appendix C. These documents highlight the purpose of
the workshop and the focus questions.
Step 3: Roadmap Barriers: FCM Model / TRM Expert Panel 2
Identify and explore the important barriers and challenges towards the
deployment of the wind energy projects against each scenario. Then
prioritize the most important barriers on the basis of their impact on the
roadmap targets. The important barriers and challenges have been
identified through the literature review and integrated FCM model. In the
roadmap barrier workshop, the experts are asked to add additional
barriers and challenges if they think that some important barriers are not
included in the handout. In the second phase, the experts rank these

106
barriers and challenges on the basis of their importance and impact on the
roadmap targets. Weighted sum method (WSM), which is a commonly
used technique for ranking, is used to prioritize the roadmap barriers. The
agenda and handout documents for the roadmap barrier workshop are
attached as Appendix D. These documents describe the purpose of the
workshop, focus questions, barrier prioritization criteria, list of potential
roadmap barriers, and detailed instructions for this step. After the roadmap
barriers workshop, a follow-up Delphi survey is conducted and the experts
are asked again to prioritize the roadmap barriers for each scenario. The
follow-up survey is attached as Appendix E.
Step 4: Roadmap Action Items: TRM Expert Panel 2
Identify, discuss, and propose various action items in the wind energy
roadmap to overcome the roadmap barriers and achieve the roadmap
targets. Thus, the experts translate the roadmap objectives and the
targets into the action items. The experts propose the appropriate action
items to overcome the roadmap barriers against each scenario. The
experts also highlight the action items which have already been taken by
the major stakeholders (government, power regulator, wind industry, and
utilities) and state if there is a need to modify these action items already
undertaken by the major stakeholders to address the barriers. Moreover,
the new action items (i.e. gaps/needs) that are required to overcome the
roadmap barriers are also proposed. At present, these new action items

ro
are n
assig
time
agend
attach
works
action
This
oadmap is h
not underta
n the resp
frame whe
da and han
hed as App
shop, impo
n items in th
four step
highlighted
aken by an
ponsibility fo
n these ac
ndout docum
pendix F. T
ortant tasks
his researc
process fo
in Figure 1
Figure 11:
ny major st
or each ac
ction items
ments of th
These docu
s, instructio
h step.
or develop
11.
: TRM proces
takeholder.
ction item a
are require
he roadmap
uments de
ns, and ex
ping the na
ss for the road
. At the en
and specify
ed to be u
p action item
scribe the
xamples for
ational leve
dmap
nd, the exp
y the estim
ndertaken.
m workshop
purpose o
r identifying
el wind en
107
perts
mated
The
p are
of the
g the
nergy

108
3.2.4 Consistency of Expert Judgments
Consistency is the degree to which an individual is consistent in his/her own
judgment. Inconsistency describes a situation where the expert judgment
changes over time. The consistency of responses between the successive
rounds of a Delphi study is also referred as stability [43, 67]. Kastein et al. state
that the consistency of responses of the expert panel members over the
successive Delphi rounds reflects high reliability [164]. Dajani, Sincoff, and Talley
recommend to conduct chi-square ( ) test to measure whether the stability of
group response has been achieved or not. The responses of two successive
rounds obtained from a group of experts are required to conduct this test.
Chaffin and Talley argue that it is more important to establish individual
consistency than determining the consistency of a group [43]. They extended the
work done by Dajani et al. and empirically demonstrated that the individual
stability does imply the group stability, whereas the group stability does not
necessarily imply the individual stability [43]. Thus, the individual stability test
provides more information and it is used for measuring the consistency of
responses between the successive Delphi rounds.
An example is used to illustrate the stability test in two consecutive Delphi
rounds. Table 15 highlights the responses by 122 panelists for three response
intervals (A, B, and C) in rounds two and three of a given Delphi study. The
expected frequencies are computed based upon the assumption that the null

109
hypothesis of independence is true [42]. The responses of the panelists for round
i and round i+1 are shown in Table 15. The equation number 2 is used [43]:
2
Where Ojk and Ejk are the observed and expected frequency indicating the
number of respondents who voted for the j th response interval in the i th round,
but voted for the k th response interval in round i+1.
m and n are number of non-zero response intervals in the round i and round
i+1
In order to test individual stability in a Delphi study, we need to determine
whether there is a significant difference between the individual responses in two
consecutive rounds using the chi-square test. The following hypotheses are
tested:
H0: Individual responses of rounds i and i+ 1 are independent.
H1: Individual responses of rounds i and i+ 1 are not independent.
If the individual responses in the consecutive rounds are dependent, it means
that the same respondents who voted for a given response interval in the round i,
have also voted for the same response interval in the round i+1. Thus, by
rejecting the null hypothesis (H0) and accepting the alternative hypothesis (H1), it

110
can be concluded that there is individual stability between the consecutive
rounds. Rejection of the null hypothesis means that the individual stability has
been achieved. For the example shown in Table 15, there are 4 degrees of
freedom and it is calculated from the equation number 3:
Degrees of freedom = (m–1)(n–1) (3) = (3–1)(3–1) = 4
Table 15: Observed and expected individual frequencies
Observed Frequencies Response
Interval Second round Total
A B C
Thi
rd
roun
d A 26 7 0 33
B 0 62 0 62
C 0 2 25 27
Total 26 71 25 122
Expected Frequencies
Response Interval
Second round
A B C
Thi
rd
roun
d
A 7.0 19.2 6.8
B 13.2 36.1 12.7
C 5.8 15.7 5.5
The chi-square value is calculated through the equation number 2 and using
the observed and expected frequencies shown in Table 15. The calculated value
of is 197.5. At a 0.05 level of significance and four (4) degrees of freedom, the
critical chi-square value is 9.488. Since the calculated chi-square statistic is
greater than this critical value, we reject the null hypothesis and conclude that the
individual stability has been demonstrated.

111
The chi-square test is used to measure the stability of group responses in a
follow-up Delphi survey conducted to prioritize the roadmap barriers for each
scenario.
3.2.5 Disagreement among Experts
Disagreement is the extent to which the participants of an expert panel are in
difference to each other in their judgments. There is a misperception and some
people assume that the experts will always reach the same conclusion and if the
experts conclude differently, they consider that the judgment is questionable
[207]. However, this concept is misleading due to two reasons [207]. Due to
different educational background and professional experience, each expert
differs in expertise and knowledge. Even if all the experts have same expertise
and knowledge, they may think in different ways to approach the same problem
and come up with different judgment. Second reason is that usually the expert
judgment is obtained in an uncertain situation, where no clear standards or well
developed theories exist. Therefore, the expert judgment may lead to some
disagreement among the experts.
The experts may disagree because they think differently about a complex and
uncertain problem [221]. Difference among the expert brings different
perspectives and research indicates that it brings better chance of covering the
right solution [207]. Torrance argues that the more effective groups are
characterized by greater participation and wider divergence of the expressed
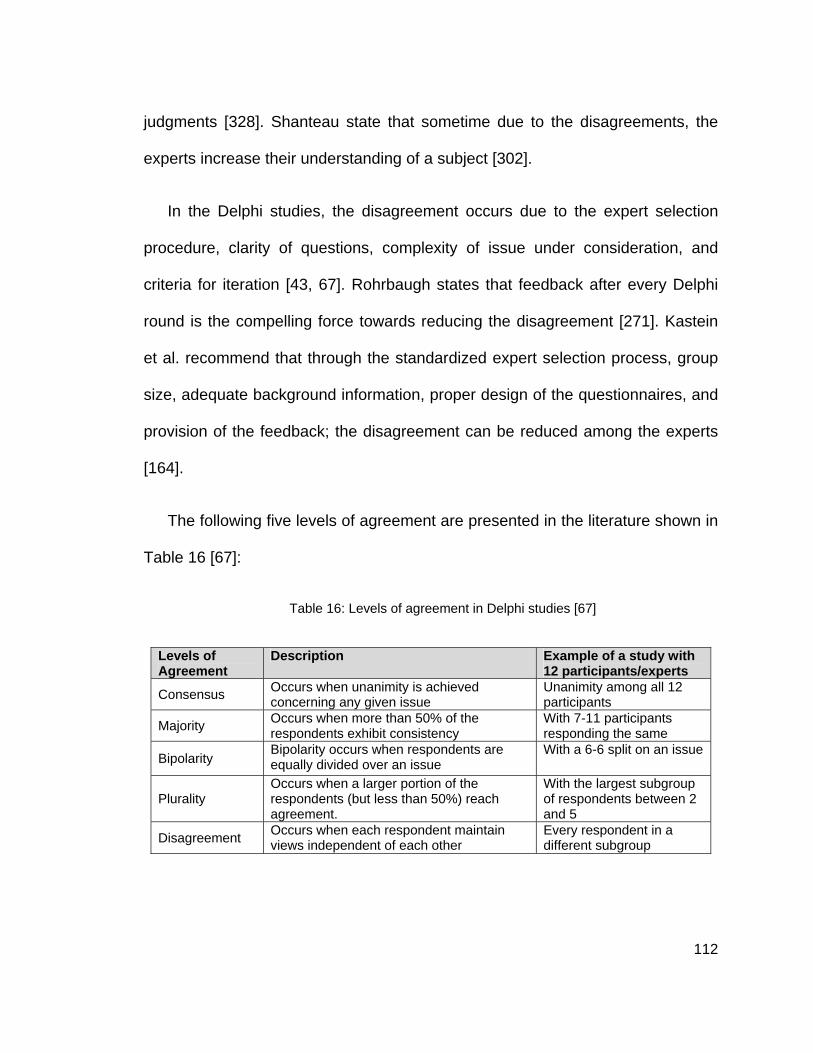
112
judgments [328]. Shanteau state that sometime due to the disagreements, the
experts increase their understanding of a subject [302].
In the Delphi studies, the disagreement occurs due to the expert selection
procedure, clarity of questions, complexity of issue under consideration, and
criteria for iteration [43, 67]. Rohrbaugh states that feedback after every Delphi
round is the compelling force towards reducing the disagreement [271]. Kastein
et al. recommend that through the standardized expert selection process, group
size, adequate background information, proper design of the questionnaires, and
provision of the feedback; the disagreement can be reduced among the experts
[164].
The following five levels of agreement are presented in the literature shown in
Table 16 [67]:
Table 16: Levels of agreement in Delphi studies [67]
Levels of Agreement
Description Example of a study with 12 participants/experts
Consensus Occurs when unanimity is achieved concerning any given issue
Unanimity among all 12 participants
Majority Occurs when more than 50% of the respondents exhibit consistency
With 7-11 participants responding the same
Bipolarity Bipolarity occurs when respondents are equally divided over an issue
With a 6-6 split on an issue
Plurality Occurs when a larger portion of the respondents (but less than 50%) reach agreement.
With the largest subgroup of respondents between 2 and 5
Disagreement Occurs when each respondent maintain views independent of each other
Every respondent in a different subgroup

113
It has been recommended to terminate the study when the consensus or
majority is achieved with stability [67]. For the bipolarity, it is recommended to
determine the nature of the stability among the two bipolar groups and terminate
or rewrite the particular question. When the plurality occurs with the stability, it is
recommended to terminate the study or administer a new round of questions if
stability is not established. When the disagreement occurs and stability is
achieved for a given question, the decision must be made whether to terminate
or rephrase the question statement [67].
It has been observed that greater concern is given towards the disagreement
among an expert panel in studies related to the healthcare, medical diagnostics,
and risk and safety assessments. In some studies related to the healthcare
sector, Cronbach's alpha ( ) [118], Variation Factor ( ) [326], and intraclass
correlation coefficient (ICC) [164] are used to determine degree of agreement
among the members of an expert panel.
On the other hand, in the fields of scenario development and technology
roadmapping, it is encouraged to have diverse input from the experts. The
literature highlights the importance of identifying the weak signals and future
surprises. In this case, the objective of the work is to explore a variety of potential
futures in order to allow the stakeholders to prepare for the surprises and
contribute to shape the desired outcome. However, the following steps are taken
to increase reliability of this research:

114
Ensure that instructions are clear in all the workshop handouts and
questionnaires;
Delete or replace any unclear and ambiguous instructions or questions;
and
Careful selection of the members of expert panel.
3.3 Research Assumptions
The following assumptions are made for this research:
It is assumed that the expert panel members are to be knowledgeable in
the assigned areas. They have the ability to articulate and prioritize their
judgment consistently. In order to cope with this assumption, the
researcher has carefully selected the members in all three expert panels
based on their professional qualifications, designations, and
responsibilities in their organizations. All the experts are capable and
possess the relevant experience to understand the wind energy sector of
Pakistan.
It is assumed that the information and judgment obtained from each expert
have little or no bias.
Biases of the experts are balanced in each expert panel. Efforts are made
to minimize the biases by balancing the participants in every expert panel
through their different backgrounds, experiences, positions, and

115
affiliations. For example in order to minimize impact of these individual
biases; the TRM EP 2 consists of the government officials, researchers
from research centers and academia, and representatives from the private
companies.
It is pertinent to mention that the dominant scenario drivers, barriers, and
other environmental forces as well as each expert’s preference and
perception may change over time. This research is highly dependent on
the subjective judgment of the human experts. Therefore, the result from
this research represents the experts’ preferences and perceptions at a
certain point in time. However, the research approach can be applied
again in different conditions to modify and update the research outcome.
It is assumed that the concepts identified by the experts in the integrated
FCM model, represent all the important factors that may affect the
deployment of wind energy on a large scale in Pakistan. Moreover, it is
also assumed that only the concepts interconnected through the causal
links in the FCM model may affect the other concepts.

116
4 Background for Specific Case
Some background information for the specific research case is presented in
this section. Seven major areas in relation to the case study are reviewed
including: overview of Pakistan, overview of the national energy sector, energy
crisis in the country, importance of wind energy, institutional support from the
government, wind energy sector of Pakistan, and wind energy deployment and
integration challenges.
4.1 Overview of Pakistan
Pakistan emerged as a new country on 14 August 1947, after the division of
former British India. It is located in South Asia, bordering the Arabian Sea on the
south, India on the east, Iran and Afghanistan on the west and China in the north.
It is a densely populated country and covers 796,095 sq.km with a population of
132.35 million according to the last population census [113]. The country has a
literacy rate of 53% [113]. Urdu is the national language with several regional
languages. The country has coastline of approx. 1100 km long.
The national economy is based on agricultural; wheat, cotton, rice, and sugar
cane are the major crops. The country also has an expanding industry. Cotton,
textiles, sugar, cement, and chemicals play important roles in the national
economy. The textiles sector accounts for most of Pakistan's export earnings
[52]. Over the 2004-07 period, GDP growth in the 5-8% range was spurred by

117
gains in the industrial and service sectors, and between the 2001-07 period,
poverty levels decreased by 10% as the government steadily increased the
development budget [52]. However, the economic growth slowed down during
the 2008-09 period due to several reasons including the global financial crisis
and severe electricity shortfalls [52]. The record floods in July-August 2010
lowered the agricultural output, contributed to a jump in inflation, and inflicted a
massive damage of $10 billion on the country’s economic structure [113]. The
national economy is still recovering from the flood damage.
4.2 Overview of National Energy Sector
In this modern era, energy is a key element required for sustainable
development and prosperity of a society. Pakistan is a developing country
requiring sustainable sources of energy to foster a sustained economic growth
and social development in the society [351]. The total primary energy supply
(TPES) of Pakistan was 62.6 million tons of oil equivalent (MTOE) during the
financial year 2008-09 [112]. Energy resources like natural gas, oil, hydro &
nuclear, coal, and liquefied petroleum gas (LPG) contribute to 48.3%, 32.1%,
11.3%, 7.6%, and 0.6% of the primary energy supplies respectively [112]. The
share of the primary energy supplies by various sources is shown in Figure 12.
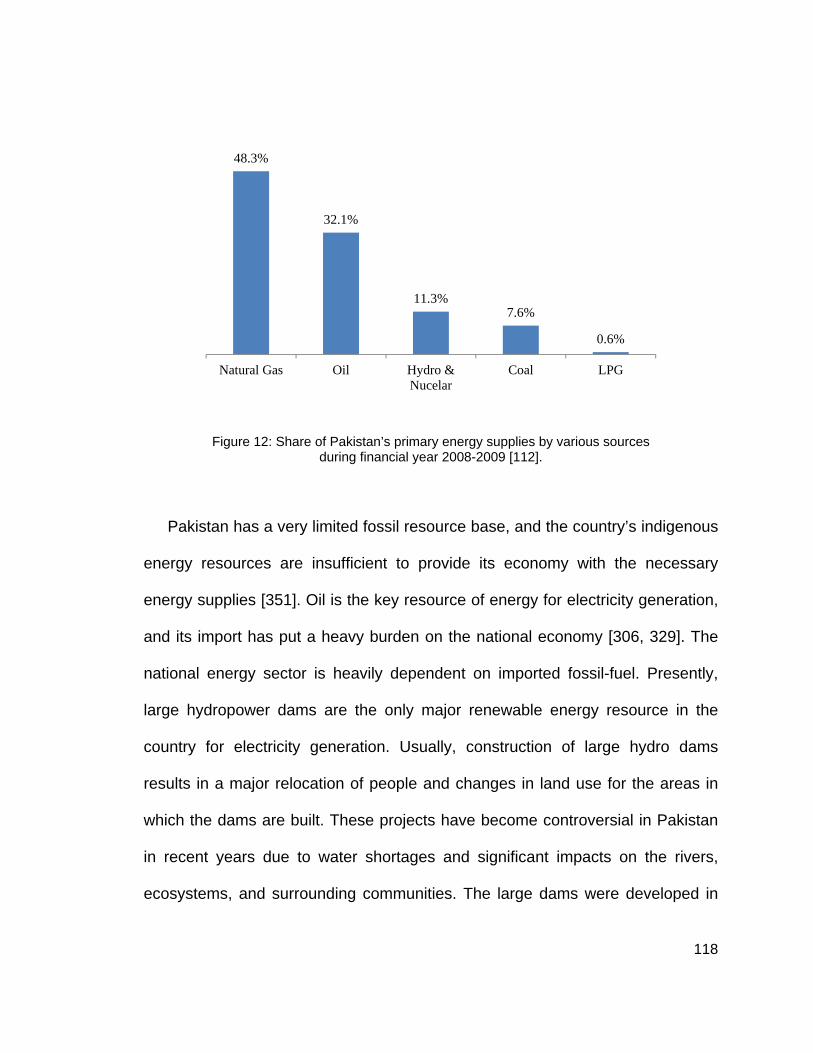
118
Figure 12: Share of Pakistan’s primary energy supplies by various sources during financial year 2008-2009 [112].
Pakistan has a very limited fossil resource base, and the country’s indigenous
energy resources are insufficient to provide its economy with the necessary
energy supplies [351]. Oil is the key resource of energy for electricity generation,
and its import has put a heavy burden on the national economy [306, 329]. The
national energy sector is heavily dependent on imported fossil-fuel. Presently,
large hydropower dams are the only major renewable energy resource in the
country for electricity generation. Usually, construction of large hydro dams
results in a major relocation of people and changes in land use for the areas in
which the dams are built. These projects have become controversial in Pakistan
in recent years due to water shortages and significant impacts on the rivers,
ecosystems, and surrounding communities. The large dams were developed in
48.3%
32.1%
11.3%7.6%
0.6%
Natural Gas Oil Hydro &Nucelar
Coal LPG

119
the 1970s, but the pace of new hydropower generation facilities has significantly
slowed down over the last three decades due to the above-mentioned reasons
[15]. The share of emerging renewable energy resources such as the use of
wind energy for electricity generation is negligible in the country. It is shown in
Figure 13 that the share of electricity generated from wind energy is around
0.2%, with the installed capacity of only 40 MW by the end of 2011 [1].
Figure 13: Share of Pakistan’s electricity from various sources [1].
The residential sector consumes almost 50% of electricity produced in the
country, followed by the industrial sector (26.7%), agriculture sector (13.0%), and
the commercial sector (7.5%) [329]. Given the current growth trends, it is
expected that the demand of the domestic sector will further increase in the near
64.1%
33.3%
2.4%0.2%
Thermal (fossil-fuels)
Large Hydro PowerDams
Nuclear Wind Energy

120
future. There has been an increase in electricity consumers due to rapid
urbanization and extension of the national grid to include rural areas.
The power sector of Pakistan is dominated by two vertically integrated giants:
Water and Power Development Authority (WAPDA) and Karachi Electric Supply
Corporation (KESC). These two entities control the national electricity
transmission and distribution network and generate almost 70% of the country’s
power. Independent Power Producers (IPPs) produce 30% of the country’s
electricity. In order to introduce a competitive environment and attract the private
sector participation, in the year 2000 WAPDA was restructured and unbundled
into the following 12 separate units [329, 351]:
Eight Distribution Companies (DISCOS);
Three Thermal Generation Companies (GENCO); and
National Transmission and Dispatch Company (NTDC).
4.3 Energy Crisis in the Country
Pakistan is an energy deficient country facing problems due to a shortage of
energy, especially electricity. The country’s electric sector is in a crisis because
electricity demand continues to exceed supply, and it results in extended periods
of blackouts (“load shedding”). It is widely recognized as a severe obstacle to
growth and poverty reduction in the country [329]. The electricity deficit of the
country was over 4000 MW in the year 2008, and it is estimated to reach over

121
8000 MW by the end 2011 [15]. Therefore, rotating blackouts throughout the
country are also necessary to overcome this shortage. The load-shedding has
caused significant damage to the national economy and the closure of industry;
resulting in loss of production and jobs.
An increase in the electricity demand is directly linked to the growth of the
country’s economy. Research indicates that every one percent of GDP growth in
Pakistan requires an increase in electricity supply of 1.25%. Keeping in view the
sustained growth in all sectors of the economy in the coming years, it is expected
that the future demand for electricity will be more than 20,000 MW in the near
future. Thus, an increase in electricity supply is required to sustain the economic
growth [351]. This problem of electricity shortage will be further aggravated in the
future because the national energy demand is also increasing at an average
annual rate of 5.67% [112].
The electricity crisis has forced the government to make decisions like early
market shutdown, power cutoff to the industry, and two holidays per week for all
businesses. These measures are negatively affecting all economic and business
activities in the country. The extended periods of blackouts almost suspend the
social life of people. There were also some riots over the power shortages in
Pakistan. The per capita electricity consumption for Pakistan is 475 kWh, which
is almost six times less than the average electricity consumption in the world
[140]. Access to electricity is essential to provide modern health services,
improve agricultural productivity, obtain the full benefits of improved educational

122
systems, and build an economic base that can participate in today’s globalized
economy [351]. The shortage of electricity and frequent blackouts constrain
economic development and disrupt health, education and other services.
Moreover, unreliable electricity service also undermines the cold chain vital to the
distribution of medicines and perishable foods, and negatively affects public
health.
Due to the shortage of electricity in Pakistan, the industrial sector has been
badly affected and overall exports of the country have been reduced. Unreliable
power supplies and frequent blackouts have encouraged the industries and
businesses to install their own power supplies such as diesel generators.
However, high operating costs of these generators raises the cost of local
products and erodes their competitiveness within the region [351]. The shortage
of conventional energy resources in Pakistan, when coupled with hiking energy
prices worldwide, highlights a need to explore wind power in order to overcome
the energy crisis in the country. Therefore, it is crucial for the country to formulate
a diverse energy strategy and increase the share of sustainable energy
resources by exploiting renewable energy technologies.
4.4 Importance of Wind Energy
Renewable energy technologies (RETs) are the fastest growing energy
resources in the world and various projections indicate that these resources will
have a huge contribution in the future [81, 150]. Pakistan mainly depends upon

123
the conventional energy resources and there is not much effort for the
exploitation of RETs for electricity generation. Due to over dependence on
imported fossil-fuel, more than 60% of the foreign exchange is spent for the
import of energy [306]. Oil import is a significant burden on the national
exchequer and foreign reserves.
The government is trying to increase the indigenous energy supplies and
renewable energy sector has been identified as an important target area.
Renewable resources have enormous potential and can meet many times the
current national energy demand. These resources can enhance diversity in the
national energy mix, secure long-term sustainable energy supplies, reduce
atmospheric emissions, create new employment opportunities, and offer
possibilities for growth of the domestic manufacturing industry [222].
Among all RETs, wind is the most mature, rapidly deployable, clean, and
affordable energy resource. In the decade leading up to 2009, there has been an
average annual growth rate of 30% for the installed wind energy capacity in the
world [46]. According to the World Wind Energy Association (WWEA), the global
market for wind energy is gaining momentum and 40.5 GW of new wind capacity
was installed in the year 2011 in more than 50 countries [361]. It indicates that
wind energy is a rapidly growing, mature, and proven technology. Electricity is
being generated from wind energy at a cost around 8 US cent/kWh in some
Asian countries [225]. International Energy Agency (IEA) estimates that the
investment cost of wind power is expected to further reduce in future as a result

124
of technology development and economies of scale by 23% for onshore and 38%
for offshore projects [46]. Therefore, wind energy is a technically feasible
alternative of renewable energy available for Pakistan at a competitive cost. The
country’s 1100 km long coastline is ideal for the installation of wind farms to
generate electric power. The growth of wind energy in the neighboring countries
like China and India has been remarkable during the last decade. Pakistan is
sharing the same coastal line of the Indian Ocean with India. Concerns about the
security of energy supplies have led many countries in this region to diversify
their energy mix through their indigenous wind resources.
It has been estimated by the U.S. Energy Information Administration (EIA)
that the cost of electricity generation from the onshore wind projects will be
competitive with conventional power plants based on coal and natural gas by the
year 2016 [80]. Table 17 presents a comparison of the average levelized system
cost of onshore wind power projects against the coal and natural gas based
power plants.
Table 17: Comparison of the average levelized system cost in 2016 [80]
Power Plant Type Average System Levelized Cost
($/MWh) Wind Farms (Onshore) 97.0
Coa
l
Conventional Coal 94.8Advanced Coal 109.4Advanced Coal with Carbon Capture and Storage
136.2
Nat
ural
G
as Conventional Combined Cycle 66.1
Advanced Combined Cycle with Carbon Capture and Storage
89.3
Conventional Combustion Turbine 124.5

125
Import of natural gas could be seen as a viable resource to overcome the
depleting domestic reserves. However, the natural gas import has significant
issues such as need of substantial capital investment in the infrastructure,
security issues in the region, and physical terrain concerns. Moreover, it will
further increase dependence on imported energy and there is also price
uncertainty over the future supply. Thus, wind energy has the potential of
becoming a strong contributor in the national electricity mix.
A recent economic survey by the government indicates that more than 40,000
villages in the country do not have access to electricity [111]. Wind energy can
be utilized to provide electricity to those villages. The deployment of wind energy
projects can electrify these villages, improve living standards of the communities
in those areas, and contribute to the national economic growth [214].
Utilization of wind energy can significantly help the country to overcome the
energy shortage crisis, improve living standards of the society, diversify the
national energy mix, contribute to the national economic growth, improve rural
economy, reduce the energy import bill, and ensure environment sustainability.
Therefore, it is critical to develop a national level wind energy roadmap in order
to identify the objectives, targets, barriers, and action items of the roadmap to
exploit the enormous potential of wind energy resources available in the country.

126
4.5 Institutional Support from the Government
In order to provide an effective institutional support for the development and
deployment of renewable energy projects, the government has established two
main departments: Alternate Energy Development Board (AEDB) and Pakistan
Council of Renewable Energy Technologies (PCRET). The AEDB provides the
institutional support, develops policies, and facilitates deployment of renewable
energy projects in the country. The PCRET conducts the R&D activities,
develops pilot projects for demonstration purposes, and train human resources
so that they can operate and maintain the RETs based projects. Moreover,
National Electric Power Regulatory Authority (NERPA) is the national electricity
regulatory agency and National Transmission and Dispatch Company (NTDC)
operates the national grid. The responsibilities of these departments are
mentioned below:
The AEDB was established in the year 2003, to act as the central national
body on the renewable energy sector and it is responsible to implement the
renewable energy policies, programs, and projects in the country [1]. It is also
responsible for developing the national renewable energy policy and establishing
the policy goals. The country’s first RE policy was announced in the year 2006.
This policy established the mid-term and long-term targets including generation
of 1,700 MW of electricity from renewable energy resources by the year 2015,
and generation of 9,700 MW of electricity from renewable energy resources by
the year 2030 [1, 110]. The AEDB also acts as a one-window facility for
127
processing renewable power generation projects in order to ensure their smooth
execution and implementation by the private sector and foreign investors. In
order to facilitate renewable energy projects, the AEDB has drafted the standard
power purchase agreement and other project implementation documents.
The PCRET was established in the year 2001 and it has been assigned to
conduct research and development activities in the field of renewable energy
technologies to promote these technologies in Pakistan [235]. It also coordinates
the overall R&D activities related to the RETs in the country. It has initiated some
pilot projects and deployed wind turbines, photovoltaic cells, solar water heaters,
solar cookers, solar dryers, solar desalination systems, and biomass plants on a
small scale to demonstrate their performance in the local environment [306]. It
also provides training for operations and maintenance of the RETs.
The NERPA was established in the year 1998, in order to ensure fair
competition and consumer protection. Its primary responsibilities include the
issue of licenses for power production, transmission and distribution,
specification of electricity tariffs, and consumer pricing [329, 351]. In addition, the
NERPA is responsible for approving the tariffs negotiated in connection with the
bilateral agreements between the power producers, distribution companies, and
major customers [351]. It also defines the licensing requirements.
The NTDC was established in the year 1998 to take over all of the national
grid stations, transmission lines, and network. It operates and maintains the

128
220kV and 500kV grid stations, and transmission lines. The NTDC is also
entrusted to acts as:
Central Power Purchasing Agency;
System Operator;
Transmission Network Operator; and
Contract Registrar and Power Exchange Administrator.
4.6 Wind Energy in Pakistan
Wind power has been used from the ancient times for grinding grains, sailing
ships, and pumping water for irrigation purposes. Wind power technology is the
fastest growing renewable energy resource in the world [46]. The worldwide
installed capacity of wind farms reached 254 GW by the end of June 2012, out of
which 16.5 GW are new installations added in the first half of 2012 [361]. Several
European countries are obtaining 10 percent or more electricity from wind power
[46, 140]. It indicates that wind power technology is a rapidly growing, mature,
and proven technology. The capacity and height of wind turbines have increased
with time [46]. Generally, wind speed is higher and more stable at height.
Increased height of the wind turbine allows increasing length of the turbine
blades, so it capture more power due to larger area through which the turbine
can extract energy (known as swept area of the rotor). Additionally, the rotor can
be installed higher to take advantage of the higher wind speed.

129
Pakistan has a tropical desert climate with yearly precipitation of less than
250 mm. It is hot and dry in most of its areas, with a relative high average annual
temperature. The country is under a great influence of monsoon from the Indian
Ocean, which brings both precious rain and abundance of wind energy
resources. The thermal depression of South Asia and monsoon winds shape the
country’s southern coastal areas and northern mountain areas into a land rich in
wind resources.
Various studies indicate that there is a good potential for generating electricity
from wind energy along the coastline and many other regions of Pakistan [47,
213, 214, 216, 305, 306]. Pakistan Metrological Department (PMD) has installed
several wind data collection centers along the coastline and northern areas of the
country. The wind data is obtained from 47 towers along the coastline. The
collected wind data indicates that wind speeds from 5 m/s to 7 m/s persist in the
coastal regions and many valleys in the Northwest region of the country at a
height of 50m [250].
In an effort to access the global potential of wind resources, the US National
Renewable Energy Laboratory (NREL) and 3TIER Environmental Forecast
Group developed 50m wind map of Pakistan shown in Figure 14. This high-
resolution wind map also indicates that many regions of country have good
potential for generating wind energy [229]. Sheikh mentioned that many potential
sites for wind energy generation in Pakistan have capacity factor of more than
25%, which is internationally considered suitable for the installation of

e
5
a
th
id
p
s
conomicall
0,000 MW
n average
he coastal a
deal for gen
An in-de
rospective
everal regio
y viable c
of wind en
wind speed
areas of Pa
nerating ele
(R
epth analys
areas and
ons of the c
commercial
nergy poten
ds of more
akistan, esp
ectricity from
Figure 14Reprinted with
sis of the
screen ou
country hav
wind farm
ntial along t
than 7m/s
pecially the
m wind ene
4: Wind map h permission
wind data
ut less prom
ve good-to-e
ms [305].
the coastal
at 80 m he
wind corrid
rgy.
of Pakistan [2from USAID
is very u
mising area
excellent w
Multiple s
l areas of t
eight [104, 2
dor around
229] Pakistan)
seful to id
as. The fol
wind resourc
studies ind
the country
213]. There
Gharo regi
dentify the
lowing area
ces [82]:
130
icate
y with
efore,
on is
best
as in

131
Southeastern Pakistan especially:
o Hyderabad to Gharo region in southern Indus Valley;
o Coastal areas south of Karachi; and
o Hills and ridges between Karachi and Hyderabad.
Northern Indus Valley especially:
o Hills and ridges in northern Punjab; and
o Ridges and wind corridors near Mardan and Islamabad.
Southwestern Pakistan especially:
o Near Nokkundi and hills and ridges in the Chagai area; and
o Makran area hills and ridges.
Central Pakistan especially:
o Wind corridors and ridges near Quetta; and
o Hills near Gendari.
Elevated mountain summits and ridge crests, especially in northern
Pakistan.
It is estimated that approximately 26,400 km2 (3% of Pakistan’s total area)
has class 4+ (good-to-excellent) wind resource for utility-scale applications. It has
a potential of generating approximately 132,000 MW of electricity from wind
(assuming 5 MW/km2) [82]. Moreover, almost 9% of the country’s land area has a
Class 3 or better wind resource. A summary of the wind resource at 50 m height
along with potential of generating electricity from the available wind resources
are presented in Table 18.

132
Table 18: Good-to-Excellent wind resource [82]
Wind Resource
Wind Class
Wind Power W/m2
Wind Speed
m/s
Land Area Km2
Electricity Potential
MW Good 4 400–500 6.9 – 7.4 18,106 90,530
Excellent 5 500–600 7.4 – 7.8 5,218 26,090
Excellent 6 600–800 7.8 – 8.6 2,495 12,480
Excellent 7 >800 >8.6 543 2,720
Total 26,362 131,800
Despite the availability of wind resources in abundance, there is not much
progress made for the utilization these resources in the country. Presently, the
installed capacity of wind power is only 40 MW in the country [1]. In the
renewable energy policy announced by the government in the year 2006, surety
has been given for the purchase of electricity generated by wind farms.
Moreover, a unique concept of “wind risk” has also been incorporated to immune
the investors and project developers from the risk of variability of wind resource
(wind speed). This concept has been incorporated to overcome the fear related
to the reliability and accuracy of the available wind data and insulate the investor
from resource variability risk. This risk is absorbed by the power purchaser
(government). The wind risk concept will ensure that the government will make
monthly payments for the purchase of power in accordance with the benchmark
wind speed tables [110]. The benchmark wind speed is determined for each
project site on the basis of the independently monitored wind data. Subsequently,
electricity generation levels corresponding to the benchmark wind speed are
calculated. If less power is generated in a particular month due to wind speed

133
lower than the benchmark wind speed, the government will make monthly
payments to wind farms according to the benchmark wind speed data. The
principle behind the wind risk concept is to make the wind farm developers and
investors immune to the wind speed variability factor, which is beyond their
control. However, project developer will be fully responsible for factors within
their control such as availability of the wind farms [110]. The renewable energy
policy also offers other benefits including some tax exemptions and waiver of
import duties for the equipment required for renewable energy projects.
4.7 Wind Energy Deployment and Integration Challenges
The slow uptake of wind energy technology in Pakistan can be attributed to
numerous challenges and barriers, ranging from a lack of infrastructure to poor
competition with the conventional power generation. In order to pave the way
forward for a sustainable energy future, the challenges faced by the national wind
energy sector must be systematically identified and addressed. Therefore, it is
vital to identify and prioritize these barriers and challenges, because without
identifying the critical barriers, we cannot move towards addressing them.
Moreover, based on these identified and prioritized barriers, appropriate action
items are proposed.
There are also integration/transmission challenges associated with the
deployment of wind energy, because it is a variable power source and its output
varies depending on the wind speed [77, 119]. The tremendous potential of wind

134
resource alone does not ensure significant utilization of wind energy [281]. The
variability and uncertainty of wind energy significantly impacts the grid operations
and it requires to make the grid more vibrant and interactive [77, 89]. It is
estimated that the impact due to a large scale integration of wind power will result
in an increase of the system operating cost by $5.00/MW in the United States
[77]. The wind integration cost may vary for Pakistan due to different
infrastructure of the national power grid.
The integration of wind energy requires investment in the transmission
system in order to increase the transmission capacity, improve grid efficiency,
changes in the grid operations, availability of emergency demand response
resources, creation of load balancing areas with interconnection capacity, better
integrated regional planning, enhanced predictability of wind resource, dispersion
of new wind installations, availability of flexible power generating units like hydro
power or thermal power plants, provision of energy storage system like pumped
hydro, or compressed air, and formulation of a detailed reserve requirement
strategy [77, 89, 119, 131, 132, 183, 184]. However, several studies conclude
that it is feasible and manageable to integrate 20% to 30% of electricity to the
grid from wind [77, 131, 132, 184].
Details of the barriers and challenges towards a large scale deployment of
wind energy projects in Pakistan are presented in Section 5.2.2.

135
5 Data Collection and Research Validation
The steps taken for data collection for building the FCM-based scenarios and
technology roadmap for the wind energy sector of Pakistan are described in this
section. At the end of this section, steps taken to ensure the research validation
are described.
5.1 Data Collection for FCM-based Scenario Development
The following steps were taken in order to collect data for developing the
FCM-based scenarios and validation of the integrated FCM model:
Input from the individual expert to obtain their FCMs and develop an
integrated FCM model;
Scenario workshop to review and critique the integrated FCM;
Prioritization of concepts in the FCM model;
Develop input vectors through the morphological analysis during the
scenario workshop;
Build the scenarios through the FCM simulation; and
FCM validation.
5.1.1 Development of the Integrated FCM
Individual FCMs were obtained from each member of the FCM EP prior to the
FCM scenario workshop. The experts were asked to provide their causal maps
136
and highlight the factors that may affect the deployment of wind energy projects
on a large scale in the country. The experts were asked to look into the social,
technological, economic, environmental, and political aspects while identifying
the concepts.
The FCM scenario workshop agenda and handout documents were provided
to the experts three weeks before the workshop (attached as Appendix A). The
researcher also explained the purpose of the research and basic principles for
construction of FCM. Individual FCMs were obtained from 15 experts and
subsequently 12 experts attended the scenario workshop. The researcher
combined these maps into an integrated FCM by taking the average of the
causal weights of every concept. Some experts used different terminologies to
highlight the same concept in their FCM. Therefore, it was a difficult task for the
researcher to combine multiple FCMs. The researcher was able to cross check
with the experts and clarify meanings of the ambiguous concepts. However, in a
few cases the researcher was not able to clarify meanings and it resulted in the
duplication of some concepts. Details of combining multiple FCMs are given in
Appendix B. The experts also identified the most uncertain scenario drivers
(concepts) in the integrated FCM by pasting red dots on the most uncertain
factors (details given in the scenario workshop handout).
During the FCM workshop, the experts reviewed and critiqued the integrated
FCM in detail. The definition of each concept, its impact on the objective of the
map, and weights and direction of the causal links, were thoroughly discussed.

137
During the discussion, it became apparent that the experts had used different
terms for similar concepts in their individual maps. This led to redundant
concepts when their maps were integrated by the researcher. The workshop
participants therefore agreed to remove three concepts (C25: Availability of
technology, C40: Energy storage options, and C43: Income to land owners /
farmers) from the integrated map. Moreover, they discussed implications of
political intervention, fiscal incentives, public opinion and perception, and
collaboration with the global community. These discussions did not result in the
addition of concepts because the experts felt they were sufficiently reflected in
the integrated map. Finally the FCM workshop participants agreed to keep 40
concepts in the revised FCM. Thus, the integrated FCM has more concepts than
the map of any individual expert. Figure 16 shows the concepts of the integrated
map (top row), as well as the concepts of each individual map, excluding the
three concepts (C25, C40, and C43), that were dropped because they turned out
to be redundant. Figure 15 shows the causal connections between the concepts
in the integrated FCM model, which was reviewed and validated in the workshop
discussions. The concept meanings they agreed on are given in Table 19.

138
Figure 15: Revised integrated FCM for deployment of wind energy

139
The central objective of the FCM is to investigate the factors that will affect or
cause or both the deployment of wind energy projects on a large scale in
Pakistan (concept C10). A description of all the concepts in the integrated FCM
model is given in Table 19:
Table 19: Description of concepts in the integrated FCM
Concept No
Concept Title Concept Definition
C1
Economic Growth There was good economic growth in the country during the first decade of the twenty-first century and the same trend is expected to continue in the future.
C2 Growing Energy Demand Energy demand in the country is growing at an
average annual rate of 5.67% [112].
C3 Reduction in the Fossil-Fuel Reserves
Indigenous fossil-fuel reserve of Pakistan (i.e. Natural Gas) is depleting due to growth in the energy demand.
C4
Increasing Energy Cost The cost of electricity has significantly increased in the country, especially after the oil crisis of 2008. The national power sector is highly dependent on imported oil.
C5 Growth in the Population The population of the country is increasing at an
annual rate of over 1.55% [52].
C6
Energy Dependence Concerns
Most of the primary energy supplies are imported; thus, there is also a strong desire to reduce the energy dependence on the imported energy resources.
C7
Need to control energy (electricity) cost
The electricity cost is highly dependent on the price of fossil-fuels because 64.1% of electricity in the country is generated from the thermal resources [1]. There is a strong desire to keep the cost of electricity stable.
C8
Improvement in Living Standard
The living standard is improving due to increase in the GDP and economic growth. Moreover, there are more people living in large cities as compared to rural areas and rate of urbanization is 3.1% [52].
C9 Technology Innovations The technology innovations and improvements in
the wind turbine technology and other supporting technologies related to the wind energy sector.
C10 Deployment of Wind Energy (Objective)
Deployment of wind energy on a large scale in the country is the objective of this causal map/FCM.
C11 Improved Durability and Reliability
There have been significant improvements in the durability and reliability of the wind turbines.

140
C12 Local Manufacturing Local manufacturing of the wind turbines and other
supporting equipment within the country provides potential for indigenization of wind technology.
C13
Cost Reduction of Wind Turbines
Cost reduction of the wind turbines and other supporting equipment required at the wind farms for generating electricity due to local manufacturing, technology innovations, governmental support, and economies of scale. It is estimated that worldwide cost of wind turbines will reduce from by 23% to 38% [46].
C14
Reduced O&M Cost Reduction in the operating and maintenance (O&M) cost of wind farms due to technology innovations and availability of trained workforce within the country.
C15 Favoring Government Policies
Favoring policies adopted by the government to promote the wind energy deployment in the country.
C16 Availability of Trained HR for Wind Energy
Availability of trained human resources in the country for installation of equipment and smooth operation of wind farms.
C17 Ease of Maintaining Wind Farms
Ease of operations and maintenance of wind farms, including availability of spares, technical support, and maintenance infrastructure.
C18 Consistency of Policies Consistency and stability of the government policies
towards the national wind energy sector. It also includes transparency of rules and regulations.
C19
Incentives for Wind Energy Sector
Lucrative incentives for the national wind energy sector from the government such as subsidies, tax incentives, low interest loans, import duty and levy cuts/rebates/off, and other promotional policies.
C20 Private Sector Involvement
Involvement of the private sector in the wind energy sector through favoring policies and incentives.
C21 Environmental Consciousness
Increase in pollution and emissions of CO2 and other hazardous greenhouse gases increases the environmental consciousness and concerns.
C22 Awareness to Utilize Wind Energy
Increasing awareness for utilizing the indigenous wind energy resource among the government and public.
C23 Emission Standards Compliance of the wind energy projects with the
national emission control standards.
C24 Perceived Greenness of Wind Energy
Wind energy is considered a clean and pollution free source of energy.
C26
Political Will of the Government
Political will and determination from the government through legislative and legal cover, policies, incentives, central planning, capacity building, and institutional support.
C27 Health and Safety Consciousness
Increasing health and safety consciousness among the government and public.
C28
Positive Perception towards Wind Farms
A positive perception towards wind farms in the local communities because new wind projects create employment opportunities, generate economic activities, contribute towards cleaner climate, and avoid emissions of CO2 and other hazardous greenhouse gases.

141
C29 Job Creation Creation of employment opportunities due to
establishment of wind energy projects in the local communities
C30 Other usage of Wind Farm Land
Farmers and landowners can also use the land occupied by a wind farm for other purposes such as farming, cattle grazing etc.
C31 Mature and Proven Technology
Wind is a mature and proven technology and there are several examples of successful wind projects in similar conditions and environment.
C32 Regional Trends of Wind Energy Deployment
There are regional trends of wind energy utilization on a large scale in the neighboring countries of Pakistan (China and India).
C33
International Cooperation and Support
International cooperation, support, and funding opportunities for wind energy projects. Partnerships are also vital for increasing deployment of wind energy projects and access to the wind technology.
C34 Onsite Measurement and Analysis of Wind Data
Measurement and accurate analysis of wind data at the proposed sites of the potential wind farms through installation of wind masts.
C35 Availability of Wind Resource
Availability of wind resource, including both potential and quality of wind energy resource available.
C36 Grid Connectivity with Wind Farms
Connectivity of the wind farms situated at remote locations with the national electric grid.
C37 Distribution Network Upgrade
Up-gradation and improvement of the national grid in order to increase the transmission capacity, reduce losses, and improve efficiency.
C38 Stability in the Region The regional stability and improvement in the law
and order situation in the country.
C39
Demand Response and Load Balancing
Availability of emergency demand response resources, creation of load balancing areas with interconnection capacity, and integrated regional planning in order to cater for variability and intermittence nature of wind energy.
C41
Coordination Efforts of the Government
The governmental efforts to increase coordination among various ministries, government departments, and private sector companies. Establishment of a central department to facilitate new wind energy projects and coordinate the overall national research efforts.
C42 Rise in Oil Price Steep increase in the global oil price that results in a
significant increase in the cost of electricity generation.

142
FC
M
Exp
ert
Concepts Identified by each FCM Expert in the FCM Model C
1: E
con
omic
Gro
wth
C2:
Gro
win
g E
nerg
y D
eman
d
C3:
Red
uct
ion
of
Fos
sil-
Fu
el
C4:
In
crea
se in
En
ergy
Cos
t
C5:
Gro
wth
in P
opu
lati
on
C6:
En
ergy
Dep
end
ence
Con
cern
s
C8:
Nee
d to
con
trol
En
ergy
Cos
t
C8:
Im
pro
vem
ent
in L
ivin
g S
tand
ard
C9:
Tec
hno
logy
In
nov
atio
ns
C10
: D
eplo
ymen
t of
WE
C11
: Im
pro
ved
Du
rab
ility
an
d R
elia
bili
ty
C12
: L
ocal
Man
ufa
ctu
rin
g
C13
: C
ost
Red
uct
ion
of
Win
d T
urb
ines
C14
: R
edu
ced
O&
M C
ost
C15
: F
avor
ing
Pol
icie
s
C16
: H
R A
vaila
bili
ty
C17
: E
ase
of M
ain
ten
ance
C18
: C
onsi
sten
cy o
f P
olic
ies
C19
: In
cen
tive
s fo
r W
ind
In
du
stry
C20
: P
riva
te S
ecto
r In
volv
emen
t
C21
: E
nvi
ron
men
tal C
once
rns
C22
: A
war
enes
s to
Uti
lize
Win
d E
ner
gy
C23
: E
mis
sion
Sta
nd
ard
Com
pli
ance
C24
: P
erce
ived
Gre
enn
ess
of W
E
C26
: G
over
nm
ent
Su
ppo
rt
C27
: H
ealt
h C
once
rns
C28
: P
osit
ive
Per
cep
tion
C29
: Jo
b C
reat
ion
C30
: O
ther
usa
ge o
f W
ind
Far
m L
and
C31
: T
echn
olog
y M
atu
rity
C32
: R
egio
nal T
ren
ds
C33
: In
tern
atio
nal C
oop
erat
ion
C34
: O
nsi
te W
ind
Mea
sure
men
t
C35
: A
vail
abil
ity
of W
ind
Res
ourc
e
C36
: G
rid
Con
nec
tivi
ty
C37
: D
istr
ibu
tion
Net
wor
k U
pgr
ade
C38
: S
tab
ility
in t
he
Reg
ion
C39
: L
oad
Bal
anci
ng
Are
as
C41
: G
over
nm
ent
Coo
rdin
atio
n E
ffor
ts
C42
: R
ise
in O
il P
rice
E1 E2 E3 E4 E5 E6 E7 E8 E9 E10 E11 E12 E13 E14 E15
Figure 16: Concepts highlighted by each expert in their FCMs 142
89

143
5.1.2 Prioritization of Concepts
In the second phase of the scenario workshop, the experts identified the most
important and uncertain scenario drivers (concepts) and proposed the input
vectors for building the FCM-based scenarios. Figure 17 highlights the Wilson
matrix created to evaluate and prioritize the impact and uncertainty of each
scenario driver against two dimensions: potential impact and uncertainty. The
highest priority assigned to the concepts placed in the upper right side of the
matrix highlighted in blue color. The participants of the FCM workshop identified
the most uncertain concepts and potential impact of the concepts is calculated
based upon the weight of causal links and active scores. C2, C15, C19, C21 and
C26 emerged as the most important concepts in the integrated FCM model.
Un
cert
ain
ty
Lo
w
H
igh
C1, C3, C18, C33, C38, C42
High Priority C2, C15, C19, C21, C26
Low Priority C5, C6, C8, C11,
C12, C13, C14, C16, C17, C20, C22, C23, C24, C29, C30, C31, C32, C34, C36, C37, C39, C41
C4, C7, C9, C16, C27, C28, C35
Low High
Potential impact
Figure 17: Wilson Matrix used to prioritize concepts (drivers)

144
5.1.3 Development of Input Vectors
In the FCM scenario workshop, after review of the integrated FCM, the
participants were asked to highlight plausible combinations of the most important
concepts (drivers) identified in the integrated FCM. The workshop moderator
provided a list of the most important concepts identified through the Wilson
matrix to the workshop participants. The participants were asked to highlight
multiple input vectors. The input vectors consist of various plausible
combinations of the important concepts. The morphological analysis was used to
generate the plausible input vectors which are subsequently used to generate the
FCM-based scenarios. The morphological analysis has been used for scenarios
development [29, 58, 79, 269] and it can help to eliminate incompatible
combinations of concepts [151].
Based upon the discussion and feedback, the workshop moderator drew five
combinations of different concepts with different colors. Figure 18 highlights
these input vectors shown in blue, purple, green, red, and yellow colors; they are
highlighted during the scenario workshop. The morphological analysis is a useful
tool because it helps to visually analyze combinations of various conceivable
development variations of scenario drivers, avoids contradictions, and ensures
plausibility. The following input vectors were developed in the workshop:
Input Vector 1: 2A – 15B – 19B – 21B – 26B;
Input Vector 2: 2B – 15A – 19B – 21B – 26A;

5
fi
w
th
th
c
s
Input Vec
Input Vec
Input Vec
.1.4 FCM
The integ
rst scenari
were evalua
he effects o
he governm
onsciousne
imple binar
ctor 3: 2B –
ctor 4: 2B –
ctor 5: 2B –
Figure 18
Simulation
grated FCM
o, the effe
ated on the
of favoring
ment, incen
ess were e
ry squashin
– 15A – 19B
– 15B – 19B
– 15A – 19A
8: Morphologic
n and Ana
M model w
cts of econ
deploymen
governme
ntives for t
examined.
ng function
B – 21B – 2
B – 21A – 2
A – 21B – 2
cal analysis fo
lysis
was tested a
nomic grow
nt of wind e
ent policies,
he wind fa
In this stud
. For this s
26B;
26B; and
26B.
for generating
against the
wth and inc
energy. In t
, political d
arms develo
dy, the FC
squashing
g the input vec
e five input
crease in e
the subseq
drive and d
opers, and
CM model w
function, in
ctors
vectors. In
energy dem
quent scena
determinatio
d environm
was run w
nput and ou
145
n the
mand
arios,
on of
ental
with a
utput

146
values of concepts are either 0 or 1, which indicates that a concept has been
turned “on” and “off”.
For the first scenario, the FCM model was evaluated against two factors:
growth in energy demand and economic growth of the country. The effects of
these variables on the deployment of wind energy projects in Pakistan were
examined. Participants of the FCM workshop suggested combining the economic
growth variable with growth in the national energy demand for the first input
vector. It was suggested because both drivers (concepts) are likely to coexist.
However, in both cases the FCM simulation produced similar results. For the first
input, the initial states of C1 and C2 are set as 1, whereas the initial states of all
other concepts are 0. The states of C1 and C2 are clamped to always be on (1).
The concepts which are turned on (1) in the subsequent inference vectors are
mentioned in Table 20.
Table 20: Results of the FCM simulation for the first input vector *States of C1 and C2 are clamped to always be 1 (on).
Results of FCM Simulation for the First Input Vector
Input Vector C1*, C2*
First Inference Vector C1*, C2*, C3, C4, C6, C10
Second Inference Vector C1*, C2*, C3, C4, C6, C7, C10
Third Inference Vector C1*, C2*, C3, C4, C6, C7, C10, C22
Fourth Inference Vector C1*, C2*, C3, C4, C6, C7, C10, C22
For this scenario, assumptions were made that the country will continue to
make an economic growth and the national energy demand will continue to

147
increase. FCM simulation was conducted and a simple binary squashing function
was applied. The output vector became stable after the fourth iteration. As a
result, C1, C2, C3, C4, C6, C7, C10, and C22 were activated in the end. Details
of the FCM simulation are given in Appendix I.
In the first scenario, the energy demand is growing and there is a growth in
the national economy. The output vector indicates that eight concepts are turned
on, which is a plausible outcome under the given input conditions. The FCM
simulation results for the first scenario highlight that growth in the national
economy and energy demand will result in the deployment of wind energy
projects in the country (concept 10 is on). Moreover, due to these conditions, it is
likely that the cost of electricity will increase because the national power sector is
highly dependent on thermal resources (mainly imported oil and natural gas),
local / indigenous reserves of natural gas within the country will sharply deplete,
energy dependence concerns will increase, and a strong desire will emerge to
reduce dependence on imported energy resources in order to control and
stabilize the cost of electricity. These factors will also create or increase
awareness for utilizing wind energy resource among all sectors of the society
(public and government). Due to the economic growth and higher energy
demand, there will be a rise in the deployment of wind energy projects on a large
scale in the country. It is an interesting scenario because it indicates that despite
the absence of favoring policies, wind farms will be deployed in the country.

148
For the second input vector, the FCM model was tested against two variables
(concepts): favoring government policies and political determination from the
government to promote the wind energy in the country. The results of the FCM
simulation for the second input vector are shown below. The initial states of C15
and C26 are set as 1, whereas the initial states of all other concepts are 0. The
states of C15 and C26 are clamped to always be 1 (on). The concepts which are
turned on (1) in the subsequent inference vectors are shown in Table 21.
Table 21: Results of the FCM simulation for the second input vector *States of C15 and C26 are clamped to always be 1 (on).
Results of FCM Simulation for the Second Input Vector
Input Vector C15*, C26*
First Inference Vector C12, C13, C15*, C16, C19, C20, C26*, C33
Second Inference Vector C10, C12, C13, C14, C15*, C16, C17, C19, C20, C26*, C33
Third Inference Vector C10, C12, C13, C14, C15*, C16, C17, C19, C20, C26*, C33
Assumptions were made that there is a strong support and determination by
the government to promote wind energy in the country, and favoring policies
have been adopted in this regard. The FCM simulation was conducted again,
and the simple binary squashing function was applied. On this occasion, the
output vector became stable after the third iteration. The result of the simulation
indicates that C10, C12, C13, C14, C15, C16, C17, C19, C20, C26, and C33 are
activated.
In the second scenario, the effects of the favoring policies and government
support were examined on the deployment of wind energy projects. The output

149
vector indicates that eleven concepts are turned on, and again this is a plausible
outcome under the given input conditions. The simulation results for the second
scenario indicate deployment of wind energy projects in the country (concept 10
is on). Moreover, government support and favoring policies are likely to initiate
manufacturing of equipment (i.e. wind turbines and supporting equipment) within
the country, cost reduction of wind turbines and supporting equipment required at
wind farms, reduction in operations and maintenance (O&M) cost of wind farms,
availability of trained human resources for the wind industry, ease of operations
and maintenance of wind farms, incentives for the national wind energy sector,
involvement of the private sector in the wind energy sector, and availability of
international support, cooperation and funding opportunities for wind energy
projects. Due to this favorable and conducive environment, there will be a rise in
the deployment of wind energy projects in the country.
For the third input vector, the FCM model was tested against one concept, i.e.
favoring government policies to the national wind energy sector. However, the
FCM simulation results for the third input vector were similar to the second input
vector. Therefore, it is not useful to use raw scenario developed from the third
input vector.
For the fourth input vector, the behavior of the FCM model is examined
against the environmental consciousness. The simulation results for the fourth
input vector are shown in the following table. The initial state of concept C21 is
set as 1, whereas the initial states of all other concepts are 0. Moreover, the state

150
of C21 is clamped to always be 1 (on). The concepts which turned on (1) in the
subsequent inference vectors are mentioned in Table 22.
Table 22: Results of the FCM simulation for the fourth input vector *State of C21 is clamped to always be 1 (on).
Results of FCM Simulation for the Fourth Input Vector
Input Vector C21*
First Inference Vector C15, C21*, C22, C23
Second Inference Vector C10, C12, C13, C15, C16, C19, C20, C21*, C22, C23
Third Inference Vector C10, C12, C13, C14, C15, C16, C17, C19, C20, C21*, C22, C23
Fourth Inference Vector C10, C12, C13, C14, C15, C16, C17, C19, C20, C21*, C22, C23
An assumption is made that the environmental consciousness is growing
among the public and government due to increases in pollution, emissions of
CO2 and other hazardous gases. Again, the FCM simulation was conducted and
the simple binary squashing function was applied. The output vector became
stable after the third iteration. The result of the simulation indicates that C10,
C12, C13, C14, C15, C16, C17, C19, C20, C21, C22, and C23 are activated.
Participants of the FCM scenario workshop recommended that the
environmental concerns and health & safety concerns are interlinked and
recommended combining these two variables. For the FCM simulation, the initial
states of concept C21 and C27 are set as 1, whereas the initial states of all other
concepts are 0. The states of C21 and C27 are clamped to always be 1 (on). The
concepts which turned on (1) in the subsequent inferences are shown in Table
23.

151
Table 23: Results of the FCM Simulation for the modified fourth input vector *States of C21 and C27 are clamped to always be 1 (on).
Results of FCM Simulation for the Modified Fourth Input Vector
Input Vector C21*, C27*
First Inference Vector C15, C21*, C22, C23, C27*, C28
Second Inference Vector C10, C12, C13, C15, C16, C19, C20, C21*, C22, C23,
C27*, C28
Third Inference Vector C10, C12, C13, C14, C15, C16, C17, C19, C20, C21*,
C22, C23, C27*, C28
Fourth Inference Vector C10, C12, C13, C14, C15, C16, C17, C19, C20, C21*,
C22, C23, C27*, C28
In this scenario, the effects of the growing environmental, health, and safety
concerns are studied for the deployment of wind energy. The output vector
indicates that fourteen concepts are turned on. This outcome is also plausible
under the given input conditions. The simulation results for the third scenario
indicate widespread deployment of wind energy projects in the country (concept
10 is on). Moreover, growing environmental, health, and safety concerns will
result in the formulation of favoring policies towards the wind energy sector,
initiate manufacturing of equipment (i.e. wind turbines and supporting equipment)
within the country, cost reduction of wind turbines and supporting equipment
required at wind farms, reduction in the O&M cost of wind farms, availability of
trained human resources to support the wind industry, ease of operations and
maintenance of wind farms, incentives for the wind energy sector, involvement of
the private sector in the national wind energy sector, awareness of utilizing the
indigenous wind energy resources, and strict compliance with emission

152
standards. Due to these factors, a positive perception towards wind farms will be
created in the country, and there will be a rise in the deployment of wind energy
projects in the country.
For the fifth input vector, the FCM model was tested against two concepts, i.e.
favoring government policies and incentives for wind farm developers. Again, the
FCM simulation for the fifth input vector generated the results similar to the
second and third input vectors.
As a result of FCM simulation, all the scenarios highlighted a positive trend
toward deployment of wind farms, but each scenario indicated different barriers,
challenges, and deployment paths. Moreover, all the developed scenarios are
quite plausible. The scenario planning literature also emphasizes the need to
identify weak signals, surprises and unexpected futures. Thus, this research has
not been able to create heterogeneous scenarios. This limitation might be due to
the participants of the FCM expert panel and their feedback. The researcher tried
to balance the expert panels and the experts were selected from the government
departments, universities, utilities, and private companies working in the wind
energy sector of Pakistan. However, despite this limitation, the developed
scenarios provide a detailed overview of the probable future landscape of the
national wind energy sector. Thus, the scenarios are useful for the long-term
strategic planning and developing technology roadmaps.

153
5.1.5 Discussion
The approach taken in this study - the capture of individual causal maps, their
mathematical integration, and the discussion of the integrated map in a workshop
setting - resulted in a usable FCM model that the workshop team was able to
agree to. The resulting model contains each expert's partial model of the subject
matter and thus preserves diversity of opinion. However, the model has some
potential limitations, namely missing links, definitional relationships, lack of
feedback cycles, and different time frames [153, 156].
Missing links occur when concepts remain unconnected even though the
experts believe them to be interdependent. For example, in Figure 15, experts
are likely to agree that economic growth (C1) will result in improved living
standards (C8), yet the concepts are unconnected. Definitional relationship occur
when experts use concepts and causal links to elaborate on a concept meaning,
rather than to model causality [156]. For example, the link between Rise in Oil
Prices (C42) and Increasing in Energy Costs (C4) shows two facets of the
identical phenomenon, not true causality in that sense that C4 rises because and
after C42 increases. Lacking feedback cycles are commonly understood as an
indicator of limited system knowledge in complex dynamic systems. For example,
given the constraints that current energy shortages put on the Pakistani
economy, most experts would agree that increased wind energy deployment
(C10) will positively impact economic growth (C1). Through multiple pathways,
C1 is linked to wind energy deployment, thus potentially generating a virtuous

154
cycle until some level of saturation is reached. These feedback loops are not
visible in the integrated FCM [300]. Different timeframes characterize a situation
when the time lag to activation between some concepts is very short (e.g.
minutes or days) and between others is very long (e.g. years or even decades).
This is problematic because in FCM computation, each arrow responds to one
iteration. One such example is the link between improved living standards (C8)
and increased energy demand (C2) which happens with such little time lag that
standard of living is sometimes measured in per capita energy consumption. On
the other hand, the time it takes for political will of the government to translate
into improved domestic manufacturing may be years.
These potential problems with the expert generated map are partially owed to
the workshop situation. A significant amount of workshop time was consumed in
defining the meaning of all the concepts, and less time was available for the
experts to review the FCM. The FCM literature therefore proposes standard
approaches to reducing the effort needed for concept [156, 231]. It furthermore
provides a variety of approaches to pre-process FCM models before actual FCM
simulations in order to identify missing links, delete definitional variables,
standardize timeframes and improve experts' awareness for interdependencies
[76, 156]. Many FCM studies, however, chose to accept FCM as a "quick and
dirty" approach to modeling the worldviews of experts, which are inherently
subjective and limited. FCM in this context are used as communication tool to
guide the discussion and structure the scenario planning process [334]. By using

155
the results of the FCM simulations solely as an input for in-depth scenario
discussions, this study follows this approach.
The input vectors used for conducting simulation consist of the important
concepts based on their potential impact and uncertainty. It was revealed that
some concepts that are endogenous to the model also emerged as the critical
scenario drivers. For example growing energy demand (C2) is dependent on
economic growth (C1), population growth (C5), and improvements in living
standards (C8). However, these problems were avoided by clamping an
exogenous concept with the important endogenous concepts. For example C1
was clamped with C2 in the first input vector and C26 was clamped with C15 in
the second input vector.
One general concern with the FCM simulation results in this study is that all
scenarios led to an increase in the deployment of wind energy in the country,
even though scenario studies commonly result in more heterogeneous
outcomes. There are two alternative explanations for this result, namely (1) the
FCM method is to granular and therefore incapable of generating diverse
scenarios for the relatively small input vector variations considered feasible by
the experts, and (2) the participating experts' believe so strongly in the future
deployment of wind energy that their mental models do not allow different overall
outcomes, but only variations with regard to the barriers, challenges, and the
wind energy deployment paths. To investigate if the similarity of scenario
156
outcomes is an inherent limitation of the FCM method, two additional studies
were undertaken.
In the following sections the integrated FCM model is further analyzed by
applying a different squashing function and introducing wild cards in order to
generate some heterogeneous scenarios. Hyperbolic tangent function is applied
to the model as a squashing function. Research indicates that use of a different
squashing function leads to different model outcomes [152, 156]. In section
5.1.5.2, wild cards are applied to the FCM model. Wild cards are often used to
augment the scenario planning exercise; they help in identifying weak signals
and unexpected futures. Thus, wild cards can help to identify a radically different
scenario from this FCM model.
5.1.5.1 Hyperbolic Tangent Function
The FCM simulation is conducted again with a different squashing function to
examine the behavior of the integrated FCM model. A bipolar sigmoid function,
hyperbolic tangent function (tanhx), is used. The hyperbolic tangent function is a
mathematical function, and it is recommended in the literature for conducting the
FCM simulations [35, 152]. It gives values of the concepts in the range of -1 to 1
[35]. One advantage of using the hyperbolic tangent function is that it also
highlights the degree or extent: a concept is on or off such as “slightly on”,
“slightly off”, etc. A hyperbolic tangent function drawn for values between -1 to 1
is shown in Figure 19.

F
re
a
w
c
ta
st
th
The inpu
FCM simula
epresents a
re shown i
whereas the
lamped to
angent func
table after
he end. C7
Figure 19: Hy
ut vectors p
ation. Simul
a proposed
in the follow
e initial state
always be
ction is app
the fourth
and C22 a
yperbolic Tan
presented i
lation begin
d situation.
wing table.
es of all oth
on (1). FC
plied as a
iterations.
re slightly o
gent Function
n Section
ns with the
The simula
. The initia
her concept
CM simulat
squashing
C1, C2, C3
off, and all o
n drawn for va
5.1.3 are a
e definition
ation result
l states of
ts are 0. Th
tion is cond
function. T
3, C4, C6,
other conce
alues betwee
again used
of the inpu
ts for the fi
C1 and C
he states of
ducted and
The output
and C10 a
epts are off
en -1 to 1
to conduc
ut vector, w
irst input ve
2 are set a
f C1 and C2
d the hyper
vector bec
are activate
f.
157
ct the
which
ector
as 1,
2 are
rbolic
came
ed in

158
Table 24: Results of the FCM simulation for the first input vector *States of C1 and C2 are clamped to always be 1 (on).
Results of FCM Simulation for the First Input Vector
Input Vector C1* C2*
1 1
First Inference Vector C1* C2* C3 C4 C6 C10
1 1 0.54 0.54 0.54 0.54
Second Inference
Vector
C1* C2* C3 C4 C6 C7 C10
1 1 0.54 0.77 0.73 0.31 0.77
Third Inference
Vector
C1* C2* C3 C4 C6 C7 C10 C22
1 1 0.54 0.77 0.81 0.43 0.88 0.18
Fourth Inference
Vector
C1* C2* C3 C4 C6 C7 C10 C22
1 1 0.54 0.77 0.82 0.43 0.93 0.25
In this scenario, assumptions are made that the energy demand is growing
and there is a growth in the national economy. The output vector indicates that
six concepts are turned on. The FCM simulation results highlight that growth in
the national economy and energy demand will result in the deployment of wind
energy projects in the country. Moreover, due to these conditions, it is likely that
the cost of electricity will increase, the indigenous reserves of natural gas in the
country will deplete, and energy dependence concerns will increase a strong
desire to reduce dependence on the imported energy resources. In this case,
unlike the simulation results with the binary squashing function, C7 (need to
control energy/electricity cost) and C22 (awareness for utilizing wind energy
resource among all sectors of society) are slightly off. The simulation results also
indicate a rise in the deployment of wind energy projects on a large scale in the
country.

159
Similarly, for the second input vector, the FCM model was tested against two
variables (concepts): favoring government policies and political will and
determination from the government to promote wind energy in the country. The
initial states of C15 and C26 are set as 1, whereas the initial states of all other
concepts are 0. The states of C15 and C26 are clamped to always be 1 (on). The
FCM simulation results for the second input vector using the hyperbolic tangent
function are shown in Table 25.
Table 25: Results of the FCM simulation for the second input vector *States of C15 and C26 are clamped to always be 1 (on)
Results of FCM Simulation for the Second Input Vector
Input
Vector
C15* C26*
1 1
First
Inference
Vector
C12 C13 C15* C16 C19 C20 C26* C33
0.66 0.54 1 0.38 0.66 0.54 1 0.66
Second
Inference
Vector
C10 C12 C13 C14 C15* C16 C17 C19 C20 C26* C33
0.93 0.66 0.7 0.22 1 0.38 0.22 0.66 0.81 1 0.66
Third
Inference
Vector
C10 C12 C13 C14 C15* C16 C17 C19 C20 C26* C33
0.97 0.66 0.7 0.22 1 0.38 0.22 0.66 0.81 1 0.66
Fourth
Inference
Vector
C10 C12 C13 C14 C15* C16 C17 C19 C20 C26* C33
0.97 0.66 0.7 0.22 1 0.38 0.22 0.66 0.81 1 0.66
For this scenario, assumptions are made that there is a strong support and
determination by the government to promote the wind energy technology in the
country, and favoring policies have been adopted in this regard. The hyperbolic

160
tangent function is applied and the output vector became stable after the fourth
iteration. The results of the simulation indicated that C10, C12, C13, C15, C19,
C20, C26 and C33 are on.
In this scenario, the effect of the favoring policies and government support is
examined using the hyperbolic tangent squashing function. The output vector
indicates deployment of wind energy in the country. Moreover, favoring policies
by the government are likely to initiate local manufacturing of wind turbines and
supporting equipment, cost reduction of wind turbines and supporting equipment
required at wind farms, incentives for the national wind energy sector,
involvement of the private sector, and availability of international support,
cooperation, and funding opportunities for wind energy projects.
In this case, as a result of using a different squashing function, C14 (reduction
in operations and maintenance cost of wind farms), C16 (availability of trained
human resources for the wind industry), and C17 (ease of operations and
maintenance of wind farms) are slightly off. However, due to an overall favorable
and conducive environment, there will be a rise in the deployment of wind energy
projects on large scale in the country.
Again, for the third input vector, FCM simulation generated similar results for
the second input vector.
Similarly, for the fourth input vector, the behavior of the FCM model was
tested against environmental consciousness using the hyperbolic tangent

161
function. Thus, the initial state of concept C21 is set as 1, whereas the initial
states of all other concepts are 0. The state of C21 is clamped to always be 1
(on). The results of the FCM simulation for the fourth input vector are mentioned
in Table 26.
Table 26: Results of the FCM simulation for the fourth input vector *State of C21 is clamped to always be 1 (on)
Results of FCM Simulation for the Fourth Input Vector
Input
Vector
C21*
1
First
Inference
Vector
C15 C21* C22 C23
0.66 1 0.54 0.38
Second
Inference
Vector
C10 C12 C13 C15 C16 C19 C20 C21* C22 C23
0.41 0.26 0.38 0.66 0.26 0.49 0.38 1 0.64 0.38
Third
Inference
Vector
C10 C12 C13 C14 C15 C16 C17 C19 C20 C21* C22 C23
0.89 0.26 0.46 0.15 0.66 0.26 0.15 0.49 0.66 1 0.64 0.38
Fourth
Inference
Vector
C10 C12 C13 C14 C15 C16 C17 C19 C20 C21* C22 C23
0.95 0.26 0.46 0.15 0.66 0.26 0.15 0.49 0.66 1 0.64 0.38
Fifth
Inference
Vector
C10 C12 C13 C14 C15 C16 C17 C19 C20 C21* C22 C23
0.95 0.26 0.46 0.15 0.66 0.26 0.15 0.49 0.66 1 0.64 0.38
An assumption is made that the environmental consciousness is growing
among the public and government due to increases in pollution and emissions of
the hazardous greenhouse gases. FCM simulation is conducted and the
hyperbolic tangent squashing function is applied. On this occasion, the output

162
vector became stable after the fourth iteration. The result of the simulation
indicates that C10, C15, C19, C20, C21, and C22 are activated. However, as a
result of using a different squashing function, C12, C13, C14, C16, C17, and C23
are slightly off. These concepts also turned on when the binary squashing
function was applied.
Finally, the hyperbolic tangent squashing function is applied again to the
modified fourth input vector. In this case, the initial states of concept C21
(environmental concerns) and C27 (health & safety concerns) are set as 1,
whereas the initial states of all other concepts are 0. The states of C21 and C27
are clamped to always be 1 (on). Table 27 highlights the simulation results.
Table 27: Results of the FCM Simulation for the modified fourth input vector *States of C21 and C27 are clamped to always be 1 (on)
Results of FCM Simulation for the Modified Fourth Input Vector
Input Vector
C21
*
C27*
1 1
1st Infere-nce Vector
C15 C21
* C22 C23
C27*
C28
0.66 1 0.83 0.38 1 0.54
2nd Infere-nce Vector
C10 C12 C13 C15 C16 C19 C20 C21
* C22 C23
C27*
C28
0.76 0.26 0.38 0.66 0.26 0.49 0.38 1 0.93 0.38 1 0.54
3rd Infere-nce Vector
C10 C12 C13 C14 C15 C16 C17 C19 C20 C21
* C22 C23
C27*
C28
0.96 0.26 0.46 0.15 0.66 0.26 0.15 0.49 0.66 1 0.93 0.38 1 0.54
4th Infere-nce Vector
C10 C12 C13 C14 C15 C16 C17 C19 C20 C21
* C22 C23
C27*
C28
0.98 0.26 0.46 0.15 0.66 0.26 0.15 0.49 0.66 1 0.93 0.38 1 0.54
5th Infere-nce Vector
C10 C12 C13 C14 C15 C16 C17 C19 C20 C21
* C22 C23
C27*
C28
0.98 0.26 0.46 0.15 0.66 0.26 0.15 0.49 0.66 1 0.93 0.38 1 0.54

163
In this scenario, the effects of the growing environmental, health and safety
concerns are studied on the deployment of wind energy. The output vector
indicates that eight concepts are turned on. The simulation results for this
scenario also indicate a positive trend towards the deployment of wind energy
projects in the country. Moreover, growing environmental, health and safety
concerns will result in the formulation of favoring government policies towards the
national wind energy sector, and incentives will be offered to the wind farm
developers resulting in involvement of the private sector. It will also increase
awareness of utilizing the wind energy resource, create a positive perception
towards the wind farms, and subsequently it will result in the deployment of wind
energy projects on a large scale in the country.
However, as a result of using a different squashing function, C12
(manufacturing of wind turbines and supporting equipment within the country),
C13 (cost reduction of wind turbines and supporting equipment required at wind
farms), C14 (reduction in operating and maintenance cost of wind farms), C16
(availability of trained human resources for the local wind industry), C17 (ease of
operations and maintenance of wind farms), and C23 (compliance with the
national emission standards) are slightly off. These concepts turned on when the
binary squashing function was applied. However, in both cases there will be a
rise in the deployment of wind energy projects on a large scale in the country.
Similarly, for the fifth input vector, FCM simulation again generated similar results
for the second and third input vector.

164
Although the simulation results indicate a positive trend towards wind energy
deployment when hyperbolic tangent function is applied; there are several
differences with the use of different functions summarized in the following table.
Table 28: Differences in the simulation outcome with different squashing functions
Differences in the Results with Different Squashing Functions Scenario Simple Binary Function Hyperbolic Tangent Function
Scenario A C7 turned on C7 turned off
C22 turned on C22 turned off
Scenario B C14 turned on C14 turned off C16 turned on C16 turned off C17 turned on C17 turned off
Scenario C
C12 turned on C12 turned off C13 turned on C13 turned off C14 turned on C14 turned off C16 turned on C16 turned off C17 turned on C17 turned off C23 turned on C23 turned off
As mentioned earlier, the hyperbolic tangent function also highlights the
degree or extent, a concept is on or off. The following table highlights the
simulation results for concept C10 (wind energy deployment) against all
scenarios. Among these scenarios, the deployment of wind energy trend is
highest against scenario C. However, in all scenarios there is a positive trend
towards the deployment of wind energy projects in Pakistan.
Table 29: Results of the FCM simulation for concept C10
Results of FCM Simulation for C10
Scenario A (First Input Vector) 0.93
Scenario B (Second Input Vector) 0.97
Fourth Input Vector 0.95
Scenario C (Modified Fourth Input Vector) 0.98

165
5.1.5.2 Use of Wild Cards
Through the use of wild cards, the experts can foresee unexpected futures
and identify the weak signals. The wild card refers to sudden and unique
incidents that can constitute turning points in the evolution of a certain trend
[205]. A list of wild card events is developed to augment a scenario planning
exercise. These events have very low probability, but if they were to occur they
would have a very high impact on the future [128, 204]. The wild card scenarios
are developed to make robust plans in turbulent environments [205]. The wild
cards also help strategic planners to develop signposts for indicating that an
assumption is being violated [74].
It has been recommended to analyze the wild cards (possible disruptive
events) and their subsequent effects on the subject under study in order to
develop preventive measures and reduce the worst effects of these events [344].
Generally, the wild cards result in the creation of a disruptive or worst-case
scenario and help to analyze the effects of these events. Some commonly used
wild cards are: technological breakthroughs in a specific area, an ecological
disaster, a stock exchange crash, a financial crisis, a sudden regional war or
nuclear war, and massive terrorism attack [73, 344].
The following wild card events are created for this research:
Discovery of gigantic reserves of natural gas and oil in the country; and

166
Technological breakthroughs in nuclear power resulting in generation
of electricity at a very low price through nuclear power plants.
These wild cards are added to the FCM model, and necessary changes are
made to accommodate these wild cards in the model. These two variables have
similar influences on the other concepts highlighted by causal links. The modified
FCM is shown in Figure 20.

167
Figure 20: Integration of the wild cards in the FCM model
The FCM modified through the wild cards is evaluated against two factors:
discovery of massive amount natural gas and oil in the country (Concept 41); and

168
technological breakthroughs in nuclear power resulting in generation of electricity
at a very low price (Concept 39). The effect of these wild card variables on the
deployment of wind energy projects in Pakistan is examined.
The results of FCM simulation for this scenario are shown in the following
table. The initial states of C39 and C41 are set as 1, whereas the initial states of
all other concepts are 0. The states of C39 and C41 are clamped to always be on
(1). The simple binary squashing function is applied. The concepts which are
turned on (1) in the subsequent inferences are mentioned in Table 30.
Table 30: Results of the FCM simulation with the wild cards *States of C39 and C41 are clamped to always be 1 (on)
Results of FCM Simulation for FCM modified with the Wild Cards
Input Vector C39*, C41*
First Inference Vector C1, C39*, C41*
Second Inference Vector C1, C8, C39*, C41*
Third Inference Vector C1, C2, C8, C39*, C41*
Fourth Inference Vector C1, C2, C8, C39*, C41*
Assumptions are made that there have been technological breakthroughs in
nuclear power resulting in generation of electricity at a very low price and
discoveries of massive amounts of natural gas and oil reserves in the country.
The simple binary squashing function is applied to the FCM simulation. On this
occasion, the output vector became stable after the fourth iteration. C1, C2, C8,
C39, and C41 are activated in the end. Moreover, there will be a negative effect

169
on the deployment of wind energy projects in the country. There will be a lack of
political will from the government to promote the wind energy sector, absence of
policy measures to support the wind energy sector, and the price of oil will
reduce or remain stable in the country.
This is a worst-case scenario for the national wind energy sector. The output
vector indicates that five concepts are turned on. The FCM simulation results
indicate that discovery of massive amounts of fossil fuel reserves and
technological innovations in nuclear energy will have a very positive impact on
the national economy, improve the living standards, and subsequently it will raise
the energy demand in the country. However, this scenario indicates a negative
tendency towards deployment of wind energy projects in the country (concept 10
is off). Moreover, due to these conditions, there will be a lack of political support
from the government for the wind energy sector, and an absence of favoring
policies and incentives for the deployment of wind energy projects.
Energy security, financial limitations, environmental consciousness, and the
need to control energy cost were the major concerns in the developed scenarios
presented in Section 5.1.4. But in this scenario, due to abundance of energy
resources available at low cost, wind energy is not a promising alternative. The
lack of political will from the government and unavailability of favoring policies are
the major challenges faced by the national wind energy sector in this scenario.
The civil society and environmental pressure groups have to take a proactive
approach and push hard to promote renewable energy resources in the country.

170
Due to economic growth in the country, financial constraints will not hinder the
deployment of wind energy projects on a large scale. However, significant efforts
are required to persuade the government to formulate favoring policies and offer
lucrative incentives to the wind farm developers. In this scenario, it will be vital to
highlight the environmental degradation caused by the growing energy utilization
and emission of greenhouse gases and hazardous materials from the fossil-fuel
based power plants. It is also required to highlight the benefits of the renewable
energy resources such as wind energy. Moreover, it is critical to highlight the
impact of environmental damage and pollution on human health and wellbeing.
Due to improvements in the living standards, people will be more concerned
about their health and environmental issues.
It is an interesting scenario and significantly different from the other three
scenarios developed in the previous section. This scenario indicates a negative
trend towards the deployment of wind energy projects in the country. It also
demonstrates that the FCM-based scenario development approach has the
capability of developing multiple and radically different scenarios. Moreover,
development of this type of worst-case scenario will allow the important
stakeholders to foresee and envisage different strategies for the deployment of
wind energy projects in a challenging environment and with the absence of
favoring government policies.

171
5.2 Data Collection for Technology Roadmap Development
A series of three workshops and two follow-up surveys were conducted to
obtain the expert judgment and develop the technology roadmap. A separate
workshop was conducted to ascertain the roadmap objectives and targets,
identify the roadmap barriers, and propose the roadmap action items. After the
roadmap barriers workshop, two follow-up surveys were conducted to rank and
prioritize the roadmap barriers against each scenario. In the third workshop, the
TRM EP2 members also assigned responsibilities for the roadmap action items
to the major stakeholders.
5.2.1 Roadmap Objectives and Targets Workshop
This workshop was conducted to identify and establish the strategic objective
and national targets of the wind energy roadmap for the next 20 years. It was the
first workshop for the roadmap development. The national renewable energy
policy of Pakistan was used as a baseline document for establishing the
objective and national targets of the wind energy roadmap [110]. The workshop
agenda and handout documents highlight the purpose of the workshop and focus
questions were provided to the participants (members of the TRM EP1) three
weeks prior to the workshop (attached as Appendix C).
During the workshop, the participants discussed, deliberated, and identified
the strategic objectives of the roadmap in accordance with the national
renewable energy policy. The workshop participants used the worksheets

172
developed for the roadmap objectives and targets workshop. The following
strategic objectives were identified for the roadmap:
Energy Security
The country can ensure national energy security by increasing the share
of the indigenous energy resources like wind energy in the national energy
mix. It will reduce the national dependence on imported fossil-fuel and
help to achieve the national targets of electricity generation from
renewable resources.
Economic and Social Benefits
Pakistan has very limited fossil-fuel reserves, and it is estimated that
approx. 60% of the foreign exchange is spent for the import of energy
[306]. Moreover, increasing and fluctuating global energy prices impact
the economic stability and put extra burden on the national economy.
Deployment of wind energy on a large scale will provide numerous
economic and social benefits. The major benefits are savings from energy
imports, empowerment and income generation amongst the deprived
sections of society, creation of new business opportunities, and
development of local wind industry to support renewable energy
technologies. In addition, development of a wind energy manufacturing
base in the country will not only reduce the cost of equipment, but it will
also create employment opportunities and contribute to the national
173
economy. More than 70% of the population in Pakistan lives in the rural
areas, where access to electricity is limited [280]. Wind technology can
provide a promising solution to the electricity shortage problems. It will
improve living standards of the communities living in those areas.
Environmental Sustainability
Deployment of the wind energy projects in the country will help to reduce
the environmental pollution, emission of greenhouse gases, and other
environmental degradation risks. Research studies indicate that one wind
turbine of 1.5 MW capacity can reduce 2700 tons of CO2 emission per
year [16]. Presently over reliance on fossil-fuels is negatively affecting the
environment and it makes energy use unsustainable.
In the second phase of this workshop, the participants established the
national targets for the wind energy sector for the next 20 years. Again, the
national renewable energy policy of Pakistan was used as a baseline document
for establishing the national targets. The following national targets were
established in the workshop:
Generation of 1700 MW of electricity from wind energy by the year 2015;
Generation of 9700 MW of electricity from wind energy by the year 2030;
Development of the local wind industry and domestic manufacturing base;
Reducing national dependence on imported fossil-fuel by utilizing the
indigenous wind energy resources.

174
5.2.2 Roadmap Barriers Workshop
In order to systematically identify and address the barriers and challenges
faced by the wind energy sector of Pakistan, the roadmap barriers workshop was
conducted. In this workshop, the experts were asked to deliberate, identify and
explore barriers and challenges towards the deployment of wind energy projects
in Pakistan. Based on the literature review on the wind energy and renewable
energy sector of Pakistan, and integrated FCM model; critical barriers and
challenges to the widespread use of wind energy technology were identified. This
information was given to the members of TRM EP2 through the roadmap barrier
workshop agenda and handout documents, three weeks before the workshop.
During the roadmap barrier workshop, the experts were asked to add additional
barriers and challenges if they think that some important barriers are not included
in the handout. The agenda and handout documents for the roadmap barrier
workshop are attached as Appendix D.
Numerous barriers and challenges were identified during the workshop,
ranging from absence of suitable policies to lack of infrastructure required to
support the national wind energy sector. The workshop participants also
deliberated the meaning of the roadmap barriers. In the next roadmap workshop,
appropriate action items were proposed to overcome the roadmap barriers.
Therefore, it was vital to identify and prioritize roadmap barriers. The major
barriers and challenges identified during the workshop, which hinders the
deployment of wind energy projects in Pakistan, are discussed below:

175
a. Policy Barriers [6, 47, 169, 214, 216, 265, 281, 306]
The lack of supportive legislations, absence of effective national renewable
energy policies, and inconsistencies of the government policies are the major
policy barriers. These policy barriers hinder development of wind energy projects
and effective policies can significantly increase wind energy penetration in the
country. Suitable policy instrument covers power purchase agreements, well-
defined policies for the private sector participation, guidelines for land allotments,
speedy clearance process for the wind farms, subsidies, and incentives for power
generation from wind energy. The government has not implemented
any mandatory renewable portfolio standards mechanism or voluntary targets.
The favoring policies offer attractive incentives which may nurture the wind
industry.
b. Lack of Competition with Conventional Power Generation
This is one of the principal reasons for the slow uptake of the wind energy
technology in Pakistan. Despite some tax exemption to the national wind energy
sector, wind technology has high capital investment cost as compared to the
other technologies based on fossil-fuels. Unavailability of the domestic
manufacturing industry results in import of wind turbines and other related
equipment, which drives the cost of a wind power project up even further.
Moreover, heavy furnace oil is heavily subsidized as compared to wind power
technology, which further hinders the deployment of wind power technology in
Pakistan.

176
These factors, taken together, result in wind power sector being unable to
compete with conventional means of power generation. Therefore, the incentives
and subsidies given for the wind energy sector in the current National Renewable
Energy Policy are not enough to stimulate significant growth of the wind power
sector in Pakistan.
c. Institutional Barriers [169, 214, 216, 217, 305]
Institutional support plays a critical role for the identification, promotion and
implementation of wind energy technology. There is a lack of institutional support
and only a few institutes are working to promote renewable energy technologies
in Pakistan. Moreover, there is a lack of coordination and cooperation within and
between various ministries, agencies, institutes and other stakeholders.
Institutional inertia also results in resistance on the part of officials from different
organizations / departments to share their knowledge / information with others.
Pakistan has a history of poor coordination and cooperation between
governmental agencies.
Absence of a central body for the overall coordination of all activities in the
national wind energy sector also results in duplication of the efforts. This lack of
coordination and cooperation among the government agencies, institutions,
ministries and stakeholders result in procedural delays in the approval process
and subsequent deployment of wind power projects. There was even no
governmental body responsible for the planning and development of renewable
energy policies in Pakistan prior to the founding of the Alternative Energy

177
Development Board (AEDB). These institutional barriers delay and restrict the
progress in the wind energy development and commercialization.
Due to these institutional barriers, the process of obtaining approval for the
wind energy projects is very lengthy. There was much emphasis during the
roadmap barriers workshop on streamlining and simplifying the approval process.
These lengthy procedures result in lots of delays and cause frustration for the
project developers and investors. The following figure highlights the approval
process for the wind farms in Pakistan.

178
Figure 21: Approval process for a new wind farm in Pakistan
d. Financial Barriers [169, 214, 216]
There are difficulties and barriers in obtaining a competitive form of finance
from the local, national and international levels to implement the wind energy
projects in Pakistan. There are many reasons for this barrier including a lack of
familiarity with wind technology, high risk perception, uncertainty regarding the

179
resource assessment and reliability of wind speed projections, intermittent power
generation from wind energy, and the site-specific nature of every project. These
risks potentially discourage the financers to invest in this sector. Moreover, there
is a lack of financial resources and proper lending facilities, particularly for the
small-scale wind projects.
e. Circular Debt Barriers
The circular debt is an important problem for the power sector of Pakistan. A
lot of circular debt has been caused by the government entities, including the
provincial and federal government departments, by not paying their utility bills. It
creates a liquidity problem for the power generation companies, and these
companies are unable to pay for the fuel for their power plants. The circular debt
and the resulting liquidity crunch in the power sector are acting as a bar to the
new investment, especially in the renewable energy sector. As a result, the
power companies are not able to pay their fuel bills, and they are unable to invest
in the power sector or attract outside investment.
f. Economic Barriers [169, 217]
The current power generation cost from wind energy is high due to high
capital cost (cost of wind turbines and supporting equipment), taxes and custom
duty on equipment imports, low capacity factor, and government subsidies given
to conventional power plants. External costs such as health and environmental
costs associated with air pollution through fossil-fuel consumption are not
180
factored into the energy price. At the same time, social and environmental
benefits of non-polluting wind power technology are not accounted for either.
Therefore, energy prices do not reflect environmental costs and damage, and
mask the striking environmental advantages of a new and clean wind energy
option. Subsidies give an unfair advantage to the fossil-fuel based power plants
over wind farms, and these reasons make the wind energy projects un-
economical in the country. These factors negatively affect commercialization of
wind technology in Pakistan.
g. Technical Barriers [4, 169, 214, 216]
A limited access to the accurate technical information of wind technology is
also a big obstacle towards the development of wind energy technology in the
country. The technical barriers include limited R&D infrastructure in the country,
availability of low quality products available in the local market, and lack of
standards in terms of durability, reliability, and performance for these wind
energy products. There is no manufacturing industry for the wind turbines, and as
a result, the technology must be imported at a higher cost; and there is a lack of
domestic knowledge about these turbines as well. There are also very limited
R&D activities and lack of technical experts in the country to support the wind
energy projects. This lack of an overall technically encouraging environment
hinders the development of wind power technology in Pakistan.
181
h. Capacity Building [15, 47, 169, 214]
There is a requirement of capacity building for the key institutions (policy
makers, planners, regulators, facility managers, and project implementers).
Shortage of maintenance infrastructure and skilled human resources required to
operate, maintain, and support the local wind farms also represent a critical
challenge. Furthermore, maintenance facilities for the wind sector are
inadequate, leading to low operational reliability and customer confidence. Skilled
manpower can provide the essential services such as installation, operation,
maintenance, and troubleshooting of the equipment required for development of
a wind power project. At present, there is lack of both trained personnel and
training facilities for the development, installation, and maintenance of the wind
power projects. The skilled professionals are also required for conducting
research and development activities in this sector. A shortage of proper training
facilities also increases this challenge. Inadequate servicing and maintenance
infrastructure would lead to poor performance of the equipment installed in the
field. It results in limited market penetration of wind technology.
i. Transmission Barriers [214]
Integration of wind energy with the national grid is a challenge. Wind energy
resources are often located at remote and dispersed locations, not connected
with the transmission and distribution networks. Thus, investments and
modifications are required in the grid to integrate the wind power. Non-availability
of a distribution network at the potential sites for wind farms is a major challenge.

182
Moreover, wind energy is a variable and uncertain power resource, and its
deployment on a large scale requires significant changes in the power grid to
make it more vibrant and interactive. Low reliability in grid operations also
creates problems in integrating power from the wind farms.
j. Wind Resource Assessment Barriers [47, 193, 213]
The lack of reliable and sufficient wind data and inadequate wind energy
resource assessments are also very important barrier. The development of wind
power projects requires a detailed assessment of the wind regime of the area
under consideration. The international practice is to analyze the historical wind
data (10 to 20 years) with at least one year of on-site data, recorded according to
international standards, for the purpose of power output estimation from the wind
farms. The analysis of the long-term wind data helps in predicting more reliable
annual wind characteristics and wind speed averages, resulting in an accurate
estimation of wind power generation capacity. This is an important factor for
making the wind power projects bankable. The long-term wind data serves the
purpose of risk mitigation from the lender’s point of view, whereas short-term or
less reliable wind data increases the risk factor for the estimated energy
production, which in turn increases the lender’s risk perception of the project. In
Pakistan, many suitable areas in remote locations have not been assessed
properly for the implementation of wind energy projects. In this case, the private
investors are finding it very difficult to attract lenders for their projects and were

183
not prepared to risk their own capital on the available short-term and unreliable
wind data.
k. Wind Speed Variation Challenges
Some studies support the theories that climate change could affect surface
wind speeds. Pryor et al. found that wind speeds across the United States have
decreased since the year 1973 [258]. There are other scientific investigations
that have reported a decline of surface wind speeds in many regions of the world
[203, 331, 342, 348]. The power output of a wind turbine is proportional to
the cube of wind speed [301]. Thus, modest variations in the surface wind speed
can have significant implications on the generation capacity. However, there is
no study conducted to analyze changes in the surface wind speed in Pakistan.
The variations in the wind speed and wind energy density have great importance
for the financial viability of a wind farm [257]. Therefore, a decline in the wind
speed is a potential concern for the wind energy sector. It may become a critical
barrier in future and affect power output from the wind farms.
l. Lack of Awareness/ Information [47, 169, 215, 216]
There is a considerable lack of awareness regarding the wind technology and
its benefits for the country and local communities. There is very limited
information available regarding the practical issues in the implementation and
maintenance of wind energy projects. Information regarding wind energy projects
is not easily available and it deters implementation of wind energy projects in the

184
country. Availability of information will trigger entrepreneurs to invest in wind
energy projects, and it is vital for wind power generation. Therefore, it is needed
to increase availability of the technical information in order to increase the
deployment of wind power projects in the country.
m. Market Barriers [47, 169, 214]
Small size of the local market, limited involvement of the private sector,
monopoly of the giant conventional power generation companies, lack of
marketing infrastructure with promotion campaigns, low level of after-sales
service and quality control measures for the wind energy related products
available in the local market are the major market barriers. Absence of
successful and replicable business models also hinders the market penetration.
All these factors hinder the market penetration of the wind energy technology in
Pakistan.
n. Lack of Social Awareness and Acceptance [169, 214, 281]
Finally, there are several social challenges which affect the national wind
energy sector. The lack of social acceptance and local participations in the wind
energy projects also restricts large scale deployment of wind energy projects.
The participation of the local communities is restricted to just a few
demonstration projects and it restricts the deployment of wind energy projects on
a large scale in the country. Moreover, land acquisition is sometimes very difficult
and it takes long negotiations with the local community and significant

185
compensation in order to acquire the land for a wind farm. The production of wind
power generates several environmental and social benefits, such as emission
reductions, power portfolio diversity, and local employment opportunities. Wind
power is labor intensive relative to conventional fossil-fuel based power plants.
Thus, it generates employment opportunities which are considered as a
significant social benefit. All of these socio-economic benefits are valuable, but
the value of these positive attributes is not well recognized.
5.2.3 Prioritization of the Roadmap Barriers against each Scenario
In the second phase of the roadmap barriers workshop, the experts were
asked to rank and prioritize the most important roadmap barriers and challenges
for each scenario on the basis of their importance and impact on the roadmap
targets. In the first session, the experts identified and validated 14 critical barriers
towards the deployment of wind energy projects in Pakistan, mentioned in the
previous section. Then, members of the TRM EP2 discussed importance of these
roadmap barriers against each scenario. As a first step, the experts assigned
priority weights to the roadmap targets. Then the experts ranked the roadmap
barriers on the basis of their impact on the roadmap targets and assigned scores.
The weighted sum method (WSM) was used to prioritize the roadmap barriers,
which is a commonly used technique for ranking. The questionnaire used to rank
and prioritize the roadmap barriers against each scenario is attached as
Appendix E.

186
At the end of the roadmap barriers workshop, attendees were asked to
complete a questionnaire to prioritize the roadmap barriers for each scenario.
The workshop moderator collected the responses from the participants and
compiled the results. The results of the first survey were provided to the
workshop participants and another follow-up Delphi survey was conducted. The
experts were asked again to prioritize the roadmap barriers for each scenario.
This approach gave an opportunity to the experts to freely express their opinions
in an independent and anonymous way without any undue social pressures.
Analysis of the data from the roadmap barrier workshop and the follow-up
surveys revealed that for most of the roadmap barriers, consensus was achieved
in the first or second Delphi round and/or experts confirmed their previous
responses. However, in a few cases there was some difference of opinion among
the experts, but majority of the participants responded the same reply. Guidelines
given in the literature (presented in Section 3.2.5) to deal with the disagreement
and termination of a Delphi study were followed.
After the second Delphi round, chi-squared test was used to determine the
stability of responses obtained from the TRM EP2 members between the first
and second round. The results of the chi-square test concluded that individual
stability has been achieved. Details of the chi-square test used to measure the
stability of group responses in the follow-up Delphi surveys to prioritize the
roadmap barriers are attached as Appendix G.

187
The scores assigned to the roadmap barriers by the experts were normalized.
Then k-means clustering technique was used to group the roadmap barriers [88,
138, 262]. Cluster analysis is a generic name for a class of techniques used to
classify cases into groups that are relatively homogeneous within themselves
and heterogeneous between each other [273]. Thus, data clustering technique
allows objects with similar characteristics to be grouped together for further
analysis. Cluster analysis has been extensively used in numerous applications
ranging from strategic management and marketing research to information
technology and climatology [88, 124, 138, 168, 259, 273]. The k-means method
aims to minimize the sum of squared distances between all points and the cluster
center [262].The elbow method was used to define the number of clusters [168].
The details of the cluster analysis performed for all scenarios are given in
Appendix H. The results of the cluster analysis of the roadmap barriers against
each scenario are shown in Table 31. The most important roadmap barriers
having a greater impact on the roadmap targets against each scenario are also
highlighted.
Table 31: Cluster analysis to group the roadmap barriers for each scenario
Barriers Scenario B Scenario B Scenario B
Worst-Case Scenario
Normalized Value
ClusterNormalized
Value Cluster
Normalized Value
Cluster Normalized
Value Cluster
Policy 100 1 0 1 9 1 86 1Competitiveness 93 1 23 1 20 1 21 2Institutional 76 1 19 1 41 3 21 2Technical 52 3 46 2 74 2 60 2Capacity 41 3 15 1 48 3 93 1Awareness 41 3 8 1 7 1 14 3Financial 24 2 100 3 100 2 7 3

ETWSMCS
T
s
Economic TransmissionWind ResourSocial Market Circular DebtSpeed Variat
Ranking
The most c
cenario are
15n 20rce 9
024
t 9tion 9
of the road
critical road
e highlighte
Figure 22
5 20 2
9 20 24 2
9 29 2
dmap barrie
map barrie
d in this fig
2: Ranking of t
85 71 38 29 8 15 19
ers against
ers identifie
ure by a sm
the roadmap
3 73 42 12 01 31 21 1
each scena
ed through
mall circle.
barriers agai
7 1 1 3 1 1
0 1 0 3 0 1 5 1
ario is show
cluster an
nst each scen
33 35 21 21 100 0 21
wn in Figure
nalysis for
nario
188
2222132
e 22.
each
189
5.2.4 Roadmap Action Items Workshop
The roadmap action items workshop was conducted, and the TRM EP2
members were asked to propose suitable action items required to overcome the
roadmap barriers and challenges hindering the deployment of wind energy
projects in Pakistan. Members of the TRM EP2 earlier participated in the
roadmap barriers workshop and the follow-up surveys. Therefore, all the experts
in this workshop were familiar with the roadmap barriers. The workshop agenda
and handout documents highlighting the purpose of the workshop, focus
questions, important tasks, and examples were provided to the members of TRM
EP2 three weeks prior to the workshop (attached as Appendix F).
During the workshop, the experts proposed and discussed the appropriate
action items required to overcome the roadmap barriers for each scenario.
Moreover, the experts tried to translate the roadmap targets into the roadmap
action items. Earlier the most critical roadmap barriers were identified against
each scenario. Some barriers were identified against two scenarios due to their
importance and impact. In the first step, the experts proposed suitable action
items followed by discussion on their usefulness to overcome the roadmap
barriers against each scenario. A list of critical action items was created for each
roadmap barrier. The experts also specified the estimated timeline for the
proposed roadmap action items as given below:
Short-term: To be taken immediately
Medium-term: Between the year 2015 to 2020
Long-term: After the year 2020

190
5.2.4.1 Identification of Roadmap Action Items
The following action items are proposed by the members of TRM EP2, which
are required in order to overcome the roadmap barriers. In some cases, the
experts proposed that the same action item would help to overcome two or more
roadmap barriers. These action items are crucial for the successful deployment
of wind power projects in Pakistan:
a. Policy Barriers
i. Legislations to enforce the mandatory Renewable Portfolio
Standards (RPS) in order to promote deployment of renewable and
wind energy technologies in the country;
ii. Implementation of the feed-in tariffs (FITs) mechanism to increase
the deployment of wind power generation and improve their
competitiveness. The FIT framework guarantees payment to project
developers at a set rate for electricity production over a given
period of time (usually 15 to 20 years);
iii. Incorporate the wind risk concept in the Power Purchase
Agreements (PPA), to cover the power producer from abnormal
wind speed variations;
iv. Provide the tax incentives, subsidies, and Production Tax Credit
(PTC) to the wind energy sector by the government;

191
v. Complete removal of the custom duty on the import of wind turbines
and related equipment;
vi. The government should ensure consistency in policies towards the
wind energy sector for the next twenty years;
vii. The government should establish the definitive policy targets and
implementation plan for the national wind energy sector;
viii. Regulate, standardize, streamline and simplify the processes
required for:
Clearance from the federal government for a wind energy
project;
Grant of no objection certificate (NOC) from the local
government;
Power purchase agreements (PPA) for electricity purchase
from the wind;
Finalize the PPA within the stipulated time; and
Land allocation process for the wind farms.
b. Lack of Competition with Conventional Power Generation
i. Transfer the subsidies from fossil-fuel based power plants to
renewable energy technologies like wind power technology in order
to bridge the competitive gap between these technologies;
ii. Cost burdens and gains of transferring the subsidies are to be
shared by both consumers and producers;

192
iii. Promote the domestic manufacturing industry of wind turbines and
associated equipment to reduce their capital cost; and
iv. Reflect cost of carbon and other hazardous emissions in the energy
price.
c. Institutional Barriers
i. Creation of a central body to support the national wind energy
sector and ensure coordination and cooperation within and
between various ministries, government agencies, research
institutes, and other stakeholders;
ii. Reduce the procedural delays and duplication of efforts in the
national wind energy sector of the country;
iii. Information sharing between various entities from the public and
private sector to increase efficiency and progress of the wind
energy sector; and
iv. Promote the joint research and development programs of wind
energy technology among various organizations through the central
controlling and coordinating body.
d. Financial Barriers
i. Provision of financing arrangements to support investment in the
wind energy sector in order to encourage and facilitate the
deployment of wind energy projects in Pakistan;

193
ii. Creation of an innovative funding program for the small and
medium scale wind power projects;
iii. Initiation of investment tax credit (ITC) for the wind energy projects;
iv. Increase familiarity with the wind technology through seminars,
workshops, and conferences to attract the potential investors; and
v. Ensure reliability of the wind resource assessment and wind speed
projections to gain confidence of the potential investors and
financers.
Economic Barriers
i. The social, environmental, and health-related benefits of the non-
polluting wind power technology are not accounted for. These
factors reduce the cost of the wind power technology when taken in
comparison with the negative external cost of greenhouse gas
emissions and health hazards from the conventional fossil-fuel
based power plants. Therefore, it is required to devise a
mechanism to factor the environmental degradation cost and health
cost into the conventional energy prices to reflect their
environmental damage and pollution;
ii. Establishment of the local manufacturing industry within the country
to reduce the capital cost of wind energy projects;
iii. Improve the supply chain and installation strategies for the national
wind industry; and

194
iv. Remove or significantly reduce the subsidies given to the fossil-fuel
based power plants in the country.
e. Technical Barriers
i. It is vital for the government to invest in the R&D activities, increase
the R&D infrastructure, and establish a wind energy research
institute. The investments by the government in the R&D activities
would improve the technology access;
ii. Obtain the best practices from the countries having large scale
deployments of wind farms;
iii. Provide easy access to accurate technical information related to the
wind energy technology;
iv. Initiate courses related to wind energy in the local engineering
universities, technology colleges, poly-technique institutes, and
schools; and
v. Ensure quality control and standardization (in terms of durability,
reliability, and performance) for the wind energy related products
developed by the local manufacturing industry or available in the
local market.
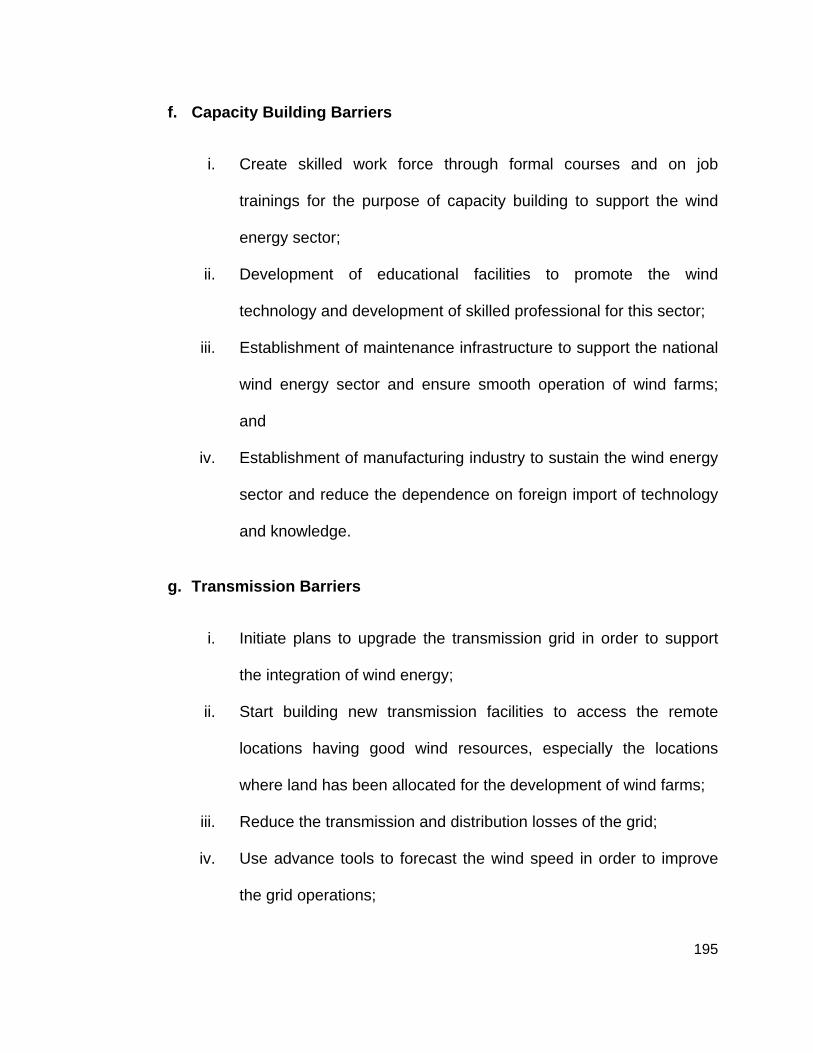
195
f. Capacity Building Barriers
i. Create skilled work force through formal courses and on job
trainings for the purpose of capacity building to support the wind
energy sector;
ii. Development of educational facilities to promote the wind
technology and development of skilled professional for this sector;
iii. Establishment of maintenance infrastructure to support the national
wind energy sector and ensure smooth operation of wind farms;
and
iv. Establishment of manufacturing industry to sustain the wind energy
sector and reduce the dependence on foreign import of technology
and knowledge.
g. Transmission Barriers
i. Initiate plans to upgrade the transmission grid in order to support
the integration of wind energy;
ii. Start building new transmission facilities to access the remote
locations having good wind resources, especially the locations
where land has been allocated for the development of wind farms;
iii. Reduce the transmission and distribution losses of the grid;
iv. Use advance tools to forecast the wind speed in order to improve
the grid operations;

196
v. Plan geographic dispersion of new wind farms to mitigate the
impact of wind speed variability;
vi. In order to respond quickly to wind shortfalls, ensure provisions of
standby emergency demand response resources;
vii. For each potential wind farm project site, study the existing grid in
the vicinity and perform load flow, short circuit, and dynamic
analysis; to investigate that the grid in the vicinity of a wind farm
can absorb power generated by that wind farm;
viii. Start practicing new approaches for grid operations to support wind
energy:
Create the electric load balancing areas to support the
integration of wind power; and
Increase the grid efficiency, reliability, and interoperability.
h. Wind Resource Data Barriers
i. Establishment of the benchmark wind speeds at different hub
heights for the regions and locations identified for establishing wind
farms;
ii. Install metrological masts with anemometers, at the potential wind
farm locations for on-site wind speed measurement in order to
generate reliable wind data;

197
iii. In order to improve access to the wind data, establish a
comprehensive, reliable, and easily accessible central information
system and database;
iv. Use advanced modeling techniques to produce detailed wind
resource maps; and
v. Develop the 50 m and 70 m wind resource maps of the country and
obtain the best practices from the developed countries.
i. Lack of Awareness/ Information Barriers
i. Initiate campaigns to educate general public on the benefits of wind
technology to raise public awareness, particularly in the context of
current power crisis;
ii. Conduct seminars and workshops to highlight the availability and
abundance of wind energy resources in the country, and attract the
potential investors and donors agencies for investment in the wind
energy sector;
iii. Use the print and electronic media by the government to increase
awareness and create a positive perception towards wind energy;
iv. Availability of an information system will also help to spread general
awareness, acceptance, and interest regarding the wind power
technology; and

198
v. Conduct workshops and conferences to spread the information
regarding the practical issues in implementing and maintaining the
wind energy projects.
j. Market Barriers
i. Promote and market the successful wind projects in Pakistan and
the neighboring countries as a replicable business model;
ii. Promote involvement of the private sector through various
incentives; details of the incentives are given in the policy related to
action items;
iii. Break monopoly of the giant conventional power generation
companies through transfer of the subsidies by the government;
and
iv. Ensure the quality and after-sales service support of the small to
medium range of wind energy turbines and related equipment
available in the local market through regulations and quality control
measures.
k. Lack of Social Acceptance
i. Initiate the programs to educate the general public about the social,
economic, and environmental benefits obtained from the wind
energy projects. These socio-economic benefits are valuable, but
their value is not well recognized. It is important to educate the local
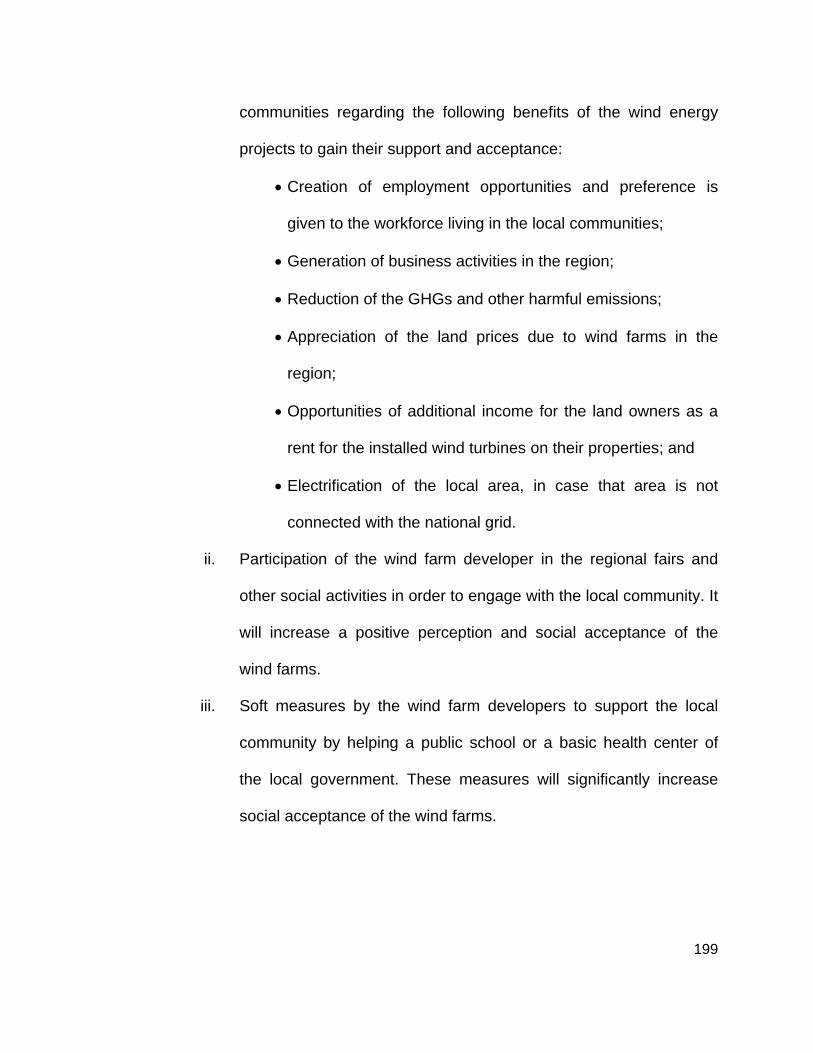
199
communities regarding the following benefits of the wind energy
projects to gain their support and acceptance:
Creation of employment opportunities and preference is
given to the workforce living in the local communities;
Generation of business activities in the region;
Reduction of the GHGs and other harmful emissions;
Appreciation of the land prices due to wind farms in the
region;
Opportunities of additional income for the land owners as a
rent for the installed wind turbines on their properties; and
Electrification of the local area, in case that area is not
connected with the national grid.
ii. Participation of the wind farm developer in the regional fairs and
other social activities in order to engage with the local community. It
will increase a positive perception and social acceptance of the
wind farms.
iii. Soft measures by the wind farm developers to support the local
community by helping a public school or a basic health center of
the local government. These measures will significantly increase
social acceptance of the wind farms.

200
5.2.4.2 Classification of Roadmap Action Items
In the second phase of the roadmap action items workshop, the experts were
asked to classify the proposed action items into the following three categories:
New action items (gaps/needs) that required to overcome the roadmap
barriers and achieve the roadmap targets;
Action items already undertaken by the stakeholders (government,
regulators, utilities, power distribution companies, and wind energy sector)
to address the roadmap barriers; and
Action items that are already undertaken by the stakeholders, but that
require significant modification, adjustments, and/or reforms in order to
become effective and overcome the roadmap barriers.
The action items classified by the experts in these three categories are color
coded in the graphical technology roadmap shown in Section 6. The required
action items are shown in blue color, the action items undertaken are shown in
green color, and the action items needed significant modification, adjustments,
and/or reforms are shown in purple color. The experts also specified the
estimated timeline for the roadmap action items.
In the end, the experts were asked to assign the respective leading role and
responsibility for each action item to the major stakeholders. In several cases,
the expert assigned the responsibility for an action item to two or more

201
stakeholders. The responsibilities for the roadmap action items with the
estimated timeline are shown in Section 6.
5.3 Research Validation
Generally, validity refers to “the extent to which an empirical measure
adequately reflects the real meaning of concept under consideration” [17]. In
order to ensure a credible research, three major types of validity must be
considered: content, construct, and criterion-related. Therefore, validation of the
results of this research case was successfully conducted from these three major
aspects. Moreover, details of the specific steps taken to ensure validation of the
integrated FCM model and technology roadmaps are also explained in this
section.
5.3.1 FCM Validation
It is very difficult to establish validity of a model. Some researchers argue that
all models are wrong and reject the notion that models can be validated [318].
However, the literature suggests focusing on the modeling process because it
leads to the creation of better models [91, 317, 318]. Moreover, participation of a
wide range of people in the modeling process and model review by the critics
also helps to develop a useful model. Involvement of stakeholders in the
modeling process helps to develop a deeper understanding of the system under
consideration. Researchers also emphasize focusing on creating useful models

202
[318]. This research has also indicated that through a series of workshops, this
research approach can be successfully implemented.
In the context of the FCM modeling, it has been recommended in the
literature that test and validation should be ongoing activities [156]. Therefore, it
is important that every step should be validated through the experts, who have to
agree that their mental models are correctly and adequately captured, and/or
through other forms of available data [156, 317]. It is very important to accurately
reflect the experts’ knowledge and properly design the FCM [156]. Weak or poor
translation of knowledge in the causal maps/FCM and weak facilitation may lead
to poor quality of the model [109]. By strictly following the FCM modeling
guidelines, the modeler would be able to reflect the experts’ knowledge and
adequately translate it into the FCM model [155, 156]. Therefore, it is important
for the modeler to ensure model validity through a high quality modeling process.
Participation of the experts helps to address the validity and acceptability aspects
of the model [133]. Jetter devised test and validation criteria for FCMs [156],
which were followed during the development process of this FCM model.
Moreover, the following steps recommended in the literature were strictly
followed to ensure validity of the FCM model [154-156]:
Identification and selection of the knowledgeable experts;
Ensuring proper knowledge capture with the help of stimuli;
Cross checking of the knowledge capture process; and

203
Proper interpretation and translation of experts' knowledge in the causal
maps and FCM models.
In this research, knowledgeable experts were very carefully identified and
selected. The researcher obtained individual FCMs from every expert and asked
the experts to review their FCMs at the end of each session. Then, the integrated
FCM model was critically reviewed and cross-checked by the experts during the
FCM workshop. The experts thoroughly analyzed and discussed the impact of
each concept; and weights and directions of the causal links. They also
deliberated the meaning of all the concepts in the FCM, so that there was no
ambiguity in the meaning. In order to provoke creative thinking of the experts,
example of an integrated FCM developed in a pilot study project was also used
as a stimulus [11]. In order to ensure validity, the integrated FCM model was also
presented to three additional reviewers / experts. These reviewers were not
included in the FCM EP, but they were familiar with the wind energy sector of
Pakistan. These reviewers were also asked to review and critique the integrated
FCM and they agreed with the structure of the FCM model. They analyzed
impacts of all the concepts on the objective of the map and their associated
causal links. The reviewers suggested that the concepts are relevant to the
objective of the FCM and the causal links indicate a logical connection among
various concepts. Through the above-mentioned activities, the integrated FCM
model was validated and no contradiction or major flaw was found by this diverse
group of experts and reviewers.

204
Moreover, after conducting the FCM simulation, the simulation results / raw
scenarios were further refined through a few experts from the FCM EP in a
follow-up session. During this session, the experts discussed the future scenario
narratives and evaluated potential implications of these scenarios.
5.3.2 Roadmap Validation
It is also critical to employ a validation process in order to develop a credible
technology roadmap. For the roadmap validation purposes, assistance from the
TRM EP1 and TRM EP2 members was obtained. This process is important
because during the roadmap development process, it is not possible to derive a
definitive form of the roadmap before it has been completed, even for the experts
who are participating in the TRM workshops [174]. Moreover, an expert group of
four members, outside from the TRM expert panels; further validated the
adequacy of the information in the technology roadmap. These new experts also
had a good knowledge and experience in the renewable energy sector of
Pakistan and they were also selected according to the expert selection criteria
presented in Section 3.2.1. The literature highlights the importance of involving
both internal and external experts to verify and validate the technology roadmaps
[173].
In a follow-up session, the developed technology roadmap was presented to
the experts for the roadmap validation purposes. This process enabled a wider
participation and engagement of both the internal and external experts. Their

205
feedback was used to improve the quality of the developed roadmap. The
experts confirmed that the roadmap objectives and targets are rational,
classification of the roadmap barriers and challenges is accurate without any
ambiguity, and the roadmap action items are appropriate and adequate. The
experts also confirmed the assigned responsibilities for the roadmap action items
and the estimated time frame to undertake these action items.
5.3.3 Content Validity
Content validity is used to confirm that the research scope is broad enough
and it adequately reflects an entire universe of items in a certain topic under
study [17]. The expert judgment was used to confirm the content validity and
ensure that the research instruments include the range of all possible outcomes
and all appropriate content is included. The content validity was conducted
during the preparation phase of the research instruments.
In order to ensure validity, the research instruments were developed based
on the literature review and research questions. The instruments were validated
using the literature, a pilot study, and the expert panels. In this case study, three
steps were taken to check the validity of the research instruments. As a first step,
the research instruments (workshop handouts, agenda documents, and follow-up
survey questionnaires) were initially validated by a group of doctorate students
from the Engineering and Technology Management department of Portland State
University. The purpose of the research instruments was explained to them and

206
they analyzed all of the questions and pointed out if there were any ambiguity or
confusion. Based upon their comments and suggestions the questionnaires were
modified.
Then a pilot study project was conducted and based on the feedback from the
experts, the research instruments were revised.
Finally, the research instruments were presented to a small group of experts,
who were serving on the TRM EPs and FCM EP. These experts reviewed the
revised instruments and checked the relevance and ease of answering all of the
questions. Based on their feedback, the research instruments were finalized.
These experts confirmed the readiness and sufficiency of all the instruments
used for data collection.
5.3.4 Construct Validity
Construct validity reflects the degree to which the structure of the model is
correct and appropriate. It reflects the ability to measure what we are interested
in measuring. The construct validity assesses how well one measure correlates
with another measure purported to represent a similar underlying construct. It is
based on the logical relationship among variables [17]. The experts can be used
to test the construct validity [230].
In this research, the key factors (scenario drivers) that may affect deployment
of wind energy on a large scale in the country were highlighted in the integrated
FCM model. Every expert reviewed the FCM to ensure that their knowledge is

207
properly captured and reflected in the model. Then the integrated FCM model
was presented to all the experts in the FCM workshop and they validated the
FCM model. The participants in the workshops discussed and agreed with the
structure of the FCM model. The causal relationships among various scenario
drivers (concepts) of the model were also critically reviewed and validated by the
experts.
Moreover, after the FCM workshop, the integrated FCM model was again
presented to three additional reviewers, who were not part of the FCM expert
panel. They also agreed with the structure of the FCM model. These activities
ensured that the integrated FCM model has been validated since no
contradiction or flaw was highlighted by any member of the expert panel and
outside reviewer.
Through the above-mentioned activities, the integrated FCM model and the
definition of the concepts were validated.
5.3.5 Criterion-Related Validity
Criterion-related validity measures the degree to which the predictor is
adequate in capturing the relevant aspects of a criterion. It is judged by
determining the similarity between a judgment about the future and its real value
[335]. Usually the criterion-related validity is determined by correlating the
research results with some other measure that is already valid and assesses the
same set of abilities.

208
In this research, it was very difficult to measure the criterion-related validity
because the outcomes of the research are the scenarios and technology
roadmap developed for the national wind energy sector for the next two decades.
However, when the research was completed, a group of experts was used for
this validation and they reviewed the research outcomes and confirmed their
agreement. Thus, feedback from the experts was obtained through a follow-up
meeting and e-mail correspondence. All the experts agreed upon the research
outcome and confirmed the research results. The experts were also impressed
from this research methodology because it clarified their understanding about the
energy future of Pakistan and provided a comprehensive action plans against
different scenarios. Some of the quotes obtained from the members of the expert
panels are given below:
“An innovative approach that has broadened my horizon regarding
technology planning”
“A comprehensive and thorough analysis of the barriers and challenges
faced by the national wind energy sector”
“An interesting way of getting an overview of different energy futures”
“This TRM exercise has brought more knowledge in my decision making
process”
“It has highlighted the required strategies to achieve the targets of
electricity generation from wind”
“It has clarified my understanding about the energy future of Pakistan”

209
In order to further ensure validity, a comparison was made of the findings of
this research with some other technology roadmaps developed by some
prestigious international agencies and national organizations. In this research,
the roadmap objectives and targets were established in accordance with the
national renewable energy policy of Pakistan as a baseline document. That was
followed by identification of the critical roadmap barriers. Policy concerns, lack of
competition with conventional power plants, financial constraints, and technical
limitations emerged as the most critical roadmap barriers. The results of this
research are similar with other studies conducted by some international agencies
and national organizations, shown in the following table. Therefore, we can
conclude that the research findings are in accordance with the roadmaps
developed by these reputable organizations.

210
Table 32: Comparison of the roadmap barriers
Most Important Roadmap Barriers
Research Case
AWEA 1 Roadmap [21]
EWEA 2 Roadmap [89]
IEA 3 Roadmap [46]
NREL4 Roadmap [228]
NRC 5 Roadmap [227]
Policy Barriers Financial Barriers
Technical Barriers
Lack of competition with conventional power plants
Institutional Barriers
Capacity Building Barriers
Awareness Barriers
Transmission Barriers
Economic Barriers
Social Acceptance Barriers
Wind Resource Assessment Barriers
Market Barriers
This research has also proposed appropriate action items required to
overcome the roadmap barriers against different scenarios. In the case of
roadmap action items, some similarities are also observed with other technology
roadmaps. Thus, these comparisons also indicate validity of the research
outcome.
1 American Wind Energy Association 2 European Wind Energy Association 3 International Energy Agency 4 National Renewable Energy Laboratory 5 Natural Resources Canada

211
Table 33: Comparison of the roadmap action items
Critical Groups of Action Items
Research Case
AWEA Roadmap [21]
EREC 6 Roadmap [85]
ERI 7 Roadmap [87]
IEA Roadmap [46]
NRC Roadmap [227]
Policy and Regulation
Technology and Industry
Awareness and Engagement
Finance and Economic Aspects
Wind Integration and Resource Assessment
Infrastructure and Capacity Building
Finally, we can conclude that all three aspects were validated qualitatively
through the expert reviews. Table 34 highlights the summary of above-mentioned
validity aspects.
6 European Renewable Energy Council 7 Energy Research Institute, China
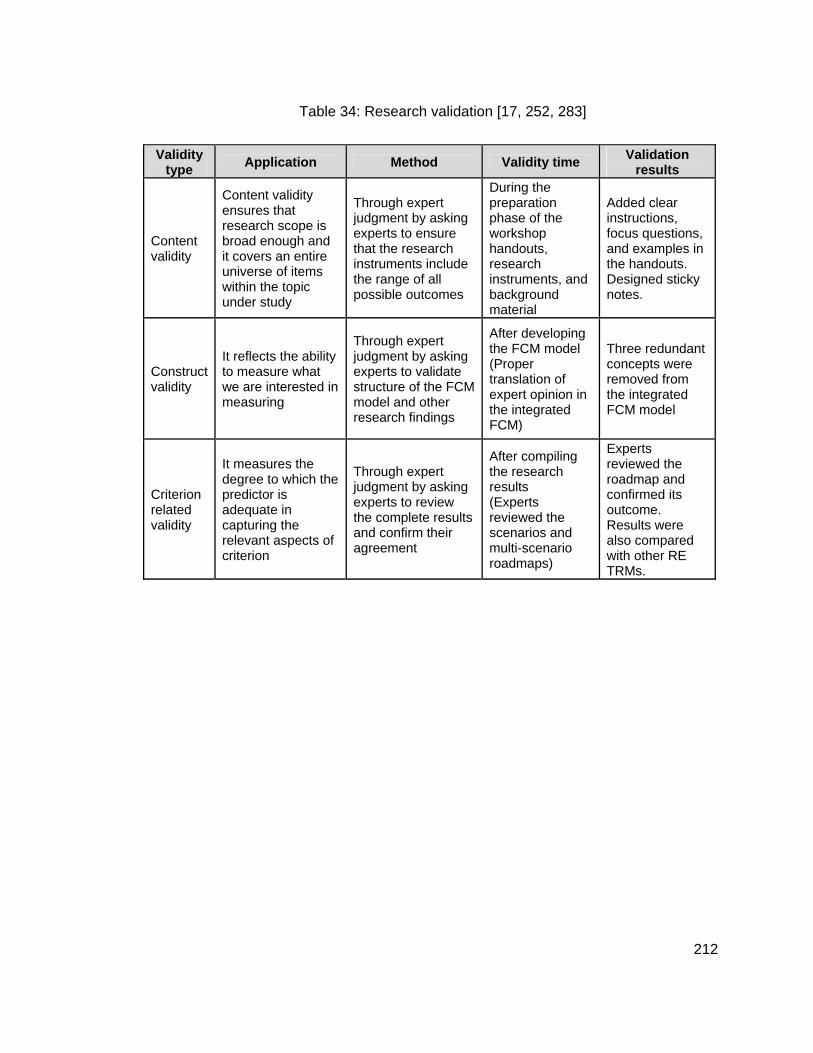
212
Table 34: Research validation [17, 252, 283]
Validity type
Application Method Validity time Validation
results
Content validity
Content validity ensures that research scope is broad enough and it covers an entire universe of items within the topic under study
Through expert judgment by asking experts to ensure that the research instruments include the range of all possible outcomes
During the preparation phase of the workshop handouts, research instruments, and background material
Added clear instructions, focus questions, and examples in the handouts. Designed sticky notes.
Construct validity
It reflects the ability to measure what we are interested in measuring
Through expert judgment by asking experts to validate structure of the FCM model and other research findings
After developing the FCM model (Proper translation of expert opinion in the integrated FCM)
Three redundant concepts were removed from the integrated FCM model
Criterion related validity
It measures the degree to which the predictor is adequate in capturing the relevant aspects of criterion
Through expert judgment by asking experts to review the complete results and confirm their agreement
After compiling the research results (Experts reviewed the scenarios and multi-scenario roadmaps)
Experts reviewed the roadmap and confirmed its outcome. Results were also compared with other RE TRMs.

213
6 Analysis and Discussion
The FCM-based scenario development approach has helped us to identify
and model the concepts (factors) that affect wind energy deployment in Pakistan.
The complex causal relationship among these concepts is also portrayed in the
model. Despite some limitations, the resulting FCM model offers a visual medium
and provides insight into the factors and barriers towards the deployment of the
wind energy projects in the country. This approach also provides a good
structured description of the system. The aim of this study was to provide a rich
insight into the wind energy sector. There are 40 concepts in the revised FCM
model. These concepts are drivers of change (from the social, technological,
economic, environmental, and political aspects) and are likely to influence the
future of the wind energy sector of Pakistan. Analysis of the integrated FCM
revealed that the concepts/drivers identified in the model can be grouped into the
following seven major clusters:
Policy and Political Support;
Financial and Economic Factors;
Demographic Changes;
Public Attitudes and Perceptions;
Technology Changes and Requirements;
Infrastructure Requirements; and
Environmental Changes.

214
Based on a literature review of 27 studies, it was found that these seven
clusters of drivers are adequate for the future-oriented research related to
sustainable energy management [117]. Thus, the concepts identified in the
integrated FCM are aligned with findings of other research studies focused on
energy management with a futures perspective.
Initially, three scenarios were developed based on the integrated FCM model.
Then another scenario was created by introducing wild cards to the integrated
FCM model. Earlier in Section 2.3.5, it was revealed by the literature review that
development of three to five future scenarios is considered appropriate by most
of the futurists and researchers.
6.1 Scenarios and Important Barriers
The following four FCM-based scenarios were created through the FCM
simulation. It was noticed that a small change in the input vectors resulted in
different stable states of the FCM model, which are used as scenarios. The set of
output vectors contain a pattern of the FCM model and the underlying causal
relationships. Thus, FCM is a powerful modeling technique and an attractive tool
to improve the quality of the scenario outcome. The developed scenarios
represent four alternative futures, and it was concluded that this method can be
used to create a set of plausible future scenarios. The quality of the FCM-based
scenarios significantly depends upon the quality of the underlying causal map.
Therefore, the experts were carefully selected, input was obtained from multiple

215
experts, their input was carefully translated into the map, and the integrated FCM
was validated by the experts.
The results of the FCM simulation (raw scenarios) were further refined
through the members of the FCM EP. In this follow-up session, the experts
discussed the future scenario narratives and explored their potential implications.
6.1.1 Scenario A: Economic Growth & Growing Energy Demand
In the first scenario, it was assumed that there is growth in the national
economy and the national energy demand is also increasing; therefore, it is likely
that the cost of electricity will increase because the national power sector is
highly dependent on thermal power generation, the indigenous reserves of
natural gas in the country will sharply deplete, energy dependence concerns will
increase, awareness for utilizing indigenous wind energy resources will also
increase, and a strong desire will emerge to reduce dependence on the imported
energy resources and to control or stabilize the cost of electricity in the country.
All of these factors will result in the deployment of wind energy projects on a
large scale in Pakistan. This is an interesting scenario, because despite the
absence of a favoring government policy, wind farms will be deployed in the
country.
Securing energy supplies / energy security is the dominant concern in this
scenario. Moreover, increasing energy costs, driven by rising demand, and
shrinking supplies of fossil-fuel based energy supplies are also significant

216
concerns. Pakistan follows a path of improving its energy security, both by
reducing the energy demand and by increasing the alternative supplies. This
scenario indicates that by the year 2030, there will be large scale deployment of
wind energy projects in the country. The scenario results indicate that
organizational type of barriers will be important in a growing economy with
increasing energy demand. New policies supporting wind industry, institutions
such as a central agency and mechanisms enabling competition are indicated by
the experts as areas to focus. The most critical barriers identified against
scenario A are mentioned below:
Policy Barriers;
Lack of Competition with Conventional Power Plants; and
Institutional Barriers.
6.1.2 Scenario B: Favoring Policies and Government Support
The second scenario is based on the assumptions that there is a strong
support and determination by the government to promote the wind energy
projects in Pakistan and that the government has also formulated favoring
policies in this regard. These favoring policies adopted by the government are
likely to establish the wind manufacturing industry within the country, reduce cost
of the wind turbines and supporting equipment required at wind farms, reduce
O&M cost of wind farms, provide incentives to the wind energy sector, and
encourage involvement of the private sector. Moreover, in this scenario trained

217
human resources will be available to support the wind energy sector, and
international support, cooperation, and funding opportunities will be available for
the wind energy projects. Due to this favorable and conducive environment, there
will be a positive trend towards the deployment of wind energy projects in
Pakistan.
The favoring government policies are the focal point of this scenario. It is
assumed that the government has formulated the favoring policies to promote the
national wind energy sector along with a strong and consistent political support.
However, since the country is not making good economic growth, scarcity of
financial resources is an important concern.
This radical transition towards the widespread deployment of wind technology
has also resulted in international collaboration and direct foreign investment.
Lucrative incentives have been offered to the private investors and wind farm
developers. There have been huge investments for the widespread deployment
of wind technology by the government and private sector. By the year 2030,
around 9700 MW of electricity will be generated from the wind resources. For
scenario B, following are the most critical roadmap barriers:
Financial Barriers;
Economic Barriers; and
Transmission Barriers.

218
6.1.3 Scenario C: Environmental Concerns
In the third scenario, climate change and health and safety issues are the
serious concerns. It is assumed that the environmental consciousness is growing
among the political leadership, government, and public due to increases in
pollution, emissions of CO2, and other hazardous gases. In this scenario,
growing environmental, health, and safety concerns will result in incentives for
the wind energy sector, involvement of the private sector, and the formulation of
favoring policies by the government towards the wind energy sector. The local
wind manufacturing industry will be developed resulting in cost reduction of wind
turbines and associated equipment, reduction in O&M cost of wind farms, and
availability of trained human resources to support the national wind industry.
Moreover, there will be awareness of utilizing the indigenous wind resources.
The government will ensure strict implementation of the national emission control
standards. Due to all these factors, a positive perception towards wind farms will
emerge in the country, and there will be rise in the widespread use wind
technology in Pakistan.
Climate change and environmental degradation are the dominant concerns in
this scenario. Public health has also become a concern due to the harmful effects
of hazardous emissions from the fossil-fuel based power plants. The climate
change and health concerns have translated in the adoption of wind energy
technology in order to effectively reduce the emissions. Moreover, there is also
emphasis on reducing both the energy losses and emissions. There will be

219
widespread deployment of wind technology in the country. Moreover, technical
knowhow and financing to develop the infrastructure and acquire the knowhow
become critical. Following are the most critical roadmap barriers against scenario
C:
Financial Barriers; and
Technical Barriers.
6.1.4 Worst-case Scenario for Wind Energy Deployment
Two wild cards were added in the integrated FCM model to create a worst-
case scenario for wind energy deployment in the country. It was assumed that
there have been technological breakthroughs in nuclear power resulting in
generation of electricity at a very low price and discoveries of massive amounts
of natural gas and oil reserves in the country. This scenario indicated a positive
impact on the national economy, improvement in the living standards, and
subsequent rise in the energy demand. However, this scenario indicates a
negative tendency towards deployment of wind farms in the country. Moreover,
due to these conditions, there will be a lack of political support from the
government for the wind energy sector, and an absence of favoring policies and
incentives for the deployment of wind energy projects.
In this scenario, due to abundance of energy resources available at a low
cost, wind energy is not a promising alternative. Market and capacity building
barriers emerged as the most significant barriers in this scenario. Moreover, the

220
lack of political will from the government and unavailability of favoring policies are
the major challenges faced by the national wind energy sector in this scenario.
However, due to economic growth in the country, financial constraints will not
hinder the deployment of wind farms.
The most critical barriers identified against this scenario are mentioned below:
Market Barriers;
Capacity Building Barriers; and
Policy Barriers.
6.2 Analysis of the Research Approach
In this section a detailed analysis has been performed on the strengths of the
FCM-based scenario development approach and weaknesses of the integrated
FCM model developed in this research case. At the end, some recommendations
have been made for improvement of this research approach.
6.2.1 Strengths of FCM-based Scenario Development Approach
It has been observed that the FCM-based scenario development approach
has resulted in the following benefits:
This research has demonstrated that the FCM-based scenario
development approach has proved to be a useful tool for the engagement
of the stakeholders. A group of key stakeholders from the government
departments, research organizations, universities, independent power

221
producers, and private companies worked together in the FCM expert
panel. These experts identified and prioritized the scenario drivers. Thus,
they actively participated in the creation of FCM-based scenarios.
In this research, the integrated FCM was used to represent the knowledge
in a symbolic manner and the mapping process helped to analyze the
influence of various scenario drivers on each other. The experts were able
to easily highlight and map the scenario drivers that may affect the
deployment of wind energy projects in the country. Thus, it was relatively
easy to use FCMs for representing the structured knowledge in a short
time. It also helped to increase the creativity and structure of the scenarios
and made the knowledge acquisition relatively easy. Moreover, different
techniques can be used to capture the knowledge. For this research, the
knowledge was captured from the literature, through interviews, and
through group sessions of the scenario workshop.
This approach enabled the researchers to quickly observe behavior of a
system without the requirement of an expensive and proprietary software
tool and the inferences were computed by numeric matrix operations. A
spreadsheet created in Microsoft Excel was used to perform the
calculations. Moreover, this technique was very useful to answer what-if
questions and the researcher was able to assess how various changes
impacted the model outcome and resulted in different scenarios. For
example, the model outcome was observed against the presence and
absence of the favoring policies and economic growth in the country.

222
This technique has a high-level of integration because the causal maps
and the resulting FCMs were modified and the views of additional experts
were integrated into the model. Individual FCMs were obtained from the
FCM EP members and the model was extended by adding new concepts
and causal links, and changing the causal weights assigned to the existing
links. Thus, this technique has the potential to reflect views of many
respondents in one integrated FCM model.
The quantitative analysis of causal cognitive maps has helped to improve
the overall quality of the developed scenarios and overcome the
indeterminacy problem. FCMs provided a simulation environment and the
use of various input vectors have allowed the researcher to foresee
consequences of these vectors resulting in different scenarios. Five
different input vectors were used in this research. Moreover, the use of
different input vectors have also allowed the researcher and experts to
better reflect their anticipated concerns.
All the scenario drivers (concepts) and their complex causal relationships
in the integrated FCM model were considered during the scenario
development process (FCM simulation). Finally, there were 40 concepts in
the revised integrated FCM model after the scenario workshop. Therefore,
this process has resulted in the creation of comprehensive scenarios
rather than creating scenarios based on a few hypothetical assumptions
and scenario drivers.

223
This research has also demonstrated that FCM-based scenario
development approach can be used with other techniques such as wild
cards to augment the scenario building process. In order to develop
heterogeneous scenarios, two wild cards were introduced to the integrated
FCM model. It resulted in the creation of a significantly different scenario,
which indicates a negative trend towards the deployment of wind energy
projects in the country. It demonstrates that the FCM-based scenario
development approach has the capability of developing heterogeneous
scenarios. Moreover, development of this type of worst-case scenario will
allow the policy and decision makers to foresee and envisage different
strategies in a challenging environment.
A summary of the observed strengths of the FCM-based scenario
development approach demonstrated in this research is presented in Table 35.
Table 35: Strengths of the research approach
Strengths of FCM-based Scenario Development Approach 1. Involvement of stakeholders in the scenario building process 2. Ease of use to represent structured knowledge in a short time
3. Quick observation of the model outcome, computation of inferences, and answer what-if questions
4. High-level of integration to combine multiple FCMs 5. Quantitative analysis of causal cognitive maps 6. Creation of comprehensive scenarios
7. Can be applied with other techniques to augment the scenario building process

224
6.2.2 Weaknesses of the integrated FCM Model (Research Case)
Some of the envisaged benefits of the FCM-based scenario development
approach were not observed during this research. It has happened due to certain
limitations of the integrated FCM developed in this research case. Therefore, the
limitations, implementation challenges, and observed weaknesses are described
in this section:
Initially, as a result of FCM simulation, all scenarios led to an increase in
the deployment of wind energy projects in the country. Although the
barriers, challenges, and the wind energy deployment paths are different
against each scenario, there is a positive trend towards wind technology.
Thus, this research has not been able to create heterogeneous scenarios.
This limitation might be due to the members of the FCM expert panel.
Their feedback represents linear thinking, without considering a
surprisingly different or unexpected trend (concept) in their FCMs.
A cognitive bias may have deviated judgment of some experts in this
particular situation. In order to overcome this problem, it is recommended
to ensure a wider participation of experts in the expert panels. Moreover, it
is also important to carefully balance the expert panels. However, through
the use of wild cards a significantly different scenario was also developed
in this research.
Some weaknesses were also observed in the integrated FCM model. The
integrated FCM model was not refined before actual FCM simulation in

225
order to identify missing links and definitional variables. There are several
concepts in the model having only a direct effect on the objective of the
FCM model (widespread deployment of wind energy in the country).
However, these concepts may also affect other concepts in the FCM
model, but in some cases it is not highlighted by causal links. For example
the direct effect of international cooperation (C33) has shown on the
deployment of wind energy projects. However, it may also affect the other
concepts such as availability of trained HR (C16), measurement and
better assessment of wind resources (C34), local manufacturing (C12),
and involvement of the private sector (C20) are not shown in the model.
Similarly, the effect of economic growth (C1) on the improvement of living
standards (C8) is not shown. It indicates that the experts were focused on
the deployment of wind technology and they may have missed some
causal links among various concepts. The integrated FCM model also has
some definitional relationship highlighted in section 5.1.5. During the
scenario workshop, significant amount of time was consumed in defining
meaning of all the concepts in the model. As a result, less time was
available for the experts to critically review the integrated FCM model. It is
recommended to define the meaning/description of all the concepts before
the workshop to overcome this problem. It is especially important when
there are many concepts in the integrated FCM model.
At the start of this research, it was difficult to get input from some of the
experts in the form of a causal map. The experts were not familiar with the

226
causal maps and FCMs. Thus, the researcher translated their feedback in
the form of a causal map/FCM and asked them to review it to ensure that
their judgment was properly translated in it. However, the use of stimuli
significantly helped to capture the experts’ knowledge. A casual map
developed in a pilot study project was used as a stimulus during the
process of obtaining feedback from each expert [11]. It helped the experts
to understand the FCM and provide meaningful feedback.
In this research, it was a difficult task for the researcher to combine the
individual FCMs of all the experts in one integrated FCM model because
some experts used different descriptions and terminology to highlight the
same concepts. Therefore, it was a challenge to remove the redundant
concepts and causal links from the integrated FCM model. The scenario
workshop provided a suitable platform where the experts reviewed the
integrated FCM and removed the redundant concepts. Clear definition of
the meanings of all the concepts helped to overcome this challenge. This
standardization is also very helpful when multiple experts are reviewing
the integrated FCM.
There is lack of consideration of time lags in the integrated FCM model
and simulation. It has been explained in section 5.1.5 that the expert
highlighted causal links with very different timeframes in the integrated
FCM model. However, these time frames were not synchronized through
"dummy concepts".

227
A summary of the observed weaknesses and implementation challenges is
presented in the following table:
Table 36: Weaknesses and implementation challenges
Weaknesses and Implementation Challenges
1. In this research case, it was difficult to create heterogeneous scenarios
2. Due to limited time of scenario workshop, the integrated FCM is not very comprehensive and some causal links are missing
3. Sometimes experts are not familiar with the causal maps
4. Difficulties to combine multiple FCMs due to different description/terminology of concepts
5. Lack of consideration of time lags
6.2.3 Recommendations
This research has indicated that through a series of workshops, this research
approach has been successfully implemented. However, there were some
process related problems and implementation challenges, which are described in
this section. Moreover, recommendations are also presented to overcome these
problems.
It was observed that there was limited time available for the experts in the
scenario workshop. Therefore, it is recommended to increase time of
scenario workshop and conduct two workshop sessions. It would ensure
that the experts have ample amount of time to review and critique the
integrated FCM model. A case study indicates that multiple workshops
were conducted to create the FCM-based scenarios [334].

228
It is recommended to pre-process FCM models before actual FCM
simulations in order to identify missing links, delete definitional variables,
standardize timeframes and improve experts' awareness for
interdependencies [76, 156].
It is important to consider time lags in the integrated FCM model and
simulation. It has been observed that the experts drew several causal links
with very different timeframes. For example the political will of the
government (C26) will take some time (in months) to translate into
formulation of favoring policies (C15) and subsequent improvements in
domestic manufacturing (C12) may take even years. The FCM literature
highlights to synchronize these time frames through incorporation of
"dummy concepts". These concepts help to break the more long-term
causal links into several causal links with shorter time-frames [156, 233].
This research framework was primarily focused on the workshops.
However, there are many other participation modes possible such as
online discussions, online modeling etc. that could be used. It would
facilitate the experts to join the expert panels from different geographical
locations. Several researchers have highlighted that the online
discussions make it possible for the experts to participate from anywhere
in the world [42, 114, 189, 316].
It was difficult for some of the participants to easily understand the FCM.
This increases the responsibility of the researcher and workshop
moderators to guide the workshop participants through the process and

229
explain the research outcome. In order to overcome this problem, some
researchers have also conducted a training workshop for the experts to
provide background information of the scenario development theory and
FCM theory [334].
It was observed that the expert panel members had a tendency to break
into small groups of 5-6 experts during the workshops. Therefore, it would
be critical to make sure that at least two workshop moderators are
available for each workshop session.
It is strongly recommended to clarify the meaning and description of all the
concepts in the FCMs obtained from every expert. This would facilitate the
researcher to easily combine multiple FCMs obtained from all the experts
and remove the redundant concepts. The FCM literature also suggests
that clear names of the key concepts is helpful to integrate multiple FCMs
into one [156].
The researcher should also ensure to use standard terminology for
various concepts highlighted in the FCM model. This would help to ensure
clear communication without any ambiguity and confusion. The literature
on expert judgment [127, 335] and FCM [156] also highlight the
importance of using clear and standardized terminology.
It is recommended to explore software tools to facilitate the map building
process and creation of a FCM Adjacency matrix. A software tool can
facilitate the modeler to read, edit, and combine multiple maps and

230
translate them into FCM models [156]. This would also significantly reduce
the time and effort required for conducting FCM simulation.
The researcher and workshop moderators should encourage some
brainstorming in the start of every workshop. It helps to get people into a
creative mood and generate useful ideas [30, 211, 322].
It is also recommended to use stimuli during the knowledge capture
process from the members of an expert panel. The FCM literature also
highlights the importance of using stimuli [155, 156].
Finally, the researcher should try to include more policy and decision
makers working in key government organizations and experts that can
also assess the usefulness of the action items. This would ensure the
creation of a comprehensive and detailed FCM model and technology
roadmap.
6.3 Wind Energy Technology Roadmap
In this research, a systematic top-down approach was used for the
development of this technology roadmap, and separate workshops were
conducted for various layers of the roadmap. The strategic objectives of the
roadmap were identified by the experts using the national renewable energy
policy of Pakistan as a baseline document. Then, the experts established the
national targets of the wind energy roadmap for the next 20 years.

231
In the next roadmap workshop, the experts identified and explored the critical
barriers towards the deployment of wind energy projects in Pakistan. In this
workshop, the experts also ranked and prioritized the most important roadmap
barriers against each scenario on the basis of their impact on the roadmap
targets. In the last roadmap workshop, the experts proposed appropriate action
items required to overcome the roadmap barriers for each scenario. Moreover,
the roadmap objectives and targets were translated into the roadmap action
items. Figures 23, 25, 27, and 29 highlight the action items required to overcome
the roadmap barriers against the all scenario. The action items already taken by
the stakeholders (government, power regulators, utilities, power distribution
companies, and national wind industry) to address the roadmap barriers are
shown in green color. Whereas, the action items which are already taken by the
stakeholders but require significant modification or reforms are highlighted in
purple color. The new action items (gaps/needs) that are required to overcome
the roadmap barriers and achieve the roadmap targets are shown in blue color.
Most of the action items proposed by the experts are in the category of new
action items. In these roadmaps, the responsibility for the key action items is
assigned to the major stakeholders. In several cases, the expert assigned the
responsibility for an action item to two or more stakeholders.
The experts also specified the estimated timeline for the proposed roadmap
action items against each scenario as shown in Figures 24, 26, 28, and 30. In
these roadmaps, the key action items are highlighted with a timeline. The

232
roadmap is developed for the wind energy sector of Pakistan and it is based on
the multiple FCM-based scenarios. This research approach has helped us to
develop robust and flexible roadmaps. These multiple scenario technology
roadmaps will be useful against a wide range of alternative future outcomes.
These roadmaps would also help the stakeholders to visualize the appropriate
action items against different circumstances and scenarios. The most critical
roadmap barriers and challenges are identified against each scenario, and the
appropriate action items are proposed to overcome these barriers and achieve
the roadmap targets.

233
Figure 23: Actionn items required tto overcome the barriers for scenaario A: Growth of Economy and Ennergy Demand
233
89

234
234
Figure 24: Keey roadmap actioon items with timeeline for scenario A: Growth of Ecoonomy and Energgy Demand
234
89

F235
Figure 25: Action items required too overcome the bbarriers for scenarrio B: Favoring Poolicies and Government Support
235
89

Fig
236
gure 26: Key roadmap action ittems with timelinne for scenario B: Favoring Policies and Goveernment Suppor
236
rt
89

237
237
Figure 27: Action items reequired to overcoome the barriers ffor scenario C: EEnvironmental Concerns
237
89

238
238
Figure 28: Key roadmmap action items wwith timeline for sscenario C: Enviroonmental Concerrns
238
89

239
239
Figure 29: Action ittems required to overcome the baarriers for the worrst-case scenario
239
89

240
Fiigure 30: Key rooadmap action items with timeliine for the worstt-case scenarioo
240
89

241
7 Conclusion
In this section, the research outcome and research contributions are
discussed. Research limitations and recommended future research are also
described in this section.
7.1 Research Outcome
The outcome of this research is the national level wind energy technology
roadmap for Pakistan based on multiple FCM-based scenarios. Energy is a key
element required for sustainable development and prosperity of a society. These
roadmaps have been developed for the next two decades. The roadmap has four
layers and it has highlighted the objectives, national targets, barriers and
challenges, and recommended action items with assigned responsibilities for the
deployment of wind energy projects in Pakistan. The objectives and national
targets of the roadmap are established in accordance with the national
renewable energy policy. Then, the important barriers and challenges towards
the deployment of wind energy projects against each scenario are identified
through the experts, literature review, and integrated FCM model. These barriers
and challenges are prioritized on the basis of their impact on the roadmap
targets. In the last tier of this roadmap, after detailed deliberations among the
domain experts, appropriate action items are proposed to overcome the roadmap
barriers and achieve the roadmap targets. These roadmaps for multiple
scenarios also help all major stakeholders (government, wind industry,

242
regulators, and power distribution companies) to envisage the required action
items against different circumstances and scenarios.
7.1.1 Use of FCM to Develop Scenarios for Wind Energy
This research has demonstrated development of the FCM-based plausible
scenarios for the wind energy sector. These scenarios are developed through
expert judgment representing different plausible futures. This research has
demonstrated a new approach for developing scenarios and conducting future
studies. Despite some limitations, the integrated FCM model offers a visual
medium and provides insight into the factors supporting and hindering the
deployment of wind energy projects in Pakistan. The FCM-based scenario
development approach has helped us to identify and model both qualitative and
quantitative factors and their complex causal relationships in the context of wind
energy deployment in Pakistan.
Four FCM-based scenarios have been developed. These scenarios help to
establish a future vision of the wind energy sector and facilitate development of a
robust technology roadmap. In the economic growth scenario, security of energy
supplies emerged as a significant driver and dominant concern, leading towards
utilization of the indigenous wind power. In the favoring policies scenario, scarcity
of financial resources is an important concern because the country is not making
good economic growth. The climate change and emissions of greenhouse gases
are the dominant concerns in the third scenario. Finally, market, capacity building
and policy barriers are the major concerns for the worst-case scenario developed

243
through wild cards. These scenarios provide a detailed overview of the probable
future landscape of the wind energy sector. Moreover, developed scenarios
provide a basis for the long-term strategic energy planning and technology
roadmapping.
7.1.2 Integration of Scenario Planning with Technology Roadmapping
This research has demonstrated the integration of scenario planning with
technology roadmapping. Thus, it has extended the technology roadmapping
through FCM-based scenario analysis. It was revealed in the literature review
that multi-scenario technology roadmap is never developed before for any
renewable energy technology [8]. The combined use of scenario planning and
technology roadmapping has provided a greater insight into the problem and
developed a robust roadmap. The developed roadmap has taken alternate
futures into account rather than only focusing on a desired future. Scenario
planning has introduced thinking and planning for multiple futures and strategic
options. This research has indicated that use of scenario planning has
complemented the technology roadmapping process. Several roadmap barriers
were also identified from the integrated FCM model. As a result, this approach
has brought more knowledge into the roadmap by identifying multiple alternatives
of the future states. The resulting roadmaps enable better use of public/private
resources by eliminating duplication of similar efforts.
In this research, the developed scenarios have provided an overview of the
multiple energy futures of the country. Moreover, incorporation of the

ro
a
d
v
c
te
7
c
oadmappin
gainst eac
ifferent circ
ision of the
hanges. F
echnology r
.1.3 Barri
This res
hallenges
g process
ch scenario
cumstances
e roadmap,
Figure 31
roadmappin
Figure 31: In
ers toward
search has
towards th
has identi
o. It has r
s and scen
, and enab
highlights
ng.
tegration of s
ds the Dep
s identified
he widespr
ified pathw
resulted in
arios. Ther
bled anticipa
the integ
scenario plann
ployment o
d and prio
read deplo
ways to ac
n a robust
refore, it ha
ation of a
gration of
ning with tech
f Wind Ene
oritized the
oyment of
hieve the
roadmap
as enhance
broader ran
scenario
hnology roadm
ergy
e importan
wind ene
desired tar
useful ag
ed flexibility
nge of pos
planning
mapping
nt barriers
rgy project
244
rgets
ainst
y and
ssible
with
and
ts in

245
Pakistan. It is very important to identify the critical barriers in order to pave the
way forward for a sustainable energy future in the country. The barriers and
challenges faced by the wind energy sector have been systematically identified
and addressed in the roadmap. There are numerous barriers and challenges,
ranging from policy and legislative issues to a lack of infrastructure and financial
constraints. These barriers have restricted the deployment of wind energy
technology in the country.
This research is the first serious effort to systematically identify the critical
barriers faced by the national wind energy sector. The research findings suggest
that policy concerns, lack of competition with conventional power plants, financial
constraints, and technical limitations are the most critical roadmap barriers
hindering the deployment of wind energy projects in the country against these
scenarios. The developed roadmap has also suggested the action items required
to overcome the roadmap barriers against each scenario.
The roadmap barriers identified through this research are similar to other wind
energy and renewable energy technology roadmaps. The American Wind Energy
Association (AWEA) has developed a technology roadmap for the wind turbine
technology for the next 20 years [21]. The AWEA’s roadmap identified that the
policy barriers, technology barriers, and market barriers are the major challenges
to the widespread use of wind technology [21]. Another study indicated that the
technical barriers, market barriers, and institutional barriers are the most critical
obstacles to widespread use of renewable energy technologies [228]. Barriers

246
related to the legislation, administration, lack of information, and institutional
issues are also important [41]. Therefore, it can be concluded that other wind
energy roadmaps have also resulted in similar outcome.
7.1.4 Roadmap Action Items
In this roadmap, numerous action items have been identified and proposed to
achieve the roadmap targets and overcome the roadmap barriers.
Implementation of these action items will help to execute wind energy projects in
the country. The research has provided a framework for a national level gap
analysis for large scale deployment of wind energy. The domain experts
proposed these action items to address the roadmap barriers against each
scenario. A list of detailed action items have been proposed by the experts
against each roadmap barrier. During this process, the experts also translated
the roadmap targets into these roadmap action items. The proposed roadmap
action items are also classified by the experts into three categories: new required
action items, action items already undertaken by the stakeholders, and action
items undertaken but that require significant modification.
In the developed roadmap, responsibility for the key action items is also
assigned to the major stakeholders along with the estimated time frame, when
these action items are required to be undertaken. Thus, all major stakeholders
can review their responsibilities in this roadmap against different scenarios. It
also defines the roles and responsibilities of the major stakeholders and aligns
their efforts towards the roadmap targets and eliminate duplication of resources

247
and efforts. Implementation of these suggested action items will ensure
widespread deployment of wind energy projects. For the first time, the detailed
roadmap action items have been proposed for the national wind energy sector of
Pakistan.
Again, it has been observed that there are similarities regarding the roadmap
action items between this roadmap and some other technology roadmaps. The
wind energy technology roadmap developed by the International Energy Agency
(IEA) has proposed similar action items [46]. The Natural Resources Canada
(NRC) has also recommended that strengthening the policy framework,
expanding role of the wind industry, creating research centers, informing and
engaging the community, accelerating the development activities, and
demonstrating innovative projects are the most critical action items [227].
Analysis of the roadmap action items reveals that in these cases the proposed
action items can be grouped into the following clusters:
Policy and regulation related action items;
Technology and industry related action items;
Awareness and engagement related action items;
Finance and economics related action items;
Action items related to infrastructure and capacity building; and
Action items related to integration of wind power to the national grid.

248
Further analysis also reveals that despite some similarities in the barriers and
action items, there are significant differences in the nature of roadmap barriers
and details of the action items. Due to the peculiar conditions and circumstances
in different countries, there are differences in the specific nature of action items.
Thus, there are similarities when analysis is performed at a broader level, but an
in-depth analysis reveals that there are also differences in the action items.
However, it can be concluded that the research outcomes and findings are in
accordance with some other similar studies. This further validates and confirms
the findings of this research.
7.2 Research Contributions
The main contribution of this research is that it extends the technology
roadmapping methodology by combining it with a scenario planning approach.
This research also presents a new approach for scenario development using
fuzzy cognitive maps. The contribution of this research can be grouped into the
following two aspects:
From technology management and methodology aspects:
This study presents a combined use of scenario planning and technology
roadmapping techniques. It extends technology roadmapping through
FCM-based scenario planning. This combination has significantly
improved the usefulness of the roadmap and enabled anticipation of a
wide range of possible future outcomes. Both scenario planning and

249
technology roadmaps complement each other, and it is an appropriate
approach to use both techniques in a research project.
In this research, four scenarios are developed for the national wind energy
sector of Pakistan using FCM. Generation of FCM-based scenarios is a
very new approach, and it has been applied to the wind energy sector for
the first time. This unique approach combines the benefits of both
qualitative and quantitative analysis and develops comprehensive
scenarios.
It was revealed during analysis of the public-domain sustainable energy
roadmaps that, generally, scenarios are developed based on some
hypothetical assumptions without much deliberation. However, in this
research FCM-based scenarios, which provide logical reasoning and the
causal relationship between various elements, are developed after
combining individual causal maps from several experts. Subsequently,
these scenarios are used for developing the technology roadmap.
From application of new methodology aspects: the wind energy sector of
Pakistan as a research case:
In this research, for the first time, a technology roadmap for the wind
energy sector of Pakistan has been developed. It identifies the objectives,
national targets, barriers, and obstacles towards deployment of wind
energy technology in the country. It also recommends appropriate action
items. The existing research related to the renewable energy sector in

250
Pakistan is limited to identifying the potential of renewable energy
resources and highlighting some generic barriers. There is no roadmap,
concrete action plan or strategy proposed or discussed in the renewable
energy literature of Pakistan.
Research has addressed the challenges and barriers associated with the
deployment of wind energy on a large scale in Pakistan through the
roadmap action items. These action items have been proposed to
overcome the roadmap barriers identified against each scenario. Thus, the
objectives and the targets of the roadmap are translated into the
suggested action items.
7.3 Research Limitations
There are a number of research limitations that need to be considered. Some
limitations of this research are given below:
The outputs of this research rely on expert judgment, which is subjective
data obtained from the members of the expert panels. Moreover, in some
cases limited knowledge of the experts may limit the usefulness of the
FCM model, scenarios, and roadmap. However, it is assumed that the
members of the expert panel have a sufficient level of knowledge and
experience, but biases or limitations of knowledge of the panel members
can impact the research validity. Due to this reason, there is much
emphasis in the literature on the careful selection of the expert panel

251
members. However, this researcher has tried to overcome this limitation
by balancing the experts in each expert panel.
The expert opinion expressed in this research is limited by time,
individuals, and context. This may yield different results due to a different
time, a different group of experts, or a different country. The research is
time and context dependent.
The research case study is limited to the wind energy sector of Pakistan,
which is a developing country having peculiar energy problems. Therefore,
these results will not be applicable to other countries or industries.
However, if a similar type of research is conducted for another country or
industry, then it may give more generalized results which are applicable in
other cases as well.
This study has only considered the onshore and utility scale wind energy
projects in the technology roadmap.
All the scenario drivers (concepts) in the FCM model were prioritized
based on their potential impact and uncertainty using the Wilson matrix,
also known as impact-predictability matrix. During this process, some
concepts which are actually endogenous to the model, such as C2 and
C15 also emerged as the critical scenario drivers. However, in order to
overcome this problem, combinations of endogenous and exogenous
variables were used in some cases such as first and second input vectors.
252
FCMs of the experts were mathematically combined by taking the average
of the causal weights. It is controversial approach particularly if the experts
in their FCMs connect concepts with causal links that have different
weights or directions. However, in this research, some experts assigned
different causal weights, but different directions of causal links were not
assigned. Moreover, for scenario building purposes, this approach is
considered better than the other method based on measuring the
Hamming distance (bit difference) between the inference vectors of
various experts and assessing the expert creditability weights for each
expert as explained in Appendix B.
In this research, the integrated FCM model has some limitations due to
missing links, definitional relationships, lack of feedback cycles, and
different time frames. These limitations are explained in section 5.1.5 and
detailed recommendations to overcome the limitations are presented in
section 6.2.
This research has provided an overview of the roadmap action items.
However, it is required to specify exact technical details of the action items
especially for the medium and long-term.
7.4 Future Research
Further research is recommended in multiple areas including expanding the
research application, enhancing the robustness of the FCM model, using a

253
hierarchical decision model, monitoring the roadmap results, and assessing the
state of the technology roadmap.
Expanding the research application
As indicated in the previous section on limitations, the outcome of this
research is limited to the deployment of wind energy technology in
Pakistan. However, this methodology can be extended and applied to
another technology or industry. It will be interesting to apply this research
approach to another renewable energy technology or wind energy sector
of another country.
Enhancing the robustness of the FCM model
The integrated FCM model is developed after obtaining input from the
members of the FCM expert panel. It is recommended that this model be
presented to all major stakeholders through seminars and symposiums in
order to obtain input from a wider audience. Through this process, a more
robust and detailed FCM model can be developed.
Use of a Hierarchical Decision Model
It is recommended to use a Hierarchical Decision Model (HDM) and
pairwise comparisons to establish more robust measurements of the
importance weights of the roadmap targets and ranking of the roadmap
barriers. A conceptual overview of the proposed Hierarchical Decision
Model is shown in Figure 32.

Monit
Vario
result
145,
and
monit
result
Asses
It is im
and
propo
curre
their
status
Figure 32: O
tor and mea
us researc
ts of the ro
340]. It wo
measuring
tor how w
ts.
ss the state
mportant to
technology
osed by Va
nt state of
collective e
s signal bas
Overview of t
asure the ro
h studies h
oadmap ar
ould be inte
results fro
ell the roa
e of the roa
o develop a
y roadmap
atananan an
a roadmap
effect on t
sed on the
he proposed
oadmap res
have highlig
e achieved
eresting to
om the tec
admap initi
dmaps
n approach
ps [143, 2
nd Gerdsri
p by analyz
he roadma
elements o
Hierarchical
sults
ghted the n
d after the
develop a
chnology r
atives are
h to assess
241, 340].
[341] can b
zing chang
ap. It is rec
of the roadm
Decision Mod
eed to ana
TRM exer
framework
roadmaps.
achieving
s the state o
The prac
be used. It
ges in the k
commende
map. This s
del
alyze that a
rcise [100,
k for monito
It will hel
their inten
of the scen
ctical appr
determines
key drivers
ed to devel
status signa
254
actual
144,
oring
lp to
nded
arios
oach
s the
s and
op a
al will

assist
of the
show
t the decisi
e model for
wn in Figure
Figure 3
on to maint
calculating
33.
3: Model for c
tain, update
g the status
calculating the
e or revise
s signal of t
e TRM status
the roadma
his technol
s signal [333]
ap. An over
ogy roadm
255
rview
ap is
256
References
[1] AEDB. (March 18, 2010). Alternate Energy Development Board,
Government of Pakistan. Available: http://www.aedb.org/ [2] J. Aguilar, "A survey about fuzzy cognitive maps papers (Invited Paper),"
International Journal of Computational Cognition, vol. 3, pp. 27-33, 2005. [3] Y. Al-Saleh, "Renewable energy scenarios for major oil-producing nations:
the case of Saudi Arabia," Futures, vol. 41, pp. 650–662, 2009. [4] S. M. Alam and A. H. Shaikh, "Wind and Solar Sources for Energy,"
Economic Review vol. 38, pp. 24-25, 2007. [5] J. Alcamo and T. Henrichs, "Towards guidelines for environmental
scenario analysis " in Environmental Futures: The Practice of Environmental Scenario Analysis, First ed. Amsterdam, The Netherlands: Elsevier, 2009, pp. 13-35.
[6] E. Alishahi, M. P. Moghaddam, and M. K. Sheikh-El-Eslami, "An investigation on the impacts of regulatory interventions on wind power expansion in generation planning," Energy Policy, vol. 39, pp. 4614-4623, 2011.
[7] M. Amer, "Development of fuzzy cognitive map (FCM) based scenarios," in Portland International Center for Management of Engineering and Technology (PICMET): Technology Management in the Energy Smart World, 2011, pp. 2695-2709.
[8] M. Amer and T. U. Daim, "Application of technology roadmaps for renewable energy sector," Technological Forecasting and Social Change, vol. 77, pp. 1355-1370, 2010.
[9] M. Amer and T. U. Daim, "Selection of renewable energy technologies for a developing country: A case study of Pakistan," Energy for Sustainable Development, vol. 15, pp. 420-435, 2011.
[10] M. Amer, T. U. Daim, and A. Jetter, "A Review of Scenario Planning," Futures, vol. 46, pp. 23-40, 2013.
[11] M. Amer, A. J. Jetter, and T. U. Daim, "Development of fuzzy cognitive map (FCM) based scenarios for wind energy," International Journal of Energy Sector Management, vol. 5, pp. 564-584, 2011.
[12] B. Antoine, K. Goran, and D. Neven, "Energy scenarios for Malta," International Journal of Hydrogen Energy, vol. 33, pp. 4235-4246, 2008.
[13] A. Ariel, "Delphi forecast of the dry bulk shipping industry in the year 2000," Maritime Policy and Management, vol. 16, pp. 305-336, 1989.
[14] W. Ascher, Forecasting: An Appraisal for Policymakers and Planners: Johns Hopkins University Press, Baltimore, 1978.
[15] M. Asif, "Sustainable energy options for Pakistan," Renewable and Sustainable Energy Reviews, vol. 13, pp. 903-909, 2009.

257
[16] AWEA. (2010, March 8). American Wind Energy Association. Available: http://www.awea.org/
[17] E. R. Babbie, The Practice of Social Research, Twelfth ed. Belmont, CA: Wadsworth, 2007.
[18] D. Barker and D. J. H. Smith, "Technology foresight using roadmaps," Long Range Planning, vol. 28, pp. 21-28, 1995.
[19] H. S. Becker, "Scenarios: A tool of growing importance to policy analysts in government and industry," Technological Forecasting and Social Change, vol. 23, pp. 95-120, 1983.
[20] M. Bengisu and R. Nekhili, "Forecasting emerging technologies with the aid of science and technology databases," Technological Forecasting and Social Change, vol. 73, pp. 835-844, 2006.
[21] M. Bergey, et al. (2002), The U.S. Small Wind Turbine Industry Roadmap. American Wind Energy Association (AWEA).
[22] C. Bezold, "Lessons from using scenarios for strategic foresight," Technological Forecasting and Social Change, vol. 77, pp. 1513-1518, 2010.
[23] R. Bijl, "Delphi in a future scenario study on mental health and mental health care," Futures vol. 24, pp. 232-250, 1992.
[24] R. Biloslavo and S. Dolinek, "Scenario planning for climate strategies development by integrating group Delphi, AHP and dynamic fuzzy cognitive maps," in Portland International Center for Management of Engineering and Technology (PICMET), Cape Town, South Africa, 2008, pp. 1103-1111.
[25] P. Bishop, A. Hines, and T. Collins, "The current state of scenario development: an overview of techniques," Foresight, vol. 9, pp. 5-25, 2007.
[26] K. Blind, K. Cuhls, and H. Grupp, "Personal attitudes in the assessment of the future of science and technology: A factor analysis approach," Technological Forecasting and Social Change, vol. 68, pp. 131-149, 2001.
[27] H. Blomgren, P. Jonsson, and F. Lagergren, "Getting back to scenario planning: strategic action in the future of energy Europe," in 8th International Conference on the European Energy Market (EEM), Zagreb, Croatia, 2011, pp. 792-801.
[28] F. Bolger, et al., "Does the Delphi process lead to increased accuracy in group-based judgmental forecasts or does it simply induce consensus amongst judgmental forecasters?," Technological Forecasting and Social Change, vol. 78, pp. 1671-1680, 2011.
[29] L. Börjeson, et al., "Scenario types and techniques: Towards a user's guide," Futures, vol. 38, pp. 723-739, 2006.
[30] R. Bradfield, et al., "The origins and evolution of scenario techniques in long range business planning," Futures, vol. 37, pp. 795-812, 2005.
[31] O. H. Bray and M. L. Garcia, "Technology roadmapping: the integration of strategic and technology planning for competitiveness," in Portland
258
International Center for Management of Engineering and Technology (PICMET), Portland, OR, USA, 1997, pp. 25-28.
[32] S. Breiner, K. Cuhls, and H. Grupp, "Technology foresight using a Delphi approach: A Japanese German study," R&D Management, vol. 24, pp. 141-153, 1994.
[33] K. Brockhoff, "The Performance of Forecasting Groups in Computer Dialogue and Face to Face Discussions," in The Delphi Method: Techniques and Applications, H. A. Linstone and M. Turoff, Eds., Reading, MA: Addison-Wesley, 1975.
[34] D. Browne, B. O’Regan, and R. Moles, "Use of ecological footprinting to explore alternative domestic energy and electricity policy scenarios in an Irish city-region," Energy Policy, vol. 37, pp. 2205-2213, 2009.
[35] S. Bueno and J. L. Salmeron, "Benchmarking main activation functions in fuzzy cognitive maps," Expert Systems with Applications, vol. 36, pp. 5221-5229, 2009.
[36] G. Burt, "Why are we surprised at surprises? Integrating disruption theory and system analysis with the scenario methodology to help identify disruptions and discontinuities," Technological Forecasting and Social Change, vol. 74, pp. 731-749, 2007.
[37] G. Burt, "Revisiting and extending our understanding of Pierre Wack's the gentle art of re-perceiving," Technological Forecasting and Social Change, vol. 77, pp. 1476-1484, 2010.
[38] G. Burt and K. van der Heijden, "First steps: towards purposeful activities in scenario thinking and future studies," Futures, vol. 35, pp. 1011-1026, 2003.
[39] G. Cairns, et al., "Enhancing foresight between multiple agencies: Issues in the use of scenario thinking to overcome fragmentation," Futures, vol. 38, pp. 1010-1025, 2006.
[40] C. F. Camerer and E. J. Johnson, "The process-performance paradox in expert judgment," in Toward a General Theory of Expertise: Prospects and Limits, K. A. Ericsson and J. Smith, Eds., First ed.: Cambridge University Press, Cambridge 1991, pp. 195-217.
[41] CEC. (2007), Renewable Energy Road Map - Renewable Energies in the 21st Century: Building a more Sustainable Future. Commission of the European Communities, Brussels.
[42] M. S. Celiktas and G. Kocar, "From potential forecast to foresight of Turkey's renewable energy with Delphi approach," Energy, vol. 35, pp. 1973-1980, 2010.
[43] W. W. Chaffin and W. K. Talley, "Individual stability in Delphi studies," Technological Forecasting and Social Change, vol. 16, pp. 67-73, 1980.
[44] A. K. Chakravarti, et al., "Modified Delphi methodology for technology forecasting case study of electronics and information technology in India," Technological Forecasting and Social Change, vol. 58, pp. 155-165, 1998.

259
[45] J. C. Chambers, S. K. Mullick, and D. D. Smith, "How to choose the right forecasting technique," Harvard Business Review, pp. 45-74, July-August 1971.
[46] H. Chandler, et al. (2009), Wind Energy Technology Roadmap, International Energy Agency (IEA). Available: www.iea.org/G8/docs/Roadmaps_g8july09.pdf (March 23, 2011).
[47] A. M. Chaudhry, R. Raza, and S. A. Hayat, "Renewable energy technologies in Pakistan: Prospects and challenges," Renewable and Sustainable Energy Reviews, vol. 13, pp. 1657-1662, 2009.
[48] T.-Y. Chen, et al., "Renewable energy technology portfolio planning with scenario analysis: A case study for Taiwan," Energy Policy, vol. 37, pp. 2900-2906, 2009.
[49] T. Chermack, "Improving decision-making with scenario planning," Futures, vol. 36, pp. 295-309, 2004.
[50] T. J. Chermack, S. A. Lynham, and W. E. A. Ruona, "A review of scenario planning literature," Futures Research Quarterly, vol. 17, pp. 7-31, 2001.
[51] T. J. Chermack, S. A. Lynham, and L. van der Merwe, "Exploring the relationship between scenario planning and perceptions of learning organization characteristics," Futures, vol. 38, pp. 767-777, 2006.
[52] CIA, The World Factbook. Washington, DC: Central Intelligence Agency, Office of Public Affairs, 2011.
[53] J. F. Coates, "In defense of Delphi: A review of Delphi assessment, expert opinion, forecasting, and group process by H. Sackman," Technological Forecasting and Social Change, vol. 7, pp. 193-194, 1975.
[54] J. F. Coates, "The future of foresight-A US perspective," Technological Forecasting and Social Change, vol. 77, pp. 1428-1437, 2010.
[55] M. Contaldi, F. Gracceva, and A. Mattucci, "Hydrogen perspectives in Italy: Analysis of possible deployment scenarios," International Journal of Hydrogen Energy, vol. 33, pp. 1630-1642, 2008.
[56] R. M. Cooke, Experts in Uncertainty: Opinion and Subjective Probability in Science. New York, NY: Oxford University Press, 1991.
[57] R. M. Cooke and L. H. J. Goossens. (2000), Procedures Guide for Structured Expert Judgement. Available: <http://ie.jrc.ec.europa.eu/publications/scientific_publications/2005/EUR21772EN.pdf> (May 12, 2011).
[58] R. G. Coyle and G. R. McGlone, "Projecting scenarios for South-east Asia and the South-west Pacific," Futures, vol. 27, pp. 65-79, 1995.
[59] Craiger J., et al., "Modeling Organizational Behavior with Fuzzy Cognitive Maps," International Journal of Computational Intelligence and Organizations, vol. 1, pp. 120-123, 1996.
[60] K. Cuhls and T. Kuwahara, Outlook of Japanese and German Future Technology: Comparing Technology Forecast Surveys. Heidelberg: Phisica-Verlag, 1994.

260
[61] A. Curry, "From foresight to insight: using scenarios well," Journal of Futures Studies, vol. 13, pp. 119-122, February 2009.
[62] A. Curry and W. Schultz, "Roads less travelled: different methods, different futures," Journal of Futures Studies, vol. 13, pp. 35-60, 2009.
[63] K. Czaplicka-Kolarz, K. Stanczyk, and K. Kapusta, "Technology foresight for a vision of energy sector development in Poland till 2030. Delphi survey as an element of technology foresighting," Technological Forecasting and Social Change, vol. 76, pp. 327-338, 2009.
[64] T. U. Daim, "Technology evaluation and acquisition strategies and their implications in the U.S. electronics manufacturing industry," PhD Dissertation, System Science: Engineering and Technology Management, Portland State University, Portland, OR, 1998.
[65] T. U. Daim, M. Amer, and R. Brenden, "Technology roadmapping for wind energy: case of the Pacific Northwest," Journal of Cleaner Production, vol. 20, pp. 27-37, 2012.
[66] T. U. Daim, et al., "Forecasting emerging technologies: Use of bibliometrics and patent analysis," Technological Forecasting and Social Change, vol. 73, pp. 981-1012, 2006.
[67] J. S. Dajani, M. Z. Sincoff, and W. K. Talley, "Stability and agreement criteria for the termination of Delphi studies," Technological Forecasting and Social Change, vol. 13, pp. 83-90, 1979.
[68] J. Dator, "The futures of cultures and cultures of the future," in Perspectives on Cross Cultural Psychology, T. Marsella and T. T. Ciborowski, R., Eds., ed. New York, NY: Academic Press, 1979.
[69] L. de Brabandere and A. Iny, "Scenarios and creativity: Thinking in new boxes," Technological Forecasting and Social Change, vol. 77, pp. 1506-1512, 2010.
[70] C. A. de Kluyver, "Bottom-up sales forecasting through scenario analysis," Industrial Marketing Management, vol. 9, pp. 167-170, 1980.
[71] B. de Laat, "Conditions for effectiveness of roadmapping – a cross-sectoral analysis of 80 different roadmapping exercises," in EU-US Seminar: New Technology Foresight, Forecasting and Assessment, Seville, Spain, 2004.
[72] A. L. Delbecq, A. H. Van de Ven, and D. H. Gustafson, Group Techniques for Program Planning. A Guide to Nominal Group and Delphi Processes. Glenview, IL: Scott, Foresman and Company, 1975.
[73] J. A. Dewar, The Importance of “wild card” Scenarios. Santa Monica, CA: RAND Carporation, 1993.
[74] J. A. Dewar, Assumption-Based Planning: A Tool for Reducing Avoidable Surprises: Cambridge University Press, 2002.
[75] W. Di, N. Rui, and S. Hai-ying, "Scenario analysis of China's primary energy demand and CO2 emissions based on IPAT model," Energy Procedia, vol. 5, pp. 365-369, 2011.

261
[76] J. Dickerson and R. N. Kostoff, "Virtual Worlds as Fuzzy Dynamical Systems," in Technology for Multimedia, B. Sheu, Ed., New York: IEEE Press, 1996.
[77] DOE. (2008), 20% Wind Energy by 2030: Increasing Wind Energy’s Contribution to U.S. Electricity Supply, U.S. Department of Energy. DOE/GO-102008-2567, 1-228. Available: http://www.nrel.gov/docs/fy08osti/41869.pdf (May 10, 2010).
[78] P. Durance, "Reciprocal influences in future thinking between Europe and the USA," Technological Forecasting and Social Change, vol. 77, pp. 1469-1475, 2010.
[79] P. Durance and M. Godet, "Scenario building: Uses and abuses," Technological Forecasting and Social Change, vol. 77, pp. 1488-1492, 2010.
[80] EIA. (2010), Annual Energy Outlook 2011, Energy Information Administration, U.S. Department of Energy. Available: <http://www.eia.doe.gov/oiaf/aeo/electricity_generation.html> (March 12, 2012).
[81] EIA. (2011), International Energy Outlook 2011, Energy Information Administration, U.S. Department of Energy. Available: www.eia.gov/ieo/pdf/0484(2011).pdf (March 30, 2011).
[82] D. Elliott. (2007), Wind Resource Assessment and Mapping for Afghanistan and Pakistan, SARI-Energy, National Renewable Energy Laboratory. Available: http://www.nrel.gov/international/pdfs/afg_pak_wind_june07.pdf (August 14, 2011).
[83] S. Enzer, "INTERAX—An interactive model for studying future business environments: Part I," Technological Forecasting and Social Change, vol. 17, pp. 141-159, 1980.
[84] S. Enzer, "Exploring long-term business climates and strategies with interax," Futures, vol. 13, pp. 468-482, 1981.
[85] EREC. (2008), Renewable Energy Technology Roadmap 20% by 2020, European Renewable Energy Council, The European Commission. Available: http://www.erec.org/fileadmin/erec_docs/Documents/Publications/Renewable_Energy_Technology_Roadmap.pdf (March 13, 2011).
[86] R. C. Erffmeyer, E. S. Erffmeyer, and I. M. Lane, "The Delphi technique: An empirical evaluation of the optimal number of rounds," Group and Organization Management, vol. 11, pp. 120-128, 1986.
[87] ERI. (2011), China Wind Energy Development Roadmap 2050, Energy Research Institute, China and International Energy Agency (IEA). Available: http://www.ens.dk/da-DK/Politik/CNREC/bibliotek/Documents/Technology%20Roadmap%20china%20wind.pdf (November 13, 2012).

262
[88] V. Estivill-Castro, "Why so many clustering algorithms: a position paper," ACM SIGKDD Explorations Newsletter, vol. 4, pp. 65-75, 2002.
[89] EWEA. (2010), Wind Barriers: Administrative and Grid Access Barriers to Wind Power, European Wind Energy Association. 1-147. Available: http://www.windbarriers.eu/fileadmin/WB_docs/documents/WindBarriers_report.pdf (July 15, 2011).
[90] J. E. Fleming, "The future of U.S. government–corporate relations," Long Range Planning, vol. 12, pp. 20-26, 1979.
[91] D. N. Ford and J. D. Sterman, "Expert knowledge elicitation to improve formal and mental models," System Dynamics Review, vol. 14, pp. 309-340, 1998.
[92] M. J. Foster, "Scenario planning for small businesses," Long Range Planning, vol. 26, pp. 123-129, 1993.
[93] K. Fukuda, et al., "The progress of the strategic technology roadmap of METI (Ministry of Economy, Trade and Industry of Japan): Practical business cases and sustainable manufacturing perspective," in Portland International Center for Management of Engineering and Technology (PICMET), Cape Town, South Africa, 2008, pp. 2102-2114.
[94] J. Galtung, Essays in Peace Research vol. 1–6. Christian Ejlers, Copenhagen, 1998.
[95] L. Garcia, M. and H. Bray, O., "Fundamentals of technology roadmapping," Strategic Business Development Department, Sandia National Laboratories, 1997.
[96] J. Gausemeier, A. Fink, and O. Schlake, "Scenario management: An approach to develop future potentials," Technological Forecasting and Social Change, vol. 59, pp. 111-130, 1998.
[97] M. R. Geist, "Using the Delphi method to engage stakeholders: A comparison of two studies," Evaluation and Program Planning, vol. 33, pp. 147-154, 2010.
[98] N. Gerdsri, "An Analytical Approach to Building a Technology Development Envelope (TDE) for Roadmapping of Emerging Technologies" PhD Dissertation, Systems Science: Engineering and Technology Management, Portland State University, Portland, OR, 2004.
[99] N. Gerdsri and R. S. Vatananan, "Dynamics of technology roadmapping (TRM) implementation," in Portland International Center for Management of Engineering and Technology, Portland, OR, USA, 2007, pp. 1577-1583.
[100] N. Gerdsri, R. S. Vatananan, and S. Dansamasatid, "Dealing with the dynamics of technology roadmapping implementation: A case study," Technological Forecasting and Social Change, vol. 76, pp. 50-60, 2009.
[101] P. Gerdsri, "A systematic approach to developing national technology policy and strategy for emerging technologies," PhD Dissertation, Engineering and Technology Management (ETM) Department, Portland State University, Portland, OR, 2009.

263
[102] P. Gerdsri and D. Kocaoglu, "A systematic approach to developing national technology policy and strategy for emerging technologies: A case study of nanotechnology for Thailand's agriculture industry," in Portland International Center for Management of Engineering and Technology (PICMET), Portland, OR, USA, 2009, pp. 447-461.
[103] R. Ghanadan and J. G. Koomey, "Using energy scenarios to explore alternative energy pathways in California," Energy Policy, vol. 33, pp. 1117-1142, 2005.
[104] A. Ghayur, "Role of satellites for renewable energy generation technologies in urban regional and urban settings," in International Conference on Advances in Space Technologies (ICAST), Islamabad, Pakistan, 2006, pp. 157-161.
[105] T. Gnatzy, et al., "Validating an innovative real-time Delphi approach - A methodological comparison between real-time and conventional Delphi studies," Technological Forecasting and Social Change, vol. 78, pp. 1681-1694, 2011.
[106] M. Godet, "The art of scenarios and strategic planning: tools and pitfalls," Technological Forecasting and Social Change, vol. 65, pp. 3-22, 2000.
[107] M. Godet, "Forefront: how to be rigorous with scenario planning," Foresight, vol. 2, pp. 5-9, 2000.
[108] J. A. Gómez-Limón, A. Gómez-Ramos, and G. Sanchez Fernandez, "Foresight analysis of agricultural sector at regional level," Futures, vol. 41, pp. 313-324, 2009.
[109] C. Goodier, et al., "Causal mapping and scenario building with multiple organisations," Futures, vol. 42, pp. 219-229, 2010.
[110] GoP. (2006), Policy for Development of Renewable Energy for Power Generation, Government of Pakistan. Available: http://www.aedb.org/.
[111] GoP. (2007), Pakistan Economic Survey 2006-2007, Government of Pakistan.
[112] GoP. (2009), Pakistan Energy Year Book, Hydrocarbon Development Institute of Pakistan, Ministry of Petroleum and Natural Resources, Islamabad, Pakistan.
[113] GoP. (2011, September 13,). Official website Government of Pakistan. Available: www.pakistan.gov.pk
[114] T. Gordon and A. Pease, " RT Delphi: An efficient, "round-less" almost real time Delphi method " Technological Forecasting and Social Change, vol. 73, pp. 321-333, 2006.
[115] T. J. Gordon. (1994), Trend Impact Analysis. Futures Research Methodology, The Millennium Project, 1-19. Available: http://test.scripts.psu.edu/students/d/j/djz5014/nc2if/08-Trend%20Impact%20Analysis.pdf (March 15, 2011).
[116] T. J. Gordon, "Energy forecasts using a “Roundless” approach to running a Delphi study," Foresight vol. 9, pp. 27-35, 2007.

264
[117] GOS. (2008), Powering Our Lives: Sustainable Energy Management and the Built Environment. Government Office for Science (GOS), UK Government’s Foresight Project. Available: http://www.bis.gov.uk/assets/foresight/docs/energy/energy%20final/futures_report.pdf (May 15, 2012).
[118] B. Graham, G. Regehr, and J. G. Wright, "Delphi as a method to establish consensus for diagnostic criteria," Journal of Clinical Epidemiology, vol. 56, pp. 1150-1156, 2003.
[119] R. Gramlich and D. Brady, "Getting smart about wind and demand response," Wind Systems, pp. 28-35, July 2009.
[120] P. Groenveld, "Roadmapping integrates business and technology," Research-Technology Management, vol. 50, pp. 49-58, Nov-Dec 2007.
[121] A. Grunwald, "Energy futures: Diversity and the need for assessment," Futures, vol. 43, pp. 820-830, 2011.
[122] U. G. Gupta and R. E. Clarke, "Theory and applications of the Delphi technique: A bibliography (1975-1994)," Technological Forecasting and Social Change, vol. 53, pp. 185-211, 1996.
[123] R. R. Harmon and K. R. Cowan, "A multiple perspectives view of the market case for green energy," Technological Forecasting and Social Change, vol. 76, pp. 204-213, 2009.
[124] K. R. Harrigan, "An application of clustering for strategic group analysis," Strategic Management Journal, vol. 6, pp. 55-73, 2006.
[125] N. R. Henderson, "Managing moderator stress: Take a deep breath. You can do this!," Marketing Research, vol. 21, pp. 28-29, 2009.
[126] T. T. Herbert and E. B. Yost, "A comparison of decision quality under nominal and interacting consensus group formats: The case of the structured problem," Decision Sciences, vol. 10, pp. 358-370, 1979.
[127] K. Q. Hill and J. Fowles, "The methodological worth of the Delphi forecasting technique," Technological Forecasting and Social Change, vol. 7, pp. 179-192, 1975.
[128] E. Hiltunen, "Was it a wild card or just our blindness to gradual change," Journal of Futures Studies, vol. 11, pp. 61-74, 2006.
[129] E. Hiltunen, "Scenarios: process and outcome," Journal of Futures Studies, vol. 13, pp. 151-152, February 2009.
[130] S. Hossain and L. Brooks, "Fuzzy cognitive map modelling educational software adoption," Computers & Education, vol. 51, pp. 1569-1588, 2008.
[131] F. V. Hulle, et al. (2009), Integrating Wind. European Wind Energy Association, 1-102. Available: http://www.ewea.org/fileadmin/ewea_documents/documents/publications/reports/Final_Report.pdf (Jan 22, 2011).
[132] F. V. Hulle, et al. (2010), Powering Europe: Wind Energy and the Electricity Grid. European Wind Energy Association, 1-180. Available: http://www.ewea.org/fileadmin/ewea_documents/documents/publications/reports/Grids_Report_2010.pdf (Nov 25, 2011).

265
[133] S. M. Hurtado, "Modeling of operative risk using fuzzy expert system," in Fuzzy Cognitive Maps: Advances in Theory, Methodologies, Tools and Applications, M. Glykas, Ed., Berlin Heidelberg: Springer-Verlag, 2010, pp. 135-160.
[134] W. R. Huss, "A move toward sceanrio analysis," International Journal of Forecasting, vol. 4, pp. 377-388, 1988.
[135] W. R. Huss and E. J. Honton, "Alternative methods for developing business scenarios," Technological Forecasting and Social Change, vol. 31, pp. 219-238, 1987.
[136] W. R. Huss and E. J. Honton, "Scenario planning--What style should you use?," Long Range Planning, vol. 20, pp. 21-29, 1987.
[137] C. Hussler, P. Muller, and P. Rondé, "Is diversity in Delphi panelist groups useful? Evidence from a French forecasting exercise on the future of nuclear energy," Technological Forecasting and Social Change, vol. 78, pp. 1642-1653, 2011.
[138] R. Huth, et al., "Classifications of atmospheric circulation patterns," Annals of the New York Academy of Sciences, vol. 1146, pp. 105-152, 2008.
[139] I. Scrase and G. MacKerron, Energy for the Future: A New Agenda. New York: Palgrave Macmillan, 2009.
[140] IEA. (2009), Key World Energy Statistics, International Energy Agency. Available: http://www.iea.org/textbase/nppdf/free/2009/key_stats_2009.pdf (May 25, 2011).
[141] S. Inayatullah, "Reductionism or layered complexity? The futures of futures studies," Futures, vol. 34, pp. 295-302, 2002.
[142] S. Inayatullah, "Six pillars: futures thinking for transforming," Foresight, vol. 10, pp. 4-21, February 2008.
[143] S. Inayatullah, "Questioning scenarios," Journal of Futures Studies, vol. 13, pp. 75-80, February 2009.
[144] Industry. Canada, Evaluating Technology Roadmaps — A Framework for Monitoring and Measuring Results, 2007.
[145] Industry Canada, Technology Roadmapping in Canada: A Development Guide, 2007.
[146] S. Iniyan and K. Sumathy, "An optimal renewable energy model for various end-uses," Energy, vol. 25, pp. 563-575, 2000.
[147] S. Iniyan and K. Sumathy, "The application of a Delphi technique in the linear programming optimization of future renewable energy options for India," Biomass and Bioenergy, vol. 24, pp. 39-50, 2003.
[148] R. Islam, "Modification of the nominal group technique by using the analytic hierarchy process," in Multiple Criteria Decision Making in the New Millennium. vol. 504, M. Köksalan and S. Zionts, Eds., Heidelberg: Springer-Verlag, 2001, pp. 294-303.
[149] N. Jairath and J. Weinstein, "The Delphi methodology: a useful administrative approach," Canadian Journal of Nursing Administration, vol. 7, pp. 29-42, 1994.
266
[150] M. Jefferson, "Sustainable energy development: Performance and prospects," Renewable Energy, vol. 31, pp. 571-582, 2006.
[151] L. Jenkins, "Selecting a variety of futures for scenario development," Technological Forecasting and Social Change, vol. 55, pp. 15-20, 1997.
[152] A. Jetter and W. Schweinfort, "Building scenarios with Fuzzy Cognitive Maps: An exploratory study of solar energy," Futures, vol. 43, pp. 52-66, 2011.
[153] A. J. Jetter, "Educating the guess: strategies, concepts, and tools for the fuzzy front end of product development," in Portland International Center for Management of Engineering and Technology (PICMET), Portland, OR, USA, 2003, pp. 261-273.
[154] A. J. Jetter, "Codification – knowledge maps," in Knowledge Integration: The Practice of Knowledge Management in Small and Medium Enterprises, A.J. Jetter, J. Kraaijenbrink, H.-H. Schroder, and F. Wijnhoven, Eds., First ed. Heidelberg, Germany: Physica-Verlag, 2006, pp. 77-90.
[155] A. J. Jetter, "Elicitation-extracting knowledge from experts," in Knowledge Integration: The Practice of Knowledge Management in Small and Medium Enterprises, A.J. Jetter, J. Kraaijenbrink, H.-H. Schroder, and F. Wijnhoven, Eds., First ed. Heidelberg, Germany: Physica-Verlag, 2006, pp. 65-76.
[156] A. J. Jetter, "Fuzzy Cognitive Maps for Engineering and Technology Management: What Works in Practice?," in Portland International Center for Management of Engineering and Technology (PICMET), Istanbul, Turkey, 2006, pp. 498-512.
[157] J. Jönsson, et al., "Excess heat from kraft pulp mills: Trade-offs between internal and external use in the case of Sweden—Part 2: Results for future energy market scenarios," Energy Policy, vol. 36, pp. 4186-4197, 2008.
[158] C. F. Joseph, "Scenario planning" Technological Forecasting and Social Change, vol. 65, pp. 115-123, 2000.
[159] K. R. Brenden, et al., "Wind energy roadmap," in Portland International Center for Management of Engineering and Technology (PICMET), Portland, OR, USA, 2009, pp. 2548-2562.
[160] H. Kahn and A. J. Wiener, The Year 2000: A Framework for Speculation on the Next Thirty-Three Years: The Macmillan, New York, 1967.
[161] Y. Kajikawa, et al., "Tracking emerging technologies in energy research: Toward a roadmap for sustainable energy," Technological Forecasting and Social Change, vol. 75, pp. 771-782, 2008.
[162] V. Kalashnikov, R. Gulidov, and A. Ognev, "Energy sector of the Russian Far East: Current status and scenarios for the future," Energy Policy, vol. 39, pp. 6760-6780, 2011.
[163] W. B. V. Kandasamy and F. Smarandache, Fuzzy Cognitive Maps and Neutrosophic Cognitive Maps: Indian Institute of Technology, Madras, Chennai, India, 2003.

267
[164] M. R. Kastein, et al., "Delphi, the issue of reliability : A qualitative Delphi study in primary health care in the Netherlands," Technological Forecasting and Social Change, vol. 44, pp. 315-323, 1993.
[165] R. L. Keeney and D. von Winterfeldt, "On the uses of expert judgment on complex technical problems," IEEE Transactions on Engineering Management, vol. 36, pp. 83-86, 1989.
[166] D. Keles, D. Möst, and W. Fichtner, "The development of the German energy market until 2030—A critical survey of selected scenarios," Energy Policy, vol. 39, pp. 812-825, 2011.
[167] S. M. Keough and K. J. Shanahan, "Scenario planning: toward a more complete model for practice," Advances in Developing Human Resources, vol. 10, pp. 166-178, 2008.
[168] D. J. Ketchen and C. L. Shook, "The application of cluster analysis in strategic management research: an analysis and critique," Strategic Management Journal, vol. 17, pp. 441-458, 1996.
[169] N. Khattak, et al., "Identification and removal of barriers for renewable energy technologies in Pakistan," in International Conference on Emerging Technologies (ICET), 2006, pp. 397-402.
[170] K. Kok and H. van Delden, "Combining two approaches of integrated scenario development to combat desertification in the Guadalentin watershed, Spain," Environment and Planning B: Planning and Design vol. 36, pp. 49-66, 2009.
[171] B. Kosko, "Fuzzy cognitive maps," International Journal of Man-Machine Studies, pp. 65-75, 1986.
[172] B. Kosko, Fuzzy Engineering: Prentice-Hall Inc., New Jersey, 1997. [173] R. N. Kostoff, R. Boylan, and G. R. Simons, "Disruptive technology
roadmaps," Technological Forecasting and Social Change, vol. 71, pp. 141-159, 2004.
[174] R. N. Kostoff and R. R. Schaller, "Science and technology roadmaps," IEEE Transactions on Engineering Management, vol. 48, pp. 132-143, 2001.
[175] W. Krewitt, et al., "The 2°C scenario — A sustainable world energy perspective," Energy Policy, vol. 35, pp. 4969-4980, 2007.
[176] A.-M. Lamb, T. U. Daim, and S. Leavengood, "Technology roadmap: Wood/bio-energy pellet "renewable energy"," in Portland International Center for Management of Engineering and Technology (PICMET), Portland, OR, USA, 2009, pp. 2530-2547.
[177] J. Landeta, "Current validity of the Delphi method in social sciences," Technological Forecasting and Social Change, vol. 73, pp. 467-482, 2006.
[178] J. C. Larreche and R. Moinpour, "Managerial judgment in marketing: The concept of expertise," Journal of Marketing Research, vol. 20, pp. 110-121, 1983.

268
[179] K. C. Lee, et al., "Fuzzy cognitive map approach to web-mining inference amplification," Expert Systems with Applications, vol. 22, pp. 197–211, 2002.
[180] S. Lee and Y. Park, "Customization of technology roadmaps according to roadmapping purposes: Overall process and detailed modules," Technological Forecasting and Social Change, vol. 72, pp. 567-583, 2005.
[181] S. K. Lee, G. Mogi, and J. W. Kim, "Energy technology roadmap for the next 10 years: The case of Korea," Energy Policy, vol. 37, pp. 588-596, 2009.
[182] R. R. Levary and D. Han, "Choosing a technological forecasting method," Industrial Management, vol. 37, pp. 14-18, Jan-Feb 1995.
[183] D. Lew, et al., "How do wind and solar power affect grid operations: the western wind and solar integration study," in The 8th International Workshop on Large Scale Integration of Wind Power and on Transmission Networks for Offshore Wind Farms, Bremen, Germany, 2009, pp. 1-7.
[184] D. Lew and R. Piwko. (2010), Western Wind and Solar Integration Study National Renewable Energy Laboratory (NREL) and GE Energy.
[185] C. A. Lindeman, "Delphi survey of priorities in clinical nursing research," Nursing Research, vol. 24, pp. 434-441, 1975.
[186] R. E. Linneman and H. E. Klein, "The use of multiple scenarios by U.S. industrial companies," Long Range Planning, vol. 12, pp. 83-90, 1979.
[187] R. E. Linneman and H. E. Klein, "The use of multiple scenarios by U.S. industrial companies: A comparison study, 1977-1981," Long Range Planning, vol. 16, pp. 94-101, 1983.
[188] H. A. Linstone and M. Turoff, The Delphi Method: Techniques and Applications. Reading, MA: Addison-Wesley, 1975.
[189] H. A. Linstone and M. Turoff, "Delphi: A brief look backward and forward," Technological Forecasting and Social Change, vol. 78, pp. 1712-1719, 2011.
[190] F. Lizaso and G. Reger, "Linking roadmapping and scenarios as an approach for strategic technology planning," International Journal of Technology Intelligence and Planning, vol. 1, pp. 68-86, 2004.
[191] C. A. R. MacNulty, "Scenario development for corporate planning," Futures, vol. 9, pp. 128-138, 1977.
[192] R. Madlener, K. Kowalski, and S. Stagl, "New ways for the integrated appraisal of national energy scenarios: The case of renewable energy use in Austria," Energy Policy, vol. 35, pp. 6060-6074, 2007.
[193] A. Makkawi, et al., "Analysis and inter-comparison of energy yield of wind turbines in Pakistan using detailed hourly and per minute recorded data sets," Energy Conversion and Management, vol. 50, pp. 2340-2350, 2009.
[194] P. Malaska, et al., "Scenarios in Europe--Who uses them and why?," Long Range Planning, vol. 17, pp. 45-49, 1984.

269
[195] R. Marler and J. Arora, "The weighted sum method for multi-objective optimization: new insights," Structural and Multidisciplinary Optimization, vol. 41, pp. 853-862, 2010.
[196] A. Martelli, "Scenario building and scenario planning: state of the art and prospects of evolution," Futures Research Quarterly, vol. 17, pp. 57-70, 2001.
[197] B. R. Martin, "The origins of the concept of `foresight' in science and technology: An insider's perspective," Technological Forecasting and Social Change, vol. 77, pp. 1438-1447, 2010.
[198] J. P. Martino, "The consistency of Delphi forecasts," The Futurist, vol. 4, pp. 63-64, 1970.
[199] J. P. Martino, Technological Forecasting for Decision Making, Second ed. New York: North-Holland, 1983.
[200] J. P. Martino, "A review of selected recent advances in technological forecasting," Technological Forecasting and Social Change, vol. 70, pp. 719-733, 2003.
[201] N. H. Mateou and A. S. Andreou, "A framework for developing intelligent decision support systems using evolutionary fuzzy cognitive maps," Journal of Intelligent and Fuzzy Systems, vol. 19, pp. 151-170, 2008.
[202] K. L. McGraw and K. Harbison-Briggs, "Knowledge Acquisition: Principles and Guidelines," New Jersey: Prentice-Hall International, 1989.
[203] T. R. McVicar, et al., "Wind speed climatology and trends for Australia, 1975–2006: Capturing the stilling phenomenon and comparison with near-surface reanalysis output," Geophysical Research Letters, vol. 35, pp. 1-6, 2008.
[204] S. Mendonça, et al., "Wild cards, weak signals and organisational improvisation," Futures, vol. 36, pp. 201-218, 2004.
[205] S. Mendonça, et al., "Venturing into the wilderness: preparing for wild cards in the civil aircraft and asset-management industries," Long Range Planning, vol. 42, pp. 23-41, 2009.
[206] D. Mercer, "Robust strategies in a day," Management Decision, vol. 35, pp. 219-223, 1997.
[207] M. A. Meyer and J. M. Booker, Eliciting and Analyzing Expert Judgment: A Practical Guide. London, UK: Academic Press Limited, 1991.
[208] M. A. Meyer and J. M. Booker, "Selecting and motivating the experts," in Eliciting and Analyzing Expert Judgment: A Practical Guide, First ed. London, UK: Academic Press Limited, 1991, pp. 85-98.
[209] D. Mietzner and G. Reger, "Advantages and disadvantages of scenario approaches for strategic foresight," International Journal of Technology Intelligence and Planning, vol. 1, pp. 220 - 239, 2005.
[210] I. Miles, "The development of technology foresight: A review," Technological Forecasting and Social Change, vol. 77, pp. 1448-1456, 2010.

270
[211] I. Miles and M. Keenan. (2002), Practical Guide to Regional Foresight in the United Kingdom. Directorate-General for Research, European Commission. Available: http://cordis.europa.eu/foresight/cgrf.htm (March 14, 2011).
[212] S. M. Millett and E. J. Honton, A Manager's Guide to Technology Forecasting and Strategy Analysis Methods. Columbus, Ohio: Battelle Press, 1991.
[213] I. A. Mirza, N. A. Khan, and N. Memon, "Development of benchmark wind speed for Gharo and Jhimpir, Pakistan," Renewable Energy, vol. 35, pp. 576–582, 2010.
[214] U. K. Mirza, et al., "Identifying and addressing barriers to renewable energy development in Pakistan," Renewable and Sustainable Energy Reviews, vol. 13, pp. 927-931, 2009.
[215] U. K. Mirza, N. Ahmad, and T. Majeed, "An overview of biomass energy utilization in Pakistan," Renewable and Sustainable Energy Reviews, vol. 12, pp. 1988-1996, 2008.
[216] U. K. Mirza, et al., "Wind energy development in Pakistan," Renewable and Sustainable Energy Reviews, vol. 11, pp. 2179-2190, 2007.
[217] U. K. Mirza, M. M. Maroto-Valer, and N. Ahmad, "Status and outlook of solar energy use in Pakistan," Renewable and Sustainable Energy Reviews, vol. 7, pp. 501-514, 2003.
[218] V. W. Mitchell, " The Delphi technique: An exposition and application," Technology Analysis and Strategic Management, vol. 3, pp. 333-358, 1991.
[219] J. M. Morales, R. Mínguez, and A. J. Conejo, "A methodology to generate statistically dependent wind speed scenarios," Applied Energy, vol. 87, pp. 843-855, 2010.
[220] D. L. Morgan and R. A. Krueger, "When to use focus groups and why," in Successful Focus Groups: Advancing the State of the Art, D. L. Morgan, Ed., Thousand Oaks, CA, US: Sage Publications, Inc, 1993, pp. 3-19.
[221] J. L. Mumpower and T. R. Stewart, "Expert judgement and expert disagreement," Thinking and Reasoning, vol. 2, pp. 191-211, 1996.
[222] T. Muneer and M. Asif, "Prospects for secure and sustainable electricity supply for Pakistan," Renewable and Sustainable Energy Reviews, vol. 11, pp. 654-671, 2007.
[223] M. Murphy, et al., "Consensus development methods, and their use in clinical guideline development," Health Technology Assessment, vol. 2, 1998.
[224] A. Nauda and D. L. Hall, "Strategic technology planning--Developing roadmaps for competitive advantage," in Portland International Center for Management of Engineering and Technology (PICMET), Portland, OR, USA, 1991, pp. 745-748.

271
[225] K. Q. Nguyen, "Wind energy in Vietnam: Resource assessment, development status and future implications," Energy Policy, vol. 35, pp. 1405-1413, 2007.
[226] M. Nowack, J. Endrikat, and E. Guenther, "Review of Delphi-based scenario studies: Quality and design considerations," Technological Forecasting and Social Change, vol. 78, pp. 1603-1615, 2011.
[227] NRC. (2009), Wind Energy Technology Roadmap. Natural Resources Canada and Industry Canada.
[228] NREL. (2003), Solar Electric Power: U.S. Photovoltaic Industry Roadmap. National Renewable Energy Laboratory.
[229] NREL. (2010), Wind Map of Pakistan. National Renewable Energy Laboratory. Available: http://www.nrel.gov/wind/pdfs/final1-1-1pwr50pk.pdf (Nov 12, 2010).
[230] C. Okoli and S. D. Pawlowsk, "The Delphi method as a research tool: an example, design considerations and applications," Information and Management, vol. 42 pp. 15-29, 2004.
[231] U. Özesmi and S. L. Özesmi, "Ecological models based on people’s knowledge: a multi-step fuzzy cognitive mapping approach," Ecological Modelling, vol. 176, pp. 43-64, 2004.
[232] R. Parente and J. Anderson-Parente, "A case study of long-term Delphi accuracy," Technological Forecasting and Social Change, vol. 78, pp. 1705-1711, 2011.
[233] K. S. Park and S. H. Kim, "Fuzzy cognitive maps considering time relationships," International Journal of Human-Computer Studies, vol. 42, pp. 157-168, 1995.
[234] S. Pätäri, "Industry- and company-level factors influencing the development of the forest energy business -- insights from a Delphi study," Technological Forecasting and Social Change, vol. 77, pp. 94-109, 2010.
[235] PCRET. (2010, March 18, 2010). Pakistan Council of Renewable Energy Technologies. Available: http://www.pcret.gov.pk/
[236] K. Perusich, "Using fuzzy cognitive maps to identify multiple causes in troubleshooting systems," Integrated Computer-Aided Engineering, vol. 15, pp. 197-206, 2008.
[237] G. D. Peterson, G. S. Cumming, and S. R. Carpenter, "Scenario planning: A tool for conservation in an uncertain world," Conservation Biology, vol. 17, pp. 358-366, 2003.
[238] R. Phaal, "Technology roadmapping - A planning framework for evolution and revolution," Technological Forecasting and Social Change, vol. 71, pp. 5-26, 2004.
[239] R. Phaal, C. Farrukh, and D. Probert, "T-Plan the fast-start to technology roadmapping: planning your route to success," Institute for Manufacturing, University of Cambridge, 2001.
[240] R. Phaal, C. Farrukh, and D. Probert, "Customizing roadmapping," IEEE Engineering Management Review, vol. 32, pp. 80-91, 2004.

272
[241] R. Phaal, C. J. P. Farrukh, and D. R. Probert, "Characterisation of technology roadmaps: Purpose and format," in Portland International Center for Management of Engineering and Technology (PICMET), Portland, OR, USA, 2001, pp. 367-374.
[242] R. Phaal, C. J. P. Farrukh, and D. R. Probert, "Developing a technology roadmapping system," in Portland International Center for Management of Engineering and Technology (PICMET), Portland, OR, USA, 2005, pp. 99-111.
[243] R. Phaal, C. J. P. Farrukh, and D. R. Probert, "Strategic roadmapping: A workshop-based approach for identifying and exploring strategic issues and opportunities," Engineering Management Journal, vol. 19, pp. 3-12, 2007.
[244] R. Phaal, C. J. P. Farrukh, and D. R. Probert, "Visualising strategy: A classification of graphical roadmap forms," International Journal of Technology Management, vol. 47, pp. 286-305, 2009.
[245] R. Phaal and G. Muller, "Towards visual strategy an architectural framework for roadmapping," in Portland International Center for Management of Engineering and Technology (PICMET), Portland, OR, USA, 2007, pp. 1584-1592.
[246] R. Phaal and G. Muller, "An architectural framework for roadmapping: Towards visual strategy," Technological Forecasting and Social Change, vol. 76, pp. 39-49, Jan 2009.
[247] J. Pill, "The Delphi method: Substance, context, a critique and an annotated bibliography," Socio-Economic Planning Sciences, vol. 5, pp. 57-71, 1971.
[248] U. Pillkahn, "Technology intelligence: Basis for a smart business strategies," Futures Research Quarterly, vol. 21, pp. 5-17, 2005.
[249] U. Pillkahn, Using Trends and Scenarios as Tools for Strategy Development: Publicis Corporate Publishing, Erlangen, Germany, 2008.
[250] PMD. (2007), Wind Power Potential of Sindh, Pakistan Meteorogical Department.
[251] S. D. Pohekar and M. Ramachandran, "Application of multi-criteria decision making to sustainable energy planning - A review," Renewable and Sustainable Energy Reviews, vol. 8, pp. 365–381, 2004.
[252] D. F. Polit, Data Analysis and Statistics for Nursing Research, Second ed. New Jersey: Prentice Hall, 2009.
[253] A. L. Porter, et al., Forecasting and Management of Technology, First ed. New York: John Wiley & Sons Inc., 1991.
[254] T. J. B. M. Postma and F. Liebl, "How to improve scenario analysis as a strategic management tool?," Technological Forecasting and Social Change, vol. 72, pp. 161-173, 2005.
[255] C. Powell, "The Delphi technique: myths and realities," Journal of Advanced Nursing, vol. 41, pp. 376-382, 2003.
273
[256] D. R. Probert, C. J. P. Farrukh, and R. Phaal, "Technology roadmapping - Developing a practical approach for linking resources to strategic goals," Proceedings of the Institution of Mechanical Engineers - Part B: Journal of Engineering Manufacture, vol. 217, pp. 1183-1195, 2003.
[257] S. C. Pryor, R. J. Barthelmie, and J. T. Schoof, "Inter-annual variability of wind indices across Europe," Wind Energy, vol. 9, pp. 27-38, 2006.
[258] S. C. Pryor, R. J. Barthelmie, and G. S. Takle, "Wind speed trends over the contiguous USA," in IOP Conference Series: Earth and Environmental Science, vol. 6, pp. 1-2, 2009.
[259] G. Punj and D. W. Stewart, "Cluster analysis in marketing research: review and suggestions for application," Journal of Marketing Research, pp. 134-148, 1983.
[260] J. M. Ramos, "Action research as foresight methodology," Journal of Futures Studies, vol. 7, pp. 1-24, 2002.
[261] R. Raubitschek, Multiple scenario analysis and business planning in: R. Lamb, P. Shrivastava (Eds.), Advances in Strategic Management vol. 5: JAI Press Inc., London, 1988.
[262] S. Ray and R. H. Turi, "Determination of number of clusters in k-means clustering and application in colour image segmentation," in Proceedings of the 4th International Conference on Advances in Pattern Recognition and Digital Techniques, 1999, pp. 137-143.
[263] D. Rigby and B. Bilodeau, "Selecting management tools wisely," Harvard Business Review, vol. 85, pp. 20-22, 2007.
[264] W. E. Riggs, "The Delphi technique: An experimental evaluation," Technological Forecasting and Social Change, vol. 23, pp. 89-94, 1983.
[265] K. Rijail, "Renewable energy policy options for mountain communities: Experiences from China, India, Nepal and Pakistan," Renewable Energy, vol. 16, pp. 1138-1142, 1999.
[266] P. Rikkonen and P. Tapio, "Future prospects of alternative agro-based bioenergy use in Finland--Constructing scenarios with quantitative and qualitative Delphi data," Technological Forecasting and Social Change, vol. 76, pp. 978-990, 2009.
[267] G. Ringland, Scenario Planning: Managing for the Future, 2nd ed. Chichester, UK: John Wiley & Sons, 2006.
[268] G. Ringland, "The role of scenarios in strategic foresight," Technological Forecasting and Social Change, vol. 77, pp. 1493-1498, 2010.
[269] T. Ritchey, "Scenario development and risk management using morphological field analysis," in Fifth European Conference on Information Systems (ECIS), Cork, Ireland, 1997, pp. 1053-1059.
[270] L. Rodriguez-Repiso, R. Setchi, and J. L. Salmeron, "Modelling IT projects success with Fuzzy Cognitive Maps," Expert Systems with Applications, vol. 32, pp. 543-559, 2007.

274
[271] J. Rohrbaugh, "Improving the quality of group judgment: Social judgment analysis and the Delphi technique," Organizational Behavior and Human Performance, vol. 24, pp. 73-92, 1979.
[272] J. Rohrbaugh, "Improving the quality of group judgment: Social judgment analysis and the nominal group technique," Organizational Behavior and Human Performance, vol. 28, pp. 272-288, 1981.
[273] C. Romesburg, Cluster Analysis for Researchers. North Carolina Lulu Press, 2004.
[274] P. Ronde, "Delphi analysis of national specificities in selected innovative areas in Germany and France," Technological Forecasting and Social Change, vol. 70, pp. 419-448, 2003.
[275] G. Rowe and G. Wright, "The Delphi technique as a forecasting tool: issues and analysis," International Journal of Forecasting, vol. 15, pp. 353-375, 1999.
[276] G. Rowe, G. Wright, and F. Bolger, "Delphi: A reevaluation of research and theory," Technological Forecasting and Social Change, vol. 39, pp. 235-251, 1991.
[277] S.M. Mustonen, "Rural energy survey and scenario analysis of village energy consumption: A case study in Lao People’s Democratic Republic," Energy Policy, vol. 38, pp. 1040-1048, 2010.
[278] H. Sackman, Delphi Critique: Expert Opinion, Forecasting, and Group Process. Lexington, MA: Lexington Books, 1974.
[279] R. Sadiq, Y. Kleiner, and B. Rajani, "Interpreting fuzzy cognitive maps (FCMs) using fuzzy measures to evaluate water quality failures in distribution networks," in Joint International Conference on Computation in Civil and Building Engineering (ICCCBE XI), 2010, pp. 1–10.
[280] M. H. Sahir and A. H. Qureshi, "Specific concerns of Pakistan in the context of energy security issues and geopolitics of the region," Energy Policy, vol. 35, pp. 2031-2037, 2007.
[281] M. H. Sahir and A. H. Qureshi, "Assessment of new and renewable energy resources potential and identification of barriers to their significant utilization in Pakistan," Renewable and Sustainable Energy Reviews, vol. 12, pp. 290-298, 2008.
[282] G. Saliba, "Windows for the mind: the use of scenario planning for enhancing decision-making and managing uncertainty " Journal of Futures Studies, vol. 13, pp. 123 - 128, February 2009.
[283] N. J. Salkind, Statistics For People Who (Think They) Hate Statistics, Third ed. Los Angeles, CA: SAGE Publications, 2007.
[284] J. L. Salmeron, "Augmented fuzzy cognitive maps for modelling LMS critical success factors," Knowledge-Based Systems, vol. 22, pp. 275–278, 2009.
[285] J. A. Sample, "Nominal Group Technique: An alternative to brainstorming " Journal of Extension, vol. 22, 1984.

275
[286] O. Saritas and J. Aylen, "Using scenarios for roadmapping: The case of clean production," Technological Forecasting and Social Change, vol. 77, pp. 1061-1075, 2010.
[287] O. Saritas and M. A. Oner, "Systemic analysis of UK foresight results: Joint application of integrated management model and roadmapping," Technological Forecasting and Social Change, vol. 71, pp. 27-65, 2004.
[288] D. Sarpong and M. Maclean, "Scenario thinking: A practice-based approach for the identification of opportunities for innovation," Futures, vol. 43, pp. 1154-1163, 2011.
[289] R. R. Schaller, "Technology innovation in the semiconductor industry: A case study of the international technology roadmap for semiconductors (ITRS)," PhD Dissertation, School of Public Policy, George Mason University, Fairfax VA, 2004.
[290] S. P. Schnaars, "How to develop and use scenarios," Long Range Planning, vol. 20, pp. 105-114, 1987.
[291] P. J. H. Schoemaker, "When and how to use scenario planning: A heuristic approach with illustration," Journal of Forecasting, vol. 10, pp. 549-564, 1991.
[292] P. J. H. Schoemaker, "Multiple scenario development: Its conceptual and behavioral foundation," Strategic Management Journal, vol. 14, pp. 193-213, 1993.
[293] P. J. H. Schoemaker, "Scenario planning: A tool for strategic thinking," Sloan Management Review vol. 36, pp. 25-40, Winter 1995.
[294] P. J. H. Schoemaker and C. A. J. M. van der Heijden, "Integrating scenarios into strategic planning at royal dutch/shell," Strategy and Leadership, vol. 20, pp. 41-46, 1992.
[295] A. Schoen, et al., "Tailoring foresight to field specificities," Futures, vol. 43, pp. 232-242, 2010.
[296] H.-H. Schroder and A. J. M. Jetter, "Integrating market and technological knowledge in the fuzzy front end: An FCM-based action support system," International Journal of Technology Management, vol. 26, pp. 517 - 539, 2003.
[297] P. Schwab, F. Cerutti, and U. H. von Reibnitz, "Foresight - using scenarios to shape the future of agricultural research," Foresight, vol. 5, pp. 55-61, 2003.
[298] P. Schwartz, The Art of the Long View: Planning for the Future in an Uncertain World Currency Doubleday, New York, 1996.
[299] P. Schwartz. (2009), Your Future in 5 Easy Steps: Wired Guide to Personal Scenario Planning. Wired Magazine (17.08). Available: http://www.wired.com/special_multimedia/2009/ff_scenario_1708 (Jan 10, 2011).
[300] P. M. Senge and J. D. Sterman, "Systems thinking and organizational learning: Acting locally and thinking globally in the organization of the

276
future," European Journal of Operational Research, vol. 59, pp. 137-150, 1992.
[301] T. Senjyu, et al., "Output power leveling of wind turbine Generator for all operating regions by pitch angle control," IEEE Transactions on Energy Conversion, vol. 21, pp. 467-475, 2006.
[302] J. Shanteau, "The psychology of experts: An alternative view," in Expertise and Decision Support, G. Wright and F. Bolger, Eds., New York: Plenum Press, 1992, pp. 11-23.
[303] A. M. Sharif and Z. Irani, "Exploring fuzzy cognitive mapping for IS evaluation," European Journal of Operational Research, vol. 173, pp. 1175-1187, 2006.
[304] D. P. Sharma, P. S. C. Nair, and R. Balasubramanian, "Analytical search of problems and prospects of power sector through Delphi study: Case study of Kerala State, India," Energy Policy, vol. 31, pp. 1245-1255, 2003.
[305] M. A. Sheikh, "Renewable energy resource potential in Pakistan," Renewable and Sustainable Energy Reviews, vol. 13, pp. 2696-2702, 2009.
[306] M. A. Sheikh, "Energy and renewable energy scenario of Pakistan," Renewable and Sustainable Energy Reviews, vol. 14, pp. 354-363, 2010.
[307] Y. Shiftan, S. Kaplan, and S. Hakkert, "Scenario building as a tool for planning a sustainable transportation system," Transportation Research Part D: Transport and Environment, vol. 8, pp. 323-342, 2003.
[308] T. Shin, "Using Delphi for a long-range technology forecasting, and assessing directions of future R&D activities the Korean exercise," Technological Forecasting and Social Change, vol. 58, pp. 125-154, 1998.
[309] R. Silberglitt, A. Hove, and P. Shulman, "Analysis of the US energy scenarios: meta-scenarios, pathways, and policy implications," Technological Forecasting and Social Change, vol. 70, pp. 297-315, 2003.
[310] K. Simola, A. Mengolini, and R. Bolado-Lavin. (2005), Formal Expert Judgment: An Overview. European Commission, Directorate General Joint Research Centre (DG JRC), Institute for Energy. Available: <http://ie.jrc.ec.europa.eu/publications/scientific_publications/2005/EUR21772EN.pdf> (March 18, 2011).
[311] R. A. Slaughter, The Foresight Principle: Cultural Recovery in the 21st Century Adamantine Press, London, 1995.
[312] R. A. Slaughter, Futures for the Third Millennium, Prospect Media. St. Leonards, NSW, Australia, 1995.
[313] R. Soetanto, et al., "Unravelling the complexity of collective mental models: A method for developing and analysing scenarios in multi-organisational contexts," Futures, vol. 43, pp. 890-907, 2011.
[314] J. Solnes, "Environmental quality indexing of large industrial development alternatives using AHP," Environmental Impact Assessment Review, vol. 23, pp. 283-303, 2003.

277
[315] B. Sørensen, et al., "Hydrogen as an energy carrier: scenarios for future use of hydrogen in the Danish energy system," International Journal of Hydrogen Energy, vol. 29, pp. 23-32, 2004.
[316] M. Steinert, "A dissensus based online Delphi approach: An explorative research tool," Technological Forecasting and Social Change, vol. 76, pp. 291-300, 2009.
[317] J. D. Sterman, Business Dynamics: Systems Thinking and Modeling for a Complex World. Boston: Irwin McGraw-Hill, 2000.
[318] J. D. Sterman, "All models are wrong: reflections on becoming a systems scientist," System Dynamics Review, vol. 18, pp. 501-531, 2002.
[319] J. D. Strauss and M. Radnor, "Roadmapping for dynamic and uncertain environments," Research Technology Management, vol. 47, pp. 51-57, 2004.
[320] C. D. Stylios and P. P. Groumpos, "Fuzzy Cognitive Maps in Modeling Supervisory Control Systems," Journal of Intelligent and Fuzzy Systems, vol. 8, pp. 83-98, 2000.
[321] L. Suganthi and A. Williams, "Renewable energy in India -- a modelling study for 2020-2021," Energy Policy, vol. 28, pp. 1095-1109, 2000.
[322] R. I. Sutton and A. Hargadon, "Brainstorming groups in context: Effectiveness in a product design firm," Administrative Science Quarterly, vol. 41, pp. 685-718, 1996.
[323] T. Limanond, S. Jomnonkwao, and A. Srikaew, "Projection of future transport energy demand of Thailand," Energy Policy, vol. 39, pp. 2754–2763, 2011.
[324] R. Taber, "Knowledge processing with fuzzy cognitive maps," Expert Systems with Applications vol. 2, pp. 83-87, 1991.
[325] W. Taber and M. Siegel, "Estimation of experts’ weights using fuzzy cognitive maps," in IEEE International Conference on Neural Networks, 1987, pp. 319-326.
[326] J. Terrados, G. Almonacid, and P. Pérez-Higueras, "Proposal for a combined methodology for renewable energy planning. Application to a Spanish region," Renewable and Sustainable Energy Reviews, vol. 13, pp. 2022-2030, 2009.
[327] G. Tichy, "The over-optimism among experts in assessment and foresight," Technological Forecasting and Social Change, vol. 71, pp. 341-363, 2004.
[328] E. P. Torrance, "Group decision-making and disagreement," Social Forces, vol. 35, pp. 314-318, 1957.
[329] C. Trimble, N. Yoshida, and M. Saqib. (2011), Rethinking Electricity Tariffs and Subsidies in Pakistan. The World Bank Report Number: 62971-PK. Available: http://www-wds.worldbank.org/external/default/WDSContentServer/WDSP/IB/2011/08/31/000386194_20110831050158/Rendered/PDF/629710ESW0whit0020110Final00PUBLIC0.pdf (March 14, 2012).

278
[330] F. Tseng, A. Cheng, and Y. Peng, "Assessing market penetration combining scenario analysis, Delphi, and the technological substitution model: the case of the OLED TV market," Technological Forecasting and Social Change, vol. 76, pp. 897–909, 2009.
[331] S. E. Tuller, "Measured wind speed trends on the west coast of Canada," International Journal of Climatology, vol. 24, pp. 1359-1374, 2004.
[332] V. P. Utgikar and J. P. Scott, "Energy forecasting: Predictions, reality and analysis of causes of error," Energy Policy, vol. 34, pp. 3087-3092, 2006.
[333] K. Van Der Heijden, Scenarios: The Art of Strategic Conversation. Chichester, England: John Wiley, 1996.
[334] M. van Vliet, K. Kok, and T. Veldkamp, "Linking stakeholders and modellers in scenario studies: The use of Fuzzy Cognitive Maps as a communication and learning tool," Futures vol. 42, pp. 1-14, 2010.
[335] S. J. van Zolingen and C. A. Klaassen, "Selection processes in a Delphi study about key qualifications in Senior Secondary Vocational Education," Technological Forecasting and Social Change, vol. 70, pp. 317-340, 2003.
[336] J. H. Vanston, et al., "Alternate scenario planning," Technological Forecasting and Social Change, vol. 10, pp. 159-180, 1977.
[337] V. Varho and P. Tapio, "Wind power in Finland up to the year 2025- `soft' scenarios based on expert views," Energy Policy, vol. 33, pp. 1930-1947, 2005.
[338] C. A. Varum and C. Melo, "Strategic planning in an uncertain business environment: the diffusion of scenario planning," in Conference Factores de Competitividade, Competitiveness Factors: A Portuguese Perspective, Aveiro, Portugal, 2007.
[339] C. A. Varum and C. Melo, "Directions in scenario planning literature A review of the past decades," Futures, vol. 42, pp. 355-369, 2010.
[340] R. S. Vatananan and N. Gerdsri, "The current state of technology roadmapping (TRM) research and practice," in Portland International Center for Management of Engineering and Technology (PICMET), 2010, pp. 1-10.
[341] R. S. Vatananan and N. Gerdsri, "An analytical approach to assess the current state of a roadmap," in Portland International Center for Management of Engineering and Technology (PICMET): Technology Management in the Energy Smart World, 2011, pp. 1-8.
[342] R. Vautard, et al., "Northern hemisphere atmospheric stilling partly attributed to an increase in surface roughness," Nature Geoscience, vol. 3, pp. 756-761, 2010.
[343] R. Vecchiato and C. Roveda, "Strategic foresight in corporate organizations: Handling the effect and response uncertainty of technology and social drivers of change," Technological Forecasting and Social Change, vol. 77, pp. 1527-1539, 2010.
[344] U. von Reibnitz, Scenario Techniques. New York: McGraw-Hill Hamburg, 1988.

279
[345] P. Wack, "Scenarios: shooting the rapids," Harvard Business Review, vol. 63, pp. 139-150, November-December 1985.
[346] P. Wack, "Scenarios: uncharted waters ahead," Harvard Business Review, vol. 63, pp. 73-89, September-October 1985.
[347] S. T. Walsh, "Roadmapping a disruptive technology: A case study: The emerging microsystems and top-down nanosystems industry," Technological Forecasting and Social Change, vol. 71, pp. 161-185, 2004.
[348] H. Wan, X. L. Wang, and V. R. Swail, "Homogenization and trend analysis of Canadian near-surface wind speeds," Journal of Climate, vol. 23, pp. 1209-1225, 2010.
[349] J.-J. Wang, et al., "Review on multi-criteria decision analysis aid in sustainable energy decision-making," Renewable and Sustainable Energy Reviews, vol. 13, pp. 2263-2278, 2009.
[350] D. Weisser, "Costing electricity supply scenarios: A case study of promoting renewable energy technologies on Rodriguez, Mauritius," Renewable Energy, vol. 29, pp. 1319-1347, 2004.
[351] G. Weynand. (2007), Energy Sector Assessment for USAID/Pakistan. United States Agency for International Development. Available: http://www.usaid.gov/pk/downloads/eg/PEDP.pdf (December 14, 2011).
[352] M. Wietschel, U. Hasenauer, and A. de Groot, "Development of European hydrogen infrastructure scenarios--CO2 reduction potential and infrastructure investment," Energy Policy, vol. 34, pp. 1284-1298, 2006.
[353] A. Wilkinson, "Scenarios practices: in search of theory," Journal of Futures Studies, vol. 13, pp. 107-114, February 2009.
[354] I. Wilson, "Mental Maps of the Future: An Intuitive Logics Approach to Scenarios," in Learning from the Future: Competitive Foresight Scenarios, L. Fahey and R. M. Randall, Eds., First ed. New York: John Wiley & Sons Inc., 1998, pp. 81-108.
[355] I. H. Wilson, "Scenarios," in Handbook of Futures Research, J. Fowles, Ed., Greenwood Press, Westport, CT, 1978, pp. 225-47.
[356] I. H. Wilson, W. R. George, and P. J. Solomon, "Strategic planning for marketers," Business Horizons, vol. 21, pp. 65-73, 1978.
[357] J. J. Winebrake, Alternate Energy Assessment and Implementation: Fairmont Press Inc., 2003.
[358] J. J. Winebrake, "Technology roadmaps as a tool for energy planning and policy decisions," Energy Engineering: Journal of the Association of Energy Engineering, vol. 101, pp. 20-36, 2004.
[359] J. J. Winebrake and B. P. Creswick, "The future of hydrogen fueling systems for transportation: An application of perspective-based scenario analysis using the analytic hierarchy process," Technological Forecasting and Social Change, vol. 70, pp. 359-384, 2003.
[360] F. Woudenberg, "An evaluation of Delphi," Technological Forecasting and Social Change, vol. 40, pp. 131-150, 1991.

280
[361] WWEA. (2012), The World Wind Energy Association: Half-year Report 2012. Available: http://www.wwindea.org/webimages/Half-year_report_2012.pdf (Nov 17, 2012).
[362] N. Zhou and J. Lin, "The reality and future scenarios of commercial building energy consumption in China," Energy and Buildings, vol. 40, pp. 2121-2127, 2008.
[363] F. Zwicky, Morphology of Propulsive Power, First ed. Pasadena, CA: Society for Morphological Research, 1962.

281
Appendices
Appendix A: FCM-based Scenario Workshop
Appendix B: Techniques for Combining Multiple FCMs
Appendix C: Roadmap Objectives and Targets Workshop
Appendix D: Roadmap Barriers Workshop
Appendix E: Follow-up Survey for Ranking of Roadmap Barriers
Appendix F: Roadmap Action Items Workshop
Appendix G: Stability Test between First and Second Round of Delphi
Appendix H: Cluster Analysis
Appendix I: FCM Simulation
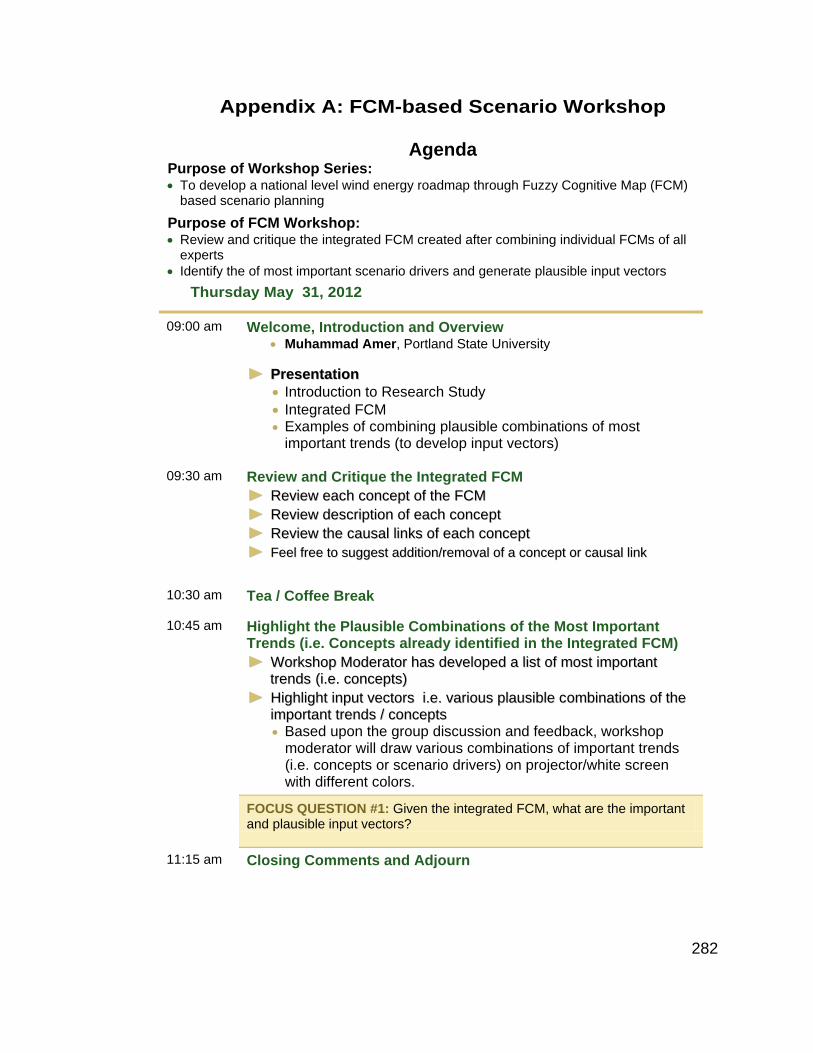
282
Appendix A: FCM-based Scenario Workshop
Agenda Purpose of Workshop Series: • To develop a national level wind energy roadmap through Fuzzy Cognitive Map (FCM)
based scenario planning
Purpose of FCM Workshop: • Review and critique the integrated FCM created after combining individual FCMs of all
experts • Identify the of most important scenario drivers and generate plausible input vectors
Thursday May 31, 2012
09:00 am Welcome, Introduction and Overview • Muhammad Amer, Portland State University
►► PPrreesseennttaattiioonn • Introduction to Research Study • Integrated FCM • Examples of combining plausible combinations of most
important trends (to develop input vectors)
09:30 am Review and Critique the Integrated FCM ►► RReevviieeww eeaacchh ccoonncceepptt ooff tthhee FFCCMM ►► RReevviieeww ddeessccrriippttiioonn ooff eeaacchh ccoonncceepptt ►► RReevviieeww tthhee ccaauussaall lliinnkkss ooff eeaacchh ccoonncceepptt ►► FFeeeell ffrreeee ttoo ssuuggggeesstt aaddddiittiioonn//rreemmoovvaall ooff aa ccoonncceepptt oorr ccaauussaall lliinnkk
10:30 am Tea / Coffee Break
10:45 am Highlight the Plausible Combinations of the Most Important Trends (i.e. Concepts already identified in the Integrated FCM) ►► WWoorrkksshhoopp MMooddeerraattoorr hhaass ddeevveellooppeedd aa lliisstt ooff mmoosstt iimmppoorrttaanntt
ttrreennddss ((ii..ee.. ccoonncceeppttss)) ►► HHiigghhlliigghhtt iinnppuutt vveeccttoorrss ii..ee.. vvaarriioouuss ppllaauussiibbllee ccoommbbiinnaattiioonnss ooff tthhee
iimmppoorrttaanntt ttrreennddss // ccoonncceeppttss • Based upon the group discussion and feedback, workshop
moderator will draw various combinations of important trends (i.e. concepts or scenario drivers) on projector/white screen with different colors.
FOCUS QUESTION #1: Given the integrated FCM, what are the important and plausible input vectors?
11:15 am Closing Comments and Adjourn

283
Handout for FCM-based Scenario Workshop
Purpose of Scenario Workshop:
Prior to Workshop:
• Identify the concepts (scenario drivers) that in your opinion affect or will affect deployment of wind energy on large scale, in the form of a casual map
• Identify the causal relationship among various concepts of the map
During the Workshop:
• Review and critique the integrated FCM created after combining individual FCMs of all experts
• Identify the of most important scenario drivers and generate combination of these important drivers / trends (i.e. plausible input vectors consisting of most important scenario drivers) for developing FCM-based scenarios
Focus Questions:
• Which concepts / factors are affecting deployment of wind energy projects on large scale in the country?
• Given the concepts of FCM, what is the causal relationship among these concepts?
• Given the integrated FCM, what are the important and plausible input vectors?
Introduction and Background Information:
Objective of this research is to develop a national level wind energy roadmap through scenario planning for the next 20 years. Multiple scenarios will be developed using Fuzzy Cognitive Maps (FCM) approach. For this purpose, please provide your opinion and judgment in the form of causal cognitive maps as explained in the instruction section. Some background information is also given in order to provide a brief overview of the research problem. A causal map developed earlier for the deployment of wind energy, prepared in a pilot research project is also included in the end of instruction section [1].
Pakistan is an energy deficient country facing problems due to shortage of energy, especially electricity which is adversely affecting the economy. Country has a limited fossil resource base and there is high demand of energy to sustain

284
economic and industrial growth. Electricity deficit of the country was over 4000 MW in 2008 [2] and import of fossil fuel has put a lot of pressure on the country’s economy [3]. The per capita electricity consumption for Pakistan is 475 kWh, which is almost six times lesser than average electricity consumption in the world [4]. Due to shortage of electricity in Pakistan, industrial sector has been badly affected and overall exports of the country have been reduced. It is likely that this problem will further aggravate in the future because the national energy consumption is increasing at an average annual rate of 5.67 percent [5]. Therefore, it is crucial for the country to formulate a diverse energy strategy and increase the share of renewable energy resources.
Renewable energy resources are the fastest growing energy resources in the world [6, 7]. However, there is not much national effort in Pakistan for the exploitation of renewable energy resources despite their enormous potential. Country’s 1100 km long coastline is ideal for the installation of wind farms and various studies indicate exploitable wind energy potential of more than 50,000 MW along the coastline alone [8]. If we consider the regional context, during the last 5 years India has installed many wind farms along the coast and Pakistan is sharing the same Indian Ocean coastline with India. Moreover, wind energy is a rapidly growing, mature and proven technology already contributing 10 percent or more power in the national energy transmission systems of several European countries [9]. International Energy Agency (IEA) estimates that the investment and operating cost of wind power is expected to further reduce in future [9]. According to a report from Renewable Energy Policy Network, during the last four years wind power capacity has increased 250 percent [10].
It is likely that that deployment of wind energy will significantly help the country to overcome the energy shortage crisis, improve living standards of the society, diversify national energy mix, contribute towards economic growth, improve rural economy, reduce energy import bill, and ensure environment sustainability.
Instructions:
You are requested to identify the factors that in your opinion will affect deployment of wind energy on large scale, in the form of a casual map. These factors (concepts) will be interconnected through causal links representing the cause and effect relationships among concepts. You can highlight the positive or negative causal link between these factors depending on the type of causality that exists. For example a positive value between concept 1 to concept 2 means that an increase in concept 1 causally increases concept 2; whereas, a negative value between concept 2 to concept 3 means that an increase in concept 2 causally decreases concept 3 as shown in the Figure A-1.

285
Figure A-1: A sample of causal cognitive map
Please take the following steps:
1. Identify and define the important factors
a. Write down on Post-its with issues b. Cluster these issues as a map and discuss importance
2. Define the causal link between these factors a. Identify factors which are linked together b. Determine that the relationships is positive or negative c. Define relative strength of relationships by assigning causal weights
using a 5-point Likert-type scale, with values that ranged from 1, representing a very weak causal link, to 5, representing a very strong causal link
3. Review the combined/integrated FCM a. Moderator will individually obtain the causal maps from every
expert and combine them into an integrated FCM 4. Identify the most uncertain factors in the integrated FCM
a. Please paste red dots on the most uncertain factors (5 red dots are provided to each participant in scenario workshop)
5. Identify plausible input vectors consisting of the most important factors from the integrated FCM.
a. Moderator will provide a table of critical scenario drivers (factors) at the top of the each column and highlight number of conceivable development variations (at least two) of each scenario drivers
b. Combine the development variations into plausible strands (input vectors) using markers of different colors
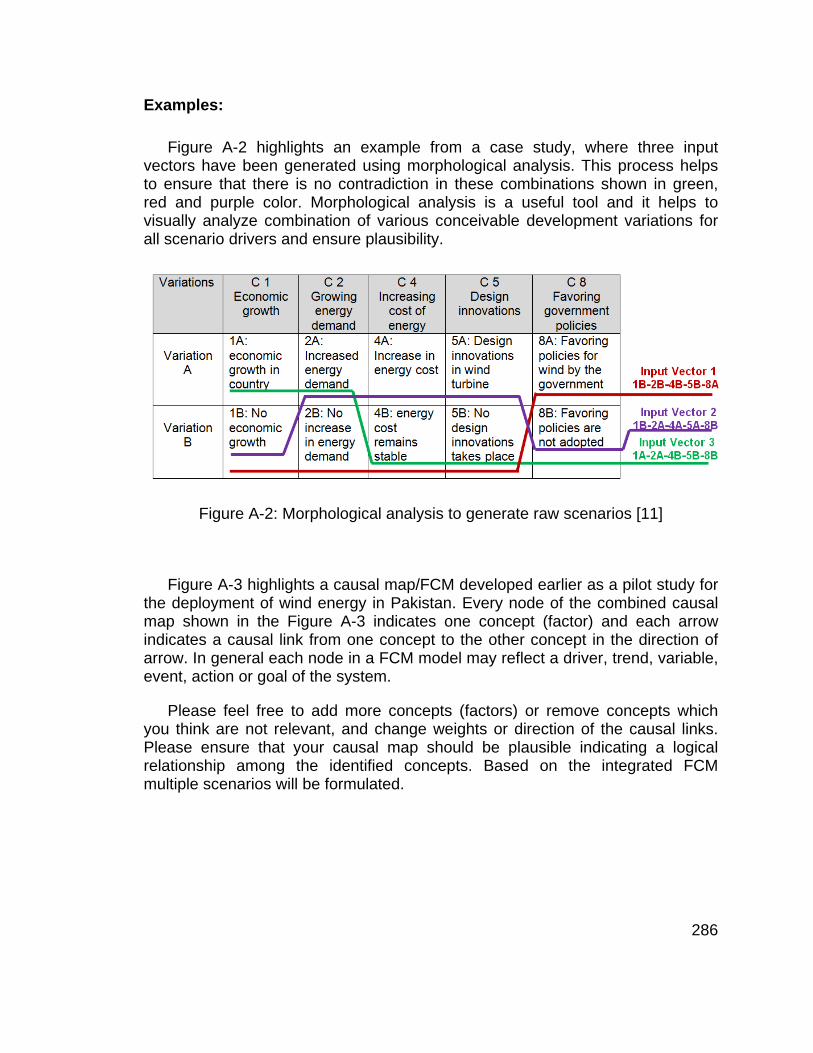
286
Examples:
Figure A-2 highlights an example from a case study, where three input vectors have been generated using morphological analysis. This process helps to ensure that there is no contradiction in these combinations shown in green, red and purple color. Morphological analysis is a useful tool and it helps to visually analyze combination of various conceivable development variations for all scenario drivers and ensure plausibility.
Figure A-2: Morphological analysis to generate raw scenarios [11]
Figure A-3 highlights a causal map/FCM developed earlier as a pilot study for the deployment of wind energy in Pakistan. Every node of the combined causal map shown in the Figure A-3 indicates one concept (factor) and each arrow indicates a causal link from one concept to the other concept in the direction of arrow. In general each node in a FCM model may reflect a driver, trend, variable, event, action or goal of the system.
Please feel free to add more concepts (factors) or remove concepts which you think are not relevant, and change weights or direction of the causal links. Please ensure that your causal map should be plausible indicating a logical relationship among the identified concepts. Based on the integrated FCM multiple scenarios will be formulated.

287
Figure A-3: Causal map/FCM for deployment of wind energy in a developing country [11]

288
References of Appendix A:
[1] M. Amer, A. J. Jetter and T. U. Daim, "Development of fuzzy cognitive
map (FCM) based scenarios for wind energy," International Journal of Energy Sector Management, vol. 5, pp. 564-584, 2011.
[2] M. Asif, "Sustainable energy options for Pakistan," Renewable and Sustainable Energy Reviews, vol. 13, pp. 903-909, 2009.
[3] M. A. Sheikh, "Energy and renewable energy scenario of Pakistan," Renewable and Sustainable Energy Reviews, vol. 14, pp. 354-363, 2010.
[4] IEA. (2009). "Key World Energy Statistics." International Energy Agency. Available: http://www.iea.org/textbase/nppdf/free/2009/key_stats_2009.pdf [May 25, 2011].
[5] "Pakistan Energy Yearbook 2009, Hydrocarbon Development Institute of Pakistan, Ministry of Petroleum and Natural Resources. Islamabad, December 2009."
[6] M. Jefferson, "Sustainable energy development: Performance and prospects," Renewable energy, vol. 31, pp. 571-582, 2006.
[7] EIA. (2011). "International Energy Outlook 2011." DOE/EIA-0484(2011), Energy Information Administration (EIA), U.S. Department of Energy. Available: www.eia.gov/ieo/pdf/0484(2011).pdf [March 30, 2011].
[8] I. A. Mirza, N. A. Khan and N. Memon, "Development of benchmark wind speed for Gharo and Jhimpir, Pakistan," Renewable Energy, vol. 35, pp. 576–582, 2010.
[9] H. Chandler, et al. (2009). "Wind Energy Technology Roadmap." International Energy Agency (IEA). Available: www.iea.org/G8/docs/Roadmaps_g8july09.pdf [March 23, 2011].
[10] (2009). "Renewables global status report 2009 Update." Renewable energy policy network for the 21st century (REN21), REN21 Secretariat. Available: http://www.unep.fr/shared/docs/publications/RE_GSR_2009_Update.pdf
[11] M. Amer, "Development of fuzzy cognitive map (FCM) based scenarios," in Portland International Center for Management of Engineering and Technology (PICMET): Technology Management in the Energy Smart World, 2011, pp. 1-15.

289
Appendix B: Techniques for Combining Multiple FCMs
Finite number of Fuzzy Cognitive Maps (FCMs) can be combined together to produce the joint effect and capture opinion of multiple experts together in one map for the decision making process [1]. Integrated FCM represents information obtained from multiplicity of sources. FCM model integrates expert knowledge of multiple peoples who know the operation and behavior of an environment / system [2]. It is quite possible that experts will differ in content and weight of casual link when addressing the same problem or situation. Utility and usefulness of FCM model significantly depends upon the quality of underlying casual map, therefore selection of appropriate experts and combining their cognitive maps is very critical [3].
There are two methods presented in the literature to combine FCM of multiple experts. One method is proposed by Taber and Siegel and it is based upon assessing expert creditability by calculating creditability weights of each expert. The second method is commonly employed and it takes an average of the expert opinions expressed in all FCMs to generate combined FCM.
Expert Creditability Weights Method:
Taber and Siegel conducted a study to explore the estimation of expert weights in FCM and proposed a methodology for calculating weights of the experts [4, 5]. By this method we can assess creditability weight of an expert. This method is based upon calculating Hamming distance (bit difference) between inferences from various experts. The following two assumptions are made for developing this method:
a. Concurrence of an expert with the others implies a high level of expertise b. The maps contain a sizeable measure of expertise
The combined FCM (CFCM) is calculated using the equation number 1 [4-6]:
CFCM = � 𝐹𝐶𝑀𝑖 .𝑊𝑖
𝑁𝐸
𝑖=1 (1)
Where, NE represents no of experts, Wi is the credibility weight of expert i, and FCMi is the FCM matrix of expert i.

290
The step by step procedure is described below [4, 5]:
i. Generate 500 hundred random stimuli i.e. input vectors, initial condition vectors. For n number of concepts, the input vector is 1 by n.
ii. Excite each FCM matrix from these vectors and get inference. For n
number of concepts, the input vector is 1 by n, the FCM matrix is n by n, and the output vector is 1 by n. The FCM adjacency matrix is excited through an input vector by multiplying input vector with the FCM matrix. The new output vector (first inference) is again multiplied with the FCM matrix to get the second inference vector. This process is further repeated until fourth inference is obtained.
iii. Hamming distance between the inferences generated by expert i and k
is calculated and stored in a matrix. Hamming distance between two vectors is the number of bit difference, for example for the Hamming distance between two vectors (0101000) and (0111010) is 2. Hamming matrix (𝐻𝑞,𝑖,𝑘) is symmetric with zero diagonal. One Hamming matrix is developed for each stimulus (input vector), therefore this process will generate 500 Hamming matrices. H will have 50,000 elements if we use 500 questions and input from 10 experts.
iv. Next step is to make a sum of these 500 Hamming matrices according
to the equation 2:
𝑀𝑖,𝑘 = � 𝐻𝑞,𝑖,𝑘
𝑁𝑄
𝑁𝑄
𝑞=1
(2)
Where NQ is the number of questions and 𝑀𝑖,𝑘 indicates the average distance between expert i and k over all questions. This is also a symmetric matrix with zero diagonal.
v. Then calculate the total Hamming distance of each expert. Hamming
distance of expert i can be obtained from the equation number 3:
ℎ𝑖 = � 𝑀𝑖,𝑘𝑘=1
(𝑁𝐸−1) for 1 ≤ i, k ≤ NE (3)

291
Where NE is the number of experts and ℎ𝑖 is the total Hamming distance of expert i. This is the sum of all columns of row i of the collapsed matrix. The smaller value of hi indicates that response of expert i is closer to the mean response.
vi. Last step is to calculate credibility for each FCM. So the weight of
expert i is calculated using equation number 4.
𝑊𝑖 = 1 − ℎ𝑖� ℎ𝑖𝑖=1
for 1 ≤ i ≤ NE (4)
Where Wi is the credibility for expert i or credibility for FCMi proposed by expert i. Then combined FCM is calculated using the equation number 1.
It is pertinent to mention that this method is based on the principle that the
expert who differs and disagrees from the majority of experts will be given a lesser expert credibility weight while combining the judgment of several experts. So there is an important question that should we give a lesser weight to expert who disagrees from the majority, when combining the judgment of several experts?
Scenario planning literature highlights the importance of identifying the weak signals and future surprises. If we apply this approach proposed by Taber and Siegel, it will further suppress any weak signals if highlighted by few experts. The expert credibility weight approach is suitable for healthcare sector where it is critical to achieve consensus, for example when developing a diagnostic criteria for a disease. However, it is not a suitable approach for combining multiple FCMs developed for scenario planning.
Averaging Multiple FCMs:
This method is more commonly used to combine FCM models of multiple experts [1, 6, 7] by taking average of their inputs. It is simple to use than the expert creditability weight method. To illustrate this method three fuzzy cognitive maps are shown in Figure B-1, highlighted as FCM1, FCM2, and FCM3. The combined FCM is denoted as CFCM in Figure B-1. The each node in these FCMs represents unique concepts or variable and edges are directed and weighted relations between the nodes.

292
Fuzzy Cognitive
Maps FCM Matrix
FCM1
0 0.65 0 0 0 0 1 0 1 0 0 0 0 0 0 0
FCM2
0 1 0 0 0 0 -1/4 0 0 0 0 0.4 1 0 0 0
FCM3
0 0.4 0 0 0 0 0 -1 0 0 0 0 1 0 1 0
CFCM
0 2/3 0 0 0 0 1/4 -1/3 1/3 0 0 0.13 2/3 0 1/3 0
Figure B-1: Combining the FCMs by average method [6]
These different FCM matrices are summed and divided by number of experts to obtain the average edge weight [3, 8]. The combined FCM (CFCM) is a union set of nodes and average of the causal weights is taken. If one map is not showing a specific concept or edge weight, then in the FCM matrix 0 value is considered as the edge weight. For example in the map 1, concept 4 is not shown and there is also no link between concept 3 and concept 4. Therefore, we have considered 0 value of edge weight between concept 3 and concept 4 and value of edge weights from concept 4 to all other concepts is also zero in FCM1.
Thus multiple FCMs can be easily combined together to produce the combined FCM.

293
References for Appendix B:
[1] W. B. V. Kandasamy and F. Smarandache, Fuzzy Cognitive Maps and Neutrosophic Cognitive Maps: Indian Institute of Technology, Madras, Chennai, India, 2003.
[2] C. D. Stylios and P. P. Groumpos, "Fuzzy Cognitive Maps in Modeling Supervisory Control Systems," Journal of Intelligent and Fuzzy Systems, vol. 8, pp. 83-98, 2000.
[3] S. Hans-Horst and A. J. M. Jetter, "Integrating market and technological knowledge in the fuzzy front end: an FCM-based action support system," International Journal of Technology Management, vol. 26, pp. 517 - 539, 2003.
[4] W. Taber and M. Siegel, "Estimation of experts’ weights using fuzzy cognitive maps," in IEEE International Conference on Neural Networks, 1987, pp. 319-326.
[5] R. Taber, "Knowledge processing with fuzzy cognitive maps," Expert systems with applications vol. 2, pp. 83-87, 1991.
[6] R. Taber, R. R. Yager and C. M. Helgason, "Quantization effects on the equilibrium behavior of combined fuzzy cognitive maps," International journal of intelligent systems., vol. 22, p. 181, 2007.
[7] A. Jetter and W. Schweinfort, "Building scenarios with Fuzzy Cognitive Maps: An exploratory study of solar energy," Futures, vol. In Press, Corrected Proof, 2010.
[8] A. J. M. Jetter, "Educating the Guess: Strategies, Concepts, and Tools for the Fuzzy Front End of Product Development," in Portland International Center for Management of Engineering and Technology (PICMET), Portland, OR, USA, 2003, pp. 261-273.

294
Appendix C: Roadmap Objectives & Targets Workshop
Agenda
Purpose of Workshop Series: • To develop a national level wind energy roadmap through Fuzzy Cognitive
Map (FCM) based scenario planning Purpose of TRM Workshop #1:
• Identify and discuss the strategic objective of the wind energy roadmap • Identify and establish national targets of the wind energy roadmap for the
next 20 years
Friday June 15, 2012
09:00 am Welcome, Introduction and Research Overview • Muhammad Amer, Portland State University
09:15 am Recap of FCM Workshop IInntteeggrraatteedd FFuuzzzzyy CCooggnniittiivvee MMaapp ((FFCCMM)) OOvveerrvviieeww ooff FFCCMM bbaasseedd SScceennaarriiooss
09:30 am Strategic Objectives of the Wind Energy Roadmap PPaarrttiicciippaannttss iiddeennttiiffyy aanndd ddiissccuussss tthhee SSttrraatteeggiicc OObbjjeeccttiivveess ooff tthhee WWiinndd EEnneerrggyy RRooaaddmmaapp iinn aaccccoorrddaannccee wwiitthh NNaattiioonnaall RReenneewwaabbllee EEnneerrggyy PPoolliiccyy ooff PPaakkiissttaann
FOCUS QUESTION #1: What are the strategic objectives for the national wind energy sector?
10.30 am Tea / Coffee Break
10:45 am National Targets of the Wind Energy Roadmap PPaarrttiicciippaannttss iiddeennttiiffyy,, ddiissccuussss aanndd eessttaabblliisshh tthhee NNaattiioonnaall TTaarrggeettss ooff tthhee WWiinndd EEnneerrggyy RRooaaddmmaapp iinn aaccccoorrddaannccee wwiitthh NNaattiioonnaall RReenneewwaabbllee EEnneerrggyy PPoolliiccyy ooff PPaakkiissttaann
FOCUS QUESTION #2: Given the strategic objectives, what are national targets of the wind energy roadmap?
12:00 pm Review Results of Workshop • All Participants
12:30 pm Closing Comments and Adjourn

295
Handout for Roadmap Objectives and Targets Workshop Purpose:
• Identify and discuss strategic objective of the roadmap • Identify and establish national targets of the wind energy roadmap for next
20 years
Focus Questions:
• What are the strategic objectives for the wind energy sector? • What are the national targets of the wind energy roadmap?
Identification of Strategic Objectives and National Targets:
You are requested to identify the strategic objectives of the roadmap in accordance to the national renewable energy policy of Pakistan and establish the national targets of the wind energy roadmap for next 20 years. Please deliberate on the strategic objectives and the targets established in the national renewable energy policy.
The following strategic objectives are identified in the national renewable
energy policy [1]: • Energy Security • Social Equity • Economic Benefits • Environmental Sustainability In the second phase of the workshop, you are requested to establish the
national targets for the wind energy sector for the next 20 years. The following targets have been proposed in the national RE policy [1]:
• Generation of 1700 MW of electricity from wind energy by 2015 • Generation of 9700 MW of electricity from wind energy by 2030 • Reduce national dependence on imported fossil fuel (oil) • Develop local wind industry and establish domestic manufacturing base in
the country
Reference of Appendix C:
[1] Government of Pakistan, (2006). "Policy for Development of Renewable Energy for Power Generation." Available: http://www.aedb.org/ [Jan 19, 2011].

296
Appendix D: Roadmap Barriers Workshop
Agenda
Purpose of Workshop Series: • To develop a national level wind energy roadmap through Fuzzy Cognitive Map
(FCM) based scenario planning Purpose of TRM Workshop # 2: • Identify, discuss and explore barriers and challenges towards deployment of the
wind energy projects • Prioritize the most important barriers on the basis of their impact on the roadmap
targets for each scenario
Thursday July 5, 2012
09:00 am Welcome, Introduction and Overview • Muhammad Amer, Portland State University
09:15 am Recap of FCM and TRM # 1 Workshop ►► FFCCMM bbaasseedd SScceennaarriiooss ►► RRooaaddmmaapp OObbjjeeccttiivveess aanndd TTaarrggeettss
09:30 am Barriers and Challenges of the Wind Energy Roadmap ►► PPaarrttiicciippaannttss iiddeennttiiffyy aanndd ddiissccuussss tthhee BBaarrrriieerrss aanndd CChhaalllleennggeess ooff tthhee
WWiinndd EEnneerrggyy RRooaaddmmaapp
FOCUS QUESTION #1: Given the roadmap targets, what barriers are standing in the way of deployment of the wind energy projects in Pakistan?
11.00 am Tea / Coffee Break
11:15 am Importance of the Roadmap Barriers against Scenarios ►► PPaarrttiicciippaannttss ddiissccuussss tthhee iimmppoorrttaannccee ooff RRooaaddmmaapp BBaarrrriieerrss aanndd
CChhaalllleennggeess ffoorr eeaacchh SScceennaarriioo oonn tthhee bbaassiiss ooff tthheeiirr iimmppaacctt oonn tthhee RRooaaddmmaapp TTaarrggeettss
FOCUS QUESTION #2: Given the roadmap barriers, what is the importance of these barriers against the criteria (i.e. roadmap targets) for each scenario?
12:45 pm Review Results of Workshop • All Participants
01:15 pm Closing Comments and Adjourn

297
Handout for Roadmap Barriers Workshop Handout
Purpose:
• Identify, discuss and explore barriers towards deployment of the wind energy projects
• Prioritize the most important barriers on the basis of their impact on the roadmap targets for each scenario
Focus Questions:
• Given the roadmap targets and integrated fuzzy cognitive map (FCM), what barriers are standing in the way of deployment of the wind energy projects in the country?
• Given the roadmap barriers, what is the importance of these barriers against the criteria (i.e. roadmap targets) for each scenario?
Identification of Roadmap Barriers:
You are requested to identify, discuss and explore barriers and challenges towards the deployment and implementation of wind energy projects against each scenario. A list of barriers has been made based on literature review and FCM model. You can also add more barriers and challenges if you think that some important barriers are not included in the handout. In the second phase of the workshop, we shall rank these barriers and challenges on the basis of their importance and impact on the roadmap targets.
Prioritization of Roadmap Barriers:
In order to prioritize and rank the roadmap barriers, you are requested to assess the impact of these barriers on the roadmap targets. As a first step, please rank the importance of the roadmap targets. In the second step, we will assess the impact of roadmap barriers on the targets. Please specify weights of the roadmap targets (criteria) on a Likert scale of 1 to 7 on the basis of their importance in impacting and hammering the roadmap targets. Assign value 1 if a criterion (TRM Target) is not at all important and assign value 7 if a criterion (TRM Target) is extremely important. Please use the following guidelines to specify level of importance [25]:
• 1 – Not at all important • 2 – Low importance • 3 – Slightly important • 4 – Somewhat important

298
• 5 – Moderately important • 6 – Very important • 7 – Extremely important
Table D-1: Criteria for prioritization of roadmap barriers
Criteria for prioritization of roadmap barriers / challenges Weight (1-7) C1: Generation of 1700 MW of electricity from wind by 2015 C2: Generation of 9700 MW of electricity from wind by 2030 C3: Development of local wind industry and domestic manufacturing base in the country
C4: Reduction of national dependence on imported fossil fuel by utilizing indigenous wind energy resources
As a second step, you are requested to rank and prioritize the identified roadmap barriers and challenges. Please rank these barriers and challenges on the basis of their impact on the roadmap targets (criteria) and assign a score ranging from 1 to 5. Use the following guidelines to rank to each barrier [25].
• 1 – Not a barrier • 2 – Somewhat of a barrier • 3 – Moderate barrier • 4 – Important barrier • 5 – Extremely important barrier
Table D-2: Importance score of roadmap barriers against criteria
Roadmap Barrier Importance score of roadmap barriers against criteria
C1 C2 C3 C4 Policy Barriers Institutional Barriers
Financial Barriers
Economic Barriers
Technical Barriers
Transmission Barriers
Wind Resource Data Barriers
Capacity Building Barriers
Awareness Barriers
Social Barriers
Market Barriers

299
The Weighted Sum Method (WSM) will be used to prioritize the roadmap barriers. WSM is a multi-criteria decision making method used for evaluating a number of alternatives against the decision criteria and it is the most commonly used approach in sustainable energy systems [1, 2].
Major barriers towards the deployment of wind energy:
There are various barriers impeding implementation of wind energy projects on large scale in Pakistan. It is vital to identify and rank these barriers and challenges, because without identifying the critical barriers, we cannot move towards addressing them. Based on literature review on wind energy and renewable energy sector of Pakistan, 11 critical barriers and challenges towards implementation of wind energy projects are identified. An overview of these barriers is presented below:
a. Policy Barriers [3-10]:
Lack of legislations, approved national energy policies and inconsistencies of the government policies is a major barrier. Policy barriers hinder development of wind energy projects and effective policies can significantly increase wind energy penetration in the country. Suitable policy instrument covers power purchase agreements, well-defined policies for private sector participation, guidelines for land allotments and clearance for wind project, subsidies and incentives for power generation from wind energy. Policy offering attractive incentives can nurture the wind industry.
b. Institutional Barriers [4-6, 11, 12]: Institutional support plays a critical role for identification, promotion and
implementation of wind energy technology in a country. There is a lack of institutional support and only a few institutes are working to promote to renewable energy technologies in Pakistan. Moreover, there is lack of coordination and cooperation within and between various ministries, agencies, institutes and other stakeholders. Absence of a central body for overall coordination of all activities in wind energy sector also results in duplication of efforts. These institutional barriers delay and restrict the progress in wind energy development and commercialization.
c. Financial Barriers [4-6]:
There are barriers in obtaining competitive forms of finance from local, national and international levels to implement wind energy projects in the country. There are many reasons for this barrier including lack of familiarity with wind technology, high risk perception, uncertainties regarding resource assessment, intermittent power generation from wind energy and site-specific

300
nature of every project. Moreover, there is a lack of financial resources and proper lending facilities, particularly for small-scale projects.
d. Economic Barriers [5, 11, 13]:
The current power generation cost from wind energy is high, due to high capital cost (cost of wind turbines and supporting equipment), taxes and custom duty on equipment imports, low capacity factor and government subsidies given to conventional power plants. Energy prices also do not reflect environmental costs and damage, and mask the striking environmental advantages of the new and clean wind energy options. Subsidies give an unfair advantage to fossil fuel power plants over wind farms and these reasons make wind energy projects un-economical in the country.
e. Technical Barriers [4-6, 14]:
Technical barriers include limited R&D infrastructure in the country, availability of low quality products in the local market, and lack of standards in terms of durability, reliability, performance, etc. for wind energy products. These factors negatively affect commercialization of wind technology.
f. Transmission Barriers [4]:
Integration of wind energy with national grid is a challenge. Wind energy resources are often located in remote and dispersed locations, not connected with transmission and distribution networks. So it needs investments and modifications in the grid to integrate power generated from wind. Non-availability of distribution network at potential sites is a major challenge which leads to low exploitation of wind potential. Low reliability in grid operations also creates problems in integrating power from wind farms.
g. Wind Resource Assessment [7, 13, 15, 16]:
Lack of sufficient and reliable wind data and wind energy resource assessments is also an important barrier in exploitation of wind energy. Many suitable areas in remote locations have not been assessed properly for the implementation of wind energy projects. The development of wind power projects requires a detailed assessment of the wind regime of the area under consideration. Therefore, it is an important factor for making wind power projects bankable.
h. Capacity Building [4, 5, 7, 17]:
Shortage of maintenance infrastructure and skilled human resource to operate, maintain and support wind farms is also a challenge. Skilled manpower

301
can provide the essential services such as, installation, operation and maintenance; troubleshooting of the equipment. Shortage of proper training facilities also increases this challenge. Inadequate servicing and maintenance infrastructure will lead to poor performance of the equipment installed in the field and ultimately result in limited market penetration of wind energy technology.
i. Awareness/ Information [5-7, 18]:
Lack of awareness and information regarding the usefulness of wind energy is also a challenge. There is very limited information regarding the practical problems in implementing and maintaining wind energy projects. Information regarding wind energy projects is not easily available which deters implementation of community level projects. So, there is a need for increasing the availability of technical information and education as a way of facilitating wind power projects.
j. Social Barriers [3-5]: Lack of social acceptance and local participations in the wind energy projects
also restricts deployment of decentralized wind energy projects. Community participation is restricted to just a few demonstration projects and it restricts deployment of wind energy projects on large scale. Moreover, access to land is sometimes difficult and it takes long negotiations with local community and significant compensation in order to acquire land for a wind energy project.
k. Market Barriers [4, 5, 7]:
Market barriers includes small size of the market, limited involvement of private sector, monopoly of the giant conventional power generation companies, lack of marketing infrastructure with promotion campaigns, low level of after-sales service and quality control measures. Absence of successful and replicable business models also hinders market penetration. These factors hinder market penetration of wind energy technology.
l. Wind Speed Variation Challenges:
Some studies support theories that climate change could affect surface wind speeds. Pryor et al. found that wind speeds across the United States have decreased since 1973 [19]. There are other scientific investigations that have reported a decline of surface wind speeds in many regions of the world [20-23]. Variations in the wind speed and wind energy density have great importance for the financial viability of wind farms [24]. Therefore, a decline in wind speed is a potential concern for wind energy sector and it may become a barrier in future and affect power output from wind farms.

302
References for Appendix D: [1] S. D. Pohekar and M. Ramachandran, "Application of multi-criteria
decision making to sustainable energy planning - A review," Renewable and Sustainable Energy Reviews, vol. 8, pp. 365–381, 2004.
[2] J. Solnes, "Environmental quality indexing of large industrial development alternatives using AHP," Environmental Impact Assessment Review, vol. 23, pp. 283-303, 2003.
[3] M. H. Sahir and A. H. Qureshi, "Assessment of new and renewable energy resources potential and identification of barriers to their significant utilization in Pakistan," Renewable and Sustainable Energy Reviews, vol. 12, pp. 290-298, 2008.
[4] U. K. Mirza, N. Ahmad, K. Harijan, and T. Majeed, "Identifying and addressing barriers to renewable energy development in Pakistan," Renewable and Sustainable Energy Reviews, vol. 13, pp. 927-931, 2009.
[5] N. Khattak, S. R. Hassnain, S. W. Shah, and A. Mutlib, "Identification and Removal of Barriers for Renewable Energy Technologies in Pakistan," in International Conference on Emerging Technologies, ICET '06, 2006, pp. 397-402.
[6] U. K. Mirza, N. Ahmad, T. Majeed, and K. Harijan, "Wind energy development in Pakistan," Renewable and Sustainable Energy Reviews, vol. 11, pp. 2179-2190, 2007.
[7] A. M. Chaudhry, R. Raza, and S. A. Hayat, "Renewable energy technologies in Pakistan: Prospects and challenges," Renewable and Sustainable Energy Reviews, vol. 13, pp. 1657-1662, 2009.
[8] M. A. Sheikh, "Energy and renewable energy scenario of Pakistan," Renewable and Sustainable Energy Reviews, vol. 14, pp. 354-363, 2010.
[9] K. Rijail, "Renewable energy policy options for mountain communities: Experiences from China, India, Nepal and Pakistan," Renewable energy, vol. 16, pp. 1138-1142, 1999.
[10] E. Alishahi, M. P. Moghaddam, and M. K. Sheikh-El-Eslami, "An investigation on the impacts of regulatory interventions on wind power expansion in generation planning," Energy Policy, vol. 39, pp. 4614-4623, 2011.
[11] U. K. Mirza, M. M. Maroto-Valer, and N. Ahmad, "Status and outlook of solar energy use in Pakistan," Renewable and Sustainable Energy Reviews, vol. 7, pp. 501-514, 2003.
[12] M. A. Sheikh, "Renewable energy resource potential in Pakistan," Renewable and Sustainable Energy Reviews, vol. 13, pp. 2696-2702, 2009.
[13] "Renewable energy in Pakistan," Economic Review (05318955), vol. 35, pp. 41-44, 2003.

303
[14] S. M. Alam and A. H. Shaikh, "Wind and Solar Sources for Energy," Economic Review vol. 38, pp. 24-25, 2007.
[15] A. Makkawi, Y. Tham, M. Asif, and T. Muneer, "Analysis and inter-comparison of energy yield of wind turbines in Pakistan using detailed hourly and per minute recorded data sets," Energy Conversion and Management, vol. 50, pp. 2340-2350, 2009.
[16] I. A. Mirza, N. A. Khan, and N. Memon, "Development of benchmark wind speed for Gharo and Jhimpir, Pakistan," Renewable Energy, vol. 35, pp. 576–582, 2010.
[17] M. Asif, "Sustainable energy options for Pakistan," Renewable and Sustainable Energy Reviews, vol. 13, pp. 903-909, 2009.
[18] U. K. Mirza, N. Ahmad, and T. Majeed, "An overview of biomass energy utilization in Pakistan," Renewable and Sustainable Energy Reviews, vol. 12, pp. 1988-1996, 2008.
[19] S. C. Pryor, R. J. Barthelmie, and G. S. Takle, "Wind speed trends over the contiguous USA," IOP Conference Series: Earth and Environmental Science, vol. 6, pp. 1-2, 2009.
[20] T. R. McVicar, T. G. Van Niel, L. T. Li, M. L. Roderick, D. P. Rayner, L. Ricciardulli, and R. J. Donohue, "Wind speed climatology and trends for Australia, 1975–2006: Capturing the stilling phenomenon and comparison with near-surface reanalysis output," Geophysical Research Letters, vol. 35, pp. 1-6, 2008.
[21] R. Vautard, J. Cattiaux, P. Yiou, J.-N. Thepaut, and P. Ciais, "Northern Hemisphere atmospheric stilling partly attributed to an increase in surface roughness," Nature Geoscience, vol. 3, pp. 756-761, 2010.
[22] H. Wan, X. L. Wang, and V. R. Swail, "Homogenization and Trend Analysis of Canadian Near-Surface Wind Speeds," Journal of Climate, vol. 23, pp. 1209-1225, 2010.
[23] S. E. Tuller, "Measured wind speed trends on the west coast of Canada," International Journal of Climatology, vol. 24, pp. 1359-1374, 2004.
[24] S. C. Pryor, R. J. Barthelmie, and J. T. Schoof, "Inter-annual variability of wind indices across Europe," Wind Energy, vol. 9, pp. 27-38, 2006.
[25] W. M. Vagias, "Likert-type scale response anchors," Clemson International Institute for Tourism Research and Development, Department of Parks, Recreation and Tourism Management. Clemson University

304
Appendix E: Follow-up Survey for Ranking of Roadmap Barriers
Purpose:
• Review the results of roadmap barriers workshop and prioritize the most important barriers against the criteria (i.e. roadmap targets) for each scenario.
Instructions:
You are requested to prioritize and rank the following roadmap barriers and challenges on the basis of their impact on the roadmap targets (criteria) and assign a score ranging from 1 to 5. Use the following guidelines to rank to each barrier.
• 1 – Not a barrier • 2 – Somewhat of a barrier • 3 – Moderate barrier • 4 – Important barrier • 5 – Extremely important barrier
Table E-1: Importance score of roadmap barriers for Scenario A
Roadmap Barrier Importance score of roadmap barriers against criteria
C1 C2 C3 C4 Policy Barriers Lack of Competition with Conventional Power Plants
Institutional Barriers
Financial Barriers
Circular Debt Barriers
Economic Barriers
Technical Barriers
Capacity Building Barriers
Transmission Barriers
Wind Resource Assessment
Wind Speed Variation
Lack of Awareness
Market Barriers
Social Barriers

305
Table E-2: Importance score of roadmap barriers for Scenario B
Roadmap Barrier Importance score of roadmap barriers against criteria C1 C2 C3 C4
Policy Barriers Lack of Competition with Conventional Power Plants
Institutional Barriers Financial Barriers Circular Debt Barriers Economic Barriers Technical Barriers Capacity Building Barriers Transmission Barriers Wind Resource Assessment Wind Speed Variation Lack of Awareness Market Barriers Social Barriers
Table E-3: Importance score of roadmap barriers for Scenario C
Roadmap Barrier Importance score of roadmap barriers against criteria C1 C2 C3 C4
Policy Barriers Lack of Competition with Conventional Power Plants
Institutional Barriers Financial Barriers Circular Debt Barriers Economic Barriers Technical Barriers Capacity Building Barriers Transmission Barriers Wind Resource Assessment Wind Speed Variation Lack of Awareness Market Barriers Social Barriers

306
Appendix F: Roadmap Action Items Workshop
Agenda
Purpose of Workshop Series: • To develop a national level wind energy roadmap through Fuzzy Cognitive Map
(FCM) based scenario planning
Purpose of TRM Workshop # 3: • Propose and discuss various action items in the wind energy roadmap in order to
overcome the roadmap barriers and translate roadmap targets into action items.
Friday July 20, 2012
09:00 am Welcome and Overview • Muhammad Amer, Portland State University
09:10 am Recap of the Roadmap Barriers Workshop / Follow-up Survey ►► RRooaaddmmaapp BBaarrrriieerrss aanndd CChhaalllleennggeess ►► IImmppoorrttaannccee ooff RRooaaddmmaapp BBaarrrriieerrss ffoorr eeaacchh SScceennaarriioo
09:20 am Barriers and Challenges of the Wind Energy Roadmap ►► PPaarrttiicciippaannttss pprrooppoossee aanndd ddiissccuussss vvaarriioouuss AAccttiioonn IItteemmss rreeqquuiirreedd
ttoo oovveerrccoommee tthhee BBaarrrriieerrss aanndd CChhaalllleennggeess ooff tthhee WWiinndd EEnneerrggyy RRooaaddmmaapp aanndd ttrraannssllaattee RRooaaddmmaapp TTaarrggeettss iinnttoo tthhee pprrooppoosseedd aaccttiioonn iitteemmss..
FOCUS QUESTION #1: Given the roadmap barriers, what are the action items required to overcome these barriers?
11.00 am Tea / Coffee Break
11:15 am Classification of the Propose Action Items ►► PPaarrttiicciippaannttss ccllaassssiiffyy tthhee pprrooppoosseedd AAccttiioonn IItteemmss ooff tthhee RRooaaddmmaapp
iinn ccaatteeggoorriieess aass eexxppllaaiinneedd iinn tthhee AAccttiioonn IItteemmss WWoorrkksshhoopp HHaannddoouuttss aanndd WWoorrkksshheeeett
TASK #1: Highlight and/or modify the action items already taken to address the roadmap barriers. TASK #2: Propose new action items (gaps/needs) required in order to overcome roadmap barriers and achieve roadmap targets. TASK #3: Assign the responsibility for each action item
12:30 pm Review Results of Workshop • All Participants
01:00 pm Closing Comments and Adjourn

307
Handout for Roadmap Action Items Workshop
Purpose:
• Propose and discuss action items in the wind energy roadmap, required to overcome the roadmap barriers and translate roadmap targets into action items.
Focus Question:
• Given the roadmap barriers, what are the action items required to overcome these barriers against each scenario?
Tasks:
• Identify and propose action items required to be taken in order to overcome roadmap barriers for each scenario o Propose new action items (gaps/needs) required to overcome
roadmap barriers and achieve roadmap targets o Action items already taken by the stakeholders (Government,
regulators, private sector etc.) to address the roadmap barriers o Action items which are already taken by the stakeholders but requires
significant modification, adjustments or reforms in order to impact roadmap barriers
• Assign the respective leading role and responsibility for each action item to the government, national electricity regulator / power distribution companies or wind industry.
• Specify the estimated time frame when these action items are required
Identification of Roadmap Action Items:
You are requested to propose and discuss various action items required to overcome the barriers and challenges towards the deployment and implementation of wind energy projects against each scenario and translate roadmap targets into these action items. Various barriers and challenges were identified and prioritized in the roadmap barriers workshop and follow-up surveys. In the first step, you are requested to identify and discuss the action items required to be taken in order to overcome roadmap barriers for each scenario. Then highlight that which action items have already been taken by the stakeholders (Government, regulators, private sector etc.) and mention if there is a need to modify these action items already taken to address the barriers and challenges. You are also requested to propose new action items (i.e. gaps/needs), which are not taken earlier but essentially required to overcome the roadmap barriers. In the end, assign the respective leading role and responsibility for each action item to government, regulator / power distribution

308
companies or wind industry. You can also assign two or more actors responsible for some action items if deemed necessary. You are also requested to specify the estimated timeline for the proposed roadmap action items as given below:
• Short-term: To be taken immediately • Medium-term: Between the year 2015 to 2020 • Long-term: After the year 2020
Example:
An example shown in Table F-1 highlights some action items proposed against roadmap barriers:
Table F-1: Identification and classification of roadmap action items
Roadmap Barrier
Roadmap Action Items (AI)
AI already taken AI required improvements New AI required (Gaps/Needs)
Policy Barriers
Tax Incentives and subsidies to wind energy sector by the Govt.
Legislations to support wind energy projects, e.g. RPS for utilities etc.
Govt. required to adopt a quick process to grant clearance to wind farms
Govt. to ensure consistency in policies towards wind energy
Finalize wind power purchase agreements within the stipulated time
Tax benefits on import of wind turbines and related equipment in Pakistan
Removal of custom duty on import of wind turbines and related equipment
Policy for land allocation for wind farms
Standardize and simplify land allocation process
Wind Resource Data Barriers
Establish benchmark wind speeds for all the potential locations
Install sensors for on-site wind speed measurement
Developed 50 m wind resource map of the country
Use advanced modeling techniques to produce detailed wind maps

309
Appendix G: Stability Test between First and Second Round of Delphi (All responses for scenario A and Policy Barriers for Target 1)
The individual stability test was conducted to measure consistency of
responses between successive Delphi rounds. It has been recommended in the literature that stability is an appropriate criterion for terminating Delphi study [1, 2]. Stability refers to the consistency of responses between successive rounds and it is statistically verified through chi-square test using the following equation [1]:
𝑥2 = �𝑛
𝑘=1
� (𝑂𝑗𝑘 − 𝐸𝑗𝑘)2
𝐸𝑗𝑘
𝑚
𝑗=1
Where Ojk and Ejk are the observed and expected frequency indicating the number of respondents who voted for the jth response interval in the ith round but voted for the kth response interval in round i+1. m and n are number of non-zero response intervals in the round i and round i+1
In order to test individual stability, it is required to determine whether there is a significant difference between individual responses in different rounds using the chi-square test. The following two hypotheses are tested:
H0: Individual responses of rounds i and i+ 1 are independent.
H1: Individual responses of rounds i and i+ 1 are not independent.
If individual responses in the rounds are dependent, than it can be concluded that the same respondents who voted for a given response in the ith round, would also have voted for the same response in round i+1. The responses from experts for round 1 and round 2 regarding the impact of Policy Barriers against roadmap Target 1 in Scenario A are shown in Table G-1.

310
Table G-1: Observed and expected individual frequencies of round 1 & 2 for policy barriers against roadmap Target 1 in scenario A
Observed Frequencies Response
Interval First Round Total
1 2 3 4 5
Sec
on
d
Ro
un
d
1
2
3 2 2 4 4 4 5
1 8 9
Total
2 5 8 15
Expected Frequencies Response
Interval First Round
1 2 3 4 5
Sec
on
d
Ro
un
d
1 2
3 0.26 0.67 1.06 4 0.53 1.33 2.13
5 1.20 3 4.80
The calculated value of chi-square using observed and expected frequencies
mentioned in Table G-1:
𝑥2 = 25.67
The above test has 4 degrees of freedom; it can be calculated as below:
Degrees of freedom (df) = (m – 1)(n – 1) = (3 – 1)(3 – 1) = 4
The critical value Chi-square (𝑥2) at 0.01 level of significance and 4 degree of
freedom is 13.277. Since the Chi-square value (25.67) is greater than the critical value. Thus, the null hypothesis is rejected (H0: Individual responses of rounds i and i+ 1 are independent) and individual stability is verified. References: [1] W. W. Chaffin and W. K. Talley, "Individual stability in Delphi studies,"
Technological Forecasting and Social Change, vol. 16, pp. 67-73, 1980. [2] J. S. Dajani, M. Z. Sincoff, and W. K. Talley, "Stability and agreement
criteria for the termination of Delphi studies," Technological Forecasting and Social Change, vol. 13, pp. 83-90, 1979.

311
Appendix H: Cluster Analysis (Clustering of the roadmap barriers for scenario A)
The scores assigned to the roadmap barriers by the experts were normalized. Then k-means clustering technique was used to group the roadmap barriers [1, 3, 6]. Cluster analysis is a generic name for a class of techniques used to classify cases into groups that are relatively homogeneous within themselves and heterogeneous between each other [7]. Thus, data clustering technique allows objects with similar characteristics to be grouped together for further analysis. Cluster analysis has been extensively used in numerous applications ranging from strategic management and marketing research to information technology and climatology [1-5, 7]. The k-means method aims to minimize the sum of squared distances between all points and the cluster center [6].The elbow method was used to define the number of clusters [4].
The roadmap barriers were grouped into three clusters. The elbow method
was used to define the number of clusters and scree diagram was created for each scenario.
Figure H-1: The scree diagram for scenario A
The appropriate number of clusters for scenario A is calculated as given below:
– Number of Barriers 14 – Step of ‘elbow’ 11 – Number of clusters = (14 - 11) = 3

312
Policy barriers, lack of competition with conventional power plants, and intuitional barriers emerged as the most significant roadmap barriers for scenario A. The results of the cluster analysis performed for the roadmap barriers against each scenario are given in Table 31. The results of k-means cluster analysis performed for the scenario A are shown in the following tables.
Table H-1: Distance between the final cluster centers for scenario A
Table H-2: Cluster membership of roadmap barriers for scenario A
Table H-3: ANOVA for scenario A
Cluster 1 2 3
1 75.917 45.000
2 75.917 30.917
3 45.000 30.917
Distances between Final Cluster Centers
Roadmap Barriers Cluster Distance
Policy 1 10.333
Competitiveness 1 3.333
Institutional 1 13.667
Technical 3 7.333
Capacity 3 3.667
Awareness 3 3.667
Financial 2 10.250
Economic 2 1.250
Transmission 2 6.250
Wind Resource 2 4.750
Social 2 13.750
Market 2 10.250
Circular Debt 2 4.750
Speed Variation 2 4.750
Cluster Membership
Mean Square df
Mean Square df
Scenario_A 6410.190 2 81.167 11 78.976 .000
ANOVA
Cluster Error
F Sig.

313
References for Appendix H:
[1] V. Estivill-Castro, "Why so many clustering algorithms: a position paper," ACM SIGKDD Explorations Newsletter, vol. 4, pp. 65-75, 2002.
[2] K. R. Harrigan, "An application of clustering for strategic group analysis," Strategic Management Journal, vol. 6, pp. 55-73, 2006.
[3] R. Huth, et al., "Classifications of atmospheric circulation patterns," Annals of the New York Academy of Sciences, vol. 1146, pp. 105-152, 2008.
[4] D. J. Ketchen and C. L. Shook, "The application of cluster analysis in strategic management research: an analysis and critique," Strategic Management Journal, vol. 17, pp. 441-458, 1996.
[5] G. Punj and D. W. Stewart, "Cluster analysis in marketing research: review and suggestions for application," Journal of Marketing Research, pp. 134-148, 1983.
[6] S. Ray and R. H. Turi, "Determination of number of clusters in k-means clustering and application in colour image segmentation," in Proceedings of the 4th international conference on advances in pattern recognition and digital techniques, 1999, pp. 137-143.
[7] C. Romesburg, Cluster Analysis for Researchers. North Carolina Lulu Press, 2004.

314
Appendix I: FCM Simulation
Multiple input vectors are used to conduct the FCM simulation and generate scenarios. For this research, five input vectors were developed through the morphological analysis. Although, the most important scenario drivers are used to form the input vectors; but in the FCM simulation all of the scenario drivers (concepts) in the FCM model and their complex causal relationships are considered for generating scenarios. It happens because when a concept changes its state, it affects all concepts that are causally dependent on it, and this process depends on the direction and strength of the causal link [6]. The newly activated concepts may further influence other concepts which they causally affect and this activation spreads in a non-linear fashion in the FCM model until the system attains a stable state [6]. Due to the meta-rules, it is also possible that in some cases several input vectors may lead to the same final system state [7]. The FCM simulations can be used to experiment with different input vectors and compare their outcome [7]. Therefore, it helps to deal with a complex situation and holistically evaluate all concepts of interest. Moreover, despite using the input vectors consisting of the critical scenario drivers, all drivers/concepts and their causal links in the FCM model are considered during the development of FCM-based scenarios.
For or this research, individual FCMs were obtained from the experts and combined into an integrated FCM by the researcher. In the scenario workshop, the expert reviewed and validated the integrated FCM. Then Wilson matrix was used rank the scenario drivers. Finally, input vectors were created to conduct the FCM simulation and generate scenarios. The Adjacency Matrix (E) of the integrated FCM model is shown in Figure I-1. Figure I-2 provides an overview of the FCM-based scenario development process.

315
Figure 1: Adjacency Matrix of the integrated FCM 315
315

316
Figure I-2: FCM-based scenario development process
FCM Simulation with Binary Function
The integrated FCM model was tested against the input vectors. In the first scenario, the effects of economic growth and increase in energy demand were evaluated on the deployment of wind energy. In this study, the FCM model was run with a simple binary squashing function. For this squashing function, input and output values of concepts are either 0 or 1, which indicates that a concept has been turned “on” and “off”. The simple binary function has been used for developing scenarios [2, 3, 6].
The FCM simulation is performed until the output vector is stabilized. It is performed by multiplying the input vector with the FCM adjacency matrix. A squashing function is applied after every multiplication as a threshold function to the output vector. A simple binary squashing function is used which squeezes the result of multiplication in the interval of (0, 1). For n number of concepts, the input vector is 1 by n, the FCM adjacency matrix is n by n, and the output vector is 1 by n [8]. The new output vector is again multiplied with the FCM adjacency matrix and this process is repeated until the multiplication results in equilibrium [5, 6, 8, 9]. As a result, the system is settled down and stabilized, then new matrix multiplications will result in the same output state vector. Implications of the FCM model are analyzed by clamping different concepts and the vector and adjacency

317
matrix multiplication procedure, to assess the effects of these perturbations on the state of a model [1]. This vector – matrix multiplication is performed as:
Si = Ij x E
Where, Si = the new state vector (output / inference vector)
Ij = the jth inference vector
E = the FCM Adjacency Matrix
Figure I-3 highlights the FCM simulation. The Adjacency Matrix obtained from the integrated FCM and input vectors are used to perform the simulation.
Figure I-3: FCM Simulation
For the first input vector, the integrated FCM model was evaluated against two factors: growth in energy demand and economic growth of the country. The effects of these concepts (variables) on the deployment of wind energy projects in Pakistan were examined. Therefore, the initial states of C1 and C2 are set as 1, whereas the initial states of all other concepts are 0. The states of C1 and C2 are clamped to always be on (1). The input vector (A) is shown below:

318
The input vector is multiplied with adjacency matrix (E) and simple binary squashing function (that converts output value of ≤ 0 to 0 and output value of > 0 to 1) is applied. Then we obtain the output vector, in which all elements greater than zero indicate that the concept does occur given the antecedents and a squashing function (threshold operation) is applied. This output vector is also called first order inference. The first inference vector (A') is shown below:
The second order inference is obtained by multiplying the first inference vector with the FCM adjacency matrix (E) and again applying the simple binary squashing function. The second inference vector (A'') is shown below:
Similarly, by repeating the same process again, we obtained the third order inference vector and subsequent vectors. The third (A''') and fourth (A'''') order inference vectors are shown below:
The FCM simulation is continued until the output vector is stabilized. The result has been stabilized and settled down after fourth multiplication. The third (A''') and fourth (A'''') inference vectors are similar. If the results are not stabilized at this level, then we would have generated further higher order inference vectors as well. The fourth inference vectors (A'''') indicates that besides concept 1 and 2; now concepts 3, 4, 6, 7, 10, and 22 are also turned on in the output vector.
A customized worksheet in MS Excel was made to conduct the FCM simulations. The results of the FCM simulation were also verified by using another worksheet developed by Jetter [6]. The results of the FCM simulation performed for the first input vector are summarized in Table I-1. The concepts
C1 C2 C3 C4 C5 C6 C7 C8 C9 C10 C11 C12 C13 C14 C15 C16 C17 C18 C19 C20 C21 C22 …. C42A= 1 1 0 0 0 0 0 0 0 0 0 0 0 0 0 0 0 0 0 0 0 0 …. 0
C1 C2 C3 C4 C5 C6 C7 C8 C9 C10 C11 C12 C13 C14 C15 C16 C17 C18 C19 C20 C21 C22 …. C42A'= 1 1 1 1 0 1 0 0 0 1 0 0 0 0 0 0 0 0 0 0 0 0 …. 0
C1 C2 C3 C4 C5 C6 C7 C8 C9 C10 C11 C12 C13 C14 C15 C16 C17 C18 C19 C20 C21 C22 …. C42A''= 1 1 1 1 0 1 1 0 0 1 0 0 0 0 0 0 0 0 0 0 0 0 …. 0
C1 C2 C3 C4 C5 C6 C7 C8 C9 C10 C11 C12 C13 C14 C15 C16 C17 C18 C19 C20 C21 C22 …. C42A'''= 1 1 1 1 0 1 1 0 0 1 0 0 0 0 0 0 0 0 0 0 0 1 …. 0
C1 C2 C3 C4 C5 C6 C7 C8 C9 C10 C11 C12 C13 C14 C15 C16 C17 C18 C19 C20 C21 C22 …. C42A''''= 1 1 1 1 0 1 1 0 0 1 0 0 0 0 0 0 0 0 0 0 0 1 …. 0

319
which are turned on (1) in the subsequent inference vectors are mentioned in Table I-1.
Table I-1: The results of FCM simulation for the first input vector *States of C1 and C2 are clamped to always be 1 (on).
The results of FCM Simulation for the First Input Vector
Input Vector C1*, C2*
First Inference Vector C1*, C2*, C3, C4, C6, C10
Second Inference Vector C1*, C2*, C3, C4, C6, C7, C10
Third Inference Vector C1*, C2*, C3, C4, C6, C7, C10, C22
Fourth Inference Vector C1*, C2*, C3, C4, C6, C7, C10, C22
FCM Simulation with Tangent Hyperbolic Function
After conducting the FCM simulation with the simple binary squashing function and developing the FCM-based scenarios, it was observed that all three scenarios have indicated an increase in the deployment of wind energy in the country. Thus, all the scenarios indicate widespread deployment of wind technology, but the barriers, challenges, and the wind energy deployment paths were different against each scenario. In order to check the behavior and robustness of the integrated FCM model, it was further analyzed by applying a different squashing function to generate some heterogeneous scenarios. Thus, the hyperbolic tangent function was applied to the model as a squashing function. Mathematical expressions of the simple binary and tangent hyperbolic functions are given in Table I-2.
Table 2: Different squashing function [6] Si is the new state vector
Applying Squashing Functions
Simple Binary Function
Si(xi) = 0 for xi ≤ 0 Si(xi) = 1 for xi > 0
Tangent Hyperbolic Function 𝑆𝑖(𝑥𝑖) =
�𝑒−𝑐(𝑥𝑖 − 𝑦𝑖) − 𝑒−𝑐(𝑥𝑖 − 𝑦𝑖) �
( 𝑒−𝑐(𝑥𝑖 − 𝑦𝑖) + 𝑒−𝑐(𝑥𝑖 − 𝑦𝑖) )

320
The FCM simulation was conducted again with a different squashing function to examine the behavior of the integrated FCM model. The hyperbolic tangent function (tanhx) is a bipolar sigmoid function and it has been also recommended in the literature for conducting the FCM simulations [4, 6]. A hyperbolic tangent function drawn for values between -1 to 1 is shown in Figure 3.
Figure 4: Adjacency Matrix of the integrated FCM
Table I-3 provides a summary of the FCM simulation results with simple binary function (SBF) and tangent hyperbolic function (THF) for all three scenarios. It can be observed that there are similarities and some differences among the simulation outcome obtained from different squashing functions. However, all the simulation results have indicated a positive trend towards the deployment of wind energy projects on a large scale in the country (concept 10 is on). The purpose of applying the hyperbolic tangent function was to examine the behavior of the FCM model against a different squashing function. However, it has also shown a positive trend towards deployment of wind farms in the country and concept 10 is turned on in each case, as highlighted in Table I-3.

321
Scenarios and
Squashing Functions
Results of the FCM Simulation with different squashing functions (SBF and THF)
C1:
Eco
nom
ic G
row
th
C2:
Gro
win
g E
nerg
y D
ema
nd
C3:
Red
uctio
n in
Fos
sil-
Fue
l
C4:
Incr
easi
ng E
nerg
y C
ost
C6:
Dep
ende
nce
Con
cern
s
C7:
Con
trol
en
ergy
cos
t
C10
: D
eplo
ymen
t o
f W
E
C12
: Lo
cal M
anuf
actu
ring
C13
: R
educ
ed
Tur
bine
Cos
t
C14
: Red
uced
O&
M C
ost
C15
: Fav
orin
g P
olic
ies
C16
: Tra
ined
HR
for
Win
d
C17
: Eas
e of
Mai
ntai
ning
C19
: Inc
entiv
es
for
Indu
stry
C20
: P
rivat
e S
ecto
r
C21
: Env
iron
men
tal C
once
rns
C22
: Aw
aren
ess
to u
se W
E
C23
: Em
issi
on S
tand
ards
C26
: Gov
ern
men
t Sup
port
C27
: Hea
lth &
Saf
ety
Con
cern
s
C28
: Pos
itive
Per
cept
ion
C33
: Int
erna
tiona
l Coo
pera
tion
Sce
nar
io A
SB
F
TH
F
Sce
nar
io B
SB
F
TH
F
Sce
nar
io C
SB
F
TH
F
Table 5: The results of the FCM simulation with simple binary and tangent hyperbolic functions
321
320

322
References for Appendix I:
[1] J. Aguilar, "A survey about fuzzy cognitive maps papers (Invited Paper),"
International Journal of Computational Cognition, vol. 3, pp. 27-33, 2005. [2] M. Amer, "Development of fuzzy cognitive map (FCM) based scenarios,"
in Portland International Center for Management of Engineering and Technology (PICMET): Technology Management in the Energy Smart World, 2011, pp. 2695-2709.
[3] M. Amer, A. J. Jetter, and T. U. Daim, "Development of fuzzy cognitive map (FCM) based scenarios for wind energy," International Journal of Energy Sector Management, vol. 5, pp. 564-584, 2011.
[4] S. Bueno and J. L. Salmeron, "Benchmarking main activation functions in fuzzy cognitive maps," Expert systems with applications, vol. 36, pp. 5221-5229, 2009.
[5] S. Hans-Horst and A. J. M. Jetter, "Integrating market and technological knowledge in the fuzzy front end: an FCM-based action support system," International Journal of Technology Management, vol. 26, pp. 517 - 539, 2003.
[6] A. Jetter and W. Schweinfort, "Building scenarios with Fuzzy Cognitive Maps: An exploratory study of solar energy," Futures, vol. 43, pp. 52-66, 2011.
[7] A. J. Jetter, "Fuzzy Cognitive Maps for Engineering and Technology Management: What Works in Practice?," in Portland International Center for Management of Engineering and Technology (PICMET), Istanbul, Turkey, 2006, pp. 498-512.
[8] R. Taber, "Knowledge processing with fuzzy cognitive maps," Expert systems with applications vol. 2, pp. 83-87, 1991.
[9] W. Taber and M. Siegel, "Estimation of experts’ weights using fuzzy cognitive maps," in IEEE International Conference on Neural Networks, 1987, pp. 319-326.