extending differential optical absorption … law, like e.g. differential optical absorption...
TRANSCRIPT

Atmos. Meas. Tech., 3, 631–653, 2010www.atmos-meas-tech.net/3/631/2010/doi:10.5194/amt-3-631-2010© Author(s) 2010. CC Attribution 3.0 License.
AtmosphericMeasurement
Techniques
Extending differential optical absorption spectroscopy for limbmeasurements in the UV
J. Pukıte1, S. Kuhl1, T. Deutschmann2, U. Platt2, and T. Wagner1
1Max Planck Institute for Chemistry, J. J. Becher Weg 27, 55128 Mainz, Germany2Institute of Environmental Physics, University of Heidelberg, Im Neuenheimer Feld 229, 69120 Heidelberg, Germany
Received: 24 September 2009 – Published in Atmos. Meas. Tech. Discuss.: 18 November 2009Revised: 6 May 2010 – Accepted: 10 May 2010 – Published: 19 May 2010
Abstract. Methods of UV/VIS absorption spectroscopy todetermine the constituents in the Earth’s atmosphere frommeasurements of scattered light are often based on the Beer-Lambert law, like e.g. Differential Optical Absorption Spec-troscopy (DOAS). While the Beer-Lambert law is strictlyvalid for a single light path only, the relation between the op-tical depth and the concentration of any absorber can be ap-proximated as linear also for scattered light observations at asingle wavelength if the absorption is weak. If the light pathdistribution is approximated not to vary with wavelength,also linearity between the optical depth and the product ofthe cross-section and the concentration of an absorber canbe assumed. These assumptions are widely made for DOASapplications for scattered light observations.
For medium and strong absorption of scattered light (e.g.along very long light-paths like in limb geometry) the rela-tion between the optical depth and the concentration of anabsorber is no longer linear. In addition, for broad wave-length intervals the differences in the travelled light-pathsat different wavelengths become important, especially in theUV, where the probability for scattering increases stronglywith decreasing wavelength.
However, the DOAS method can be extended to cases withmedium to strong absorptions and for broader wavelength in-tervals by the so called air mass factor modified (or extended)DOAS and the weighting function modified DOAS. Theseapproaches take into account the wavelength dependency ofthe slant column densities (SCDs), but also require a prioriknowledge for the air mass factor or the weighting functionfrom radiative transfer modelling.
Correspondence to:J. Pukıte([email protected])
We describe an approach that considers the fitting resultsobtained from DOAS, the SCDs, as a function of wavelengthand vertical optical depth and expands this function into aTaylor series of both quantities. The Taylor coefficients arethen applied as additional fitting parameters in the DOASanalysis. Thus the variability of the SCD in the fit window isdetermined by the retrieval itself.
This new approach provides a description of the SCD theexactness of which depends on the order of the Taylor ex-pansion, and is independent from any assumptions or a prioriknowledge of the considered absorbers.
In case studies of simulated and measured spectra in theUV range (332–357 nm), we demonstrate the improvementby this approach for the retrieval of vertical profiles of BrOfrom the SCIAMACHY limb observations. The results forBrO obtained from the simulated spectra are closer to thetrue profiles, when applying the new method for the SCDsof ozone, than when the standard DOAS approach is used.For the measured spectra the agreement with validation mea-surements is also improved significantly, especially for caseswith strong ozone absorption.
While the focus of this article is on the improvement of theBrO profile retrieval from the SCIAMACHY limb measure-ments, the novel approach may be applied to a wide range ofDOAS retrievals.
1 Introduction
Differential Optical Absorption Spectroscopy (DOAS) (Plattand Stutz, 2008) is nowadays widely used to derive trace gasabundances in the atmosphere, either from direct or scatteredlight observations (e.g.Perner et al., 1976; Platt and Perner,
Published by Copernicus Publications on behalf of the European Geosciences Union.

632 J. Pukıte et al.: Extending DOAS for limb measurements in the UV
1980; Mount et al., 1987; Solomon et al., 1987; Wahner et al.,1990; Burrows et al., 1999; Platt and Stutz, 2008; Wagner etal., 2008).
For direct light observations, the light path is well definedand the detected integrated number density along the lightpath, the slant column density (SCD) is related to the verticalcolumn density (VCD, being the number density integratedalong the altitude) by an enhancement factor (so called airmass factor, AMF). The AMF only depends on the obser-vation angle and can be calculated by simple trigonometry.For observations of scattered light, which are usually char-acterized by complex viewing geometries, this enhancementfactor is no longer a pure geometric quantity but dependsstrongly on the individual light paths contributing to the mea-surement (e.g.Solomon et al., 1987; Perliski and Solomon,1993). Therefore, the interpretation of the measurements re-quires advanced radiative transfer modelling (RTM) and in-version algorithms, especially for observations at large solarzenith angle (SZA) or for limb observations (i.e., at tangen-tial view from the satellite into the Earth’s atmosphere).
The AMF for scattered light observations depends onall factors that impact light propagation in the atmosphere(like the SZA, the air density, the abundance of absorbers –e.g. ozone, as well as clouds, aerosols, albedo etc.). In par-ticular, due to the dependence of the propagation of light onscattering and absorption processes, the AMF is a functionof wavelength and the absorption strength (Marquard et al.,2000). For the application of DOAS this means that the re-lation between SCD and VCD may vary considerably withinthe wavelength interval chosen for a DOAS fit (Platt et al.,1997).
While the wavelength dependency of the SCD can be ne-glected for many applications, it was found that it becomesimportant for cases with strong absorption (e.g., absorptionby ozone in the UV) and large SZA for satellite nadir andground observations (Diebel et al., 1995; Richter, 1997). Forlimb geometry, where the atmosphere is observed in a tan-gential view, a correction for these effects is even more nec-essary due to the increased light path lengths.
A common approach for this correction is the so calledAMF modified or extended DOAS (Diebel et al., 1995;Richter, 1997) which considers the product of the AMFs andthe absorption cross-sections in the DOAS analysis insteadof the cross-sections alone. Thus, wavelength independentVCDs are fitted directly.
Alternatively, the weighting function DOAS method(Buchwitz et al., 2000; Coldewey-Egbers et al., 2004, 2005;Frankenberg et al., 2005) was developed. It accounts for thewavelength modulation of the slant path by approximatingthe measured optical depth with a Taylor expansion aroundthe reference intensity at a certain a priori state plus a loworder polynomial. For limb observations the so called full re-trieval approach was developed (Rozanov et al., 2005), mod-elling the intensities for all altitudes of one particular limbscanning sequence simultaneously.
In this article, we propose a method that takes into accountthe dependency of SCD on optical depth and on wavelengthalready in the fitting procedure itself. Thus, wavelength de-pendent SCDs are determined by DOAS. The pre-calculationof AMFs or weighting functions and intensities is not re-quired, and the approach does not need a priori input for theretrieval of SCDs. The method is based on the formulationof the AMFs (and consequently SCDs) as function of wave-length and optical depth of strong absorbers: a Taylor seriesexpansion for AMFs or SCDs with respect to the wavelengthand absorption by trace gases is performed.
The terms of this series are then co-fitted by the leastsquares approach like the absorption cross-sections in thestandard DOAS analysis. From the fitted coefficients, thefunctional relationship of the SCDs on wavelength and ab-sorption can be determined and taken into account to the pre-cision of the order of the Taylor series expansion.
We study the capability and limitations of the methodfor the retrieval of vertical BrO profiles from EN-VISAT/SCIAMACHY limb measurements in the near UVspectral region (332–357 nm).The method is applied for sim-ulated spectra for different fit windows to investigate itsimportance and performance for different spectral regions.Also, to verify that the approach can be applied for improvedretrievals from actual measurement data, we compare the ob-tained BrO profiles to those from correlated balloon observa-tions performed for the validation of SCIAMCHY limb mea-surements.
The article is structured as follows: in Sect.2 we describethe standard DOAS approach, its limitations for strong ab-sorptions and limb geometry, and introduce the Taylor se-ries approach to overcome this problem. Section3 demon-strates the applicability of the approach to synthetic spectra,and Sect.4 studies the sensitivity of the novel approach fordifferent absorption strengths, geometries, fit windows andfit parameters. Section5 shows the application of the ap-proach to real measurements of SCIAMACHY and comparesthe result with correlated balloon measurements (Dorf et al.,2006). Finally, Sect.6 draws some conclusions.
2 The method
2.1 Standard DOAS: principle and limitations forstrong absorptions and scattered light
2.1.1 Standard DOAS
Differential Optical Absorption Spectroscopy (Platt, 1994)is an atmospheric spectroscopy method based on a modi-fied Beer-Lambert law (extended to observations of scatteredlight), see e.g.Stutz and Platt(1996); Platt and Stutz(2008).To determine the SCDsS of the considered absorbing tracegases, DOAS utilizes their spectral features: the algorithmsimultaneously fits the SCDsSi of a number ofk absorbers
Atmos. Meas. Tech., 3, 631–653, 2010 www.atmos-meas-tech.net/3/631/2010/

J. Pukıte et al.: Extending DOAS for limb measurements in the UV 633
with known absorption cross-sectionsσi to the difference ofthe logarithm of a measured spectrumI and a reference spec-trum I0:
lnI0(λ)
I (λ)=
k∑i=1
σi(λ) · Si +
l∑p=1
apλp
︸ ︷︷ ︸P
(1)
Usually, the absorption due to trace gases shows a strongvariation with wavelengthλ. It is described by the absorptioncross sections of the considered molecules that are knownfrom laboratory measurements. Structures due to scattering,which vary only slowly with wavelength, are described by abroad band polynomialP (last term in Eq.1) of order l inthe fit analysis (Platt, 1994). The reference spectrum doesnot include the trace gas absorptions or only contains a smallamount. For satellite observations usually a direct Sun spec-trum, or – for limb geometry – a spectrum measured at hightangent height (TH), where the considered trace gas has lowconcentration, is applied as reference spectrum. In a leastsquares fit, the differences between the right and left termsof Eq. (1) are minimized for all wavelengths simultaneouslyproviding as result the SCDsSi and polynomial coefficientsap that fit best to the respective measurement.
The SCD is related to the VCD as the product of AMFAi
and VCDVi :
Si = Ai · Vi (2)
Equations (1) and (2) are simplifications in so far as thewavelength dependency of AMF and SCD is not considered.This simplification can be applied for a wide range of obser-vation geometries and absorbers, as long as the dependencyof the SCDs on wavelength is negligible within the fittingwindow.
2.1.2 Limitations for measurements of scattered light
For very long light paths or cases of strong absorption, how-ever, it is found that the variability of the SCD in the fitwindow becomes important. For standard DOAS applica-tions in satellite nadir geometry, this was first described byDiebel et al.(1995) andRichter(1997): For the retrieval ofozone VCDs from simulated spectra in a wavelength regionbetween 335–346 nm, a discrepancy of∼2% for SZA sig-nificantly below 90◦ and ∼15% for SZA near to 90◦ wasfound with respect to the true column, if the wavelength de-pendence of the SCD is not taken into account.
The wavelength dependence of the SCD is caused by twoeffects:
(1) The slant path of scattered light varies with wavelengthand the light path distribution changes (e.g.Solomonet al., 1987), since the Rayleigh-scattering cross-sectionvaries as the inverse of the wavelength to the fourthpower. Also, other scattering and reflection processes
(on clouds, aerosols or ground) in the atmosphere arecharacterized by broad band functions of wavelength.
(2) SCDs vary across spectral structures of the trace gasabsorption cross-sections because different light pathsthrough the atmosphere also depend on the strength ofthe trace gas absorption (Platt et al., 1997; Marquardet al., 2000). Longer paths with stronger absorptionhave a smaller intensity and thus contribute less to themeasurement than shorter paths with weaker absorp-tion. Therefore the average path will be shorter andthe SCD lower for stronger absorption. This effect be-comes more pronounced for stronger absorption andwhen light crosses the atmosphere along very differenttrajectories. In contrast to the broad band scattering ef-fect, the wavelength dependence caused by absorptioncan have a narrowband component of SCD variation be-cause it depends on the absorption cross-sections of theabsorbing trace gases.
Thus, the assumption of a wavelength and absorption inde-pendent SCD may lead to errors in the detection of all tracegases analyzed in a specific wavelength interval. In partic-ular, neglecting the wavelength dependency for strong ab-sorbers will affect the retrieval of minor absorbers. A moreaccurate description of the relation between vertical and slantcolumn density should therefore take into account also thedependency on wavelength and vertical optical depthυ (Mar-quard et al., 2000):
Si = Si(λ,υ) = Ai(λ,υ) · Vi (3)
For a number ofk absorbers, the total vertical optical depthis the sum of the vertical optical depths of the individual ab-sorbers:
υ =
k∑i=1
Viσi (4)
2.1.3 AMFs for strong absorptions in limb geometry
In limb geometry, light detected by the instrument arisesfrom various locations along the LOS which has a length onthe order of up to one thousand km through the Earth’s atmo-sphere. Due to the wavelength dependency of the scatteringand also the absorption processes, the length and the geome-try of individual light paths differ significantly, resulting in avariation of the AMF (or the SCD) with wavelength for limbgeometry much stronger than for nadir geometry.
Examples of AMFs for the wavelength region of 332–357 nm are illustrated in Fig.1 for nadir (left panel) and limb(right panel) geometry for predefined atmospheric scenarios(parameters of the simulation are given in Table1). The am-plitudes of the AMF variations with respect to the mean valueand their standard deviation are given in Table2.
For nadir geometry at SZA=75◦, the AMF varies withinthe fit window by about 3% (blue line in the left panel of the
www.atmos-meas-tech.net/3/631/2010/ Atmos. Meas. Tech., 3, 631–653, 2010

634 J. Pukıte et al.: Extending DOAS for limb measurements in the UV
Table 1. Parameters used for the simulation studies.
Parameter Description of main settings Settings for the AMF comparison Settings for the sensitivity studies
RTM model Full spherical 3-D Monte Carlo RTM McArtim (Deutschmann, 2009). Simulations for 10 million photon trajectoryensembles. Atmosphere discretized in 1 km layers up to 100 km.
Atmosphere Rayleigh atmosphere (i.e. without clouds and aerosols).
Ground albedo 0.3
Atmospheric profiles of T, p Subarctic scenario corresponding Ozone profile also scaled to 200 DU Ozone profile also scaled to 200 DUand trace gases (O3, NO2 to Kiruna (67.9◦ N) in March, (additionally to the main setting). (additionally to the main setting).and BrO). (Profiles of ozone ozone VCD of 460 DU. Additionally, tropical scenario, (ozoneare provided in Fig.2) VCD=270 DU, maximum concentration
of ozone at 28 km).
Geometry Geometry (SZA, SAA) from Additionally: Additionally to the main settings,SCIAMACHY orbit 5545 with – AMFs at SZAs of 90◦, 88.5◦ and scenarios with SZA=43◦ at TP.SZA at tangent point of 75◦, 43◦ for nadir.SAA=60◦. For limb geometry:
– AMFs at SZAs=88.5◦
– AMF for tropical scenario withSZA=43◦ at tangent point (TP).(For the case with SZA=43◦, alsoozone profile of 200 DU is applied)
Wavelength region 338–357 nm. AMFs are studied in 332–357 nm Different fit windows within theregion. 332–357 nm region.
Table 2. Variation of AMFs of ozone in the wavelength range of 332–357 nm for different observation geometries and ozone profile withVCD of 460 DU (in brackets values for the scenario with VCD of ozone of 200 DU are given). The first number gives the difference betweenmaximum and minimum values of AMFs normalized by the mean of AMFs in the wavelength range; the second number is the standarddeviation. Calculations are performed only for selected geometries and SZAs in order to illustrate the general tendencies.
SZA (◦) 90 88.5 75 43
nadir 24%/6.0% 18%/4.5% 3.1%/0.69% 1.2%/0.26% (1.2%/0.32%)Limb, TH=19.8 km 20%/4.8% 25%/6.3% (18%/4.8%) 25%/6.1% (18%/4.6%)Limb, TH=22.8 km 18%/4.3% (12%/3.1%)Limb, TH=35.9 km 9.5%/2.0% (4.9%/1.0%)
Fig. 1), with a slight increase towards larger wavelengths.Additionally, at wavelengths, where absorption by ozone isstronger, AMFs are decreased by∼2% at 334 nm because ofthe increased ozone absorption cross-section. For a SZA of90◦ (green line), however, the AMF increase for longer wave-lengths is much stronger and the variation along the ozoneabsorption bands is more prominent, resulting in a variationof the AMFs in the fit window of around 25%.
This strong dependency of the AMF on wavelength causesthe discrepancies in the ozone retrieval described byDiebelet al.(1995) andRichter(1997).
Compared with the nadir viewing geometry, the variationwith wavelength for limb geometry is one order of magnitudestronger for a scenario with SZA=75◦ and the ozone VCD of460 DU (solid red and cyan lines in the right panel of Fig.1).The variation is around 25% with up to∼10% decrease at
the ozone absorption bands for a TH near the peak of theBrO and ozone profile.
A clear dependency of the AMF of ozone on its opti-cal depth is observed: For an ozone profile with a VCD of460 DU (solid red and cyan lines in the plot) the AMFs de-crease in comparison to the ozone profile scaled to a VCDof 200 DU (dashed red and cyan lines). The difference isstronger for those wavelengths where the absorption cross-section of ozone is larger. The ozone profiles applied for thesimulations are plotted in Fig.2.
Due to the long light paths for limb geometry and the re-sulting large differences of the light paths, the strong vari-ation of the AMF with wavelength occurs already for lowSZAs.
For nadir geometry the lengths of the light paths increasestrongly only at high SZAs (i.e., at SZAs close to 90◦). As
Atmos. Meas. Tech., 3, 631–653, 2010 www.atmos-meas-tech.net/3/631/2010/

J. Pukıte et al.: Extending DOAS for limb measurements in the UV 635
Nadir Limb
SZA=75o , O3 VCD=460 DUSZA=90o , O3 VCD=460 DU
SZA=75o, TH=19.8km, O3 VCD=460 DU– – SZA=75o, TH=19.8km, O3 scaled to 200 DU
SZA=75o, TH=22.8km, O3 VCD=460 DU– – SZA=75o, TH=22.8km, O3 scaled to 200 DU
SZA=88.5o, TH=19.8km, O3 VCD=460 DU
Wavelength (nm)
Air
Mas
s Fa
ctor
Air
Mas
s Fa
ctor
Air
Mas
s Fa
ctor
Air
Mas
s Fa
ctor
Wavelength (nm)
330 335 340 345 350 355 3608
9
10
11
12
13
14
330 335 340 345 350 355 36015
16
17
18
19
20
21
330 335 340 345 350 355 3603
3.5
4
4.5
5
5.5
6
6.5
7
330 335 340 345 350 355 36010
10.5
11
11.5
12
12.5
13
13.5
1414
Fig. 1. AMFs of ozone for nadir (left) and limb geometry (right) as function of wavelength for different atmospheric scenarios (see legendand Table1 for details).
a result, for nadir observations, only a small part of all satel-lite measurements is affected by large discrepancies. In con-trast, for limb geometry light paths are much longer, result-ing in larger differences between light paths. Consequently astrong variation of the AMF with wavelength occurs alreadyat small SZA. Hence, every limb measurement is affectedsignificantly.
2.2 A new approach for accounting for the variability ofSCDs and AMFs in the DOAS fit
In the following, we introduce a new approach to takeinto account the spectral dependency of the SCD or AMFon wavelength in the DOAS fit, and thereby to minimizethe associated retrieval error. As summarized above (seeSects.2.1.2 and 2.1.3), the wavelength dependency of theSCD and the AMF results from scattering and absorptionprocesses (Eq.3). Both processes can be described by abroad band function of wavelength and/or the vertical opticaldepth (which itself shows a narrow band variation on wave-length). Thus, it is reasonable to formulate the SCD or theAMF as a function of wavelength and vertical optical depth.The Taylor series expansion for such a function generally canbe written as:
F(λ,υ) =
∞∑n=0
∞∑m=0
∂n∂m
∂λn∂υm
F(w,d)
n!m!(λ − w)n(υ − d)m (5)
F(λ,υ) can be either the SCD or AMF at wavelengthλ and vertical optical depthυ being approximated aroundwavelengthw and vertical optical depthd. n andm is theorder of derivation with respect to wavelengthλ and verticaloptical depthυ, respectively.
0 2 4 6 8x 10
12
10
15
20
25
30
35
40
45
50
O3 number density (molec./cm 3)
Alti
tude
(km
)main (subarctic), VCD = 460 DUmain scaled to VCD = 200 DUtropical scenario, VCD = 270 DU
Fig. 2. Different ozone profiles applied for the simulation of spectra,air mass factor calculations and sensitivity studies.
When taking into account the terms up to the 1st order, thewavelength and optical depth dependent SCD is describedby:
S(λ,υ) ≈ S∗
0(w,d) + Sλ(w,d)λ + Sυ(w,d)υ (6)
where the subscripts indicate the quantity with respect towhich the partial derivatives are performed andS∗
0(w,d) isthe sum of the 0-th order terms:
S∗
0(w,d) = S0 − Sλ · w − Sυ · d (7)
When considering the vertical optical depth of only thestrongest absorbers, e.g. ozone (assuming that the minorabsorbers cause only negligible contributions to the vertical
www.atmos-meas-tech.net/3/631/2010/ Atmos. Meas. Tech., 3, 631–653, 2010

636 J. Pukıte et al.: Extending DOAS for limb measurements in the UV
Table 3. Relation of the spectral quantities with Eq. (5) and to eachother.
Slant columndensity
Air mass fac-tor
Optical depth
Relation with SCD S(λ)S(λ)
VS(λ)·σ(λ)
Relation with AMF A(λ)·V A(λ) A(λ)·V ·σ(λ)
Relation with opti-cal depth
τ(λ)
σ (λ)
τ(λ)
V ·σ(λ)τ(λ)
Relation with VCD V ·A(λ)S(λ)
VV ·A(λ)·σ(λ)
Relation with verti-cal optical depth
υ(λ)·A(λ)
σ(λ)
τ(λ)
υ(λ)υ(λ)·A(λ)
Relation with inten-sity
lnIa(λ)
I (λ)
σ (λ)
lnIa(λ)
I (λ)
σ (λ)·Vln
Ia(λ)
I (λ)
(I (λ) – intensity,Ia(λ) – intensity without theabsorber of interest)
Relation with Tay-lor series expansionin Eq. (5)
F(λ) F (λ) F (λ)·σ(λ)
optical depth), the last term of Eq. (6) becomes (comparewith Eq.4 whenk=1):
Sυυ ≈ Sυ
υs︷︸︸︷Vs︸︷︷︸
Ss
σs = Ssσs (8)
whereSs is the product ofSυ and the VCD of the absorbers,andσs its cross-section.
Thus Eq. (6) becomes:
S(λ,υ) ≈ S∗
0(w,d) + Sλ(w,d)λ + Ss(w,d)σs (9)
In the DOAS equation, the optical depth of a particulartrace gas is a product of its SCD and cross-sectionσ . There-fore, the optical depth for an absorbera according to Eq. (9)is:
τa(λ,υ) ≈ S∗
0,aσa + Sλ,aλσa + Ss,aσsσa (10)
ParametersS∗
0,a , Sλ,a andSs,a are functions linearized at ar-bitrary wavelengthw and vertical optical depthd, and aredetermined by a common least squares DOAS fit. The to-tal wavelength dependent SCDS of the considered absorberthen results from Eq. (9).
If we consider only the absorption of the strong absorber(i.e. s=a) and write Eq. (10) for the optical depth of thisabsorber, it becomes:
τs(λ,υ) ≈ S∗
0,sσs + Sλ,sλσs + Ss,sσ2s (11)
Because the vertical optical depths of minor absorberscause only negligible contributions to the total optical depth,
it is necessary to consider the wavelength dependency of theSCD only for strong absorbers in practice. For example, inSect. 3 we show that the DOAS retrieval of BrO is improvedconsiderably when including the first order terms accordingto Eqs. (6) and (11) for the ozone SCD in the spectral anal-ysis (in the following, this first order approximation is re-ferred to as the Taylor series approach). Taking into accountthe wavelength dependency of the SCDs also for minor ab-sorbers further improves the retrieval (see Appendix C).
The mathematical relations for the spectroscopic quanti-ties SCD, AMF and optical depth are summarized in Table3.In Appendix A we show that the AMF (and thus also SCD)can be approximated by the Taylor series approach up to aprecision on the order of the simulation error of the AMFs.If the absorption of minor absorbers is not accounted for, theapproximation of AMFs is improved by one order of magni-tude in the fit window of 338–357 nm.
3 Application of the Taylor series approach to DOASretrieval from simulated spectra
In the following, we compare the new retrieval approach tostandard DOAS and the AMF modified DOAS by performingthe DOAS fit i.e. retrieving SCDs of several absorbing tracegases (ozone, BrO and NO2) from simulated spectra.
For the study, we apply spectra simulated by the RTMMcArtim with the main settings provided in Table1, cor-responding to the SCIAMACHY limb scanning sequence on23 March 2003 over Kiruna with a SZA of 75◦ at the tangentpoint (TP). The output of the RTM is the sun normalized ra-diance,I/I0. The wavelength range of 338–357 nm, whichis employed in our standard retrieval algorithm for BrO, isused, for details seeKuhl et al.(2008).
The standard DOAS approach for the absorption of ozone,NO2 and BrO according to Eq. (1) is:
lnI0
I= SO3σO3 + SNO2σNO2 + SBrOσBrO + P (12)
In the considered UV spectral range the absorption byozone dominates. Taking into account the first order Tay-lor series expansion for this strong absorber (s=O3 in Eqs.9and11), the DOAS equation becomes:
lnI0
I= S∗
0,O3σO3 + Sλ,O3λσO3 + SO3,O3σ
2O3︸ ︷︷ ︸
τO3
(13)
+ SNO2σNO2 + SBrOσBrO + P
In the common DOAS least squares fit of SCDs, the differ-ence between the left and right side of the equation is min-imized for all wavelengths. Slant column densities of NO2and BrO (SNO2 andSBrO) are fitted as wavelength indepen-dent in the study. The wavelength dependent SCD of ozone is
Atmos. Meas. Tech., 3, 631–653, 2010 www.atmos-meas-tech.net/3/631/2010/
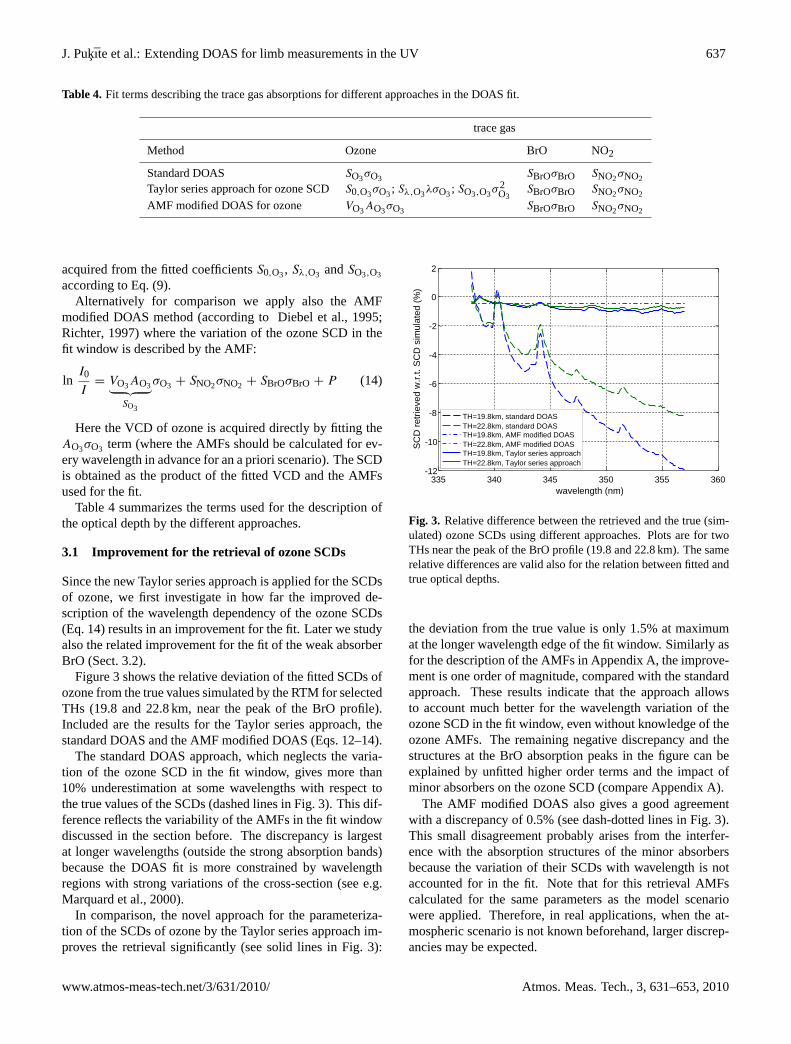
J. Pukıte et al.: Extending DOAS for limb measurements in the UV 637
Table 4. Fit terms describing the trace gas absorptions for different approaches in the DOAS fit.
trace gas
Method Ozone BrO NO2
Standard DOAS SO3σO3 SBrOσBrO SNO2σNO2
Taylor series approach for ozone SCDS0,O3σO3; Sλ,O3λσO3; SO3,O3σ2O3
SBrOσBrO SNO2σNO2
AMF modified DOAS for ozone VO3AO3σO3 SBrOσBrO SNO2σNO2
acquired from the fitted coefficientsS0,O3, Sλ,O3 andSO3,O3
according to Eq. (9).Alternatively for comparison we apply also the AMF
modified DOAS method (according toDiebel et al., 1995;Richter, 1997) where the variation of the ozone SCD in thefit window is described by the AMF:
lnI0
I= VO3AO3︸ ︷︷ ︸
SO3
σO3 + SNO2σNO2 + SBrOσBrO + P (14)
Here the VCD of ozone is acquired directly by fitting theAO3σO3 term (where the AMFs should be calculated for ev-ery wavelength in advance for an a priori scenario). The SCDis obtained as the product of the fitted VCD and the AMFsused for the fit.
Table4 summarizes the terms used for the description ofthe optical depth by the different approaches.
3.1 Improvement for the retrieval of ozone SCDs
Since the new Taylor series approach is applied for the SCDsof ozone, we first investigate in how far the improved de-scription of the wavelength dependency of the ozone SCDs(Eq.14) results in an improvement for the fit. Later we studyalso the related improvement for the fit of the weak absorberBrO (Sect.3.2).
Figure3 shows the relative deviation of the fitted SCDs ofozone from the true values simulated by the RTM for selectedTHs (19.8 and 22.8 km, near the peak of the BrO profile).Included are the results for the Taylor series approach, thestandard DOAS and the AMF modified DOAS (Eqs.12–14).
The standard DOAS approach, which neglects the varia-tion of the ozone SCD in the fit window, gives more than10% underestimation at some wavelengths with respect tothe true values of the SCDs (dashed lines in Fig.3). This dif-ference reflects the variability of the AMFs in the fit windowdiscussed in the section before. The discrepancy is largestat longer wavelengths (outside the strong absorption bands)because the DOAS fit is more constrained by wavelengthregions with strong variations of the cross-section (see e.g.Marquard et al., 2000).
In comparison, the novel approach for the parameteriza-tion of the SCDs of ozone by the Taylor series approach im-proves the retrieval significantly (see solid lines in Fig.3):
335 340 345 350 355 360-12
-10
-8
-6
-4
-2
0
2
TH=19.8km, AMF modified DOASTH=22.8km, AMF modified DOAS
TH=19.8km, standard DOASTH=22.8km, standard DOAS
TH=19.8km, Taylor series approachTH=22.8km, Taylor series approach
SC
D re
triev
ed w
.r.t.
SC
D s
imul
ated
(%)
wavelength (nm)
Fig. 3. Relative difference between the retrieved and the true (sim-ulated) ozone SCDs using different approaches. Plots are for twoTHs near the peak of the BrO profile (19.8 and 22.8 km). The samerelative differences are valid also for the relation between fitted andtrue optical depths.
the deviation from the true value is only 1.5% at maximumat the longer wavelength edge of the fit window. Similarly asfor the description of the AMFs in Appendix A, the improve-ment is one order of magnitude, compared with the standardapproach. These results indicate that the approach allowsto account much better for the wavelength variation of theozone SCD in the fit window, even without knowledge of theozone AMFs. The remaining negative discrepancy and thestructures at the BrO absorption peaks in the figure can beexplained by unfitted higher order terms and the impact ofminor absorbers on the ozone SCD (compare Appendix A).
The AMF modified DOAS also gives a good agreementwith a discrepancy of 0.5% (see dash-dotted lines in Fig.3).This small disagreement probably arises from the interfer-ence with the absorption structures of the minor absorbersbecause the variation of their SCDs with wavelength is notaccounted for in the fit. Note that for this retrieval AMFscalculated for the same parameters as the model scenariowere applied. Therefore, in real applications, when the at-mospheric scenario is not known beforehand, larger discrep-ancies may be expected.
www.atmos-meas-tech.net/3/631/2010/ Atmos. Meas. Tech., 3, 631–653, 2010

638 J. Pukıte et al.: Extending DOAS for limb measurements in the UV
0 1 2 3 410
15
20
25
30
35
Alti
tude
(km
)
true profilestandard DOASAMF modified DOASTaylor s. approachT. s. appr. box AMF at 344.2 nm
-40 -30 -20 -10 0 10 20 30 4010
15
20
25
30
35
Relative difference (%)
Alti
tude
(km
)
0 1 2 3 4 5 610
15
20
25
30
35
Slant column density (x1014 molec./cm2)
Tang
ent H
eigh
t (km
)standard DOASAMF modified DOASTaylor s. approach
Number density (x107 molec./cm3)
Fig. 4. BrO SCDs (left panel) and the vertical concentration profiles (middle panel) retrieved by different approaches (green: standardDOAS, violet: AMF modified DOAS, red: Taylor series approach, dashed red: AMFs for the Taylor series approach evaluated at a singlewavelength of 344.2 nm). The right panel shows the relative difference of the retrieved profiles to the true concentration profile applied forthe simulation.
At certain wavelengths the discrepancy of the SCD re-trieved by the standard DOAS with the true SCD is muchsmaller than 10%, for wavelengths around 340 nm, even anagreement can be found. Although this agreement cannotbe extrapolated for every scenario, it is possible to retrievea rather accurate ozone profile by applying the AMF for thewavelength region with the smallest discrepancy. Thus theintroduced Taylor series approach would not always be nec-essary for the ozone profile retrieval. However, the unfittedozone absorption structures that arise from not taking intoaccount the wavelength dependency of the ozone SCD causelarge errors in the retrieval of minor absorbers as is shown indetail in the following section.
3.2 Improvement for the retrieval of BrO
In the following, we show that the improvement in the ozoneSCD retrieval by the Taylor series approach results also inan improvement of the BrO SCD retrieval (Sect.3.2.1) andtherefore in a much better agreement of the retrieved BrOvertical profile with the true simulated profile, compared tostandard DOAS (Sect.3.2.2).
3.2.1 Slant column density of BrO
For the same scenario and spectra as in Sect.3.1, we now in-vestigate the values retrieved for the BrO SCDs by the threeapproaches (i.e. standard DOAS, Taylor series approach for
the SCDs of ozone, and AMF modified DOAS for ozone),see Fig.4 (left panel). The values for standard DOAS (greenline) are by up to 15% larger compared to the Taylor seriesapproach (red line) or AMF modified DOAS (magenta line).This can be explained by unfitted structures in the fit residual(see Fig.5) that increase the retrieval error for the standardDOAS approach: As illustrated in Fig.5, residual structuresaround the ozone absorption bands occur because the varia-tion of the SCD of ozone within the fit window is not takeninto account. These ozone specific absorption structures re-main because they are not (completely) allocated to other fitparameters. However, misallocation of some optical depth ofozone to BrO takes place: The underestimation of the SCD(or optical depth) of ozone at the absorption bands of BrO(compare e.g. SCD of ozone at 338 nm, where the strongestBrO absorption band occurs, in Fig.3) leads to an overesti-mation of the retrieved SCDs of BrO in the standard DOAS.This dependency of the retrieved BrO SCDs on ozone ab-sorption is investigated in more detail in Appendix C.
On the other hand, both the Taylor series approach andAMF modified DOAS reduce the residual structures by oneorder of magnitude (see Fig.5, bottom panel). Thereforealso the error of the fit is reduced significantly. The rea-son for these improvements is that the optical depth varia-tion of ozone is described better for the whole fit window.Accordingly, BrO SCDs retrieved by both methods agreewell with the simulated BrO SCDs at wavelengths close to
Atmos. Meas. Tech., 3, 631–653, 2010 www.atmos-meas-tech.net/3/631/2010/

J. Pukıte et al.: Extending DOAS for limb measurements in the UV 639
335 340 345 350 355 360
0
5
10x 10-3
335 340 345 350 355 360-4
-2
0
2
4x 10⁻³
335 340 345 350 355 360
0
5
10x 10-3
335 340 345 350 355 360-4
-2
0
2
4x 10⁻³
335 340 345 350 355 360
0
5
10x 10-3
335 340 345 350 355 360-4
-2
0
2
4x 10⁻³
wavelength (nm)wavelength (nm)
wavelength (nm)
Res
idua
l
Res
idua
lBr
Oop
tical
dep
th
BrO
optic
al d
epth
Standard DOAS Taylor series approach AMF modified DOAS
truefittedfitted+resid.
truefittedfitted+resid.
truefittedfitted+resid.
BrO
optic
al d
epth
wavelength (nm) wavelength (nm)
wavelength (nm)
Res
idua
l
Fig. 5. Left panel: Retrieved optical depth of BrO for TH=22.8 km by the standard DOAS fit. Middle panel: same but for the Taylor seriesapproach. Right panel: same but for AMF modified DOAS for ozone. Top panels show the true optical depth of BrO (blue), fitted opticaldepth of BrO (red) and the optical depth plus residual structures (green). The bottom panels show the residuals alone.
the strongest absorption peaks of BrO, and the discrepancyshows only negligible influence by ozone absorption (seealso Appendix C).
3.2.2 Improvement for the retrieved BrO profile
In the next step, the BrO profile is determined by inversionof the BrO SCDs. For this purpose, we apply our generalretrieval algorithm based on the linear optimal estimationmethod (Rodgers, 2000) and described in detail inPukıte etal. (2006) andKuhl et al.(2008). The a priori settings are se-lected assuring that the measurement response (i.e., the sumof the rows of the averaging kernel matrix) is close to unity ataltitudes between 13 to 35 km for all of the three approaches(standard DOAS, Taylor series approach and AMF modifiedDOAS), i.e. thereby minimizing the impact of a priori as-sumptions. To achieve this, an a priori profile as 2/3 of thetrue profile is used, with an a priori uncertainty of 100% ofits maximum value. The retrieval is performed on a 1 kmaltitude grid. For smoothing purposes, a correlation length(seeRodgers, 2000, page 38) of 3.5 km is introduced in thea priori covariance matrix. With these settings, the impact ofthe a priori is minimized for this altitude range so that evena shift of the a priori profile by 3 km downwards results inless than∼2% differences in retrieved profiles both for theTaylor series approach and AMF modified DOAS, and lessthan∼5% changes for the standard DOAS.
Box AMFs for the inversion are calculated for the sameatmospheric conditions as the simulated spectra, in orderto limit related systematical retrieval errors in the compar-ison of the three approaches. Box AMFs are derived by aweighted average calculated at different wavelengths basedon an approach byMarquard et al.(2000) that the fit isconstrained stronger by absorption structures that vary more
rapidly with wavelength. An alternative retrieval is per-formed with box AMFs calculated at a single wavelengthof 344.2 nm. At this wavelength, the retrieved BrO SCDsagree with the true SCDs of BrO within∼3% for differentozone profiles as it is deduced from sensitivity studies, seee.g. Fig.C1, second panel from top, in the Appendix C.
The obtained vertical concentration profiles are shown to-gether with the true profile in Fig.4 (middle panel), the dif-ference is plotted in the right panel. The profile retrievedfrom SCDs acquired by standard DOAS shows a shift up-wards (by∼1.5 km) and too large values at the peak by∼10%. The overestimation above the peak is more than 20 or25% for altitudes with large ozone concentration, i.e. around20 km (compare with Fig.2). On the other hand, the profileobtained by AMF modified DOAS or the Taylor series ap-proach agrees much better with the true profile. For altitudesbetween 15 and 28 km the agreement for the Taylor seriesapproach is better than 5%. For altitudes below 15 km thediscrepancy increases to∼10% (note that below 12 km themeasurement response is very low).
Thus, although the wavelength dependency of the SCDsof minor absorbers is not taken into account, the retrieval ofBrO is improved considerably by taking the variability of theSCD of ozone in the fit window into consideration.
The disagreement around altitudes of 19 km for the AMFmodified DOAS and the slightly lower values for the Taylorseries approach probably arise from the interference with theabsorption structures of the minor absorbers (note that bothAMF modified DOAS and the Taylor series DOAS are per-formed only for the SCD of ozone).
The red dashed line in Fig.4 shows the profile obtainedby inversion of the SCDs acquired by the Taylor series ap-proach, when box AMFs calculated at a single wavelength(344.2 nm) are applied. This also shows a good agreement
www.atmos-meas-tech.net/3/631/2010/ Atmos. Meas. Tech., 3, 631–653, 2010
640 J. Pukıte et al.: Extending DOAS for limb measurements in the UV
main fit window of 338 – 357 nm
330 335 340 345 350 355 3600
0.5
1
1.5
2
2.5
wavelength (nm)
BrO
cros
s-se
ctio
ns (x
10 –1
7 cm
2 )
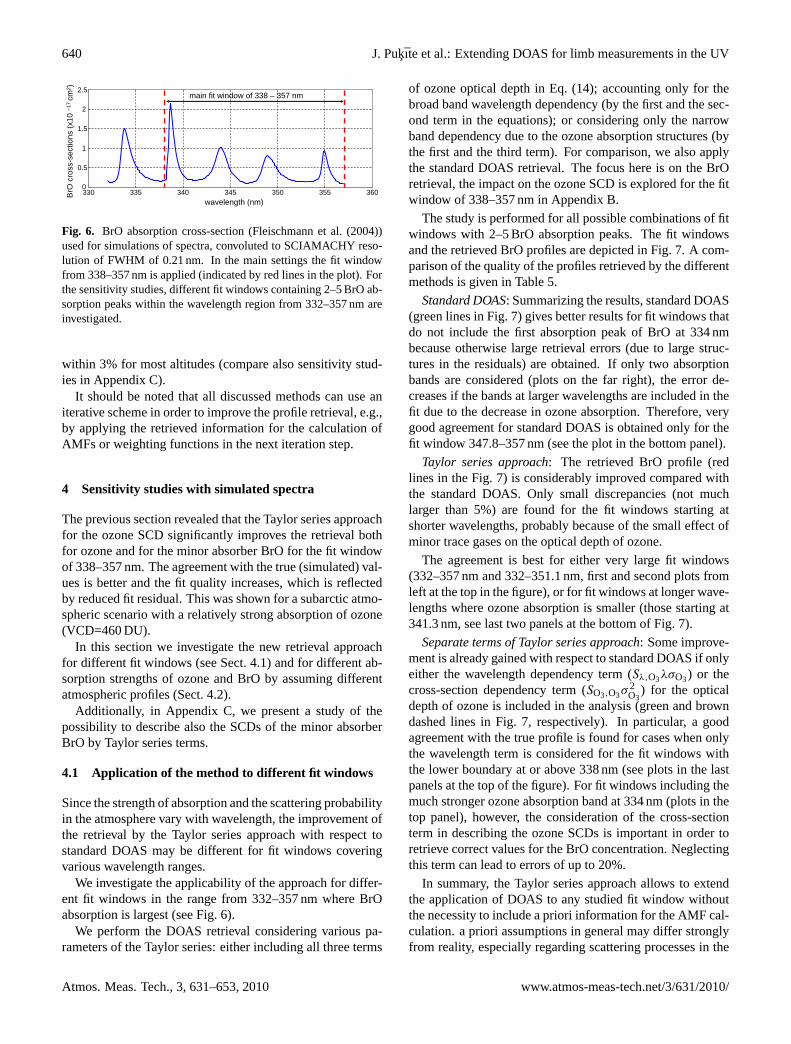
Fig. 6. BrO absorption cross-section (Fleischmann et al.(2004))used for simulations of spectra, convoluted to SCIAMACHY reso-lution of FWHM of 0.21 nm. In the main settings the fit windowfrom 338–357 nm is applied (indicated by red lines in the plot). Forthe sensitivity studies, different fit windows containing 2–5 BrO ab-sorption peaks within the wavelength region from 332–357 nm areinvestigated.
within 3% for most altitudes (compare also sensitivity stud-ies in Appendix C).
It should be noted that all discussed methods can use aniterative scheme in order to improve the profile retrieval, e.g.,by applying the retrieved information for the calculation ofAMFs or weighting functions in the next iteration step.
4 Sensitivity studies with simulated spectra
The previous section revealed that the Taylor series approachfor the ozone SCD significantly improves the retrieval bothfor ozone and for the minor absorber BrO for the fit windowof 338–357 nm. The agreement with the true (simulated) val-ues is better and the fit quality increases, which is reflectedby reduced fit residual. This was shown for a subarctic atmo-spheric scenario with a relatively strong absorption of ozone(VCD=460 DU).
In this section we investigate the new retrieval approachfor different fit windows (see Sect.4.1) and for different ab-sorption strengths of ozone and BrO by assuming differentatmospheric profiles (Sect.4.2).
Additionally, in Appendix C, we present a study of thepossibility to describe also the SCDs of the minor absorberBrO by Taylor series terms.
4.1 Application of the method to different fit windows
Since the strength of absorption and the scattering probabilityin the atmosphere vary with wavelength, the improvement ofthe retrieval by the Taylor series approach with respect tostandard DOAS may be different for fit windows coveringvarious wavelength ranges.
We investigate the applicability of the approach for differ-ent fit windows in the range from 332–357 nm where BrOabsorption is largest (see Fig.6).
We perform the DOAS retrieval considering various pa-rameters of the Taylor series: either including all three terms
of ozone optical depth in Eq. (14); accounting only for thebroad band wavelength dependency (by the first and the sec-ond term in the equations); or considering only the narrowband dependency due to the ozone absorption structures (bythe first and the third term). For comparison, we also applythe standard DOAS retrieval. The focus here is on the BrOretrieval, the impact on the ozone SCD is explored for the fitwindow of 338–357 nm in Appendix B.
The study is performed for all possible combinations of fitwindows with 2–5 BrO absorption peaks. The fit windowsand the retrieved BrO profiles are depicted in Fig.7. A com-parison of the quality of the profiles retrieved by the differentmethods is given in Table5.
Standard DOAS: Summarizing the results, standard DOAS(green lines in Fig.7) gives better results for fit windows thatdo not include the first absorption peak of BrO at 334 nmbecause otherwise large retrieval errors (due to large struc-tures in the residuals) are obtained. If only two absorptionbands are considered (plots on the far right), the error de-creases if the bands at larger wavelengths are included in thefit due to the decrease in ozone absorption. Therefore, verygood agreement for standard DOAS is obtained only for thefit window 347.8–357 nm (see the plot in the bottom panel).
Taylor series approach: The retrieved BrO profile (redlines in the Fig.7) is considerably improved compared withthe standard DOAS. Only small discrepancies (not muchlarger than 5%) are found for the fit windows starting atshorter wavelengths, probably because of the small effect ofminor trace gases on the optical depth of ozone.
The agreement is best for either very large fit windows(332–357 nm and 332–351.1 nm, first and second plots fromleft at the top in the figure), or for fit windows at longer wave-lengths where ozone absorption is smaller (those starting at341.3 nm, see last two panels at the bottom of Fig.7).
Separate terms of Taylor series approach: Some improve-ment is already gained with respect to standard DOAS if onlyeither the wavelength dependency term (Sλ,O3λσO3) or thecross-section dependency term (SO3,O3σ
2O3
) for the opticaldepth of ozone is included in the analysis (green and browndashed lines in Fig.7, respectively). In particular, a goodagreement with the true profile is found for cases when onlythe wavelength term is considered for the fit windows withthe lower boundary at or above 338 nm (see plots in the lastpanels at the top of the figure). For fit windows including themuch stronger ozone absorption band at 334 nm (plots in thetop panel), however, the consideration of the cross-sectionterm in describing the ozone SCDs is important in order toretrieve correct values for the BrO concentration. Neglectingthis term can lead to errors of up to 20%.
In summary, the Taylor series approach allows to extendthe application of DOAS to any studied fit window withoutthe necessity to include a priori information for the AMF cal-culation. a priori assumptions in general may differ stronglyfrom reality, especially regarding scattering processes in the
Atmos. Meas. Tech., 3, 631–653, 2010 www.atmos-meas-tech.net/3/631/2010/

J. Pukıte et al.: Extending DOAS for limb measurements in the UV 641
Upper boundaryat 357 nm
Upper boundaryat 351.1 nm
Upper boundaryat 346.6 nm
Upper boundaryat 339.9 nm
Low
er b
ound
ary
at 3
32nm
Low
er b
ound
ary
at 3
38nm
Low
er b
ound
ary
at 3
41.3
nmLo
wer
bou
ndar
yat
347
.8nm
-2 -1 0 1 2 3 410
15
20
25
30
35
number density (107 cm-3)
Altit
ude
(km
)
-2 -1 0 1 2 3 410
15
20
25
30
35
number density (107 cm-3)
Altit
ude
(km
)
-2 -1 0 1 2 3 410
15
20
25
30
35
number density (107 cm-3)
Altit
ude
(km
)
-2 -1 0 1 2 3 410
15
20
25
30
35
number density (107 cm-3)
Altit
ude
(km
)
-2 -1 0 1 2 3 410
15
20
25
30
35
number density (107 cm-3)
Altit
ude
(km
)
-2 -1 0 1 2 3 410
15
20
25
30
35
number density (107 cm-3)
Altit
ude
(km
)
-2 -1 0 1 2 3 410
15
20
25
30
35
number density (107 cm-3)
Altit
ude
(km
)
-2 -1 0 1 2 3 410
15
20
25
30
35
number density (107 cm-3)
Altit
ude
(km
)
-2 -1 0 1 2 3 410
15
20
25
30
35
number density (107 cm-3)
Altit
ude
(km
)
-2 -1 0 1 2 3 410
15
20
25
30
35
number density (107 cm-3)
Altit
ude
(km
)
true profile used for spectra simulations
standard DOAS
Taylor series appr. for ozone SCDs (wavelength and ozone cross-sect. terms)
Taylor series appr. for ozone SCDs (only wavelength term)
Taylor series appr. for ozone SCDs (only ozone cross-section term)
Retrieved BrO profiles by different methods
Fig. 7. Vertical profiles of the BrO number density retrieved from the simulated spectra for different fit windows and different retrievalapproaches. Plots in the same row correspond to the same lower boundary of the fit window, plots in the same column to the same upperboundary of the fit window.
www.atmos-meas-tech.net/3/631/2010/ Atmos. Meas. Tech., 3, 631–653, 2010
642 J. Pukıte et al.: Extending DOAS for limb measurements in the UV
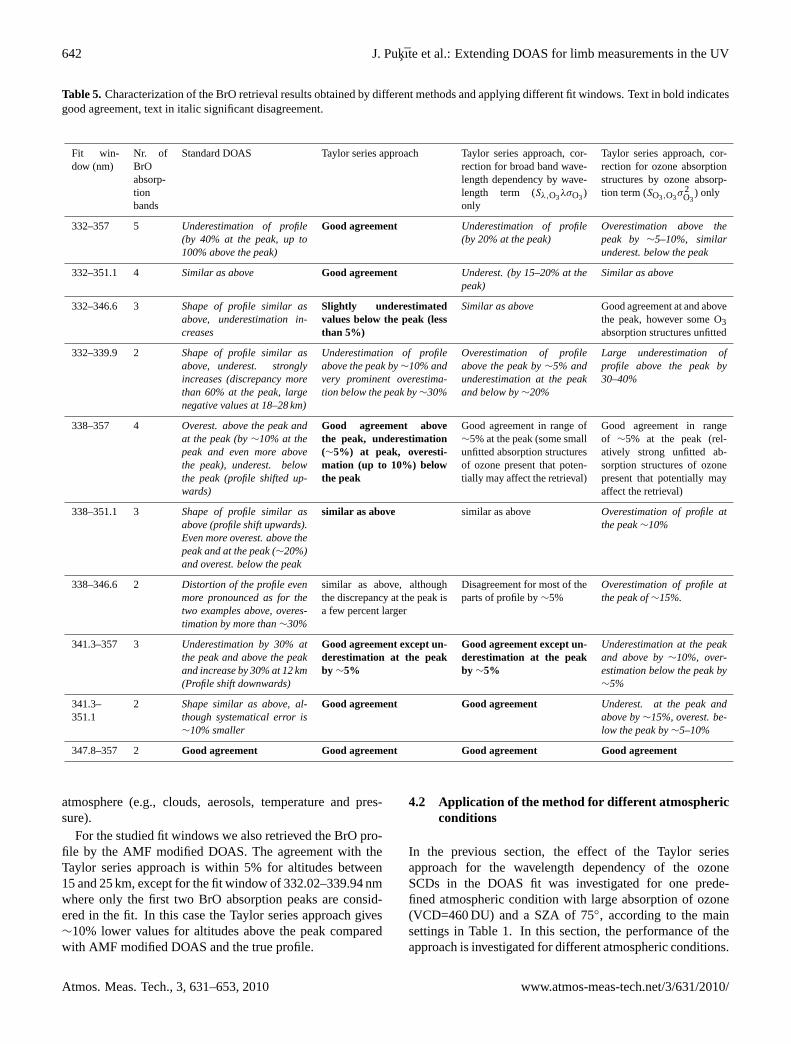
Table 5. Characterization of the BrO retrieval results obtained by different methods and applying different fit windows. Text in bold indicatesgood agreement, text in italic significant disagreement.
Fit win-dow (nm)
Nr. ofBrOabsorp-tionbands
Standard DOAS Taylor series approach Taylor series approach, cor-rection for broad band wave-length dependency by wave-length term (Sλ,O3λσO3)only
Taylor series approach, cor-rection for ozone absorptionstructures by ozone absorp-tion term (SO3,O3σ
2O3
) only
332–357 5 Underestimation of profile(by 40% at the peak, up to100% above the peak)
Good agreement Underestimation of profile(by 20% at the peak)
Overestimation above thepeak by ∼5–10%, similarunderest. below the peak
332–351.1 4 Similar as above Good agreement Underest. (by 15–20% at thepeak)
Similar as above
332–346.6 3 Shape of profile similar asabove, underestimation in-creases
Slightly underestimatedvalues below the peak (lessthan 5%)
Similar as above Good agreement at and abovethe peak, however some O3absorption structures unfitted
332–339.9 2 Shape of profile similar asabove, underest. stronglyincreases (discrepancy morethan 60% at the peak, largenegative values at 18–28 km)
Underestimation of profileabove the peak by∼10% andvery prominent overestima-tion below the peak by∼30%
Overestimation of profileabove the peak by∼5% andunderestimation at the peakand below by∼20%
Large underestimation ofprofile above the peak by30–40%
338–357 4 Overest. above the peak andat the peak (by∼10% at thepeak and even more abovethe peak), underest. belowthe peak (profile shifted up-wards)
Good agreement abovethe peak, underestimation(∼5%) at peak, overesti-mation (up to 10%) belowthe peak
Good agreement in range of∼5% at the peak (some smallunfitted absorption structuresof ozone present that poten-tially may affect the retrieval)
Good agreement in rangeof ∼5% at the peak (rel-atively strong unfitted ab-sorption structures of ozonepresent that potentially mayaffect the retrieval)
338–351.1 3 Shape of profile similar asabove (profile shift upwards).Even more overest. above thepeak and at the peak (∼20%)and overest. below the peak
similar as above similar as above Overestimation of profile atthe peak∼10%
338–346.6 2 Distortion of the profile evenmore pronounced as for thetwo examples above, overes-timation by more than∼30%
similar as above, althoughthe discrepancy at the peak isa few percent larger
Disagreement for most of theparts of profile by∼5%
Overestimation of profile atthe peak of∼15%.
341.3–357 3 Underestimation by 30% atthe peak and above the peakand increase by 30% at 12 km(Profile shift downwards)
Good agreement except un-derestimation at the peakby ∼5%
Good agreement except un-derestimation at the peakby ∼5%
Underestimation at the peakand above by∼10%, over-estimation below the peak by∼5%
341.3–351.1
2 Shape similar as above, al-though systematical error is∼10% smaller
Good agreement Good agreement Underest. at the peak andabove by∼15%, overest. be-low the peak by∼5–10%
347.8–357 2 Good agreement Good agreement Good agreement Good agreement
atmosphere (e.g., clouds, aerosols, temperature and pres-sure).
For the studied fit windows we also retrieved the BrO pro-file by the AMF modified DOAS. The agreement with theTaylor series approach is within 5% for altitudes between15 and 25 km, except for the fit window of 332.02–339.94 nmwhere only the first two BrO absorption peaks are consid-ered in the fit. In this case the Taylor series approach gives∼10% lower values for altitudes above the peak comparedwith AMF modified DOAS and the true profile.
4.2 Application of the method for different atmosphericconditions
In the previous section, the effect of the Taylor seriesapproach for the wavelength dependency of the ozoneSCDs in the DOAS fit was investigated for one prede-fined atmospheric condition with large absorption of ozone(VCD=460 DU) and a SZA of 75◦, according to the mainsettings in Table1. In this section, the performance of theapproach is investigated for different atmospheric conditions.
Atmos. Meas. Tech., 3, 631–653, 2010 www.atmos-meas-tech.net/3/631/2010/
J. Pukıte et al.: Extending DOAS for limb measurements in the UV 643
0 1 2 3 410
15
20
25
30
35
Number density (x107molec./cm3)
Alti
tude
(km
)true profilestandard DOAS, 460 DUstandard DOAS, 200 DUTaylor s. approach, 460 DUTaylor s. approach, 200 DU
-40 -30 -20 -10 0 10 20 30 4010
15
20
25
30
35
Relative difference (%)
Alti
tude
(km
)
Subarctic scenario
0 0.5 1 1.515
20
25
30
35
Number density (x107molec./cm3)
Alti
tude
(km
)
true profilest. DOAS, trop.O3
st. DOAS, 200 DUTaylor s. appr, trop.O3
Taylor s. appr.,200 DU
15
20
25
30
35
Alti
tude
(km
)
-40 -30 -20 -10 0 10 20 30 40Relative difference (%)
Tropical scenario
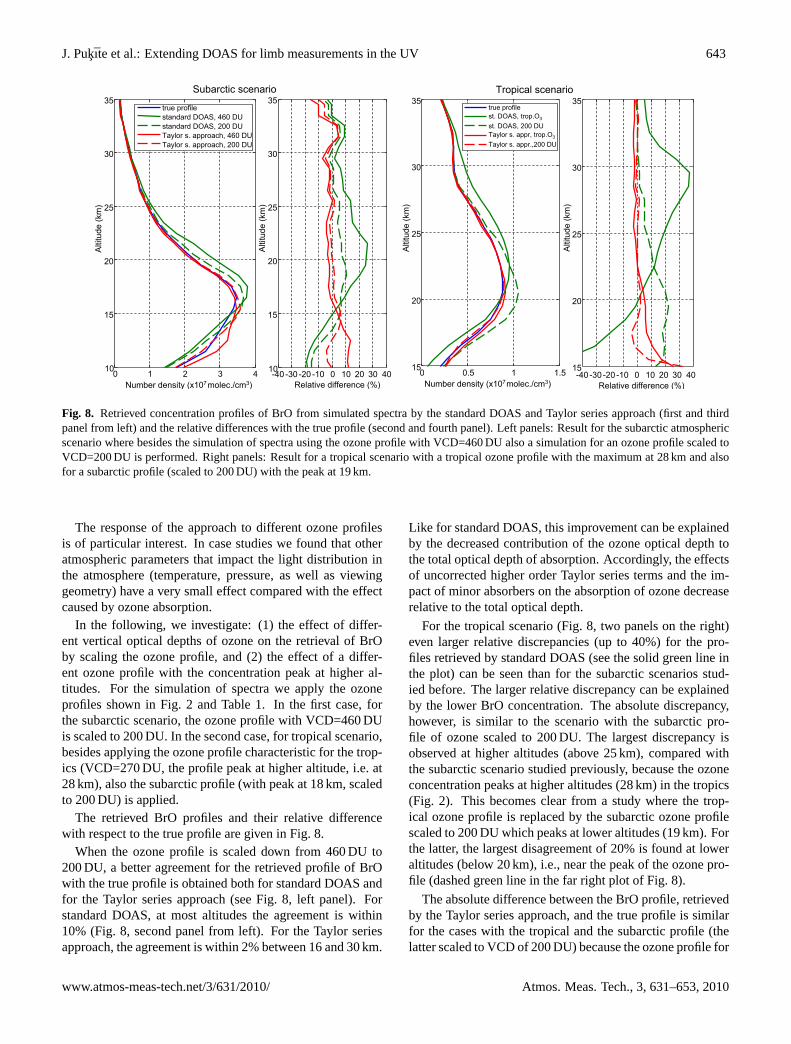
Fig. 8. Retrieved concentration profiles of BrO from simulated spectra by the standard DOAS and Taylor series approach (first and thirdpanel from left) and the relative differences with the true profile (second and fourth panel). Left panels: Result for the subarctic atmosphericscenario where besides the simulation of spectra using the ozone profile with VCD=460 DU also a simulation for an ozone profile scaled toVCD=200 DU is performed. Right panels: Result for a tropical scenario with a tropical ozone profile with the maximum at 28 km and alsofor a subarctic profile (scaled to 200 DU) with the peak at 19 km.
The response of the approach to different ozone profilesis of particular interest. In case studies we found that otheratmospheric parameters that impact the light distribution inthe atmosphere (temperature, pressure, as well as viewinggeometry) have a very small effect compared with the effectcaused by ozone absorption.
In the following, we investigate: (1) the effect of differ-ent vertical optical depths of ozone on the retrieval of BrOby scaling the ozone profile, and (2) the effect of a differ-ent ozone profile with the concentration peak at higher al-titudes. For the simulation of spectra we apply the ozoneprofiles shown in Fig.2 and Table1. In the first case, forthe subarctic scenario, the ozone profile with VCD=460 DUis scaled to 200 DU. In the second case, for tropical scenario,besides applying the ozone profile characteristic for the trop-ics (VCD=270 DU, the profile peak at higher altitude, i.e. at28 km), also the subarctic profile (with peak at 18 km, scaledto 200 DU) is applied.
The retrieved BrO profiles and their relative differencewith respect to the true profile are given in Fig.8.
When the ozone profile is scaled down from 460 DU to200 DU, a better agreement for the retrieved profile of BrOwith the true profile is obtained both for standard DOAS andfor the Taylor series approach (see Fig.8, left panel). Forstandard DOAS, at most altitudes the agreement is within10% (Fig.8, second panel from left). For the Taylor seriesapproach, the agreement is within 2% between 16 and 30 km.
Like for standard DOAS, this improvement can be explainedby the decreased contribution of the ozone optical depth tothe total optical depth of absorption. Accordingly, the effectsof uncorrected higher order Taylor series terms and the im-pact of minor absorbers on the absorption of ozone decreaserelative to the total optical depth.
For the tropical scenario (Fig.8, two panels on the right)even larger relative discrepancies (up to 40%) for the pro-files retrieved by standard DOAS (see the solid green line inthe plot) can be seen than for the subarctic scenarios stud-ied before. The larger relative discrepancy can be explainedby the lower BrO concentration. The absolute discrepancy,however, is similar to the scenario with the subarctic pro-file of ozone scaled to 200 DU. The largest discrepancy isobserved at higher altitudes (above 25 km), compared withthe subarctic scenario studied previously, because the ozoneconcentration peaks at higher altitudes (28 km) in the tropics(Fig. 2). This becomes clear from a study where the trop-ical ozone profile is replaced by the subarctic ozone profilescaled to 200 DU which peaks at lower altitudes (19 km). Forthe latter, the largest disagreement of 20% is found at loweraltitudes (below 20 km), i.e., near the peak of the ozone pro-file (dashed green line in the far right plot of Fig.8).
The absolute difference between the BrO profile, retrievedby the Taylor series approach, and the true profile is similarfor the cases with the tropical and the subarctic profile (thelatter scaled to VCD of 200 DU) because the ozone profile for
www.atmos-meas-tech.net/3/631/2010/ Atmos. Meas. Tech., 3, 631–653, 2010

644 J. Pukıte et al.: Extending DOAS for limb measurements in the UV
the tropics has a similar VCD (270 DU). In relative values,the discrepancy for the tropical profile is lower than 5% foraltitudes above 20 km, but increases for altitudes below.
5 Application of the method to SCIAMACHYmeasurements
In the previous two sections, we showed the advantage of theTaylor series approach for the retrieval of BrO vertical pro-files from simulated spectra. In the following we study thepossibility to apply the method for the retrieval of BrO ver-tical profiles from SCIAMACHY limb measurements. Weperform the retrieval of SCDs by standard DOAS and bythe Taylor series approach and compare the retrieved verticalconcentration profiles with correlated balloon measurementsprovided byDorf et al.(2006, 2008).
Note that in comparison to the simulation studies largererrors are expected for real measurements. These include ef-fects of the temperature dependency of the cross-sections, thespectral calibration, the Ring effect and instrumental prob-lems. For the comparison of measurements from differentinstruments, trajectory modelling and photochemical correc-tion for balloon measurements contribute to additional uncer-tainties. Also note that for the balloon retrieval, a differentBrO cross-section (Wahner et al., 1988) for the DOAS fit wasused and the retrieval was performed in another fit window.
5.1 Instrument description
The SCIAMACHY instrument on the ENVISAT satellite op-erates in a near polar sun synchronous orbit with an inclina-tion from the equatorial plane of∼98.5◦. It performs oneorbit in approximately 100 min with equator crossing timeof 10:00 in descending node. The satellite probes the atmo-sphere at the day side of Earth in alternating sequences ofnadir and limb measurements. Limb scans in one scanningsequence are performed with approximately 3.3 km elevationsteps at the TP in flight direction. The cross track swathis 960 km at the TP and consists of up to 4 pixels for theUV/VIS spectral range. The field of view (FOV) is 0.045◦ inelevation and 1.8◦ in azimuth. This corresponds to approx-imately 2.5 km in vertical direction and 110 km in horizon-tal direction at TP, respectively. SCIAMACHY measures inthe UV-VIS-NIR spectral range from 240 to 2380 nm with aspectral resolution of approximately 0.25 to 0.55 nm in theUV-VIS range. More instrumental details can be found inBovensmann et al.(1999).
5.2 Retrieval of BrO
For the retrieval of BrO vertical profiles from the SCIA-MACHY limb measurements, an algorithm developed in ourgroup is applied (Kuhl, 2005; Pukıte et al., 2006; Kuhl et al.,2008). The retrieval of vertical BrO profiles is performed in
two steps in a similar way as for the simulated spectra studiesabove.
In the first step, the retrieval of SCDs, we apply the sameretrieval settings as described inKuhl et al. (2008). Thefit window ranges from 338.01–357.25 nm and two ozonecross-sections (at 223 and 243 K) byBogumil et al.(2003)are included in the fit in order to account for the tempera-ture dependency of ozone cross-section. In the current study,the cross-section at 243 K is replaced with the one at 203 Kfor cases when temperature drops below 210 K in the lowerstratosphere in order to apply the cross-sections best fittingto the actual temperature profile.
For the Taylor series approach we implement the descrip-tion of wavelength and absorption dependency of the ozoneSCD in the fit window in the same way as for the simulatedspectra: compared to the standard DOAS approach the ozonecross-section term at 223 K is replaced by the three termsgiven in Eq. (14). The second cross-section term at 243 K (or203 K) is left unchanged as the purpose of it is to account forthe dependency of the ozone cross-section on temperature.We simulated spectra accounting for the temperature depen-dency of the ozone cross-section and found that the spectralfeatures of ozone absorption due to temperature are well ac-counted for with this one additional term. Expansion of itin the Taylor series does not give additional improvement.Also orthogonalization of the ozone cross-section of 243 K(or 203 K) with respect to the cross-section of 223 K doesnot affect the retrieval.
For the second step of the retrieval, the inversion of theBrO SCDs to a number density profile of BrO, we applythe RTM McArtim (Deutschmann, 2009), like for the sim-ulations above. Box AMFs according to the geometry ofeach individual SCIAMACHY measurement are calculatedat the single wavelength of 344.2 nm (as shown for exam-ple in Sect.3.2.2, see dashed red line in Fig.4). In casestudies we found that for this wavelength the retrieved andthe true SCDs agree within∼3% for different ozone profiles(see e.g. Fig.C1, second panel from top, in the Appendix C).Thus with this practical solution it is not necessary to cal-culate the box AMFs at all wavelengths which would be avery time consuming task for every SCIAMACHY measure-ment. The inversion is performed by the optimal estimationmethod (Rodgers, 2000). It is performed on the measurementgrid with an a priori uncertainty of 100% and the off-diagonalelements of the covariance matrix equal to zero.
5.3 Comparison of SCIAMACHY BrO measurementswith collocated balloon measurements
A number of balloon measurements were performed to val-idate the SCIAMACHY instrument (e.g.Butz et al., 2006;Dorf et al., 2006). The BrO profiles taken for this studywere acquired from direct solar spectra measurements byLPMA/DOAS (Dorf et al., 2006). A photochemical correc-tion and air mass trajectory modelling was performed for the
Atmos. Meas. Tech., 3, 631–653, 2010 www.atmos-meas-tech.net/3/631/2010/

J. Pukıte et al.: Extending DOAS for limb measurements in the UV 645
balloon measurements in order to match the same locationand atmospheric conditions (i.e., SZA) as for SCIAMACHY.A time mismatch between the satellite observation and theair mass trajectory starting at the balloon observation smallerthan 1 h and a distance mismatch smaller than 500 km wereallowed. If no SCIAMACHY observations fulfill these cri-teria, the distance criterion was extended to 1000 km. Forthe backward and forward trajectory modelling and for fur-ther information on the balloon measurements and the profileretrieval please refer toDorf et al.(2006, 2008).
In Fig. 9, the BrO profiles retrieved by SCIAMACHYare compared with the correlated balloon observations per-formed for: Kiruna (67.9◦ N, 21.1◦ E), Aire sur l‘Adour(43.7◦ N, 0.3◦ E) and Teresina (5.1◦ S, 42.9◦ W) in March,October and June, respectively. The altitude range at whichthe modelled trajectories of air masses measured by balloonmatch with the TPs of the SCIAMACHY limb observationsare indicated by gray shading in the figure.
It can be clearly observed that the profiles retrieved fromthe SCDs acquired by standard DOAS generally show largervalues compared with the Taylor series approach (violetdashed line in Fig.9, right hand side). The difference be-tween both retrievals is about 10 to 25%, in accordance withthe findings for the studies on the simulated spectra (seeSect.4.2).
Also, the dependence on the ozone VCD is very similar:The discrepancy is the largest for measurements at Kiruna,where it is up to 25% for altitudes between 20 and 25 km.For this comparison, very large ozone VCD (above 400 DU)were observed above Kiruna in March. Therefore the largediscrepancy between the profiles obtained by standard DOASand the Taylor series approach at the altitudes of the ozonepeak may be attributed to the impact of the ozone absorption,which causes the overestimation of the BrO SCD by standardDOAS (compare Fig.8).
In contrast, for the observation above Aire sur l’Adourin October, the difference between both SCIAMACHY re-trievals is smaller (between 10 and 15%) because of the muchsmaller ozone VCD (below 300 DU) compared with Kiruna.Thus, the impact of ozone absorption on the BrO retrieval isless at this site and standard DOAS shows a good agreementwith the balloon observations here.
For the tropical scenario over Brazil the standard DOASgives 10–40% larger values compared with the Taylor se-ries approach. The discrepancy is larger for altitudes above25 km which is again in very good accord with the sensitivitystudies for the tropical scenario (see Sect.4.2).
In spite of the difficulties to be expected when comparingremote sensing observations of the minor absorbing speciesfrom different platforms, for most altitudes where the airmasses measured by balloon and SCIAMACHY match, agood agreement within error bars is found for the Taylor se-ries approach. For wide altitude ranges, the discrepancy iswithin 25%, for certain altitudes also below 10% and alwayswithin 40% for both Kiruna cases (first and third panel from
the top) and 10% at Aire sur l‘Adour in France (second panelfrom the top). In contrast, the discrepancy of the standardDOAS retrieval to the balloon profiles is significantly higher(around∼50% for Kiruna).
For the tropical case (bottom panel), significantly lowervalues are observed by up to 35% compared with the bal-loon observation for altitudes below 25 km although show-ing good agreement above. Currently we cannot providean explanation for this discrepancy, except that there arestill large uncertainties regarding the observations of strato-spheric BrO. In particular, only very few measurements havebeen performed so far for the tropical lower stratosphere(Dorf et al., 2008). However for this case, also other SCIA-MACHY retrieval algorithms retrieve lower concentrationsfrom the SCIAMACHY measurements (A. Rozanov, per-sonal communication, 2009). Note that for all compared BrOprofile retrievals the agreement with the profiles obtainedby the IUP Bremen full retrieval approach (Rozanov et al.,2005) is improved when applying the Taylor series approachcompared to standard DOAS (compare with results presentedin Sheode et al., 2006). The improved agreement is expected,because the full retrieval approach by itself correctly consid-ers the wavelength dependence of the SCDs. A comparisonof BrO profiles retrieved from SCIAMACHY measurementsby algorithms of different retrieval groups with each otherand with balloon validation measurements will be presentedin a publication byRozanov et al.(2010).
6 Conclusions
For complex measurement geometries like in satellite limbmeasurements, light propagation in the atmosphere stronglyvaries with wavelength. The light can reach the instrumentalong very different light paths including those with strongabsorption (e.g. due to ozone in the UV/VIS spectral range).In such cases DOAS is not directly applicable without ac-counting for the changes in the light propagation with wave-length because the assumption of a constant SCD within theDOAS fit window will lead to significant systematic errors.
For such cases, modifications of DOAS can be introducedthat account for the variability of the SCD within the fit win-dow (e.g., extended or AMF modified DOAS). We intro-duced a new approach that describes the SCD as functionof wavelength and of vertical optical depth by accountingfor the broad band variation with wavelength due to changesin light propagation and absorption, and by considering thenarrow band dependency of absorption varying with cross-section. The functional relationships are expressed in a Tay-lor series of which the first order terms are included in theDOAS fit, allowing to account for the wavelength depen-dency of the SCD. Thus, wavelength dependent SCDs aredetermined by DOAS.
Applying the Taylor series approach to SCIAMACHYlimb observations, more correct BrO profiles can be retrieved
www.atmos-meas-tech.net/3/631/2010/ Atmos. Meas. Tech., 3, 631–653, 2010

646 J. Pukıte et al.: Extending DOAS for limb measurements in the UV
Alti
tude
(km
)
-80 -60 -40 -20 0 20 40 60 8015
20
25
30
Alti
tude
(km
)
-80 -60 -40 -20 0 20 40 60 8015
20
25
30
Alti
tude
(km
)
-80 -60 -40 -20 0 20 40 60 8015
20
25
30
Difference (%)
Alti
tude
(km
)
-80 -60 -40 -20 0 20 40 60 8015
20
25
30
Alti
tude
(km
)
0 0.5 1 1.5 2 2.5 3 3.5 4 4.5 5
x 107
15
20
25
30
Alti
tude
(km
)
0 0.5 1 1.5 2 2.5 3 3.5 4 4.5 5
x 107
15
20
25
30
Alti
tude
(km
)
0 0.5 1 1.5 2 2.5 3 3.5 4 4.5 5
x 107
15
20
25
30
Number density (molec./cm-3)
Alti
tude
(km
)
0 0.5 1 1.5 2 2.5 3 3.5 4 4.5 5
x 107
15
20
25
30
Vertical BrO profile Relative difference23 March 2003, Kiruna (67.9°N, 21.1°E) Backward match: Orbit 5545, at 75°N, 16°E
9 Oct 2003, Air sur l`Adour (43.7°N, 0.3°E) Backward match: Orbit 8407, at 41°N, 8°E
24 March 2004, Kiruna (67.9°N, 21.1°E) Backward match: Orbit 10798, at 66°N, 9°E
27 June 2005, Teresina (5.1°S, 42.9°W) Forward match: Orbit 17255, at 5°S, 48°W
x 107
x 107
x 107
x 107
Number density (molec./cm-3) Difference (%)
balloonStandard DOASTaylor series approach
Standard DOAS w.r.t. balloonTaylor series approach w.r.t. balloonStandard DOAS w.r.t. Taylor series approach
Fig. 9. Comparison of BrO profiles derived from balloon observations (Dorf et al., 2006, 2008) with SCIAMACHY limb retrievals for fourdifferent balloon launches as indicated on the titles of the panels. Shown is the comparison either for the backward or the forward matchof the trajectory modelling. The match for the largest altitude range with correlated data is chosen. The altitude range where the soundedair masses match is indicated by a gray shading. On the left panel the blue lines represent the balloon profiles photochemically corrected tomatch the SZA of the SCIAMACHY measurement. The SCIAMACHY measurements are shown as red lines for the Taylor series approachand as green lines for the standard DOAS. On the right panel the relative differences between the SCIAMACHY and balloon profiles (greenand red lines) and between the different approaches of SCIAMACHY (violet dashed line) are shown.
Atmos. Meas. Tech., 3, 631–653, 2010 www.atmos-meas-tech.net/3/631/2010/

J. Pukıte et al.: Extending DOAS for limb measurements in the UV 647
(compared with the standard DOAS approach). At the sametime, the advantages of a two step approach are retained: ra-diative transfer is separated from spectral analysis, savingcalculation time for both steps. In particular, box AMFs canbe calculated at one selected single wavelength.
Studies based on simulated spectra demonstrated the use-fulness of the method for different spectral regions in therange of 332–357 nm. In this region, relatively strong absorp-tion by ozone prevails and the light path distribution in theatmosphere changes considerably with wavelength. Here,neglecting the dependency of ozone SCDs on wavelengthleads to significant cross-effects for the retrieval of minor ab-sorbers like BrO: Depending on the fit window the discrep-ancy to the true profile can reach 20 to 100%.
Accounting for this variation by the Taylor series approachprovides a more correct retrieval of minor absorbers andeliminates biases that arise due to the assumption of theconstant ozone SCD in the fit window: Sensitivity studiesshow that the agreement between the retrieved and simulatedBrO SCDs is very good for atmospheric scenarios with dif-ferent ozone profiles. Consequently, also for the retrievedand true BrO profile a very good accord is found for differ-ent fit windows and ozone profiles.
We applied the Taylor series approach to the retrieval ofBrO profiles from SCIAMACHY measurements and com-pared the results with those from standard DOAS retrievaland correlated balloon measurements. While profiles ob-tained by standard DOAS show discrepancies of up to∼50%compared to the balloon validation measurements, the Taylorseries approach leads to much better agreement, in particu-lar for cases with strong ozone absorption. This confirms theresults of the sensitivity studies where an overestimation ofthe BrO SCD due to an incorrect ozone SCD description bystandard DOAS was found.
Compared to AMF modified DOAS, the Taylor series ap-proach has the advantage of being independent from a prioriinformation that may, in general, differ from reality. In ad-dition, it is not necessary to calculate AMFs for every wave-length in the fit window.
For the inversion of SCDs to vertical profiles, the new ap-proach makes the RTM calculations much easier because theinterference of the narrow band spectral features caused bythe wavelength dependency of the SCD of strong absorberswith minor absorber is minimized. Therefore, the selectionof the wavelength at which the box AMFs for the inversionshould be calculated depends much less on the strength ofthe absorption by ozone.
We demonstrated the improvement for the BrO profile re-trieval by the Taylor series expansion applied for SCDs ofozone for simulated and measured spectra. In simulationstudies we also showed the possibility to extend this ap-proach for a minor absorber (i.e., BrO). However, the ap-proach has the potential to improve DOAS retrievals alsofor other minor or strong absorbers when strong absorp-tion is present in the atmosphere, and is not limited to limb
geometry. In general, the approach allows to extend the ap-plicability of DOAS for observations where the light pathvaries strongly with wavelength (e.g., limb measurements orscenarios with large SZAs for nadir, ground based or otherobservations), or where medium or strong absorptions occur(e.g., ozone in the UV spectral range). Moreover, due to theimproved description of the wavelength dependency of theSCDs, the Taylor series approach also allows to use broaderfit windows which could improve the extraction of signals ofvery weak absorbers.
Appendix A
Approximation for the spectral variation ofsimulated AMFs of ozone in the UV spectral range forlimb geometry
In this appendix we investigate how well the approximationof ozone AMFs by the Taylor series approach agrees with itstrue function of wavelength. Because of the proportionalitybetween AMF and SCD in Eq. (3), similar conclusions forthe SCDs can be drawn.
For the study, we simulated AMFs for limb geometry inthe UV spectral region (338–357 nm), see “main” parametersgiven in Table1. The AMFs are obtained by the RTM McAr-tim (Deutschmann, 2009) from the simulated spectral inten-sity with and without the ozone absorption (according to thesecond bottom row in the third column in Table3).
In analogy to Eq. (6), taking into account the proportion-ality between AMF and SCD, the first order approximationfor AMFs is described by:
A(λ,υ) ≈ A∗
0 + Aλλ + Aυυ (A1)
In the simulated wavelength region, although minor ab-sorbers are present, absorption by ozone dominates. There-fore, for the determination of the vertical optical depthυ wefirst neglect the impact of minor absorbers by consideringonly the absorption of ozone (υO3=VO3σO3) in analogy toEq. (9):
A(λ,υ) ≈ A∗
0 + Aλλ + AO3σO3 (A2)
Note thatAO3 is a product ofAυ and the ozone VCD. ThecoefficientsA∗
0, Aλ andAO3 are acquired by minimizing thedifference between the right side of Eq. (A2) and the simu-lated (true) AMF on the left side. In Fig.A1, the differencebetween the approximation by the Taylor series and the truevalues is plotted as mean for all THs (case a, blue line) in or-der to show the general effect. The agreement is better than∼0.4% for all wavelengths (the discrepancy is slightly largerfor THs close to the peak of the BrO profile and lower above).
This means that with respect to the simplification of a con-stant AMF, where discrepancies of up to 20% arise for certainwavelengths (compare Fig.1), the new approach has a max-imum discrepancy of only 0.4% for the whole fit window.
www.atmos-meas-tech.net/3/631/2010/ Atmos. Meas. Tech., 3, 631–653, 2010

648 J. Pukıte et al.: Extending DOAS for limb measurements in the UV
Table A1. Terms of Taylor series expansion considered in the AMF fit study.
Taylor series terms considered in the fit
Cases Constant term Linear terms Square terms
Case a A0 Aλλ, AO3σO3 —Case b A0 Aλλ, AO3σO3, ABrOσBrO —Case c A0 Aλλ, AO3σO3, ABrOσBrO, ANO2σNO2 —Case d A0 Aλλ, AO3σO3, ABrOσBrO, ANO2σNO2 Aλλλ2, AλO3
λσO3, AO3O3σ2
O3
The small differences that remain (for example, at338.5 and 355 nm) are due to the absorption bands of mi-nor absorbers, which are included in the atmospheric sce-nario used for the simulation studies (BrO and NO2), andalso higher order structures with respect to wavelength andozone absorption. They are not considered in the approxima-tion by Eq. (A2) due to the small effect on the total verticaloptical depth and consequently on the AMFs of ozone.
However, by considering the absorption of BrO in the ver-tical optical depth in the last term of Eq. (A1), i.e. includ-ing in the fit also the first order parameterABrOσBrO (withABrO, a product ofAυ and BrO VCD) as an additional termin Eq. (A2), an improvement by an additional order of mag-nitude at the strongest absorption band of BrO is achieved(case b, green line in Fig.A1). TableA1 lists the terms in-cluded for the different approximation cases.
Furthermore, it is also possible to correct for the still re-maining systematic effects by including also the termANO2
for NO2 (case c, cyan line in the Fig.A1). An agreementclose to the precision of the simulation noise is obtainedwhen additionally including the parameters for the secondorder terms for the dependency on wavelength and absorp-tion of ozone (Aλλ, AλO3 andAO3O3), see case d, red line.
From this level of agreement one may deduce that this Tay-lor series expansion does not neglect (in the extent of prac-tical applicability) any systematic effects on the wavelengthdependency of the AMF. On the other hand, already the firstorder Taylor series approach significantly improves the de-scription of the wavelength dependency of the AMF.
Appendix B
Sensitivity to different terms of the Taylor series
In the following, we investigate the quality of the retrievalwhen accounting for either only the broad band (due to scat-tering and absorption) or narrow band (due to ozone absorp-tion) variation of SCDs of ozone in the fit window.
First, we include in the comparison the results when onlythe broad band dependency of the ozone SCD on wavelengthis considered in the DOAS fit, but the term describing thedependency on the ozone cross-section is neglected, Eq. (14)
App
roxi
mat
edA
MFs
w.r.
t.si
mul
ated
AM
Fs(%
)
wavelength (nm)335 340 345 350 355 360
-0.15
-0.1
-0.05
0
0.05
0.1
0.15
0.2
0.25
0.3
0.35
case acase bcase ccase d
Fig. A1. Relative difference between AMFs of ozone approximatedby Taylor series and simulated AMFs for the main settings (see Ta-ble1). Different lines correspond to results obtained by consideringdifferent number of Taylor series terms as fit parameters as listed inTableA1. The difference is averaged for all tangent heights. Com-pare with Fig.1 to see the improvement with respect to a constantAMF.
then becomes:
lnI0
I= S∗
0,O3σO3 + Sλ,O3λσO3 (B1)
+ SNO2σNO2 + SBrOσBrO + P
In this case, the wavelength dependent SCD of ozone canbe calculated from the fitted parameters in the following way:
Sf = S∗
0,O3+ Sλ,O3λ (B2)
Alternatively, the wavelength dependency of the SCD ofozone is considered only with respect to the spectral featuresof ozone absorption, neglecting the term describing the broadband dependency on wavelength. Equation (14) reduces to:
lnI0
I= S∗
0,O3σO3 + SO3,O3σ
2O3
(B3)
+ SNO2σNO2 + SBrOσBrO + P
Atmos. Meas. Tech., 3, 631–653, 2010 www.atmos-meas-tech.net/3/631/2010/

J. Pukıte et al.: Extending DOAS for limb measurements in the UV 649S
CD
retri
eved
w.r.
t.S
CD
sim
ulat
ed (%
)
wavelength (nm)
335 340 345 350 355 360-15
-10
-5
0
5
standard DOASboth wavel. and abs. by O3
wavelength onlyabsorption by O3 only
Fig. B1. Relative difference between the retrieved SCDs and thetrue (simulated) SCDs of ozone at TH=19.8 km if different termsdescribing the variation of SCD of ozone in the fit window are con-sidered.
In this case, the wavelength dependent SCD of ozone isexpressed by:
Sf = S∗
0,O3+ SO3,O3σO3 (B4)
We compare the ozone SCDs retrieved by the different ap-proaches with the true SCDs. FigureB1 shows the deviationof the retrieved SCDs from the simulated values. For thisstudy, the same atmospheric and trace gas profiles as in theprevious section (the main settings in Table1), and the samefit window of 338–357 nm are applied.
Besides the observed error of up to 12% by the standardDOAS (the green line in the figure) and the improvement byone order of magnitude for the Taylor series approach (thered line in the figure), significant uncorrected ozone struc-tures are observed in the fit also for both approaches stud-ied here. For the case when the ozone cross-section termis skipped, but the wavelength variation is accounted for,negative deviations of up to∼5% occur, which are strongerfor THs near the ozone peak (dashed blue line in Fig.B1).The agreement improves for larger wavelengths outside thestrong absorption structures of ozone. For the second case(dashed cyan line) where the wavelength term is skipped, anerror in the range of 5 to−5% is observed with better agree-ment at the absorption peaks of ozone. However, strong vari-ations with wavelength in the fit window remain, thus it isonly poorly improved with respect to the standard DOAS.Also, unfitted spectral structures of the ozone SCD remain inthe fit residual.
Our studies show that neglecting one of the first order cor-rection terms for ozone (broad band or ozone absorption)leads to poor results for the retrieval of the ozone SCD.However, for the retrieval of the BrO profile, there are onlyslight deviations found for the selected wavelength range
of 338–357 nm and the studied atmospheric scenario (seeSect.4.1and second panel from top, left plot in Fig.7).
Appendix C
Comparison between retrieved and true BrO SCDsfor different DOAS fits
Herein the retrieved SCDs of BrO are compared with thesimulated SCDs for the fit window 338–357 nm. Thecomparison is performed for standard DOAS, the Taylor se-ries approach applied to the SCD of ozone, and the AMFmodified DOAS for the SCD of ozone. Additionally theTaylor series approach is implemented for the SCD of BrO.Thus, four different approaches for the BrO DOAS fit areinvestigated. Details are given in TableC1, where the fit ar-guments for the SCDs of ozone and BrO and the equationsfor the calculation of the BrO SCDs are given. Fig.C1showsthe differences between the retrieved SCDs of BrO and thesimulated SCDs as a function of TH and wavelength for twodifferent ozone profiles: the subarctic scenario with (a) theVCD=460 DU and (b) the VCD=200 DU.
The possibility to apply box AMFs calculated at differ-ent single wavelengths for the inversion of the BrO SCDsto vertical profiles is also investigated. FigureC2 shows therelative differences between the retrieved BrO profiles andthe true profile as a function of the wavelength used for thecalculation of the box AMFs.
For standard DOAS (case a in TableC1and upper panel inFigs.C1and C2) a constant BrO SCD per TH is retrieved forthe whole fit window. Thus, the variation with wavelengthin the difference plot (Fig.C1, upper panel) arises becausethe true SCDs are wavelength dependent. It can be seenthat the discrepancy between the retrieved and the simulatedBrO SCD increases for THs where the absorption by ozoneis larger (i.e. close to the altitude of the ozone profile peak,compare Fig.2). Also, this discrepancy depends on the totalozone column: For the case with the ozone VCD=460 DU,the discrepancy is 20% at 19 km and 340.25 nm, and for thecase with the ozone VCD=200 DU, it is 8%.
Box AMFs should be calculated at a wavelength wherethe retrieved SCD matches the true SCD. However, due tothe strong variation with absorption of ozone and TH it isimpossible to select one particular wavelength with the bestmatch that is valid for all ozone profiles (not known a priori)and THs. This can be seen in Fig.C2 (top panel) where, forthe scenario with the ozone VCD of 200 DU, the best agree-ment is at 345 nm. At the same time, for the scenario withthe ozone VCD=460 DU this wavelength gives a disagree-ment of up to 15%.
For the Taylor series approach, accounting for the varia-tion of the ozone SCDs within the fit window (case b in Ta-ble C1), the fit improves significantly. The fit residual is re-duced (compare with Fig.5) and it is found that the retrieved
www.atmos-meas-tech.net/3/631/2010/ Atmos. Meas. Tech., 3, 631–653, 2010

650 J. Pukıte et al.: Extending DOAS for limb measurements in the UV
Table C1. Fit terms describing the trace gas absorptions for different approaches in the DOAS fit and equations for the estimation of theBrO SCD from the fitted coefficients.
Cases, short description Ozone NO2 BrO Estimation for theSCD of BrO
Case a (Standard DOAS) SO3σO3 SNO2σNO2 SBrOσBrO SBrO
Case b (Taylor series approach for ozoneSCD)
S0,O3σO3;Sλ,O3λσO3;
SO3,O3σ2O3
SNO2σNO2 SBrOσBrO SBrO
Case c (AMF modified DOAS for ozoneSCD)
VO3AO3σO3 SNO2σNO2 SBrOσBrO SBrO
Case d (additionally the broad band vari-ation with wavelength of the BrO SCD isconsidered)
S0,O3σO3;Sλ,O3λσO3;
SO3,O3σ2O3
SNO2σNO2 S0,BrOσBrO;Sλ,BrOλσBrO
S0,BrO+Sλ,BrOλ
Tang
ent H
eigh
t (km
)
340 345 350 355
10
20
30
Tang
ent H
eigh
t (km
)
340 345 350 355
10
20
30
Tang
ent H
eigh
t (km
)
340 345 350 355
10
20
30
Tang
ent H
eigh
t (km
)
340 345 350 355
10
20
30
m)
Tang
ent H
eigh
t (km
)
340 345 350 355
10
20
30
Tang
ent H
eigh
t (km
)
340 345 350 355
10
20
30
Tang
ent H
eigh
t (km
)
340 345 350 355
10
20
30
Tang
ent H
eigh
t (km
)
340 345 350 355
10
20
30
m)
Ozone VCD = 460 DU Ozone VCD = 200 DU
Case a, standard DOAS
Case b, Taylor s. a. for SCDs of ozone
Case d, Taylor s. a. also with wavelength term for SCDs of BrO
wavelength (nm)
wavelength (nm) wavelength (nm)
wavelength (nm)
wavelength (nm) wavelength (nm)
wavelength (nm) wavelength (nm)
Diff
eren
ce (%
)
-20
-15
-10
-5
0
5
10
15
20
Case c, AMF modified DOAS for SCDs of ozone
Fig. C1. Relative difference between retrieved SCDs of BrO and the true (simulated) SCDs as function of TH and wavelength for the studiedcases(a)–(d) (see TableC1). The retrievals were performed for two different ozone profiles (with VCD=460 DU, on the left, and 200 DU,on the right, see Fig.2.)
BrO SCD (fitted as wavelength independent like in standardDOAS) agrees better with the true wavelength dependentBrO SCDs, in particular at wavelengths where the strongestvariation of its absorption cross-section occurs (see secondpanel from top in Fig.C1). For both scenarios of ozone ab-sorption, the best agreement is found for the wavelength of
344.2 nm. Further case studies with a tropical atmosphericscenario show a similar agreement (not shown in the figure).Using box AMFs calculated at this wavelength for the profileretrieval results in a discrepancy between the retrieved andthe true profile of less than 3% (see Fig.C2, second panelfrom top).
Atmos. Meas. Tech., 3, 631–653, 2010 www.atmos-meas-tech.net/3/631/2010/

J. Pukıte et al.: Extending DOAS for limb measurements in the UV 651
Alti
tude
(km
)
340 345 350 35515
20
25
30
Alti
tude
(km
)
340 345 350 35515
20
25
30
Alti
tude
(km
)
340 345 350 35515
20
25
30
Alti
tude
(km
)
340 345 350 35515
20
25
30
30
Alti
tude
(km
)
340 345 350 35515
20
25
30
Alti
tude
(km
)
340 345 350 35515
20
25
30
Alti
tude
(km
)
340 345 350 35515
20
25
30
Alti
tude
(km
)
340 345 350 35515
20
25
30
30
Ozone VCD = 460 DU Ozone VCD = 200 DU
wavelength (nm)
wavelength (nm) wavelength (nm)
wavelength (nm)
wavelength (nm) wavelength (nm)
wavelength (nm) wavelength (nm)
Diff
eren
ce (%
)
-50
-40
-30
-20
-10
0
10
20
30
40
50
Case a, standard DOAS
Case b, Taylor s. a. for SCDs of ozone
Case d, Taylor s. a. also with wavelength term for SCDs of BrO
Case c, AMF modified DOAS for SCDs of ozone
Fig. C2. Same as for Fig.C1 but relative differences between retrieved profiles applying box AMFs calculated at different wavelengths(x-axis) and the true vertical profile of BrO are shown.
For the AMF modified DOAS (case c in TableC1; Figs.C1andC2) very similar results as for case b can be seen: alsohere the wavelengths where the fitted BrO SCD agrees withthe simulated SCDs vary negligibly with TH and ozone pro-file.
Beside performing the Taylor series approach for theozone SCDs, also the description of the optical depth of BrOin the DOAS fit may be improved by including also the firstorder Taylor series term for the SCD of BrO with respect towavelength. For case d in TableC1 this term (Sλ,BrOλσBrO)is included in the DOAS equation in addition to the Taylorseries approach for the ozone SCDs (compare Eq.14).
Thus, the SCDs of BrO are retrieved as a linear function ofwavelength. Since the fit is now constrained with two fit ar-guments for the BrO SCD, a much better agreement betweenthe retrieved and simulated BrO SCDs is achieved (see bot-tom panel in Fig.C1). The discrepancy is less than 3%, notonly close to the wavelengths where the more rapid changesin the BrO absorption occur, but also for longer wavelengths(e.g., around 351.5 nm). In comparison to case b the wave-lengths, where the best agreement is found, vary even lesswith TH and ozone profile, simplifying the selection of anappropriate wavelength for the calculation of the box AMFs.Also, the agreement at longer wavelengths provides an ad-vantage for the calculation of box AMFs for the inversion,
because box AMFs at a longer wavelength are less influ-enced by ozone absorption, which is generally not knowna priori. FigureC2, bottom panel shows that a good agree-ment (discrepancies smaller than 3%) between the retrievedand true profile is achieved using box AMFs for inversion ofBrO SCDs not only at 344.2 nm, as for the case b, but alsoaround 351.5 nm.
Acknowledgements.We want to thank ESA and DLR for providingthe SCIAMACHY level 1 data, and Marcel Dorf for providingthe results of the balloon measurements, and Alexei Rozanovfor fruitful discussions regarding the BrO profile retrieval, andAndreas Richter for comments on the AMF modified DOAS. Oneauthor (S. Kuhl) is funded by the DFG (Deutsche ForschungsGemeinschaft). We thank Marloes Penning de Vries (MPI forChemistry, Mainz) for proofreading of the manuscript.
The service charges for this open access publicationhave been covered by the Max Planck Society.
Edited by: M. Weber
www.atmos-meas-tech.net/3/631/2010/ Atmos. Meas. Tech., 3, 631–653, 2010

652 J. Pukıte et al.: Extending DOAS for limb measurements in the UV
References
Bogumil, K., Orphal, J., Homann, T., Voigt, S., Spietz, P., Fleis-chmann, O. C., Vogel, A., Hartmann, M., Bovensmann, H.,Frerik, J., and Burrows, J. P.: Measurements of molecular ab-sorption spectra with the SCIAMACHY pre-flight model: instru-ment characterization and reference data for atmospheric remote-sensing in the 230–2380 nm region, J. Photoch. Photobio. A, 157,167–184, 2003.
Bovensmann, H., Burrows, J. P., Buchwitz, M., Frerick, J., Noel,S., Rozanov, V. V., Chance, K. V., and Goede, A. P. H.: SCIA-MACHY: Mission objectives and measurement modes, J. Atmos.Sci., 56, 127–150, 1999.
Buchwitz, M., Rozanov, V. V., and Burrows, J. P.: A near-infraredoptimized DOAS method for the fast global retrieval of atmo-spheric CH4, CO, CO2, H2O, and N2O total column amountsfrom SCIAMACHY Envisat-1 nadir radiances, J. Geophys. Res.,105(D12), 15231–15245, 2000.
Burrows, J. P., Weber, M., Buchwitz, M., Rozanov, V., Ladstatter-Weißenmayer, A., Richter, A., Debeek, R., Hoogen, R., Bram-stedt, K., Eichmann, K.-U., Eisinger, M., and Perner, D.: TheGlobal Ozone Monitoring Experiment (GOME): Mission Con-cept and First Scientific Results, J. Atmos. Sci., 56, 151–171,1999.
Butz, A., Bosch, H., Camy-Peyret, C., Chipperfield, M., Dorf, M.,Dufour, G., Grunow, K., Jeseck, P., Kuhl, S., Payan, S., Pepin,I., Pukite, J., Rozanov, A., von Savigny, C., Sioris, C., Wagner,T., Weidner, F., and Pfeilsticker, K.: Inter-comparison of strato-spheric O3 and NO2 abundances retrieved from balloon borne di-rect sun observations and Envisat/SCIAMACHY limb measure-ments, Atmos. Chem. Phys., 6, 1293–1314, doi:10.5194/acp-6-1293-2006, 2006.
Coldewey-Egbers, M., Weber, M., Buchwitz, M., and Burrows, J.P.: Application of a modified DOAS method for total ozone re-trieval from GOME data at high polar latitudes, Adv. Space Res.,34, 749–753, doi:10.1016/j.asr.2003.05.051, 2004.
Coldewey-Egbers, M., Weber, M., Lamsal, L. N., de Beek, R.,Buchwitz, M., and Burrows, J. P.: Total ozone retrieval fromGOME UV spectral data using the weighting function DOASapproach, Atmos. Chem. Phys., 5, 1015–1025, doi:10.5194/acp-5-1015-2005, 2005.
Deutschmann, T.: Atmospheric radiative transfer modelling usingMonte Carlo methods, Diploma Thesis, Universitat Heidelberg,2009.
Diebel, D., de Beek, R., Burrows, J. P., Kerridge, B., Munro, R.,Platt, U., Marquard, L., and Muirhead, K.: Trace gas study:Detailed analysis of the retrieval algorithms selected for thelevel 1–2 processing of GOME data, Tech. Rep., Eur. SpaceAgency (ESA), Sect. 5, 5–150, 1995.
Dorf, M., Bosch, H., Butz, A., Camy-Peyret, C., Chipperfield, M.P., Engel, A., Goutail, F., Grunow, K., Hendrick, F., Hrechanyy,S., Naujokat, B., Pommereau, J.-P., Van Roozendael, M., Sioris,C., Stroh, F., Weidner, F., and Pfeilsticker, K.: Balloon-borne stratospheric BrO measurements: comparison with En-visat/SCIAMACHY BrO limb profiles, Atmos. Chem. Phys., 6,2483–2501, doi:10.5194/acp-6-2483-2006, 2006.
Dorf, M., Butz, A., Camy-Peyret, C., Chipperfield, M. P., Kritten,L., and Pfeilsticker, K.: Bromine in the tropical troposphere andstratosphere as derived from balloon-borne BrO observations,Atmos. Chem. Phys., 8, 7265–7271, doi:10.5194/acp-8-7265-2008, 2008.
Fleischmann, O. C., Hartmann, M., Burrows, J. P., and Orphal, J.:New ultraviolet absorption cross-sections of BrO at atmospherictemperatures measured by time-windowing Fourier transformspectroscopy, J. Photoch. Photobio. A, 168, 117–132, 2004.
Frankenberg, C., Platt, U., and Wagner, T.: Iterative maximuma posteriori (IMAP)-DOAS for retrieval of strongly absorbingtrace gases: Model studies for CH4 and CO2 retrieval from nearinfrared spectra of SCIAMACHY onboard ENVISAT, Atmos.Chem. Phys., 5, 9–22, doi:10.5194/acp-5-9-2005, 2005.
Kuhl, S.: Quantifying Stratospheric chlorine chemistry by thesatellite spectrometers GOME and SCIAMACHY, availableat: http://www.ub.uni-heidelberg.de/archiv/5664/, last access:May 2010, PhD Thesis, Universitat Heidelberg, Heidelberg, Ger-many, 177 pp., 2005.
Kuhl, S., Pukıte, J., Deutschmann, T., Platt, U., and Wagner, T.:SCIAMACHY Limb Measurements of NO2, BrO and OClO, Re-trieval of vertical profiles: Algorithm, first results, sensitivity andcomparison studies, Adv. Space Res., 42, 1747–1764, 2008.
Marquard, L. C., Wagner, T., and Platt, U.: Improved Air MassFactor Concepts for Scattered Radiation Differential Optical Ab-sorption Spectroscopy of Atmospheric Species, J. Geophys. Res.,105, 1315–1327, 2000.
Mount, G. H., Sanders, R. W., Schmeltekopf, A. L., and Solomon,S.: Visible spectroscopy at McMurdo Station, Antarctica,1. Overview and daily variations of NO2 and O3, austral spring,1986, J. Geophys. Res., 92, 8320–8328, 1987.
Perliski, L. M. and Solomon, S.: On the evaluation of air mass fac-tors for atmospheric near ultra-violet and visible absorption spec-troscopy, J. Geophys. Res., 98, 10363–10374, 1993.
Perner, D., Ehhalt, D. H., Patz, H. W., Platt, U., Roth, E. P., andVolz, A.: OH-radicals in the lower troposphere, Geophys. Res.Lett., 3, 466–468, 1976.
Platt, U., Marquard, L., Wagner, T., and Perner, D.: Correctionsfor zenith scattered light DOAS, Geophys. Res. Lett., 24, 1759–1762, 1997.
Platt, U. and Perner, D.: Direct measurements of atmosphericHCHO, HONO, O3, NO2, and SO2 by differential optical ab-sorption in the near UV, J. Geophys. Res., 85, 7453–7458, 1980.
Platt, U.: Differential Optical Absorption Spectroscopy (DOAS),in: Air Monitoring by Spectroscopic Techniques, edited by:Sigrist, M. W., Chemical Analysis Series, John Wiley, New York,127, 1994.
Platt, U. and Stutz, J.: Differential Optical Absorption Spec-troscopy, Principles and Applications, Series: Physics ofEarth and Space Environments, Springer, Heidelberg, 597 pp.,doi:10.1007/978-3-540-75776-4, 2008.
Pukıte, J., Kuhl, S., Deutschmann, T., Wilms-Grabe, W., Friede-burg, C., Platt, U., and Wagner, T.: Retrieval of strato-spheric trace gases from SCIAMACHY limb measurements,Proceedings of the First Atmospheric Science Conference, 8–12 May, ESA/ESRIN, Frascati, Italy, ESA SP-628, availableat: http://earth.esa.int/workshops/atmos2006/participants/1148/paperproc Frasc2.pdf, last access: 11 May 2010, 2006.
Atmos. Meas. Tech., 3, 631–653, 2010 www.atmos-meas-tech.net/3/631/2010/

J. Pukıte et al.: Extending DOAS for limb measurements in the UV 653
Richter, A.: Absorptionsspektroskopische Messungenstratospharischer Spurengaseuber Bremen, 53◦ N, Ph.D. the-sis, Inst. fur Umweltphysik, University of Bremen, Bremen,Germany, 1997.
Rodgers, C. D.: Inverse methods for atmospheric sounding, Theoryand practice, World Scientific Publishing Co. Ltd., Singapore,2000.
Rozanov, A., Bovensmann, H., Bracher, A., Hrechanyy, S.,Rozanov, V., Sinnhuber, M., Stroh, F., and Burrows, J. P.: NO2and BrO vertical profile retrieval from SCIAMACHY limb mea-surements: Sensitivity studies, Adv. Space Res., 36(5), 846–854,doi:10.1016/j.asr.2005.03.013, 2005.
Rozanov, A., Kuhl, S., Doicu, A., et al.: BrO vertical distributionsfrom SCIAMACHY limb measurements: Comparison of algo-rithms and retrieval results, Atmos. Meas. Tech., in preparation,2010.
Sheode, N., Sinnhuber, B.-M., Rozanov, A., and Burrows, J. P.:Towards a climatology of stratospheric bromine monoxide fromSCIAMACHY limb observations, Atmos. Chem. Phys. Discuss.,6, 6431–6466, doi:10.5194/acpd-6-6431-2006, 2006.
Solomon, S., Schmeltekopf, A. L., and Sanders, R. W.: On the in-terpretation of zenith sky absorption measurements, J. Geophys.Res., 92, 8311–8319, 1987.
Stutz, J. and Platt, U.: Numerical analysis and error estimation ofdifferential optical absorption spectroscopy measurements withleast squares methods, Appl. Optics, 35, 6041–6053, 1996.
Wahner, A., Ravishankara, A., Sander, S., and Friedl, R.: Absorp-tion cross section of BrO between 312 and 385 nm at 298 and223 K, Chem. Phys. Lett., 152, 507–512, 1988.
Wahner, A., Callies, J., Dorn, H.-P., Platt, U., and Schiller, C.:Near UV atmospheric absorption measurements of column abun-dances during airborne Arctic stratospheric expedition, January–February 1989: 1. Technique and NO2 observations, Geophys.Res. Lett., 17, 497–500, 1990.
Wagner, T., Beirle, S., Deutschmann, T., Eigemeier, E., Franken-berg, C., Grzegorski, M., Liu, C., Marbach, T., Platt, U.,and Penning de Vries, M.: Monitoring of atmospheric tracegases, clouds, aerosols and surface properties from UV/vis/NIRsatellite instruments, J. Opt. A-Pure Appl. Op., 10, 104019,doi:10.1088/1464-4258/10/10/1040192008, 2008.
www.atmos-meas-tech.net/3/631/2010/ Atmos. Meas. Tech., 3, 631–653, 2010