extended abstract template -...
TRANSCRIPT

e-PROCEEDINGS
Editors: Samira Albati Kamaruddin
Rahimah Muhamad Nor A’ini Rajab
1st International Conference on SUSTAINABLE INFRASTRUCTURE AND ENGINEERING 2017
In conjunction with UTMRS 1st INTERNATIONAL CONFERENCE ON
ADVANCED TECHNOLOGY 2017 (UTMRS-ICAT 2017) 10th October 2017
Renaissance Hotel, Kuala Lumpur
Sustainable Development Practice: Issues and Challenges

PROCEEDINGS OF THE 1ST
INTERNATIONAL CONFERENCE
ON SUSTAINABLE
INFRASTRUCTURE AND
ENGINEERING
(SustaIN 2017)
10TH OCTOBER 2017
RENAISSANCE HOTEL,
KUALA LUMPUR
ISBN: 978-967-15384-0-1

Copyright © 2017 by UTM Razak School. All rights reserved.
No part of this publication may be reproduced, distributed, or transmitted in any form or by any means, including photocopying, recording, or other electronic or mechanical methods, without the prior written permission of the publisher, except in the case of brief quotations embodied in critical reviews and certain other noncommercial uses permitted by copyright law. For permission requests, write to the publisher, addressed “Attention: Permissions
Coordinator,” at the address below. Published by:
UTM Razak School of Engineering and Advanced Technology Universiti Teknologi Malaysia Kuala Lumpur Level 7, Razak Tower Jalan Sultan Yahya Petra, 54100 Kuala Lumpur MALAYSIA http://razakschool.utm.my First Printing, October 2017 Printed in Malaysia

Editors: Dr. Samira Albati Kamaruddin Dr. Nor A’ini Rajab Dr. Rahimah Muhamad Organizing Committee Dr. Mohamad Syazli Fathi Dr. Mohd Khairi Abu Husain Dr. Nor A’ini Rajab Dr. Nor Fazilah Mohd Hashim Dr. Noor Irza Mohd Zaki Dr. Rahimah Muhamad Dr. Rozaimi Che Hasan Dr. Samira Albati Kamaruddin Rafizah Musa Sharidah Ibrahim

i
About SustaIN 2017
The 1st International Conference on Sustainable Infrastructure and Engineering (SustaIN
2017) is held on 10th October 2017 at Renaissance Hotel, Jalan Sultan Ismail, Kuala Lumpur.
The conference is organized by the UTM Razak School of Engineering and Advanced
Technology (UTMRS) in conjunction with UTMRS - International Advanced Technology
Conference (UTMRS-ICAT 2017) with the theme of “Sustainable Development Practice:
Issues and Challenges”.
In line with one of UTM Strategic Thrusts to reflect a more focused attention to the current
developments in the higher education at both national and international stage. Thus, SustaIN
2017 is created to inspire a government institutions, industrial partners and members of the
public on the issues and challenges of sustainable infrastructure and engineering. Also, this
conference aims to become a platform of technology and idea-sharing between UTM and
the stakeholders.
A total of 20 papers that have been through blind review are accepted for the proceedings
and the papers are grouped in two sub-themes: (1) Sustainable Design and Construction (2)
Sustainable Technology and Engineering. An index of keywords from all papers is included
at the end of the proceedings. All participants and readers can enjoy reading the proceedings
and gain inspirations for further research and application into education and practice.

ii
Contents
I – SUSTAINABLE DESIGN AND CONSTRUCTION
A Review of Eco-Costs per Value Ratio in Malaysian Construction Industry Towards Sustainable Development
Sharan Kumar Arumugam, Rahimah Muhamad and Khairulzan Yahya
1
A Game Based Learning for Sustainable Project Management Training: A Preliminary Survey
Noor’Ain Zainal Abidin, Mohamad Syazli Fathi, Mohd Yusof Md Daud and
Harmi Izzuan Baharum
5
Prefabrication Technology for Sustainable Affordable Housing Supply in Malaysia
Nur Azwin Mohamed Aris, Mohamad Syazli Fathi, Aizul Nahar Harun and
Zainai Mohamed
9
Knowledge Management: The Challenge for Implementation in Consultant Firms in Malaysian Construction Industry
Azlan Othman, Syuhaida Ismail and Khairulzan Yahya
13
Contractor Assessment for Construction Projects: A Sustainable Approach Izwan Rashid, Syuhaida Ismail and Zainai Mohamed
17
Relationship Between Project Stakeholder Management, Stakeholder’s
Satisfaction and Project Performance in The Residential Construction Project of Iran
Maryam Abolghasemi, Syuhaida Ismail, Normawati Mohd Sharif and Kambiz
Ghafourian
20
Technology Transfer in The Klang Valley Mass Rapid Transit Project: Key Success Factors
Abdul Rahman Hamdan, Mohamad Syazli Fathi and Zainai Mohamed
25
Building Assessment Tool in Tropical Countries: A Comparison Between Malaysia and Singapore
Ungku Norani Sonet, Noor Syarafina Sallehudin, Rafizah Musa and
Mohamad Asri Ibrahim
28
Milestone Payment and Monthly Progress Payment for Contractor: A Project Performance Comparison Study
Shukri Ishak, Noreen Mohd Ariff, Norazli Othman and Roslina Mohammad
32
The Challenges of Implementing BIM in Malaysian Construction Organisations: Stakeholders’ Perspective
Ng Chiew Teng, Siti Uzairiah Mohd Tobi and Mohamad Syazli Fathi
35

iii
II – SUSTAINABLE TECHNOLOGY AND ENGINEERING
Analysis of Shape and Development Time of Dam Breach at Jatibarang Dam Abdul Kholik Romarchan, Togani Cahyadi Upomo, Rini Kusumawardani and
Yeri Sutopo
39
Soil Nailing Design and Technique for Cut Slope Stabilization: A Review Mohd Sukry Mohamed and Samira Albati Kamaruddin
43
Investigation of Landslide Triggering Factors using Geo-Resistivity Method Yusita Dyka Auria Suyanto, Rini Kusumawardani and Untoro Nugroho
49
Factors Influence Fire Evacuation Time for High-Rise Building: Telekom Tower
Yogginy Kudarsamy, Nor Fazilah Mohd Hashim and Norzaida Abas
53
A Review on Conceptual Design of Ocean Thermal Energy Conversion (OTEC) Platform
N. A. Mukhlas, N. I. Mohd Zaki, M. K. Abu Husain and A. B. Jaafar
57
Simulation on Closed Kalina Cycle of Au/TiO2 and Ag/TiO2 of Ammonia-Water Hybrid Nanofluids
S. Z. A. S. Ahmad, M. K. Abu Husain, N. I. Mohd Zaki and A. B. Jaafar
62
Residual Soil Slope Strain Sensing using Distributed Optical Fibre Dayangku Salma Awang Ismail, Azman Kassim, Hisham Mohamad, Ahmad
Safuan A. Rashid and Aliff Ridzuan Bunawan
66
Reliability System for Fixed Offshore Structures in Malaysian Water E. Mat Soom, M. K. Abu Husain, N. I. Mohd Zaki, M. N. K. Mohd Nor and N. U.
Azman
70
Process Performance of Landfill Leachate Treatment using Up-Flow Anaerobic Sludge Bed
Sivathass Bannir Selvam, Hesam Kamyab, Shreeshivadasan Chelliapan, Mohd
Fadhil Md Din, Shahabaldin Rezania
74
Keywords Index 77

I
SUSTAINABLE DESIGN
AND CONSTRUCTION

A REVIEW OF ECO-COSTS PER VALUE RATIO IN MALAYSIAN
CONSTRUCTION INDUSTRY TOWARDS SUSTAINABLE
DEVELOPMENT
Sharan Kumar Arumugam*1, Rahimah bt Muhamad1, Khairulzan Yahya2
1 Razak School of Engineering and Advanced Technology, University Technology Malaysia,
Kuala Lumpur, MALAYSIA.
*[email protected], [email protected] 2 Faculty of Civil Engineering, University Technology Malaysia, Skudai, MALAYSIA.
ABSTRACT
Process to minimize environmental impact always a question mark. One of the methods to overcome this issue is by implementing eco-cost for construction waste management. Stressing sustainable development in the construction industry is due to construction wastes which produced from the site during the total duration of construction period which drastically increase yearly. Waste generation is becoming a pressing issue in Malaysia. There is a lot of construction waste generated in the country because of rapid development in the construction industry. Demand of houses and major infrastructure projects make the amount of construction waste getting increased. To make sure the construction waste generated to the right channel for disposal, higher preliminary cost in contract sum need to be captured by construction companies. By implementing eco-costing in development, it is ready to reduce the construction cost from starting stage and will make more potential outcomes to decrease the construction cost in preliminary. However, there are very few publications are available for modelling in eco-costing of construction waste generation as such Eco Cost per Value Ratio (EVR). Therefore, this study shall review on past publications on waste generation control measuring tools and EVR assessment for eco-costs as a result on waste produced particularly in Malaysian Construction Industry.
Key words: Construction, Waste, Management, Sustainable, Eco-costing
INTRODUCTION
This paper examines the past review paper on waste generation control measuring tools and eco-costing implementation in construction industry. This is because eco-costing provides a different dimension of handling construction waste which leads to sustainable construction waste management. Construction waste is a conspicuous issue all-inclusive and has an unfriendly impact on general execution of a task and additionally the general public and nature. Waste can be created in different structures. The waste happens as material, time and cost losses. The major physical waste created from development is recognized as material waste like concrete waste, demolished debris, steel scrap and others. Studies demonstrate that material waste has a critical effect to the cost of the task and
UTM Razak School of Engineering and Advanced Technology Kuala Lumpur, Malaysia
10 October 2017
1

additionally an unfriendly effect on condition. One of the implications created from huge quantities of material waste is illegal dumping. It was identified that 70% of contractors did not practise the waste separation, unless mandated by any specific private contract preliminary (Begum et al., 2009 and Mah Chooi Mei et al., 2016). The EVR is a LCA-based technique to analyse utilization designs, business procedures, and design outline choices regarding eco-effective esteem creation. According to Masudi Ahmad (2012), EVR is likewise used to analyse or benchmark items and service systems. EVR is a marker to sustainable and unsustainable utilization designs, though the eco-cost is a pointer for the natural contamination of the items, and the esteem is the cost paid for them. Eco-cost is categorized as indirect and direct environmental cost generated from the use of resources. It is pointed out that poor waste management can lead to hazardous environmental impact as well as direct financial losses which make the eco-costs become greater (Boussabaine et al., 2006 and Hultman et al., 2012). MAIN RESULTS
The important key factor is to implement eco-costing of construction waste in construction industry during the contract period which carries high contract sum. This review paper will help on distinguishing the EVR strategy which can be received in the construction waste management process. This is because, account of construction industry devours huge characteristics of raw material. The kind of material delivered to serve the business is extending from raw goods as such sand, aggregates, brick, plasterboard, metals, timber and cement. By implementing EVR in construction projects sites, the costing of the construction waste can be controlled. Table 1 shows a review papers on construction waste management tools in Malaysian construction industry.
Table 1: Review papers on construction waste management tools in Malaysian construction industry
Reference Tools Description Mah Chooi Mei et al., (2016)
Framework for waste generation rate (WGR)
Theoretical framework demonstrate the waste generation rate
Noor Yasmin Zainun et al., (2016)
Geographical Information System (GIS)
Mapping the construction waste illegal dumping
Noor Zalina Mahmood et al., (2011)
Global Index spreadsheet To measure total waste produced at site
Anis Adila Bt Abdullah et al., (2011)
Framework site waste management plan (SWMP)
Sustainable waste management at site
Masudi Ahmad Firman et al., (2011)
Benchmarking on construction and demolition waste generation
Identify the waste index and waste level in various sites in Klang valley
Masudi Ahmad Firman et al., (2012)
Wastage EVR benchmark Wastage analysis at construction site in Klang Valley
S.A.Mahayuddin et al., (2008)
NOLAN ITU Density Waste management in construction site
2

The review on the papers have been based on the sample benchmarking, framework or software tools in determining the construction waste type and waste management process. The assessments are quantitative and categories all the analysis are reliable to similar tools and case study. For example a study on framework of waste generation rate between conventional and mixed method by adopting Waste Generation Rate (Mah et al., 2016). Another study stated construction waste generation and benchmarking can serve as tools to evaluate the waste generation for overall site and EVR has been adopted to conduct assessment for construction waste in Klang Valley (Ahmad et al.,2012). All Authors are using different tools to justify the construction waste which produced at site and has identified that EVR benchmark for Malaysian construction industry shall lies at around 0.0024-0.0028. CONCLUSION
Construction waste era postures more extreme effects than it was for the most part seen. This investigation discloses the construction waste issue from an alternate edge of viewpoints rather than the general strong waste issues broadly examined, detailed and distributed. Construction waste management is an important element in the construction industry towards sustainable development. The intention to develop sustainable waste eco-cost model based on case study approach in construction stage. Reviewing the type of assessment tools which implemented in Malaysian construction industry, in order towards sustainable development not only for construction process but for waste management too. The detail of assessment on the waste disposal cost saving between conventional and sustainable building material projects by using EVR method will be discussed in detail in the near future work. The assessment will provides a different dimension of handling construction waste which leads to sustainable construction waste management. Acknowledgement: The research is financially supported by UTM Razak School of Engineering and Advanced Technology and the first author is an Engineering Doctorate student who is partially supported by MyPhD program, Ministry of Higher Education Malaysia. REFERENCES
A.A. Dania, J.O. Kehinde and K. Bala (2007), “A study of construction material waste management practices
by construction firms in Nigeria”, The Proceedings of the Third Scottish Conference for
Postgraduate Researchers of the Built and Natural Environment. Ahmad Firman Masudi and Che Rosmani Che Hassan (2011). Waste quantification models for estimation of
construction and demolition waste generation. A review.Int. J. Global Environmental Issues. Anis Adila Bt Abdullah et al., (2011). Sustainable construction waste management in Malaysia. contractors
perspective. Begum, R.A., C. Siwar, J.J. Pereira and A.H. Jaafar, (2009). Attitude and behavioral factors in waste
management in the construction industry of Malaysia. Resource. Conserved. Recycle. Hultman, J., Corvellec, H., (2012). The European Waste Hierarchy. From the sociomateriality of waste to a
politics of consumption. Environment. Planning-Part A 44. Poon C.S, Ann T. W. Yu & L. Jaillon (2004). Reducing building waste at construction sites in Hong
Kong.Pages 461-470. Masudi Ahmad Firman, Yahya Khairulzan, (2012) Eco-Costs Value Ratio Assessment of Construction Waste Mah Chooi Mei and Takeshi Fujiwara. A survey of construction and demolition waste in Malaysia, mixed-
use development. Vol.21,No.1,pp.1-2. Masudi Ahmad Firman et al., (2012) Waste quantification models for estimation of construction and
demolition waste generation: a review Int. J. Global Environmental Issues, Vol. 12, Nos. 2/3/4, 269.
3

Noor Yasmin Zainun, Ismail Abdul Rahman and Rosfazreen Azwana Rothman, (2016) Mapping Of Construction Waste Illegal Dumping Using Geographical Information System.
Noor Zalina Mahmood, Siti Nazziera Mokhtar and Nik Meriam Sulaiman. Qualification methods for construction waste generation at construction site. pp 4564-4569.
S.A.Mahayuddin, J.J Pereira, W.H.W. Badaruzzaman and M.B.Mokhtar (2008). Construction waste management in a developing country: case study of Ipoh,Malaysia ,Vol 109 WIT press.
Tey Jia Sin, Goh Kai Chen, Kek Sie Long,Goh Hui Hwang, (2013), Current practice of waste management system in Malaysia: Towards sustainable waste management.
Vogtlander, (2001) The model of the Eco-costs / Value Ratio, a new LCA based decision support tool, Delft University of Technology, DfS, Delft.
Yahya, K., Boussabaine, A.H., (2006). Eco-costing of construction waste. Management of Environmental Quality: An International Journal, Vol. 17 No. 1, pp. 6-19.
4

A GAME BASED LEARNING FOR SUSTAINABLE PROJECT
MANAGEMENT TRAINING: A PRELIMINARY SURVEY
Noor’Ain Zainal Abidin*1, Mohamad Syazli Fathi1, Mohd Yusof Md Daud1 and
Harmi Izzuan Baharum2
1 UTM Razak School of Engineering and Advanced Technology, Universiti Teknologi Malaysia,
Kuala Lumpur, MALAYSIA *[email protected], [email protected], [email protected]
2 UTM Language Academy, Universiti Teknologi Malaysia, Kuala Lumpur, MALAYSIA [email protected]
ABSTRACT
Digital technology is changing many aspects of human life nowadays whether at home or at work. It also impacted organization capability to remain relevant in any industries, especially with the emergence of fourth industrial revolution age. Therefore, adaptation to change must be quick and aligned with current technology. In this study, technology is used to enhance project management competency via game based learning approach. The objective of this study is to investigate the potential of this approach for project managers by introducing Project Management World, an online platform for learning project management best practices. A presentation of this approach is made using low fidelity prototype during a project management course conducted at Government Technical Department in Malaysia. Questionnaires were distributed and a dialogue session was conducted. The results revealed that 91% of the respondents perceived that the learning approach is useful, 81.9% respondents perceived it is easy to use and 81.9% respondents have intention to use it. The dialogue session enable researcher to obtain detailed comments and recommendations for this learning approach. The finding generate good indications that game based learning approach is acceptable and beneficial for the project management field and future actions are needed to improve the prototype. Key words: Digital technology, Game based learning, Low fidelity, Human resource development
INTRODUCTION
The world we live in is constantly changing. The advancement in technology impacted our daily life, whether at home or at work. This is due to the tremendous change in data, communication and network technologies since the third industrial revolution which had taken place during late 1960s (David, 2016). Followed by the fourth industrial revolution, we see the emergence of digital systems, information technology and automated production. An example of this industrial revolution is where technologies have become part of our lives in connecting billions of people via mobile phones technologies (Schwab, 2017). Communications technology is continuing to advance at an accelerating rate (Rogers and Junga, 2017). On top of that, the birth of new technology discovery such as artificial intelligence, robotics, the Internet of Things, autonomous vehicle and etc., will
UTM Razak School of Engineering and Advanced Technology Kuala Lumpur, Malaysia
10 October 2017
5
change how people work (David, 2016; Schwab, 2017). Comparatively the growth in information technology also changes how people learn (She, 2017). Hence, the need to gain new knowledge and skills has an utmost importance in any industries. Construction industry is also impacted by the digital technologies, just like any other industries. The significant impact of digital technology in construction could be seen via the application of Building Information Modelling (BIM). BIM involves the building of 3 dimension modelling by integrating non graphical object data into the model (Demian and Walters, 2014). BIM could be used throughout the project life cycle in many forms, i.e. as design, monitoring and training tools. Another digital technology that changes the construction industry is the visualization technology (Guo et al., 2017). This technology assists employees towards understanding the construction processes realistically, accurately and effectively in 3 dimension ways via virtual reality tools. Moreover, the integration between visualization and game technologies contributes to an interactive learning approach. This approach stimulates ‘learning by doing’ and as result enhances the learning effectiveness. The understanding of project management could be enhanced through an interactive project management learning application i.e. ‘Project Management World’, by using game technology concept and project management processes. The content of this application includes project management knowledge areas (based on Project Management Institute Standards), tools, templates and best practices (PMI, 2008). The challenges in Project Management World are developed using various project scenarios in the different phases of a project life cycle. However, for this prototype, the focus is on planning phase. The learning application is run via low fidelity prototype, i.e. Microsoft PowerPoint, without any interactive function for respondents to test (Walker et al., 2002). Later, the learning application is presented to a group of Government professionals in the objective to investigate the potential of game based learning and to obtain detailed comments for further improvement of the prototype. MAIN RESULTS
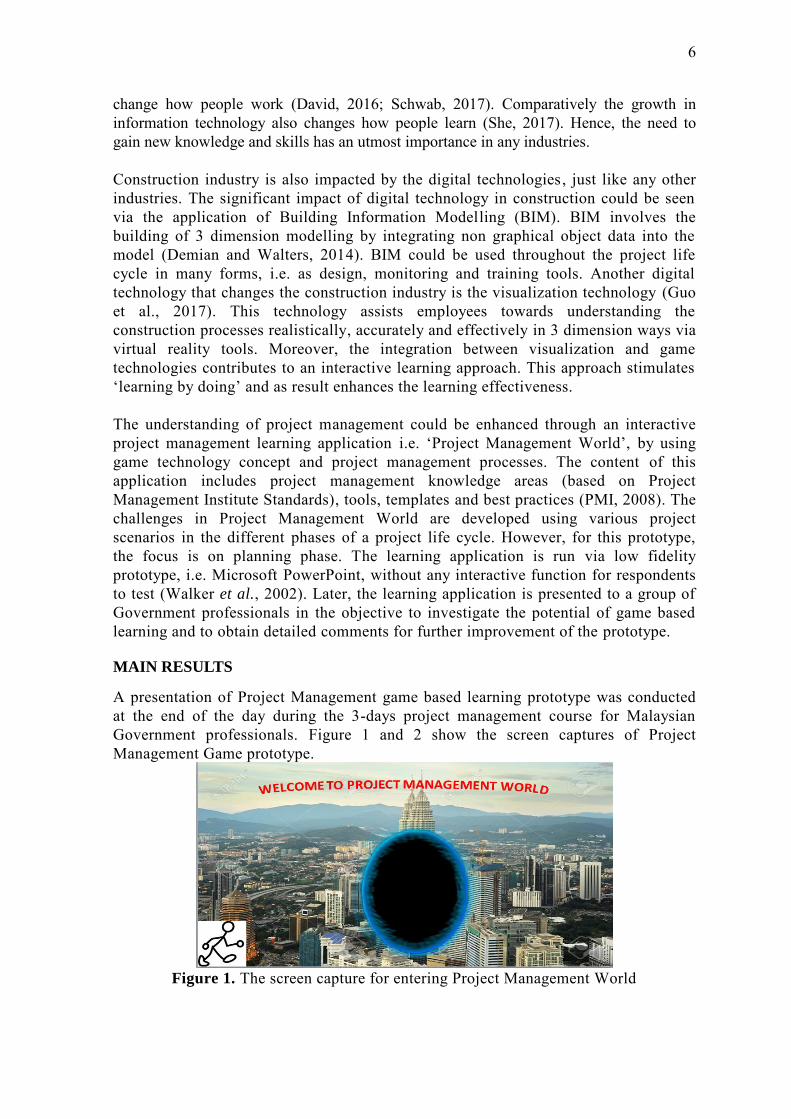
A presentation of Project Management game based learning prototype was conducted at the end of the day during the 3-days project management course for Malaysian Government professionals. Figure 1 and 2 show the screen captures of Project Management Game prototype.
Figure 1. The screen capture for entering Project Management World
6

Figure 2. The screen capture for various phases in a project life cycle
Questionnaires then were distributed and followed by a dialogue session. Although 30 professionals participated in the course, only 11 professionals are keen to participate and give valuable feedbacks. Even though the number is small, the feedbacks received are essential for initial introduction of the game based learning approach and the improvement of the prototype.
Demographic data of the professionals are as below:
• 82% are male professionals.
• 73% are professionals categorized as Generation Y (20 – 31 years old); 18% of Generation X (32 – 49 years old) and 9% of baby boomers (50 years old and above).
• Participation based on level of management: 9% are from top level; 36% at middle level and 55% of first level management.
Three criteria were taken into account in considering the possibility of game based learning as learning tools, i.e. perceived usefulness (PU), perceived ease of use (PEU) and intention to use (ITU) (Baharum, 2013). The results from this study show that 91% of the professionals perceived the game is useful. 81.9% of them perceived that it is easy to use. Finally, 81.9% have the intention to use the game in the future. Many comments were given during the dialogue session with the respondents. Improvements and recommendations generated are:
The game narration should be clear at the start of the game. The outcome of the game and rewards received should be explained from start
of the game. The game content should have been more detail. The project management game should focus only on one category of
construction, e.g. building/road/bridges etc. The game should have a ‘help’ icon.
7

CONCLUSION
The study indicates that game based learning has the potential to be a learning approach in project management field. Since the technology is advancing, innovation in the way people learn should be together enhanced. Henceforth, further improvement need to be carried out for the prototype. This must be followed by another survey to investigate the effectiveness of this better improved prototype.
Acknowledgment: This work was financially supported by Universiti Teknologi Malaysia Fundamental Research Grant Scheme (UTM-FRGS Grant No. 4F951) under the Ministry of Education, Malaysia. REFERENCES
Baharum, H. I. B. (2013). Learning business English in virtual worlds: effectiveness and acceptance in a Malaysian context: a thesis submitted in partial fulfilment of the requirements for the degree of
Doctor of Philosophy in Management Information Systems at Massey University, Palmerston North. Massey University.
David, N. (2016). What is the fourth industrial revolution? [Electronic Version]. World Economic Forum. Retrieved 14/07/2017, from https://www.weforum.org/agenda/2016/01what-is-the-fourth-industrial-revolution/
Demian, P., and Walters, D. (2014). The advantages of information management through building information modelling. Construction Management and Economics, 32(12), 1153-1165.
Guo, H., Yu, Y., and Skitmore, M. (2017). Visualization technology-based construction safety management: A review. Automation in Construction, 73, 135-144.
PMI, P. M. I. (2008). A Guide To The Project Management Body Of Knowledge (PMBOK Guide) (pp. 506). USA: Project Management Institute, Inc.
Rogers, E. A., and Junga, E. (2017). Intelligent Efficiency Technology and Market Assessment. Schwab, K. (2017). The fourth industrial revolution: Crown Business. She, C. (2017). The Role of Multimedia Technology in the Construction of Digital Community Education
Resources. DEStech Transactions on Social Science, Education and Human Science(icsste). Walker, M., Takayama, L., and Landay, J. A. (2002). High-fidelity or low-fidelity, paper or computer?
Choosing attributes when testing web prototypes. Paper presented at the Proceedings of the human factors and ergonomics society annual meeting, 661-665.
8

PREFABRICATION TECHNOLOGY FOR SUSTAINABLE
AFFORDABLE HOUSING SUPPLY IN MALAYSIA
Nur Arzwin Mohamed Aris*1, Mohamad Syazli Fathi1, Aizul Nahar Harun2 and
Zainai Mohamed1
1 UTM RAZAK School of Engineering and Advanced Technology, Universiti Teknologi
Malaysia, Kuala Lumpur, MALAYSIA *[email protected], [email protected], [email protected]
2 Malaysia-Japan International Institute of Technology, Universiti Teknologi Malaysia, Kuala Lumpur, MALAYSIA. [email protected]
ABSTRACT
The insufficiency of housing supply for the middle-income group in the Malaysian housing market has been an agenda of the Malaysian government since 2012. Various housing programmes and purchasing schemes are provided by many bodies including the federal government of Malaysia and state governments to facilitate urban dwellers in owning a houses. However, the method for producing affordable housing supply is inadequately discussed. Thus, this paper seeks to explore the potential of using prefabrication technology as a method to increase affordable housing supply in providing sustainable housing development. Various sources from journals, articles, and news pertaining to the aim of this paper were reviewed. A further recommendation that highlights the strategies to be carried among stakeholders in using prefabrication technology for affordable housing supply is also discussed in this paper. Key words: Prefabrication technology, Affordable housing, Housing supply, Sustainable housing
INTRODUCTION
The current demand calls for affordable housing especially in the urban area and the application of prefabrication technology is believed to be able to supply affordable housing to meet the needs. This is due to the current situation of Malaysian housing industry which is facing insufficient supply of affordable houses, particularly for middle income group (Bahadir and Mykhaylova, 2014; Bank Negara Malaysia, 2016; Baqutayan, 2016). Almost a million units of houses were targeted to be constructed in a five-year duration (2016-2020), which is approximately 2.5 times from the numbers of houses being built annually in the last five years (2011-2015) (Bank Negara Malaysia, 2016). Hence, a strong push mechanism such as prefabrication technology could accelerate the numbers of house unit production, though the study on the implementation of prefabrication technology for affordable housing supply still remains unknown in Malaysia.
UTM Razak School of Engineering and Advanced Technology Kuala Lumpur, Malaysia
10 October 2017
9

METHODOLOGY
This paper covers a general review on the issues addressing the current demand for affordable housing in Malaysia. Reviewed articles are identified using the themes based on “demand and supply of house in Malaysia”, “affordable housing” and “prefabrication technology”. The issues highlighted are reviewed using literature review from journals
articles, conference proceedings, reports and news especially those that covers and provide general reviews in addressing existing issues. AFFORDABLE HOUSING DEMAND
The population growth and urbanisation factors create the demands of house especially in the urban area per year (Economic Planning Unit, 2015; PR1MA, 2015; Shuid, 2015). It has been projected that the population in Malaysia will increase from 28.3 million in 2010 to 41.5 million in 2040 (Department of Statistics Malaysia, 2016). Moreover, it is estimated that 37 million or 87% Malaysians will live in urban areas by 2050 (PR1MA, 2015). The statistical projection was analysed that the necessity for sustainable housing initiative should be applied to meet the current and future needs. According to Choguill (2007), “in order to be sustainable, housing initiatives must be economically viable,
socially acceptable, technically feasible, and environmentally compatible”. By embracing
sustainable housing initiatives, the use of prefabrication technology is theoretically in line with the endeavour of providing sustainable affordable houses. The notion of sustainable housing initiatives is also embedded in prefabrication technology, which is familiarly known as an Industrialised Building System (IBS). Yunus and Yang (2012) studied critical sustainability factors in IBS and identified 18 critical sustainability factors for the improved implementation of IBS. However, providing sustainable affordable housing supply involves the acquisition of lands, whereby the current situation faced is the high land prices. The housing locations within the centre of the city portray the difficulty faced by developers in providing affordable house prices. Affordable house price could be achieved by alternatively reducing the construction cost in urban housing development. Although it is tough as the price of materials has increased, the standardisation of building components and design is possible to minimise the construction cost with faster completion. For that reason, prefabrication technology is a great alternative construction method that believed to reduce cost due to the standardisation and frozen design implementation in the early stage (Tam et al., 2007). PREFABRICATION TECHNOLOGY ISSUES IN MALAYSIAN HOUSING SECTOR
The benefit of prefabrication technology is plausible typically providing faster construction time, high productivity, lowering production cost, better quality, less wastage and sustainability (Agren and Wing, 2014; Atkin, 2014; Kolo et al., 2014; Lessing, 2006; Thanoon et al., 2003; Goulding et al., 2014). Despite the theoretical advantages of using prefabrication technology, its implementation should further be strategized. This is due to the bad past experience of the Malaysian construction industry in using the prefabrication technology (Haron, et.al, 2005; Mohammad, 2013) and the application is still at a low level despite the fact that the implementation historically began in the 1960s in Malaysia (Mydin
10

et.al, 2014). The strategies should further consider housing initiatives because the house-building sector in Malaysia has been experiencing drawback issues of IBS such as leakages, low quality, abandoned projects, delays in production, low profit margin, reluctance of contractors due to high initial cost, transportation, coordination, insufficient knowledge of installation and component assembly which are frequently discussed (Fathi et al., 2012; Jabar et al., 2013; Lou and Kamar, 2012). While the Construction Industry Development Board (CIDB) has been continuously playing a role in promoting IBS under its roadmap effort, the government keenly encourages the usage of IBS in all construction sectors including housing projects. In the aim to achieve Malaysian housing unit target, the excessive workforce is required. The implementation of IBS will create less dependency on manual labours, which is achieved through leverages on technology (Jalil et al., 2015). As this proved that it is relevant to use prefabrication technology in supplying affordable housing, strategies and planning should also be equally in focus since the projected population growth and urbanisation factor increase per year. A study by Goulding et al. (2014), which developed a research roadmap for new production and business models for the construction uptake, asserted that the people, process and technology were drivers continuously used the prefabrication approach. Hence, the strategies in providing sustainable housing supply by using prefabrication technology should include the three major areas, namely people, process and technology. RECOMMENDATION AND CONCLUSION
This paper presents some identified issues that hinder the potential of prefabrication technology application to realise sustainable affordable housing production and supply in an effort to potentially meet the spike in housing demand. Despite the mass demand for affordable housing due to the factors of urbanisation and population growth, strategies and planning on prefabrication technology should be further studied in order to avoid drawback issues. Although prefabrication technology definitely shows beneficial potential in increasing affordable housing supply, the implementation of this technology still remains unknown in the principle of tackling affordable housing shortage in Malaysia. Therefore, the implementation of prefabrication technology within Malaysian housing supply should be further studied in relation to people, process and technology factors so as to provide preparedness among stakeholders.
Acknowledgment: This work was financially supported by Universiti Teknologi Malaysia Fundamental Research Grant Scheme (UTM-FRGS Grant No. 4F951) under the Ministry of Education, Malaysia. REFERENCES
Agren, R., and Wing, R. D. (2014). Five Moments in The History of Industrialized Building. Construction
Management and Economics, 32(1–2), 7–15. Atkin, B. (2014). Industrialized Building. Construction Management and Economics, 32(1–2), 1–6. Bahadir, B., and Mykhaylova, O. (2014). Housing Market Dynamics with Delays in The Construction Sector.
Journal of Housing Economics, 26, 94–108. Bank Negara Malaysia. (2016). Assessing Demand and Supply Conditions in The Malaysian Property
Market. Bank Negara Annual Report 2015.
11

Baqutayan, S. (2016). Is Affordable Housing an Issue? A Case Study of Housing Stress among Middle-Income Group In Malaysia. International and Multidisciplinary Journal of Social Sciences, 5(1), 26.
Choguill, C. L. (2007). The Search For Policies to Support Sustainable Housing. Habitat International, 31(1), 143–149. http://doi.org/10.1016/j.habitatint.2006.12.001
Department of Statistics Malaysia. (2016). Population Projection (Revised), Malaysia 2010-2040. Retrieved from https://www.statistics.gov.my
Economic Planning Unit. (2015). Strategy Paper 6: Providing Adequate and Quality Affordable House. The
Economic Planning Unit, Prime Minister’s Department, Malaysia. Fathi, M., Abedi, M., and Mirasa, A. (2012). Construction Industry Experience of Industrialised Building
System in Malaysia. In Ninth International Congress on Civil Engineering (9th ICCE), Isfahan
University of Technology (IUT), Isfahan, Iran. Goulding, J. S., Pour Rahimian, F., Arif, M., and Sharp, M. D. (2014). New Offsite Production and Business
Models in Construction: Priorities for The Future Research Agenda. Architectural Engineering and
Design Management, 11(3), 163–184. Haron, S. A., Paim, L., and Yahaya, N. (2005). Towards sustainable consumption: an examination of
environmental knowledge among Malaysians. International Journal of Consumer Studies, 29(5), 426–
436. http://doi.org/10.1111/j.1470-6431.2005.00460.x Jabar, I. L., Ismail, F., and Mustafa, A. A. (2013). Issues in Managing Construction Phase of IBS Projects.
Procedia - Social and Behavioral Sciences, 101, 81–89. Jalil, A. A. B. D., Nuruddin, A. R., and Mydin, A. O. (2015). A New Procurement Method for Housing
Projects Implementing IBS Modular System . In International Conference on Advances in Civil and
Environmental Engineering 2015 (pp. 1–8). Kolo, S. J., Rahimian, F. P., and Goulding, J. S. (2014). Offsite Manufacturing Construction: A Big
Opportunity for Housing Delivery in Nigeria. Procedia Engineering, 85, 319–327. Lessing, J. (2006). Industrialised House-Building. Lund Institute of Technology. Lund University. Lou, E. C. W., and Kamar, K. A. M. (2012). Industrialized Building Systems: Strategic Outlook for
Manufactured Construction in Malaysia. Journal of Architectural Engineering, 18(2), 69–74. Mohammad, M. F. (2013). Construction Environment: Adopting IBS Construction Approach Towards
Achieving Sustainable Development. ASEAN Conference on Environment-Behaviour Studies, 85(November), 8–15. http://doi.org/10.1016/j.sbspro.2013.08.332
Mydin, O., Sani, N. M., and Taib, M. (2014). Industrialised Building System in Malaysia: A Review. MATEC Web of Conferences, 10, 1002. http://doi.org/10.1051/matecconf/20141001002
PR1MA. (2015). Membina Komuniti Bersama Laporan Tahunan 2015. Kuala Lumpur. Shuid, S. (2015). The Housing Provision System in Malaysia. Habitat International, 54, 210–223. Tam, V. W. Y., Tam, C. M., Zeng, S. X., and Ng, W. C. Y. (2007). Towards adoption of prefabrication in
construction. Building and Environment, 42(10), 3642–3654. http://doi.org/10.1016/j.buildenv.2006.10.003
Thanoon, W. A., Lee, W. P., Mohd, R. K. A., Mohd, S. J., and Mohd, S. S. (2003). The Essential Characteristics of Industrialised Building System. International Conference on Industrialised Building
Systems, (1999), 283–292. Yunus, R., and Yang, J. (2012). Critical Sustainability Factors in Industrialised Building Systems.
Construction Innovation, 12(4), 447–463.
12

KNOWLEDGE MANAGEMENT: THE CHALLENGE FOR
IMPLEMENTATION IN CONSULTANT FIRMS IN MALAYSIAN
CONSTRUCTION INDUSTRY
Azlan Othman*1, Syuhaida Ismail2 and Khairulzan Yahya1
1 Faculty of Civil Engineering, Universiti Teknologi Malaysia, Johor Baharu, MALAYSIA.
*[email protected], [email protected] 2 UTM Razak School of Engineering and Advanced Technology, Universiti Teknologi Malaysia,
Kuala Lumpur, MALAYSIA. [email protected]
ABSTRACT
In recent years, a major challenge in the field of knowledge management (KM) has been the way in which KM is implemented. Individual and organisation are starting to understand and appreciate knowledge as the key elements in the emerging competitive environment. As a preparation for the competitive industrial nation, KM is an important countenance that should be the point of convergence for the industry players. This paper wishes to draw the attention on the current situation of KM practice by focusing on consultant firms in Malaysian construction industry. Questionnaires were distributed to about 200 respondents working in the industry, with the aim of investigating the challenges for KM implementation in the Malaysian consultant firms. In this paper, the data is analysed using Statistical Package of Social Sciences (SPSS) version 20.0 on various statistical analysis tools, namely descriptive analysis, reliability analysis and relative important index (RII). The analysed results from questionnaire survey and focus group clearly showed that the biggest challenges are KM is difficult to implement, lack of awareness on the benefit of knowledge sharing and technology limitation. This paper is beneficial to overcome the challenges and barriers in KM practice. Key words: Knowledge management (KM), Consultant firm, KM challenges, KM implementation
INTRODUCTION
Knowledge is recognised as a source of competitive advantage in a dynamic and changing business environment today (Burton, 1999). Individual and organisational knowledge is important for business entrepreneurship and for managing change (Nonaka and Takeuchi, 1995). Knowledge Management (KM) is very important in the construction industry in order to satisfy the requirements of quality, cost and time. Basically KM is defined as a process that focuses on knowledge-related activities to facilitate knowledge creation, capture, transformation and use, with the ultimate aim of leveraging organisations’
intellectual capital to achieve organisational objectives (Cavaleri, 2004). There are different types of consulting firms serving different sectors. This study mainly
UTM Razak School of Engineering and Advanced Technology Kuala Lumpur, Malaysia
10 October 2017
13

focuses on construction industry which falls under civil engineering fields. A successful construction can only be achieved with good civil engineering design and consultations, which require decent engineering knowledge and experience. KM in construction projects is a challenging task due to several factors. The construction project consists of numerous people from different companies with different professional backgrounds such as clients, architects, project managers, designers, site managers, and workers. Furthermore, the project organisation is unstable over time and becomes often completely changeable from phase to phase during the project. However, barriers and challenges are inevitable in KM. According to Chong and Besharati (2014), barriers to knowledge building mostly stem out from the existence of poor organisational culture. Most companies find it challenging to create an environment in which people both want to share what they know and make use of what others know (Fadilah, 2012). Most project-related problems, solutions and experiences are usually not documented or stored in a system database and the process of capturing and storing them in usable forms is not easy (Eardley, 2001). Therefore, there is a need of continuous efforts to improve the use of KM integration in construction industry and overcome projects diversity, complexity and non-standard production methods. KM systems and related initiatives have become a popular focus in many firms, yet many KM systems initiatives fail to achieve their goals. Therefore this paper focuses on investigating the challenge of implementing KM in order to improve the performance of KM and make sure the implementation succeed. MAIN RESULTS
Since that the average values were in the range of 1.51 to 4.50, it showed that the level of the indicators was in the range of Disagree to Agree levels. In addition, majority median values for indicators were 4.00. It is indicating that more than 50 percent of the respondent’s respond to agree with these majority indicators in this instrument. Furthermore, the RII comparison was completed for the set of indicators. In the analysis, the higher value of RII indicated that the indicator was more challenging. On the other hand, lower value of RII described the indicator was less challenging. The result of the RII analysis showed that “difficult to implement” (RII = 0.763), “lack of awareness of the benefit of knowledge sharing” (RII = 0.749), “technology limitation” (RII = 0.744), “lack of interaction” (RII = 0.736), and “no sharing culture” (RII = 0.735) were the top five challenges of KM implementation based on the respondents’ opinion and experience. On the other hand, Figure 1 shows the line chart of the RII assessment of the challenges to implement KM instrument.
Table 1: Summary result of descriptive analysis and Relative Importance Index (RII) for understanding the Knowledge Management (KM)
Code Indicator Min Max Mean SD Med RII
D.1 Technology limitation 1 5 3.70 0.83 4.00 0.744 D.2 No sharing culture 1 5 3.66 0.95 4.00 0.735 D.3 Difficult to implement 1 5 3.80 0.99 4.00 0.763 D.4 Document contents are difficult to
understand 1 5 3.64 1.08 4.00 0.731
14

D.5 Difficult to capture knowledge during informal discussion
1 5 3.62 1.02 4.00 0.726
D.6 KM is not well understood 1 5 3.60 0.96 4.00 0.723 D.7 Lack of communication skills 1 5 3.57 1.01 4.00 0.717 D.8 Lack of social network 1 5 3.27 0.99 3.00 0.658 D.9 Differences in culture 1 5 3.40 1.05 3.50 0.684
D.10 Lack of time 1 5 3.62 1.02 4.00 0.727
D.11 Lack of trust 1 5 3.35 1.15 3.00 0.675 D.12 Lack of motivation 1 5 3.58 1.07 4.00 0.720 D.13 Lack of awareness of the benefit of
knowledge sharing 1 5 3.73 1.03 4.00 0.749
D.14 Lack of interaction 1 5 3.66 0.95 4.00 0.736 D.15 Fear of not receiving recognition 1 5 3.35 0.97 4.00 0.674 D.16 Fear of knowledge insecurity 1 5 3.32 1.03 4.00 0.668 D.17 Fear of causing internal conflicts 1 5 3.46 1.06 4.00 0.696 D.18 Keeping data accurate and relevant 1 5 3.63 0.96 4.00 0.730 D.19 Difficult to determine where KM
belongs to (HR/IT/etc) 1 5 3.50 0.94 4.00 0.700
Note: Min = Minimum value; Max = Maximum value; SD = Standard deviation; Med = Median; RII = Relative Importance Index (%).
Figure 1. Line chart of Relative Importance Index (RII) for challenge of implementing Knowledge Management (KM) indicators
CONCLUSION
This paper has successfully achieved its aim to investigate the challenges of Knowledge Management (KM) implementation in the Malaysian consultant firm. It is expected that this paper will bring forward the ideas of eventually developing a conceptual framework of KM for consultant firm in the Malaysian construction industry by taking into account the quantitative elements of KM challenges to improve company performance and efficiency. It is hoped that the discussion on challenges of KM implementation would lead to the successful implementation of KM practice amongst consultant firms in the Malaysian construction industry.
Acknowledgment: This paper is supported by UTM Razak School Research Fund under the Cost No.R.K130000.7740.4J290.
15

REFERENCES
Burton Jones, A. (1999). Knowledge Capitalism. Oxford: Oxford University Press. Cavaleri, S. A. (2004). "Leveraging Organisational Learning for Knowledge and Performance." The Learning
Organisation, 11 (2) 159-176 Chong, C. W., & Besharati, J. (2014). Challenges of knowledge sharing in the petrochemical
industry. Knowledge Management & E-Learning: An International Journal (KM&EL), 6(2), 171-187.
Eardley, Alan, &Uden, Lorna. (2001). Innovation knowledge management: Concepts for organizational Creativity and Collaborative design. Staffordshire University, UK.
Fadhilah, M. N. (2012). The Impact of Effectiveness Knowledge Sharing Innitiatives on QS Firms in the Malaysian Construction Industry. (Doctor of Philosophy), The University of Salford, UK.
Field, A. (2009). Discovering statistics using SPSS. Sage publications. Nonaka, I. and Takeuchi, H. (1995) The Knowledge-Creating Company. Oxford University Press: Oxford.
16
CONTRACTOR ASSESSMENT FOR CONSTRUCTION
PROJECTS: A SUSTAINABLE APPROACH
Izwan Rashid*, Syuhaida Ismail and Zainai Mohamed
UTM Razak School of Engineering and Advanced Technology, Universiti Teknologi Malaysia,
Kuala Lumpur, MALAYSIA. *[email protected], [email protected], [email protected]
ABSTRACT
In the realisation of sustainable business practices, the concept of sustainability has recently been linked to project management. Since contractors are the one who is going to undertake critical project activities and has a significant impact on project outcome, it is thus seen important to integrate sustainability value while assessing contractors for a construction project. Hence, to ensure that contractors play their part in promoting sustainable development, it is reckoned by this study that it is necessary to lay out a set of sustainable contractor assessment criteria that could be used throughout the construction industry. Therefore, this paper is aimed to investigate the assessment criteria, which integrate sustainability values in assessing contractors. Over a comprehensive literature review involving extensive content analysis of various sources related to sustainability and contractor assessment, a total of 21 assessment criteria were identified. The result of this paper is hoped to become a standardised reference in assessing contractors, which integrates the economic, environment and social values with respect to the construction industry. Key words: Sustainability, Contractor assessment, Construction, Project management
INTRODUCTION
Sustainability in construction management is the incorporation of elements that are standardised by the International Standards Organisation (ISO), the UN Global Compact’s
Ten Principles (UNGC) and Global Reporting Initiative (GRI G4) Reporting Framework to a project management process which can be measured and applied (GPM Global, 2014). Brundtland (1987) came out with one of the most broadly used definitions, which state that sustainable development is a development that meets the needs of the present without compromising the ability of future generations to meet their own needs.
Successful organisations have long understood the commercial value of sustainable project management practices, and by making sustainability a required and measured part of that process, organisations will be able to deliver environmental, social and financial benefits to the business (Lennep, 2011). Today, the concept of sustainable project management has been expanded to almost all industries, particularly in the construction industry. Sustainable project management is thus seen by this paper as critical to a construction project.
UTM Razak School of Engineering and Advanced Technology Kuala Lumpur, Malaysia
10 October 2017
17
One essential process in managing projects, especially in the construction industry, is the assessment of contractor. Contractor assessment is an important process in the procurement management of construction projects and the recent emphasis on sustainability has made this process more intricate (Bai and Sarkis, 2010). Thus, it is substantial to supplement that intricacy by presenting a review of sustainable contractor assessment for construction projects, and this paper is materialised in achieving the aim of investigating it, which is hoped to become a standardised reference in assessing contractor. MAIN RESULTS
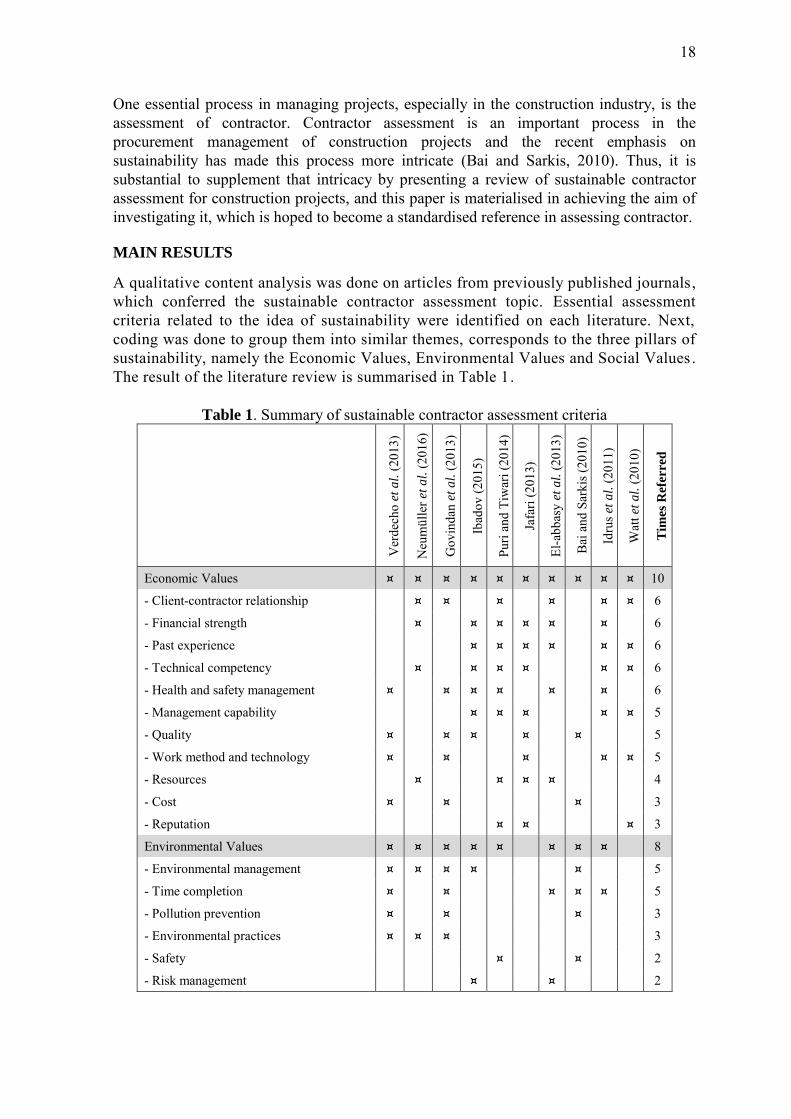
A qualitative content analysis was done on articles from previously published journals, which conferred the sustainable contractor assessment topic. Essential assessment criteria related to the idea of sustainability were identified on each literature. Next, coding was done to group them into similar themes, corresponds to the three pillars of sustainability, namely the Economic Values, Environmental Values and Social Values . The result of the literature review is summarised in Table 1.
Table 1. Summary of sustainable contractor assessment criteria
Ver
dech
o et
al.
(201
3)
Neu
mül
ler e
t a
l. (2
016)
Gov
inda
n et
al.
(201
3)
Ibad
ov (2
015)
Puri
and
Tiw
ari (
2014
)
Jafa
ri (2
013)
El-a
bbas
y et
al.
(201
3)
Bai
and
Sar
kis (
2010
)
Idru
s et
al.
(201
1)
Wat
t et
al.
(201
0)
Tim
es R
efer
red
Economic Values ¤ ¤ ¤ ¤ ¤ ¤ ¤ ¤ ¤ ¤ 10
- Client-contractor relationship ¤ ¤ ¤ ¤ ¤ ¤ 6
- Financial strength ¤ ¤ ¤ ¤ ¤ ¤ 6
- Past experience ¤ ¤ ¤ ¤ ¤ ¤ 6
- Technical competency ¤ ¤ ¤ ¤ ¤ ¤ 6
- Health and safety management ¤ ¤ ¤ ¤ ¤ ¤ 6
- Management capability ¤ ¤ ¤ ¤ ¤ 5
- Quality ¤ ¤ ¤ ¤ ¤ 5
- Work method and technology ¤ ¤ ¤ ¤ ¤ 5
- Resources ¤ ¤ ¤ ¤ 4
- Cost ¤ ¤ ¤ 3
- Reputation ¤ ¤ ¤ 3
Environmental Values ¤ ¤ ¤ ¤ ¤ ¤ ¤ ¤ 8
- Environmental management ¤ ¤ ¤ ¤ ¤ 5
- Time completion ¤ ¤ ¤ ¤ ¤ 5
- Pollution prevention ¤ ¤ ¤ 3
- Environmental practices ¤ ¤ ¤ 3
- Safety ¤ ¤ 2
- Risk management ¤ ¤ 2
18

Social Values ¤ ¤ ¤ ¤ ¤ 5
- Communities involvement ¤ ¤ ¤ 3
- Employment practice ¤ ¤ 2
- Human resource development ¤ ¤ 2
- Political consideration ¤ 1
CONCLUSION
This paper has successfully achieved its aim of investigating the sustainable contractor assessment criteria for construction projects. From the literature review carried out, it is found that 21 criteria had been identified as the critical contractor assessment criteria that relate to sustainability. These criteria are then separated into three main categories correspond to the three sustainability values, which are the economic, environment and social. Further study is suggested, particularly in the area of analysing and obtaining the rank of each criterion based on its importance and impact to the sustainable development.
Acknowledgment: This study is supported by the UTM Razak School Research Fund under the Cost Centre No. R.K130000.7740.4J290. REFERENCES
Bai, C., Sarkis, J. (2010). Integrating sustainability into supplier selection with grey system and rough set methodologies. International Journal of Production Economics. 124(1), 252–264.
Brundtland, G.H. (1987). Our Common Future: Report of the World Commission on Environment and
Development.United Nations Commission. El-abbasy, M.S., Zayed, T., Asce, M., Ahmed, M., Alzraiee, H., Abouhamad, M. (2013). Contractor
Selection Model for Highway Projects Using Integrated Simulation and Analytic Network Process. Journal of Construction Engineering and Management. 139(7), 755–767.
Govindan, K., Khodaverdi, R., Jafarian, A. (2013). A fuzzy multi criteria approach for measuring sustainability performance of a supplier based on triple bottom line approach. Journal of Cleaner
Production. 47, 345–354. GPM Global (2014). The GPM Global P5 Standard for Sustainability in Project Management. Ibadov, N. (2015). Contractor selection for construction project, with the use of fuzzy preference relation.
Procedia Engineering. 111, 317–323. Idrus, A., Sodangi, M., Amran, M.A. (2011). Decision criteria for selecting main contractors in Malaysia.
Research Journal of Applied Sciences, Engineering and Technology. 3(12), 1358–1365. Jafari, A. (2013). A contractor pre-qualification model based on the quality function deployment method.
Construction Management and Economics. 31(7), 746–760. Lennep, V. (2011). The Bottom Line on Sustainability. Project Management Institute. 1–7. Neumüller, C., Lasch, R., Kellner, F. (2016). Integrating sustainability into strategic supplier portfolio
selection. Management Decision. 54(1), 194–221. Puri, D., Tiwari, S. (2014). Evaluating The Criteria for Contractors’ Selection and Bid Evaluation.
International Journal of Engineering Science Invention. 3(7), 44–48. Verdecho, M.-J., Rodriguez-Rodriguez, R., Alfaro-Saiz, J.-J. (2013). Assessing Supplier Sustainability Using
the Analytic Hierarchy Process. PRO-VE 2013, Dresden, Germany, September 30 -- October 2, 2013,
Proceedings. Springer Berlin Heidelberg: Berlin, Heidelberg, 577–585. Watt, D.J., Kayis, B., Willey, K. (2010). The relative importance of tender evaluation and contractor
selection criteria. International Journal of Project Management. 28(1), 51–60.
19

RELATIONSHIP BETWEEN PROJECT STAKEHOLDER
MANAGEMENT, STAKEHOLDER’S SATISFACTION AND
PROJECT PERFORMANCE IN THE RESIDENTIAL
CONSTRUCTION PROJECT OF IRAN
Maryam Abolghasemi*, Syuhaida Ismail, Normawati Mohd Sharif, Kambiz
Ghafourian
UTM Razak School of Engineering and Advanced Technology, Universiti Teknologi
Malaysia, Kuala Lumpur, MALAYSIA *[email protected], [email protected], [email protected],
ABSTRACT
Stakeholders' issues and their expectations need to be managed as key influence-drivers in project success. Whenever terms such as “project stakeholder management” and “project
performance” are used, there is a fundamental issue that needs to be identified with serious. The proper definition of these two correlates along with stakeholder’s satisfaction is the
fundamental issue. Taking measures to improve the project performance can only be developed by understanding the project purpose and stakeholder’s satisfaction. This paper
therefore aims to appraise the relationship between project stakeholder management, stakeholder’s satisfaction and project performance in the residential construction project of Iran by using a quantitative methodology. Structural Equation Modeling (Smart-PLS focusing on confirmatory factor analysis (CFA)) applied to show the causal relationships between variables. The primary data were collected from a stratified random sample of 384 developers and buyers with the overall response rate of 44.1 percent. The Statistical Package of Social Sciences (SPSS) used on various statistical analysis tools, namely descriptive analysis, validity and reliability. Results show high correlation between project stakeholder management, stakeholder’s satisfaction and project performance. Moreover,
the results disclosed that the implementation of PMBOK standard through the mediating variables of stakeholder’s satisfaction has a positive effect on project performance. Key words: Project stakeholder management, Stakeholder’s satisfaction, Project performance, PMBOK, Construction industry
INTRODUCTION
In the project-oriented environment, project success is defined by the overall project objectives, namely the customers’ and other key stakeholder’s satisfaction, on time delivery and project completed within budget (Ephrem et al., 2012). Stakeholder’s
satisfaction is one of the many aspects of project management that demands the project manager’s attention on the essential element of successful projects. This has important
implications on the project performance in delivering project outputs. In this sense, a
UTM Razak School of Engineering and Advanced Technology Kuala Lumpur, Malaysia
10 October 2017
20
project can be considered as a transient endeavour that is undertaken to create a unique product, services or a result (PMI, 2013). There are many challenges and difficulties in the construction industry with regards to safety, quality and cost. To meet these demands, construction project companies need to constantly seek new directions and business models in construction management (George et al., 2012). According to the literature, frequent reports on the poor project performance (Ofori, 2011; Olanrewaju et al., 2014), neglect to satisfy the key stakeholder interest (Masrom et al., 2013; O'Halloran 2014), poor quality and reluctance to pay compensation for late delivery (Chai et al., 2015) are recounted in the main construction project in the world, including the residential construction projects in Iran. The aim of this paper is to appraise the relationship between project stakeholder management, stakeholder’s satisfaction and project performance in the
residential construction project of Iran. This will be achieved by determining the effect of project stakeholder management and stakeholders’ satisfaction on project performance. To
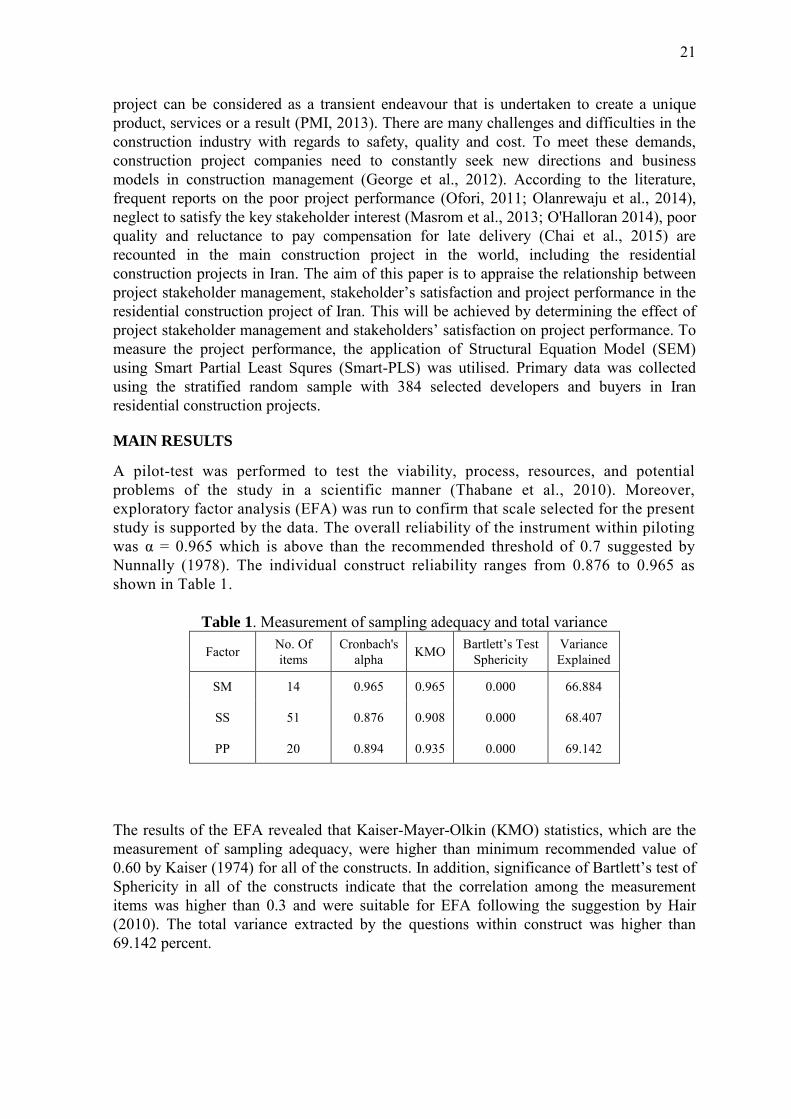
measure the project performance, the application of Structural Equation Model (SEM) using Smart Partial Least Squres (Smart-PLS) was utilised. Primary data was collected using the stratified random sample with 384 selected developers and buyers in Iran residential construction projects. MAIN RESULTS
A pilot-test was performed to test the viability, process, resources, and potential problems of the study in a scientific manner (Thabane et al., 2010). Moreover, exploratory factor analysis (EFA) was run to confirm that scale selected for the present study is supported by the data. The overall reliability of the instrument within piloting was α = 0.965 which is above than the recommended threshold of 0.7 suggested by
Nunnally (1978). The individual construct reliability ranges from 0.876 to 0.965 as shown in Table 1.
Table 1. Measurement of sampling adequacy and total variance
Factor No. Of items
Cronbach's alpha KMO Bartlett’s Test
Sphericity Variance Explained
SM 14 0.965 0.965 0.000 66.884
SS 51 0.876 0.908 0.000 68.407
PP 20 0.894 0.935 0.000 69.142
The results of the EFA revealed that Kaiser-Mayer-Olkin (KMO) statistics, which are the measurement of sampling adequacy, were higher than minimum recommended value of 0.60 by Kaiser (1974) for all of the constructs. In addition, significance of Bartlett’s test of
Sphericity in all of the constructs indicate that the correlation among the measurement items was higher than 0.3 and were suitable for EFA following the suggestion by Hair (2010). The total variance extracted by the questions within construct was higher than 69.142 percent.
21

Based on the pilot study, Mann-Whitney-U-test in every one of the twenty items were higher than 0.5 likelihood value and propose no distinction between respondents in every one of these items. By closely comparing the Z-score of the questions, it has been seen that none of the variable is absolutely higher than the other. Hence, it can be concluded that respondents did not faced any difficulty with respect to the length of the instrument.
Moreover, as usual practice in statistical analysis for multivariate normality, Skewness and kurtosis were conducted as shown in Table 2. The results indicate that they were in a range of -2 to +2, which demonstrate normality of the data.
Table 2. Normality test
During the multivariate analysis, homoscedasticity using Levene’s test of equal variance
was calculated through non-metric variable and show that all scores were higher than the minimum significant value i.e., p < 0.05, which propose that variance for all the variables was equal within groups and had not violated the assumption of homogeneity of variance. To check for multicollinearity problem, Pearson’s correlation has been utilised to calculate
the bivariate correlation matrix. It demonstrated that none of the bivariate relationship was higher than 0.8 for exogenous variable. The summary of descriptive statistics is presented in Table 3. Besides, t-test was conducted to compare the means of constructs with medium level of the seven-point scale (i.e. = 3.5) in order to provide more information on the status of the constructs. As shown in Table 3, all variables were above medium level (p<0.01) in seven-point scale (i.e. Mean = 3.5). By using reliability test of SPSS 22, item-to-total-correlation, and all items correlated with their relevant construct in medium to high level.
Table 3. Descriptive statistics and T-Test Variables Mean Std. Deviation t Sig. (2-tailed)
pp 4.0893 .62571 10.942 .000
SM 3.9131 .87634 5.477 .000
SS 5.2848 .99529 20.836 .000
Kolmogorov-Smirnova Shapiro-Wilk Statistic df Sig. Statistic df Sig.
PP 0.091 134 0.001 0.964 134 0.0001
SM 0.115 134 0.000 0.952 134 0.000
SS 0.144 134 0.000 0.923 134 0.000
a. Lilliefors Significance Correction
22

A summary of hypotheses and results of related analyses are shown in Table 4.
Table 4. Results of main hypotheses testing Hypotheses
No Hypotheses Description Path
Coefficient (t-value)
SE
H1 Stakeholder management is positively affected on the project performance in residential construction project.
0.7767 (9.5234)
0.0816
H2 Stakeholder management is positively affected to the stakeholder’s satisfaction in residential
construction project.
0.9594 (217.552)
0.0044
H3 Stakeholder satisfaction is positively affected to project performance in residential construction project
0.1893 (2.2624)
0.0837
CONCLUSION
This study seeks to examine whether the project stakeholder management has a direct and positive effect on project performance, or whether the effect is indirect and through improved stakeholder satisfaction resulted from the Project Management Body of Knowledge (PMBOK). In this paper, four different objectives have been established. Firstly, an attempt has been made to demonstrate whether stakeholder management has a positive effect on project performance. Secondly, this study tried to find whether project stakeholder management has a positive effect on stakeholder’s satisfaction. Thirdly, this
study made an effort to understand if stakeholder’s satisfaction has a positive effect on
project performance. Lastly, this study sought to bring more scholarly evidence about mediating effect of stakeholder’s satisfaction on the relationship between project
stakeholder management and project performance. The results indicated that stakeholder management is positively affected on the project performance in residential construction project (β = 0.1893; t =2.2624). The second hypothesis investigates the effect of
Stakeholder management on stakeholder satisfaction the results of the hypothesis indicated that Stakeholder management has positive and significant effect on stakeholder satisfaction (β = 0.9594; t = 217.552). The third hypothesis The Stakeholder satisfaction is positively
affected to project performance in residential construction project. The results of this hypothesis examined the effect of Stakeholder satisfaction on project performance. The results publicized that Stakeholder satisfaction is positively and significantly affected on project performance (β= 0.7767 and t = 9.5234). This paper sheds new to developers,
owners and the board of company in the construction industry. Since the companies want to implement the guideline to manage their projects, thus, knowing the capabilities of the standard can help them adopt to an effective approach to implementation of the standard. Furthermore, remind to them of their mutual responsibilities for effective implementation of the standard. The findings of this study were obtained from the Iranian residential construction projects point of view. Future researchers can replicate similar study for other countries and another sampling frame. Further research could also be conducted to determine the effects of other project management segment to the project performance in the residential sectors of construction industry.
23

Acknowledgment: The authors would like to express their sincere gratitude to the Ministry of Education Malaysia, Universiti Teknologi Malaysia (UTM) and the Research Management Centre (RMC) of UTM for providing the financial support for this paper to be published. This study is financed by the UTM Razak School Research Fund under the Cost Center No. R.K130000.7740.4J290. REFERENCES
Chai, C. S., Yusof, A. M. and Habil, H, (2015). Delay Mitigation in the Malaysian Housing Industry: A Structural Equation Modelling Approach. Journal of Construction in Developing Countries, 20(1), 65-83.
Ephrem and Eyob (2012). Customer-Oriented Global Supply Chains: Concepts for Effective Management. Hair, J. F. (2010). Multivariate data analysis. Kaiser, H. 1974. An index of factor simplicity, Psychometrika. Masrom, M. A., Skitmore, M. and Bridge, A, (2013). Determinants of contractor satisfaction.
Construction Management and Economics, 31(7), 761-779. Mc George, D. and Zou, P. X. W, (2012). Construction Management: New Directions: Wiley. Nunnally, J. C. (1978). Psychometric theory (2nd ed): Tata McGraw-Hill Education. O'Halloran, B, (2014). A study of the awareness of stakeholder management amongst project managers in the
construction industry in Ireland. Dublin Business School. Olanrewaju, A. L. and Abdul-Aziz, A. R, (2014). Building Maintenance Processes and Practices: The Case of
a Fast Developing Country: Springer Singapore. Ofori, G, (2011). New Perspectives on Construction in Developing Countries: Taylor & Francis. PMI, (2013). A Guide to the Project Management Body of Knowledge. Pennsylvania, USA: Project
Management Institute, Inc. Thabane (2010) Defining Feasibility and pilot studies in preparation for Randomised Controlled Trials:
Development of a Conceptual Framework
24

TECHNOLOGY TRANSFER IN THE KLANG VALLEY MASS
RAPID TRANSIT PROJECT: KEY SUCCESS FACTORS
Abdul Rahman Hamdan*, Mohamad Syazli Fathi and Zainai Mohamed
Razak School of Engineering and Advanced Technology, Universiti Teknologi Malaysia (UTM),
Kuala Lumpur, MALAYSIA *[email protected], [email protected], [email protected]
ABSTRACT
The Klang Valley Mass Rapid Transit (KVMRT) Project is the largest infrastructure project in Malaysia’s history. The development of the KVMRT project requires not just
local resources but as well as the involvement of foreign expertise. The government in recognising the need to reduce the dependence on foreign expertise in the local rail industry has introduced several measures for technology transfer in the KVMRT Project. The purpose of this paper is to review and identify the key success factors in the technology transfer program in the KVMRT project. Key personnel directly involved in the planning and implementation of technology transfer program in the MRT project were interviewed. A qualitative analysis using NVIVO 11 was done based on the findings from the interviews. Nine key success factors have been identified based on the analysis which are; recipient’s characteristics, provider’s characteristics, communication channel,
coordination and monitoring, transfer environment, government’s policy, learning
environment, mode of transfer and planning of transfer. Findings show that even though the program is well coordinated, the initial planning is one of the key factors that need to be improved. Proper measurement also needs to be established to measure the effectiveness of the technology transfer program. Key words: Technology Transfer, Technology Transfer Model, MRT, Rail project
INTRODUCTION
The Klang Valley Mass Rapid Transit (KVMRT) project is one of the key projects identified for the Greater Kuala Lumpur under the Government of Malaysia’s Economic
Transformation Program (PEMANDU, 2012). The construction cost totalling at RM23 billion, the KVMRT Line 1 project is considered as one of the largest infrastructure projects in Malaysia (Kaur, 2016). The Government in recognising the huge amount of money being spent on the infrastructure have introduced a technology transfer program as a way to capitalise on the government's outflow of money (MOF, 2014). It was estimated that the KVMRT technology transfer program for Line 1 would bring the country RM3.53 billion worth of benefit from six main contractors involved in the project (Nee, 2013). The technology transfer program consists of seven areas mainly from design and development, human capital development, global market access, local work packages, investment, parts and component manufacturing and transfer of technology (Nee, 2013).
UTM Razak School of Engineering and Advanced Technology Kuala Lumpur, Malaysia
10 October 2017
25

MAIN RESULTS
Due to the completion of the KVMRT Line 1 project on 17th July 2017 (Ahmad and Sivanandam, 2017), this paper is aim to review and identify the key success factors in the technology transfer program that was implemented during the planning, construction, and testing and commissioning of the project. A case study approach was used in understanding the technology transfer process in the KVMRT Line 1 project. As stated by Yin (Yin, 2003), a case study approach used as a pilot study can help to identify important variables in a complex situation and develop hypotheses for further research. Data was collected through a face-to-face interview with key personnel in MRT Corp Sdn Bhd. Five (5) personnel have been selected for the interview in which all these five (5) are the key people involved in the planning and implementation of the technology transfer program for Line 1 in MRT Corp. One of the key criteria for the selection of the respondents was that they must have at least three (3) years of experience and involvement in a technology transfer program. The interview was done based on a structured questionnaire with open ended questions. The questionnaire also allows the respondents to add their observation to the technology transfer program not contained in the structured questionnaire. The questions are structured based on the technology transfer factors that have been identified in a study by Waroonkun (Waroonkun, 2007). The interview questions were emailed to the respondents earlier on before the interview has taken place. The interview was recorded using a digital voice recorder, and later the interview was transcribed. NVIVO 11 is the software used for the interview analysis based on the transcript of the interview. From the analysis of the interview, about nine (9) key success factors have been identified that affect the overall implementation of the technology transfer program in the KVMRT project as shown in Table 1. Weight was given to each of the factors based on how many respondents acknowledged its importance.
Table 1. Identified Key Success Factors for the KVMRT Technology Transfer Program Item Weightage
Factor 1 Recipient’s Characteristics 20% (1/5) Factor 2 Provider’s Characteristics 20% (1/5) Factor 3 Communication Channel 80% (4/5) Factor 4 Coordination & Monitoring 100% (5/5) Factor 5 Transfer Environment 80% (4/5) Factor 6 Government’s Policy 20% (1/5) Factor 7 Learning Environment 40% (2/5) Factor 8 Mode of Transfer 100% (5/5) Factor 9 Planning of Transfer 100% (5/5)
From the analysis of the interview also, key findings were made based on the impact and result of the technology transfer program. Three (3) out of the five (5) respondents stated that the impact of the program is the improved salary and career progression of the trainees that was involved as a recipient in the technology transfer program. From the interview
26

findings also, the key factors that need to be improved are the technology transfer planning and measurement. All the five (5) respondents highlighted that initial planning is the most important aspect that needs to be improved. Regarding measurement factor, two (2) of the respondents stated that there is no proper measurement that was established to track the effectiveness of the program. CONCLUSION
The findings show that the technology transfer program in the KVMRT Line 1 is well coordinated. However, a certain improvement was suggested due to the lessons learnt from the program. From the nine (9) key success factors that were identified, “coordination and
monitoring”, “mode of transfer” and “planning of the technology transfer” are considered
the most important key success factors. Future studies can be recommended to investigate the relationship between these identified factors and determine which key factors contribute to the overall success of the technology transfer program.
REFERENCES
Ahmad, R., and Sivanandam, H. (2017, 17 July 2017). Najib Launches Phase 2 of Sungai Buloh-Kajang
MRT Line. The Star. Kaur, S. (2016). SSP Line Project may cost up to RM40b, says MRT Corp. The New Straits Times. MOF. (2014). Policy and Guidelines on Industry Collaboration Program in Government Procurement.
Ministry of Finance Malaysia. Nee, E. A. (2013). Klang Valley MRT offset scheme to contribute RM3.5b [Press release]. Retrieved from
http://www.thesundaily.my/news/880072 PEMANDU. (2012) ETP Annual Report 2012. In, (pp. 20 - 39). Waroonkun, T. (2007). Modelling International Technology Transfer in Thai Construction Projects. (Doctor
of Philosophy), Griffith University, Yin, R. K. (2003). Case Study Research: Design and Methods (2nd Edition ed.). London: SAGE
Publications.
27

BUILDING ASSESSMENT TOOL IN TROPICAL COUNTRIES: A
COMPARISON BETWEEN MALAYSIA AND SINGAPORE
Ungku Norani Sonet, Noor Syarafina Sallehudin, Rafizah Musa and Mohamad Asri
Ibrahim
UTM Razak School in UTM of Engineering and Advanced Technology, Universiti Teknologi Malaysia, Kuala Lumpur, MALAYSIA
[email protected], [email protected], [email protected], [email protected]
ABSTRACT
Malaysia and Singapore both are tropical climate countries which known for the sufficient source of natural sunlight and rainwater throughout the year. These two countries have established rating tools in enforcing the sustainability in construction and development. Two rating tools involved for this study are Green Building Index (GBI) in Malaysia and BCA Green Mark in Singapore. This comparison is to gather findings on the efficiency of the implementation for the future possible improvement on GBI in Malaysia. This comparison study is designed to provide understanding on the differences and similarities of the rating tools for sustainable buildings in tropical countries. Each country’s rating tool is responsive to its climatic and development status and is tailored specifically to its building by-laws and standards, cultural relevance and social needs. The outcome can help developers, investors, tenants, and government bodies in making informed decisions about sustainable buildings. Key words: Building Assessment Tool, Green Building Index, BCA Green Mark
INTRODUCTION
Malaysia has undergone rapid economic, social and environmental change over the last fifty years as the nation strives towards the new direction. The construction industry has a great impact not only on the Malaysian socio-economic landscape but also to the environment. Industrial sectors, including the building sector, started to recognize the impact of their activities on the environment in the 1990s. Significant changes were needed to mitigate the environmental impact of the building sector. When aiming to reduce environmental impacts, a system for measuring environmental performance was needed (Haapio & Viitaniemi, 2008).
As the global construction industry is also responsible for contributing 35-45% of CO2 emissions throughout the world, since 1990’s, built environment related institutional body or NGO’s around the world has been developing various assessment tools to evaluate
UTM Razak School of Engineering and Advanced Technology Kuala Lumpur, Malaysia
10 October 2017
28

various kin of buildings in a framework of Sustainable and Green Building Agenda (Khamidi, 2007). Fauzi and Abd Malek (2013), opined that ‘green building’ primarily
having energy efficient usage, water conserving, the use of recyclable materials, non-toxic and other features that contribute to the environmental, social and economics. Cole (1998) stated that the specific definition of the term “building performance” is complex since different actors in the building sector have differing interests and requirements. GBI is still in its infancy stage compared to other global rating systems. It is evident that GBI had referred to US Leadership in Energy and Environmental Design (LEED) and Green Mark as the basis for the establishment of criteria as there are many similarities. Since GBI is custom designed to suit Malaysian’s tropical climate, it is logical to do a research on Green mark which is the only rating tool operating in tropical climate before GBI. DISCUSSION
This study focuses on the Green Building Index (GBI) in Malaysia and Green Mark (GM) in Singapore to provide a comparison between them and a better understanding of assessment criteria and the scope of these two guidelines. Green Building Index (GBI) and Green Mark (GM) are rating tools to be used for labeling building in the tropical region. The difference of assessment criteria creates difference scores and rating as shown in Table 1. From Table 1, the score between GBI and GM. GBI rating is divided into four different award categories including Platinum, Gold, Silver and Certified. GM rating in the other hand, has also four different award which slightly different with GBI rating which include Platinum, Gold Plus, Gold and Certified award. The table shows that GM Rating has higher number to score in order to get the Platinum award for each building certified as compared to GBI rating index. The value of each building does affected by the award received, therefore, the criteria to meet each rating point does affect the design and development process.
Table 1: The difference of score between GBI and GM rating
Score GBI Rating GM Rating 90 and above Platinum Platinum 85 to < 90 Gold Plus 75 to < 85 Gold Gold 65 to < 75 Silver Certified 50 to < 65 Certified
The Green Mark priorities on energy and water efficiency were to customize Singapore’s situation. Malaysia differs in this situation thus it can be concluded that rating systems of different countries depend on the country’s situation and allocation of resources (MBAM, 2008). The general comparison is shown in Table 2. From Table 2, the GM in Singapore is mandatory and each building in Singapore required to be evaluated and will be certified accordingly. GBI in Malaysia in the other hand is an optional. These two differences made a huge different between the current development scenario in Malaysia and Singapore. The mandatory requirement by the local government
29

of Singapore will encourage each development to be built respond to the sustainable factor whereas, in Malaysia, as the implementation is voluntary, the existing of GBI will be less affective.
Table 2: General comparison between GBI and GM
Rating System GBI GM Year 2009 2005 Origin Malaysia Singapore Ratings Platinum
Gold Silver Certified
85 and above 75 to <85 65 to <75 50 to <65
Platinum Gold Plus Gold Certified
90 and above 85 to <90 75 to <85 50 to <75
Criteria Energy Efficiency Indoor Environmental Quality Water Efficiency Sustainable Site Planning and Management Material and resources Innovation
Energy Efficiency Indoor Environmental Quality Water Efficiency Environmental Protection Other Green Features
Assessment Accreditation panel Trained Assessors Voluntarily Mandatory
Rating Valid 3 years 3 years Governance GBI Sdn. Bhd. BCA
CONCLUSION
In conclusion, it is clear that the building assessment tool are customised to suit the current state of development and existing resources in the country. GBI is still new to the country and was based on the research on GM as well. New improved versions are always being developed and released. Rating tools would still need to be customised to match local needs. Imposing standards from the developed countries on developing countries would result in non-compliance. In order to assure the affectiveness of the existance of these sustainable evaluation system for building and development industry to move toward sustainability, a strict implementation and enforcement including mandatory as GM in Singapore will increase the affectiveness. Therefore, GBI in Malaysia in this state shall be improvised accordingly for a better future of sustainable development.
REFERENCES
Bahaudin, A.Y., et, al. (2013) A Comparison of the Freen Building’s Criteria, The 3 rd
International Building Control Conference Cole, R.J et. Al (2004), Building Environmental Assessment Tools: Current and Future
Roles. SB05. Issue Paper 4 & 5, Tokyo Japan.
30

Fauzi, M.A., Abdul Malek N., (2013), Green Building Assessment Tools: Evaluating Different Tools for Green Roof System, International Journal of Education and Research Vol. 1 No. 11
Fowler, M., & Raunch, M (2006) Sustainable Building Rating Systems Summary, Pacific Northwest National Laboratory Report 15858
Haapio A, Viitaniemi P. (2008), A Critical Review of Building Environmental Assessment Tools, Environmental Impact Assessment Review 28 page 469-482
Khamidi, M.F (2007), Development of Building Assessment Tool for Evaluation of Purpose Build Offices Life Cycle Management: Benchmarking and Assessment for Environmental Performance, Conference on Sustainable Building South East Asia, 5-7 November 2007, Malaysia
31

MILESTONE PAYMENT AND MONTHLY PROGRESS PAYMENT
FOR CONTRACTOR: A PROJECT PERFORMANCE
COMPARISON STUDY
Shukri Ishak*, Noreen Mohd Ariff, Norazli Othman, and Roslina Mohammad
UTM Razak School of Engineering and Advanced Technology
Universiti Teknologi Malaysia, JalanSemarak 54100 Kuala Lumpur, Malaysia *[email protected], [email protected], [email protected],
ABSTRACT
Payment method is very crucial factor in determining success in a construction project performance. Payment method has become a main issue for performance of construction projects because ineffective payment method of construction projects will due to the projects completed behind the stipulated timeframe. Thus, this study conducted to compare the construction project performance related to two types of payment methods used; milestone payment (MP) and monthly progress payment (MPP) methods including the performance critical factors between the two payment methods approached. The methodology adopted in the study were site observation, data collection and interviews. Based on the findings, milestone payment (MP) method give better construction project performance in terms of controlling time, quality, and cost. MP provides better quality performance compare to MPP in site management, administration, planning, facilities given, structure, and infrastructure works. The findings are very beneficial in enhancing the performance of the construction project in the construction industry in Malaysia. Key words: Project performance, Project payment, Milestone payment
INTRODUCTION
In the new era of global economy, the construction industry had contributed significantly to the economic growth of the country. Contribution of construction industry to a country not only as a main play role to the socioeconomic growth but also to improves the quality of people life by providing the necessary infrastructure such as roads, hospitals, school and other basic and enhanced facilities (Abdul Rahman et. al., 2013). However, construction industry in Malaysia facing chronic problems including poor performance of time and cost, construction waste, poor productivity and over dependent of foreign workers (Memon et. al., 2012; Rahman et. al., 2012). Project performance has become a main issue for national development. This is due to the projects in construction industry were completed behind time. The reasons of these are because of the payment issues, land acquisition, additional works and relocation of public services and change of original designs by client.
UTM Razak School of Engineering and Advanced Technology Kuala Lumpur, Malaysia
10 October 2017
32

There are many types of progress payment method practices such as Monthly Progress Payment (MPP) and Milestone Payment (MP). MPP method is a monthly interim payments made to the contractor for certified work done on site for that particular month of valuation while MP method is a schedule of payment based on Milestone events achieved in the approved Work Program. Currently, some projects are using the MPP meaning that the client had to pay monthly accordingly to what is actual finished work done up to the valuation date by the contractor. However, there is another alternative payment called MP where payment is subject to the satisfactory performance. The value of works completed and payment be made upon certain events being achieved. For this reason, the MP will represent the true value of the works completed. MAIN RESULTS
Table 1 indicates that the grade given by Superintending Officers that managed and supervised the works on sites. Project A scored four excellent remarks for the quality of planning, structure, finishing works and also the quality of Nominated Sub Contractor. For Project B, average remark is good for quality work done on site. Project C scored six excellent remarks for their best quality in planning, civil structure, finishing works and also the quality of Nominated Sub Contractor works while for Project D average remark is good for all quality criteria.
Table 1. Comparison of quality performance in MPP Project and MP Project
Quality Performance MPP Projects MP Projects
Project A Project B Project C Project D Quality of Site Management Good Good Excellence Good Quality of Administration Good Good Excellence Good Quality of Planning Excellence Good Excellence Good Quality of Facilities Given Good Good Excellence Good Quality of Structure Excellence Good Excellence Good Quality of Finishing Works Excellence Good Good Good Quality of Infrastructure Works Good Moderate Excellence Good Quality of Nominated Sub Contractor Excellence Moderate Good Good
CONCLUSION
There is an urgent need to widely implement the MP method in order to enhance project performance. MP will give better performance if being implemented with proper guidelines, standard and must be enforced in the contract clause for the contractor to compulsory use in project.
Acknowledgment: The author wishes to express her greatest appreciation and utmost gratitude to the Ministry of Higher Education and Universiti Teknologi Malaysia for all the supports in making the study a success. Vote: 15H75.
33

REFERENCES
Abdul Rahman, I., Memon, A. H., Karim, A., & Tarmizi, A. (2013). Significant factors causing cost overruns in
large construction projects in Malaysia. Journal of Applied Science, 13 (2), 286-293. Memon, A. H., Rahman, I. A., & Azis, A. A. A. (2012). Time and cost performance in construction projects in
southern and central regions of Peninsular Malaysia. International Journal of advances in applied
sciences, 1 (1), 45-52. Rahman, I. A., Memon, A. H., Nagapan, S., Latif, Q. B. A. I., & Azis, A. A. A. (2012). Time and cost
performance of costruction projects in southern and cenrtal regions of Penisular Malaysia. In Humanities, Science and Engineering (CHUSER), 2012 IEEE Colloquium on (pp. 52-57). IEEE.
34

THE CHALLENGES OF IMPLEMENTING BIM IN MALAYSIAN
CONSTRUCTION ORGANISATIONS: STAKEHOLDERS’
PERSPECTIVE
C.T. Ng*1,2, M.T.Siti Uzairiah1 and F.Mohd.Syazli1
1 Razak School of Engineering and Advanced Technology, University Teknologi Malaysia, Kuala
Lumpur, MALAYSIA *[email protected], [email protected], [email protected]
2 Faculty of Built Environment, Tunku Abdul Rahman University College, Kuala Lumpur, MALAYSIA
ABSTRACT
Building Information Modelling (BIM) is transforming how buildings are designed and constructed and can facilitate multi-disciplinary coordination, and integrate 3D design, analysis, cost estimating, and construction schedule. Currently, due to poor coordination among its project participants, the construction industry is still unproductive, fragmented and lacks collaboration. With the introduction of BIM, the performance of the industry, its coordination and collaboration among the construction players, the productivity of the projects could be better improved. However, the lack of understanding from the construction players about BIM, which include the wide spectrum of benefits and barriers that could be encountered have made industry players reluctant to proceed with its implementation. This research studies the challenges which could be encountered and the benefits of BIM adoption from the construction stakeholders’ perspectives.
Accordingly, a pilot interview interviewing five BIM practitioners from different organisations has been carried out whereby the respondents have agreed that although there are plenty of benefits and advantages of BIM adoption, the Malaysia construction industry is still in its infancy and developmental stage. In short, the main reason is that there are still major barriers to be overcome in particular the construction players’ mindset and thinking.
Key words: Building Information Modelling, Construction industry, Malaysia, Collaboration
INTRODUCTION
The Malaysian authorities have turned their attention to implementing Building Information Modelling (BIM) in the Malaysian construction industry. BIM has even been highlighted as one of the strategies to transform the construction sector in the 11th Malaysia Plan (Economic Planning Unit 2015). During the Infrastructure & Construction Asia’s Building Information Modelling &
Sustainable Architecture Conference on 19th August 2009, the Malaysian Public Work Department (PWD) director-general, Datuk Seri Dr Judin Abdul Karim said that BIM is
UTM Razak School of Engineering and Advanced Technology Kuala Lumpur, Malaysia
10 October 2017
35

considered as one of the focus areas identified in its strategies (The Star Online, 2009). On 10th September 2015 when Prime Minister Datuk Seri Najib Razak launched the Construction Industry Transformation Programme (CITP), Malaysia's last five-year plan for the construction industry before 2020, he mentioned that BIM will be made mandatory in the year 2020 (Tamboo 2015). However, up to date the BIM adoption in its earlier stages has yet to be wide-spread (Ahbabi and Alshawi 2015). Unfortunately, the majority in the built environment professions nowadays are facing significant changes to meet the current trend and needs of the construction industries. The main changes are the job scope of parties in the construction industry is no longer limited to cost planning, measurement, issuing Bills of Quantities, ensuring every stage of the on-going project to be completed on time but they also must be able to master certain information technology skills (Takim, Harris, and Nawawi 2013). Besides that, the fragmented construction industry has poor coordination among its project participants (Razif et al., 2015; Ding et al., 2015, Hughes & Thorpe, 2014, Solomon et al., 2015; Ntayi et al., 2013). Hence, despite the importance of BIM in improving the coordination, the lack of understanding about it makes the construction players in Malaysia reluctant to adopt it. This leads to the low adoption of BIM in architectural firms which stands at 20%, and quantity surveying firms at 10 % (Grant 2016).Therefore, the researcher finds that it is essential to provide a better understanding of the BIM implementation by studying the advantages of BIM adoption and the barriers which might be encountered. MAIN RESULTS
Methods
This research has conducted a pilot interview with five BIM practitioners who have been selected to give their professional opinions about the implementation of BIM. The BIM experts are from different professional backgrounds and organisations. Two of them are academicians and doctorate holders. The other two are from government agencies who are involved in BIM projects and one is from the private sector of a BIM consultant firm. The researcher has asked all the interviewees 13 questions and the conversation duration is about 1 and half hour for each participant. Basically, all the interviewees are very responsive to the questions being asked. Findings and Arguments
Table 1. Challenges from construction stakeholders’ perspective and their descriptions Challenges Description
Lack of cooperation
The current implementation of BIM in Malaysia, from the theoretical aspect, while we have implemented BIM in terms of coordination between the stakeholders such as the consultant, client and contractors, however, in reality, there is still a lack of cooperation between the structural or M&E consultants, architects and designers.
Lack of understanding and knowledge
The consultants, architects, contractors and designers still lack understanding and knowledge about the implementation of BIM, and this has led to misconceptions concerning the adoption of BIM. But this does not apply to all. There are still some consultants who agreed with BIM adoption because BIM can enhance coordination. In reality, it is difficult. If the developers are tied by traditional
36

methods, architect will develop their drawings, then pass them onto the C&S consultant for developing the structural drawing, and then to the M&E engineers. By right all the drawings will be superimposed for endorsement as should be the way.
Sharing culture is immature
When BIM has been implemented, issues can be resolved from the beginning. Differences cannot be resolved because the core issues currently lie with the sharing culture among all the parties which are still at a developmental stage and yet to be matured.
Lack of communication between main contractor and subcontractor
It is difficult to secure input from the subcontractor. Once construction has been conducted only then the problem-especially the clashes in piping can be identified by the Nominated subcontractor. However, architectural and structural parts do not have such problems.
Lack of guidelines
In theory, BIM is a process, as such BIM should proceed to the design stage. But currently, the most critical issues lie with the fact that the consultant is not yet ready to implement BIM. There is a lack of guidelines and enforcement to cater for the construction players.
Late involvement of Client
The appropriate approach requires certain consultants to monitor and control the project. This means all parties concerned have to set up what they want to do. Accordingly, the client should take part from the beginning and cater to all significant issues and route. In this way, most issues and disagreements can be resolved. In the event should there be future development-such as an extension of the building, it is important for the client to set his or her resolution from the beginning.
Lack of statement or enforcement
All parties involved are concerned about costs. But in their contracts, there is no statement that addresses the mandatory requirement for the use of BIM. There is also no solid procurement project delivery that specifies that BIM must be used. All the projects must be contractual based. If a client asks the contractor to use BIM for Design and Build or Design Bid Build projects, how the contractual based should be provided.
Lack of the previous record on BIM
Most of the construction players have acknowledged that BIM is beneficial for coordination, however, there is no tangible data to prove that the implementation of BIM is problem free.
CONCLUSION
The significance of this paper is that it reviews and provides insights as to the benefits of BIM implementation and the barriers that could be encountered. Notably, BIM specifically highlights a lot of current issues and problems that could be minimised. Therefore, based on previous studies gleaning from the perspectives given by the interviewees, this research is a critical review on the comparison of the benefits that can be gained by the adoption of BIM – in its different stages and barriers. Conclusively, the construction stakeholders have acknowledged the wide spectrum of benefits through the adoption of BIM albeit the fact that its implementation in the Malaysian construction industry is still in its infancy. They have, however, unanimously agreed that the main challenge could be the construction players’ mindset and thinking. Hence, the future research could look into the culture of construction industry or cover the soft issues which might affect the tendency of BIM implementation in the Malaysian construction industry.
Acknowledgment: The authors are grateful to Dr. Ahmad Tarmizi, the lecturer from University
37

Pahang Malaysia, professionals from CIDB and JKR for providing valuable information to prepare this article and to TARUC for funding this research under the Centre for Construction Research (CCR). REFERENCES
Ahbabi, Mubarak Al, and Mustafa Alshawi. (2015). BIM for Client Organisations: A Continuous Impro vement Approach. Construction Innovation 15 (4): 402–8.
Ding, Zhikun, Jian Zuo, Jinchuang Wu, Jy Wang, John Rogers, Heap-Yih Chong, and Christopher Preece. (2015). Key Factors for the BIM Adoption by Architects: A China Study. Engineering, Construction and Architectural Management Engineering, Construction and Architectural Management Iss Structural Survey 22 (1): 732–48.
Economic Planning Unit. (2015). Re-Engineering Economic Growth for Greater Prosperity. Eleventh Malaysia Plan 2016-2020.
Grant, Michael P. (2016). Building Information Modeling ( BIM ) in Malaysia Architecture Industry Building Information Modelling ( BIM ) in the Malaysian Architecture, no. May: 264–73.
Hughes, Rami, and David Thorpe. (2014). A Review of Enabling Factors in Construction Industry Productivity in an Australian Environment. Construction Innovation: Information, Process, Management 14 (2): 210–
28. Ntayi, Joseph Mpeera, Pascal Ngoboka, Isaac Ndahiro, and Sarah Eyaa. (2013). Leadership Ethical
Orientations, Mindfulness and Procurement Contract Performance in the COMESA Central Governments. World Journal of Entrepreneurship, Management and Sustainable Development 9 (2/3): 87–110.
Razif, Abdul, Abdul Razak, Akmal Aini Othman, Veera Pandiyan, and Kaliani Sundram. (2015). The Relationships of Human Success Factor, Information Technology, and Procurement Process Coordination on Operational Performance in Building Construction Industry – A Proposed Conceptual Framework. Procedia Economics and Finance 31 (15). Elsevier B.V.: 354–60.
Solomon, Nigeria, Olusola Babatunde, Srinath Perera, Lei Zhou, Chika Udeaja, Li-Zi Luo, Chao Mao, Li-Yin Shen, and Zheng-Dao Li. (2015). Barriers to Public Private Partnership Projects in Developing Countries: A Case of Nigeria. Iss Construction and Architectural Management, 22 (6): 669–91.
Takim, Roshana, Mohd Harris, and Abdul Hadi Nawawi. (2013). Building Information Modeling (BIM): A New Paradigm for Quality of Life within Architectural, Engineering and Construction (AEC) Industry. Procedia - Social and Behavioral Sciences 101. Elsevier B.V.: 23–32.
Tamboo, T K Letchumy. (2015). CITP to Transform the Construction Industry before 2020. Astro Awani. http://english.astroawani.com/business -news/citp-transform-construction-industry-2020-72839.
The Star Online. (2009). Construction Companies Urged to Adopt ICT. http://www.thestar.com.my/business/business -news/2009/08/20/construction-companies-urged-to-adopt-ict/.
38

II
SUSTAINABLE
TECHNOLOGY AND
ENGINEERING

ANALYSIS SHAPE AND DEVELOPMENT TIME
OF DAM BREACH AT JATIBARANG DAM
Abdul Kholik Romarchan, Togani Cahyadi Upomo, Rini Kusumawardani,
and Yeri Sutopo
Civil Engineering, Universitas Negeri Semarang, Semarang, INDONESIA
[email protected], [email protected], [email protected], [email protected]
ABSTRACT
Dams have many benefits, however dams can cause big problems. One of the problem is dam failure. Dam failure can cause loss of lives and materials. For example, the 1963 failure of Vajont dam in Italy caused 2600 deaths, the 1976 failure of Teton dam in America caused hundred deaths and economic loss about 1 bilion dollars, and the 1993 failure of Gouhou dam in China caused 300 deaths. Government of Indonesia have regulations about damsafety, which one each dam must have the document “Rencana
Tindak Darurat” (RTD) in order to anticipate loss of lives and material. This study was conducted to know the shape (wide and slope) and time development of the dam breach. Therefore the dam break analysis could be performed for purpose to fit up the document “Rencana Tindak Darurat”. The method of this study was Froehlich (1995 & 2008), MacDonald and Langridge-Monopolis (1984), Von Thun and Gillete (1990), Xu and Zhang (2009). Key words: Dam, Dam breach, Dam failure
INTRODUCTION
A dam is a barrier that stops or restricts the flow of water streams then collect to be used for many benefits. Benefits from dam is to be used for flood control, power plants, source of irrigation and clean water, fish cultivation, tourism, and etc. Dams have many benefits, however dams can cause big problems. One of the problem is dam failure. Dam failure can cause loss of lives and materials. For example, the 1963 failure of Vajont dam in Italy caused 2600 deaths, the 1976 failure of Teton dam in America caused hundred deaths and economic loss about 1 bilion dollars, and the 1993 failure of Gouhou dam in China caused 300 deaths (you, 2012). Government of Indonesia have regulations about damsafety, which one each dam must have the document “Rencana Tindak Darurat” (RTD) in order to anticipate loss of lives
and material. This study was conducted to know the shape (wide and slope) and time development of the dam breach. Therefore the dam break analysis could be performed for purpose to fit up the document “Rencana Tindak Darurat”.
UTM Razak School of Engineering and Advanced Technology Kuala Lumpur, Malaysia
10 October 2017
39

Jatibarang dam located at Semarang City, Indonesia. This dam located in highland of semarang city that makes the dam dangerous for city itself because can make the city sink if the dam failure. Due to jatibarang dam have spillway that able to serve Qpmf flood, then assumed jatibarang dam will failure because piping only. MAIN RESULTS
Jatibarang dam have some parameters, which shown at Figure 1.
Figure 1. Cross section Jatibarang dam
The method of this study was Froehlich (1995 & 2008), MacDonald and Langridge-Monopolis (1984), Von Thun and Gillete (1990), Xu and Zhang (2009).
Froehlich (1995): Utilized 63 earthen, zoned earthen, earthen with a core wall, and rockfill data sets. The data that Froehlich used for his regression analysis had the following ranges: height of the dams 3.66 – 92.96 meters and volume of water at breach time 0.0130 – 660.0 m3 × 106. Froehlich regression equations for average breach width and failure time are:
; Froehlich states that the average side slopes should be 1.4H:1V (for overtoping failures) and 0.9H:1V (for otherwise i.e., piping/seepage) Froehlich (2008): Utilized 74 earthen, zoned earthen, earthen with a core wall, and rockfill data sets. The data that Froehlich used for his regression analysis had the following ranges: height of the dams 3.05 – 92.96 meters and volume of water at breach time 0.0139 – 660.0 m3 × 106. Froehlich regression equations for average breach width and failure time are:
;
Froehlich states that the average side slopes should be 1.0H:1V (for overtoping failures) and 0.7H:1V (for otherwise i.e., piping/seepage)
40

MacDonald and Langridge - Monopolis (1984): Utilized 42 data sets (predominantly earthfill dams with a clay core, rockfill dams) to develop a relationship for what they call the “Branch Formation Factor”. The data that MacDonald and Langridge – Monopolis used for his regression analysis had the following ranges: height of the dams 4.27 – 92.96 meters and volume of water at breach time 0.0037 – 660.0 m3 × 106. MacDonald and Langridge - Monopolis equation for volume of material eroded and breach formation time, as reported by wahl (1998):
; ;
MacDonald and Langridge - Monopolis states that the average side slopes should be trapezoidal 0.5H:1V. Von Thun and Gillette (1990): Used 57 dams from both the Froehlich (1987) paper and the MacDonald and Langridge – Monopolis (1984) paper to develop their metodology. The data that Von Thun and Gillette used for his regression analysis had the following ranges: height of the dams 3.66 – 92.96 meters and volume of water at breach time 0.027 – 660.0 m3 × 106. The Von Thun and Gillette equation is:
; ; Von Thun and Gillette states that the average side slopes should be trapezoidal 0.5H:1V. Xu and Zhang (2009): contained 182 earth and rockfill dams from the U.S and China, with nearly 50% of the dams greater than 15 meters in high. The data that Xu and Zhang
used for his regression analysis had the following ranges: height of the dams 3.2 – 92.96 meters and volume of water at breach time 0.105 – 660.0 m3 × 106. The Xu and Zhang
equation is:
; ;
; Xu and Zhang states that the average side slopes should be trapezoidal “Z”H:1V. Shown in table.1 is a summary of the breach parameters computed from the regression equation.
Table 1. Summary of Breach Parameter Estimates
Method
Breach Bottom Width
(meters)
Breach Top
Width (meters)
Average Breach Width
(meters)
Breach Side
Slopes (H:1V)
Area (m2)
Breach Failure Time
(hours)
Froehlich (1995a) 20.55 159.15 89.85 0.90 6918.45 0.381 Froehlich (2008) 16.23 124.03 70.13 0.70 5400.01 0.329 MacDonald and Langridge - Monopolis (1984) 37.30 114.30 75.80 0.50 5836.56 1.610
41

Von Thun and Gillette (1990) 193.28 270.28 243.15 0.50 17847.06 0.671 Xu and Zhang (2009) 53.70 198.78 126.24 0.94 9720.44 0.633 CONCLUSION
All five sets of parameters should be entered into the HEC-RAS software and run as separate brench plans. This Will result in five different brench outflow hydrographs. However, once the hydrographs are routed downstream, they will begin to converts towards each other. There are two main reasons for this convergence: (1) the total volume of wáter in each of the different hydrographs is basically the same (being the stored wáter behind the dam at the time of failure, plus whatever inflow occurs; (2) as the hydrographs move downstream, a Sharp hydrograph will attenuate much more quickly than a flat hydrographs. For a risk assessment study, the user select the set of breach parameters that are considered to be most likely for each event/ pool elevation. This will require engineering judgement. If all of the breach estimates, for a given event/ pool elevation, end up converging to the same flow and stage before getting to any populations at risk and potential damage areas, then the selection of final set of breach parameter should not affect the computations and a simple mean value should be used. However, if the varios sets of breach parameters produce significantly different flow and stage values at downstream locations (population at risk locations and potential damage zones), then engineering judgement will need to be used to pick a set of values that are considered most likely. Conservatively high or low values should not be used, as this will bias the overall results. REFERENCES
Froehlich, David C., (1995). Embankment Dam Breach Parameters Revisited . First International Conference, Water Resources Engineering, Environmental and Water Resources Institute (EWRI), 14 – 18 August 1995. ASC, Water Resources Engineering Proceeding, pages 887 – 891.
Froehlich, David C., (2008). Embankment Dam Breach Parameters and Their Uncertainties. ASCE, Journal of Hydraulic Engineering, Vol. 134, No. 12, December 2008, pages 1708 – 1721. ISSN 0733 – 9429.
MacDonald, Thomas C., and Langridge-Monopolis, J, (1984). Breaching characteristics of dam failures.
ASCE Journal of Hydraulic Engineering, Vol. 110, No. 5, May 1984, pages 567 – 586. US Army Corps of Engineers. (2014). Using HEC-RAS for Dam Break Studies, Hydrologic Engineering
Centre. Von Thun, J. Lawrence, and Gillette, D. R., (1990). Guidance on breach parameters. Unpublished internal
document, U.S. Bureau of Reclamation, Denver, CO. March 1990, 17 pages. Wahl, Tony L., (1998). Prediction of Embankment Dam Breach Parameters – A Literature Review and
Needs ASSessment. Dam Safety Research Report, DSO-98-004. Water Resources Research Laboratory, U.S. Dept. of the Interior, Bureau of Reclamation, Dam Safety Office (DSO), July 1998.
Washington State Dept. of Ecology, (1992). Dam Safety Guidelines, Technical Note 1, Dam Break
Inundation Analysis and Downstream Hazard Classification . Water Resources Program, Dam Safety Office, P.O. Box 47600, Olympia. WA 98504-7600, July 1992 (revised October 2007)
Xu, Y. and Zhang , L. M., (2009). Breaching Parameters for Earth and Rockfill Dams. ASCE Journal of Geotechnical and Geoenvironmental Engineering, Volume 135, No.12, pages 1957 – 1970, December 2009.
You, L. Li, C. Min, X. Xiaolei, T., (2012). Review of Dam-break Research of Earth-rock Dam Combining
with Dam Safety Management. ELSEVIER. Emgineering Proceeding, pages 382 – 388.
42

SOIL NAILING DESIGN AND TECHNIQUE FOR CUT SLOPE
STABILIZATION: A REVIEW
Mohd Sukry Mohamed*and Samira Albati Kamaruddin
Department of Engineering, Razak School of Engineering and Advanced Technology, Universiti
Teknologi Malaysia Kuala Lumpur, MALAYSIA *[email protected], [email protected]
ABSTRACT
Soil nailing has been used to reinforce and strengthen slopes by placing steel rods into drilled-hole walls and grouted. The reinforcement is grouted in place to improve the stability of slopes, strengthen excavations and retaining walls. Better selection of soil nailing can solve issues related to limited buffer zone to construct building, boundary issue, slope cutting that encroaches neighbouring side, rental cost of machineries and trucks to export the cut soils, and non-economical method. Other challenges such as heavy rainfall, unexpected pore-water pressure and additional excavation and temporary dewatering can increase cost and time of work. With regards to the issues, this paper aims to review the soil nailing design and technique for slope stabilization in housing and infrastructure construction industry. From the presented different methods and advantages of soil nailing techniques, some methods are found very fast to be constructed but no corrosion protection and only suitable for temporary slopes. The review also indicates that economy structure of soil nailing and utilization of different optimization design methods are required to achieve an optimum design. The availability of software programme purposely for soil nailing reanalysis also capable to determine the soil nailing design performance and achieved the required safety factor (FOS). In depth reviews on selected soil nailing technique and software analysis such as SLOPE/W that used finite element method are recommended in future study.
Key words: Soil nail, Optimum design, Slope failure, Cost effective and Construction slope
INTRODUCTION
Slope failure potentially occurred in the hillsides and steep slopes (Mokhtar Jaafar et al. 2011). Normally, fill slopes should be constructed with a 1.5:1 ratio and if a slope is steeper than this, it is difficult to be stabilized. Filled material, over-steep slopes, weak material zones and cuts in natural soils that have high groundwater level are several causes of construction failure (NTL, 2013). Retaining walls or structures are designed and constructed to solve the problems and a best slope strengthening method is selected to avoid any landslide. Soil nailing is known as a cost-effective construction technique to strengthen weak slope (Jelusic and Zlender, 2013). Constructing a retaining system in deep excavations steep slopes has been proven to be less difficult, cost-effective and has been
UTM Razak School of Engineering and Advanced Technology Kuala Lumpur, Malaysia
10 October 2017
43
extensively used in stabilizing cut slopes in infrastructure projects (Jaya and Joy, 2013). Soil nailing is defined as a passive method to strengthen existing ground by placing steel rods into drilled-hole walls and grouted (Stauffer, 2015; Jaya and Joy, 2013; Zhou et al., 2009). Soil nailing reinforcement is grouted in place to improve the stability of slopes (Geoguide 7, 2008) and strengthen excavations and retaining walls (Fan and Luo, 2008; Ghareh, 2015; Giacchetti et al., 2013; Giri and Sengupta, 2009; Huang, 2012; Lin and Liu, 2017; Kim et al., 2013). Before using soil nailing as a retaining wall, clients may faced problems related to limited buffer zone to construct building, boundary issue and slope cutting that encroaches neighbouring side. Reducing slope inclination can increase costs due to involvement of rental cost of machineries and trucks to export the cut soils. This also increases duration of the construction work that limiting clients’ desire to get more profit (FHWA 2015). Since many slopes in Malaysia are exposed to heavy rainfall, water is one of the root causes of slope failure. Therefore, unexpected pore-water pressure becomes a big challenge and additional excavation and temporary dewatering can increase cost and time of work (Chan et. al, 2017). The stability of temporarily unsupported cuts can be affected if groundwater is present (FHWA 2015). This paper aims to review the soil nailing design and technique for slope stabilization in housing and infrastructure construction industry. The review is limited to soil nailing technique that is used in cut slopes. This technique is not suitable for fill slopes because loose fills may lose strength when exposed to shearing at a certain degree of slope. Moreover, forces that mobilized in the nails cannot recover the loss of shear strength in the fills (HKIE, 2013). Fixing soil nails in loose fills can be difficult and involved careful monitoring. More grouting work is required and some ground movements during installation are unavoidable (HKIE, 2003). In soil nailing design, all parameters obtained from site investigation are used for design requirement such as gradient of slope (ß), nails inclination (i), diameter (Ø), length and spacing of nails (FHWA, 2015). In the design, safety factor (FOS) requires margin of safety against failure (Geoguide 7, 2008) and the actual load-bearing capacity of a structure. MAIN RESULTS
The selection of slope stabilization method is very important depending on site situation. Several retaining walls can be constructed but suitability method should be taken into consideration. As discussed earlier, soil-nailing technique is selected due to its cost effective. Five types of soil nailing techniques with different methods and advantages as presented previously by Prashant and Mukherjee (2010), are shown in Table 1. Some methods are very fast but no corrosion protection and only suitable for temporary slope. For the optimal design, designers consider structure of soil nailing that is economy and utilize different optimization design methods during design stage by comparing the structural design (Chan and Raman, 2017). According to JKR Slope Design Guideline (2010), the minimum local and global FOS for treating slopes shall be 1.5. Requirement listed in Table 2, should be complied to achieve an optimum design. A few existing software programme for soil nailing technique as shown in Table 3 commonly used by engineers to analyse the soil nailing design performance. From the listed software, SLOPE/W shows potential advantage to researchers as this software provides analysis of pore-water pressure conditions, soil properties, and slope stability problems. Through the optimization of trial and error method, parameters are
44

adjusted to achieve FOS of 1.5. According to Jin (2014), when the horizontal spacing design of soil nailing is 1.4 m, the slope with soil nailing support is exceptionally steady and the most extreme level spacing only could be add is within 1 to 2 cm. The design can guarantee engineering safety, but it was not economical. Reproducing design and contrasting through computer-generate analysis of soil nailing support and distinctive separation by software can get a sensible decision in reduce project cost (Jin et al., 2014).
Table 1. Soil nail technique, method and different (Prashant and Mukherjee, 2010) Type of soil nailing Method Differences
Grouted Nail The nails are placed in the pre-drilled hole after excavation of the first hole in the slope.
Cement grout is then filled in the holes at the end.
Driven Nail Nails are mechanically driven using vibropercussion pneumatic or hydraulic hammer to the wall during excavation.
Installation is very fast but no corrosion protection is offered. Suitable for stability of temporary slope.
Self-Drilling Soil Nailing
During the drilling, hollow bars are driven and at the same time, grout is injected through.
Better corrosion protection than Driven Nail and faster than the Grouted Nail.
Jet Grouted Soil Nailing
Using high frequency vibropercussion, driving and high-pressure jet grouting is performed during installation.
Jet grouting is performed during installation and provides corrosion protection to the nail.
Launched Soil Nailing Bars are launched into the soil with very high speed using compressed air launcher.
Installation is very fast and no grouting is needed to the nail and nail installation can be optimized with minimum site destruction.
Table 2. Design requirement for an optimum design and practice (FHWA, 2015; Geoguide
7, 2008) Soil nailing
reinforcement Requirement Optimum design and practice
Develop Wall Layout
Determines the height range, wall length and wall alignment
Cost-saving detection, limitations to the drilling equipment, and site survey will be carried out to identify to encounter obstruction during desk study.
Wall Batter Face wall can be vertical or nearly vertical.
Can use shorter nails if 10 degrees batter is applied to lower down the forces transferred to nails.
Soil Nail Spacing Ranges from 1.5m to 2m. For nails spacing in both directions.
Rows of soil nails should be staggered. Suggestion spacing nail is a 5 ft. centre to centre.
Soil Nail Inclination
Inclination at 10 to 20 degrees from the horizontal slope.
An inclination of < 10 degrees should be avoided.
Soil Nail Length Approximately 0.7H; H = Height. Nail lengths < 0.5H should be avoided. The common nail length is 0.6H.
Soil Nail Diameter High yield deformed steel bars of Diameter nail over 20m or 40 mm should
45

diameter 25 mm, 32 mm and 40 mm. be used due to tendency to bend excessively during installation.
Distribution in Elevation
Subsurface and geometric conditions are depending on selection R < 1.0.
i) 0.15 ≤ R ≤ 0.30 is for very dense, coarse-grained granular soils. ii) 0.25 ≤ R ≤ 0.40
is for silty sand, sand, to gravelly sand. iii) 0.30 ≤ R ≤ 0.45 is for fined-grained soils.
Sellect Pattern on Wall Face
Square pattern or staggered pattern. Staggered pattern results in better soil arching effects, provides a slightly larger resistance and more uniform earth-pressure distributions.
Evaluate Horizontal Splaying
Avoid obstructions and other utilities. Avoid external corners due to interference with adjoining nails or at internal corners, possibly improves the stability.
Before using a design computer programme, nail splaying angle must be considered.
Select Type, Diameter drill hole and Material Properties
To provide bond resistance for stability, a practical minimum drill hole must be estimated. The diameter of drill hole is between 100mm to 200mm.
To accommodate a tremie pipe, tendon couplers, and centralizers .
Table 3. Existing available software analysis Numerical
model Description of Model Numerical
formulation Provider Reference
PLAXIS Design and analysis of soil and rock deformation and stability, soil structure interaction, and groundwater and heat flow for 2-Dimensional and 3-Dimensional engineering,
Limit Equilibrium Method
Iman Systems
(Da Costa and Sagaseta, 2010)
ABAQUS Used for both the modelling and analysis of mechanical components and assemblies (pre-processing) and visualizing the finite element analysis result.
Finite Element Method
Dassault Systèmes
(Stauffer, 2015; Su, 2006)
SNAP_2 Evaluates the internal and external wall stability (including limit-equilibrium global slope stability) based on the current standards in the ASD method. Used to evaluate verification and proof field test results.
Limit Equilibrium Method
The Federal Highway Administration (FHWA)
(FHWA, 2010)
SLOPE/W Used to analyse slip surface shapes, pore-water pressure conditions, soil properties, slope stability problems, analysis methods and loading conditions. Overcome some limitations of the purely limited equilibrium formulations.
Finite Element Method
GEO-SLOPE International Limited
(Geo-Slope, 2012)
46

CONCLUSION
This review has summarized the soil nailing application, design and its software analysis. The optimization of soil nailing design is presented to ideally propose a cost-effective method. By using this soil nailing technique, construction cost can be reduced because of optimum design and practice implemented. Selected method of soil nailing technique and software analysis such as SLOPE/W that used finite element method are recommended in future study.
Acknowledgment: The first author is an Engineering Doctorate student who is partially supported by Ministry of Higher Education (Malaysia). REFERENCES
Amit Prashant and Mousumi Mukherjee (2010). Soil Nailing for Stabilization of Steep Slopes near Railway Tracks, Department of Civil Engineering Indian Institute of Technology Kanpur. Research Design and Standard Organization (RDSO), Lucknow, India.
Chan, C. M. and Raman, M. H. A. (2017). Screw-in soil nail for slope reinforcement against slip failure: A lab-based model study. International Journal of GEOMATE, 12(29), 148-155.
Da Costa, A. and Sagaseta, C. (2010). Analysis of shallow instabilities in soil slopes reinforced with nailed steel wire meshes. Engineering Geology, 113(1–4), 53-61. doi:http://dx.doi.org/10.1016/j.enggeo.2010.02.005
Department of Transportation Federal Highway Administration (2015). Soil Nail Walls Reference Manual. (FHWA-NHI-14-007). U.S.A.: National Highway Institute.
Fan, C. C. and Luo, J. H. (2008). Numerical study on the optimum layout of soil–nailed slopes. Computers and Geotechnics, 35(4), 585-599. doi:http://dx.doi.org/10.1016/ j.compgeo.2007.09.002.
Geoguide 7 (2008), Guide to Soil Nail Design and Construction. (Vol. 7). Hong Kong: Geotechnical of Engineering Office the Government of Hong Kong.
Ghareh, S. (2015). Parametric assessment of soil-nailing retaining structures in cohesive and cohesionless soils. Measurement, 73, 341-351. doi:http://dx.doi.org/10.1016/j.measurement.2015.05.043.
Giacchetti, G., Grimod, A. and Cheer, D. (2013). Soil Nailing with Flexible Structural Facing: Design and Experiences. In C. Margottini, P. Canuti, & K. Sassa (Eds.), Landslide Science and Practice: Volume 6: Risk Assessment, Management and Mitigation (pp. 655-660). Berlin, Heidelberg: Springer Berlin Heidelberg.
Giri, D. and Sengupta, A. (2009). Dynamic Behavior of Small Scale Nailed Soil Slopes. Geotechnical and Geological Engineering, 27(6), 687. doi:10.1007/s10706-009-9268-x.
HKIE Geotechnical Division Subcommittee (2003), Soil Nails in Loose Fill Slopes . Institution of Engineers , Hong Kong.
Huang, J. H. (2012). Finite Element Analysis of Composite Soil-nail Retaining Structure in Foundation Pit Engineering. In W. J. Yang & Q. S. Li (Eds.), Progress in Industrial and Civil Engineering, Pts. 1-5 (Vol. 204-208, pp. 163-167).
Jaya V and Anie Joy (2013). Journal of Civil Engineering and Science. An Investigation on the Dynamic Behaviour of Soil Nail Walls. 2(4), 241-249.
Jin, Q. P., Zheng, Z. J., Chen, Z. and Lei, X. W. (2014). Simulation and Optimization on GFRP Soil Nailing Support. In S. B. Choi, Y. H. Kim, & P. Yarlagadda (Eds.), Applied Mechanics and Materials Ii, Pts 1 and 2 (Vol. 477-478, pp. 543-546).
Kim, Y., Lee, S., Jeong, S. and Kim, J. (2013). The effect of pressure-grouted soil nails on the stability of weathered soil slopes. Computers and Geotechnics, 49, 253-263. doi:http://dx.doi.org/10.1016/j.compgeo.2012.12.003.
Lin, P. and Liu, J. (2017). Analysis of resistance factors for LFRD of soil nail walls against external stability failures. Acta Geotechnica, 12(1), 157-169. doi:10.1007/s11440-016-0443-y.
Primoz Jelusic and Bojan Zlender (2000). Acta Geotechnica Slovenica. Soil-Nail Wall Stability Analysis Using Anfis. 1, 61-73.
Slope Engineering Branch (2010). Guidelines for Slope Design. (1st ed.). Malaysia: Public Works
Department.
47

Stauffer, K. D. (2015). Three-Dimensional Stability Analyses of Soil-Nailed Slopes by Finite Element Method. (3702043 Ph.D.), West Virginia University, Ann Arbor. Retrieved from https://vpn.utm.my/docview/1681515148?accountid=41678 ProQuest Dissertations & Theses Global database.
Su, L.-J. (2006). Laboratory pull -out testing study on soil nails in compacted completely decomposed granite fill. (3241089 Ph.D.), Hong Kong Polytechnic University (Hong Kong), Ann Arbor. Retrieved from https://vpn.utm.my/docview/304908124?accountid=41678 ProQuest Dissertations & Theses Global database.
Yang, G.-L., Liu, Z.-Z., Xu, G.-L., & Huang, X.-J. (2010). Protection Technology and Applications of Gabion. In Y. Chen, L. Zhan, & X. Tang (Eds.), Advances in Environmental Geotechnics: Proceedings of the International Symposium on Geoenvironmental Engineering in Hangzho u, China, September 8–
10, 2009 (pp. 915-919). Berlin, Heidelberg: Springer Berlin Heidelberg. Zhou, Y. D., Cheuk, C. Y., & Tham, L. G. (2009). An embedded bond-slip model for finite element
modelling of soil–nail interaction. Computers and Geotechnics, 36(6), 1090-1097. doi:http://dx.doi.org/10.1016/j.compgeo.2009.03.002
48

INVESTIGATION OF LANDSLIDE TRIGGERING FACTORS
USING GEO-RESISTIVITY
METHOD
Yusita Dyka Auria Suyanto, Rini Kusumawardani and Untoro Nugroho
Civil Engineering Department, Universitas Negeri Semarang, Semarang, INDONESIA
[email protected], [email protected]
ABSTRACT
Since Indonesia is located on the equator, causing it has a high annual rainfall approximately about 3500 mm/year. In addition, Indonesia also has many mountainous areas that causing it has a steep topography and also a various geology condition in each region. Those two factors are indicated as a trigger of natural landslide disaster. Another factor that also triggers the occurrence of the landslide is the changing of land function on catchment areas and slopes. The landslide disaster in Indonesia is increasing continuously in the last decade with the number of the event reach up to 3875 events. For example, in 2014 in Trangkil, Semarang City, the landslide was occurred and destroy at least 32 houses, and in the same year in Gombel Lama, Semarang City, 21 peoples were found buried by the landslide. In 2016 in Bukitsari Housing, landslide causing two peoples dead due to the collapse of the retaining wall. This research was conducted to visualize the form of the subsurface of soil layer by comparing the result of geo-resistivity and geological map that could be used as a reference to determine the location of the slips field. Key words: Landslide, Geo-resisitivity, Wenner-Schlumberger
INTRODUCTION
Indonesia is one of the countries located on the equator and has high annual rainfall approximately about 3500 mm/year. Other than that, Indonesia also has numerous mountainous area that makes its topography tends to steep as well as makes each region has a diverse geological condition therefore it is indicated as the cause of the landslide. In addition climate change affects the stability of the natural and artificial slopes that resulting in landslides (Gariano, L.S and Guzzety F, 2016). There are numerous causes of the landslide, caused by natural namely are the topography location, rock layer condition, soil condition, geological shape, rainfall intensity, groundwater, earthquake, etc. Meanwhile, caused by human or artificial, namely are excavation or displacement of rocks, and landfill (Bromhead, 1992).Landslide disaster in Indonesia continues to increase in the last decade with a total of 3875 incidents (BNPB, 2017). The city of Semarang is a region that has a various topographical condition such as coastal areas, plains, and hills. The hilly topography conditions with the angle of slope range in 0% - 45% resulting in many unstable slopes. This instability occurs due to the geological structure in Semarang City which consists of normal
UTM Razak School of Engineering and Advanced Technology Kuala Lumpur, Malaysia
10 October 2017
49

faults, rising faults and shear faults. Because of this shear faults and rising faults, the movement of the land occurs. The example of a landslide incident in Semarang, in 2014 at Trangkil region of Semarang, landslide damaged 32 houses, in the same year in Gombel Lama region of Semarang 21 people were found buried in landslides, and in 2016 in Bukitsari Housing, 2 people were killed due to collapse of retaining wall (BPS Kota Semarang, 2016). This research was conducted to visualize the form of the subsurface of soil layer by comparing the result of geo-resistivity and geological maps that could be used as a reference to determine the location of the slips field.
METHODOLOGY
The research location is located in TAMAN UNNES Gunung Ledek, Trangkil, City of Semarang. The research focuses on red zone area at point 178 with the altitude of 139 meters above sea level. The coordinate of the location is located at 72'7" S - 11023'27" E.
Figure 2. Topography map of research location Figure 3. The condition of research The research location have a various tilt angle of slope with the biggest angle is >30o. Based on the geological map on research site that consists of volcanic rock (Qb) such as breccia, lava flows, tuffs, sandstone, and clay so that results in weathering of rocks of slit clay reddish-brown with a thickness of more than 3 meters. Marin layer (Tm), consists of alternating clay, marl, sandstone, conglomerate, breccia, and limestone. Marin layer is dominated by clay with alternating sandstone and marl. Generally, clay on Marin layer is effortless to decay and destroyed when it exposed to air contact. Meanwhile, sandstone on this layer, generally have a fine-coarse-grained and mostly is tuffs. The stratification of the limestone on this layer is can not determined. Damar formation (Qtd), consists of tuffs-sandstone, conglomerate, breccia, and tuffs. The composers of tuffs-sandstone are consists of feldspar and mafic mineral grains, sandstone, and tuffs in compressed conditions. Breccia is consist of alkaline volcanic rocks that are likely deposited as lava. Breccia is usually decayed in the form of silty-sand to brownish-red clayey-silt with 2.5 meter of thickness (Figure 4). Figure 4. Map of geological condition
50

The geoelectric investigation is a soil investigation for obtaining estimates on soil subsurface layer based on the pseudo resistivity value of each layer of rock/soil that influenced by the configuration factor. With equation formula as follows :
................................................................. (1)
explanation, is apparent resistivity (ohm.m), is voltage difference (volt), I is currents (ampere), k is configuration factor. The configuration that was used in this research is Wenner-Schlumberger configuration that is intended that the vertically and horizontally sensitivity values are better than the other configurations. The formula equation of geometric factor (k) is as follows,
k = .......................................................... (2) where as, k is geometric factor, n is multiplier, a is distance of the electrode. The spacing between 2 electrodes is 2 meter with path length 50 meter with the value of n is from n = 1 up to n = 12. The data that was obtained from field investigation with geoelectric is the value of the potential difference of electrode (volt) and value of current-voltage (ampere).
RESULT AND DISCUSSION
The geoelectric analysis was done by using RES2DINV software for Win 98 / Me / NT / 2000 / XP, and the result of a 2D model of the subsurface layer was obtained (Figure 5).
Figure 5. Visualization and interpretation of cracks and slip surface on the slopes
From these results, the interpretation of a resistance value of pseudo rocks type on the slope of Taman UNNES. Based on the geoelectric testing result on 0.5 – 2.5 meter in depth, the resistivity value of soil is 1.7 x 10⁻³ – 0.846 Ωm and is interpreted as clay. This testing result
is influenced by the presence of the cavity in the soil so that when in the raining season, the soil tends to store a lot of water content and when in the summer season the soil is shrinking so that resulting in cracks in the soil (Figure 6).
Figure 6. Cracks of the slopes on research location
On 2,5 – 5 meter in depth the resistivity value of 6.76 Ωm is interpreted as clay, on 5 – 15 meter in depth, the resistivity value of 53.8 Ωm is interpreted as sandy tuffs, and on 15 – 20 meter in depth, the resistivity value of 429 – 3415 Ωm is interpreted as sandstone. The layer
Cavity on Soil Slip Surface
51

that was indicated experienced a sliding occur on the boundary between clay layer and sandy tuffs layer has a resistivity value between 6.76 – 53.8 Ωm. The correlation between the geoelectric result and geological map can predict that the geological structure on the subsurface on the research location is consists of clay and sand. CONCLUSION
Based on the analysis result it can be seen that the topography with slope >30 is considered as a steep slope that could cause a landslide. Another factor that based on geo-resistivity analysis can be seen that the resistivity value of 1,7 x 10⁻³ – 6,76 Ωm is classified as clay on
0 – 5 meter in depth, 53.8 Ωm is classified as sandy tuffs on 5 – 15 meter in depth and 429 – 3415 Ωm is classified as sandstone on 15 – 20 meter in depth. On soil with clay type that has a resistivity less than 1 is known that when in the rainy season tends to store a lot of water content and in the summer season tends to dry and also has cracks. It is indicated as the cause of the landslide. On the average, the depth of sliding field is located on 6 until 10 meters in depth. The soil layer that experienced a sliding field is consist of silty sand. REFERENCES
Badan Pusat Statistik (BPS) Semarang City. 2016. ISSN: Katalog 1102001.3374. Kota Semarang Dalam Angka
Bromhead, E.N., 1992. The stability of slops, Blackie Academic & Professional. Cha, K.S., Kim T.H,. 2010. Evaluation of Slope Stability with Topography and Slope Stability Analysis
Metode. KSCE Journal of Civil Engineering 15(2) : 251 – 256. Badan Nasional Penanggulangan Bencana (BNPB).2017. http://dibi.bnpb.go.id/data-bencana/kejadian bencana
- tanah longsor/ access on June 20, 2017 Gariano, Stefano Luigi and Guzzetti Fausto. 2016. Lanslides in a Changing Climate. Earth Science Reviews.
Vol 162, November 2016. Page 227 – 252. doi: 10.1016/j.earsciev.2016.08.11 Universita degli Studi di Perugia, Department of Physics and Geology, Pascoli, Italy
Loke,M.H,. 2004. Tutorial : 2D and 3D electrical imaging surveys. Rogers, C. T. and Sitar, N. (1993). Expert systems approach to regional evaluation of debris flow hazard,
Geotechnical Engineering Report No. UCB/GT/93-08, Geotechnical Engineering Department of Civil Engineering, University of California, Berkeley.
Sugito, Irayani Z, Jati I P. 2010.Investigasi Bidang Gelincir Tanah Longsor Menggunakan Metode Geolistrik Tahanan Jenis di Desa Kebarongan Kec. Kemranjen Kab. Banyumas. Vol.13., No.2, April 2010. Hal 49 – 54.
Telford, W.M, Geldart, L.P.,Sheriff, R.E,. 1990. Applied Geophysic 2nd ed. Cambridge University Press. London.
Thanden, R.E., Sumadirdja, H., Richards, P.W., Sutisna, K., and Amin, T.C., 1996. Geological map of The Magelang and Semarang Sheet, Java, scale 1:100.000. Geological Research and Development Centre, Bandung.
Yerro A. et al. 2016. Run – out of lanslides in brittle soils. Comput Geotech. dx.doi:org/10.1016/j.compgeo.2016.03.001
52
FACTORS INFLUENCE FIRE EVACUATION TIME FOR HIGH-
RISE BUILDING: TELEKOM TOWER
Yogginy Kudarsamy*1, Nor Fazilah Mohd Hashim2 and Norzaida Abas2
1 Telekom Malaysia Berhad, Jalan Pantai Baharu, Kuala Lumpur, MALAYSIA
*[email protected] 2 Razak School of Engineering & Advanced Technology, Universiti Teknologi Malaysia (UTM),
Kuala Lumpur, MALAYSIA [email protected], [email protected]
ABSTRACT
Building evacuation is a critical element of a high rise building’s emergency safety. Hence, it is important to have a deep research on the full-scale evacuation from a high-rise building as it assists in gaining better understanding on how prepared and fast can a high-structure be evacuated fully. This study is undertaken to identify all possible contributing factors that result in lengthy evacuation time and to recommend appropriate evacuation procedures for shorter evacuation time at Telekom Tower, the third tallest building in Malaysia. The current evacuation procedures implemented at the tower were examined using mixed-methods approach, incorporating both qualitative and quantitative analysis. Results of the factors that influence the evacuation time is summarized into three main categories: individual factor, organizational factor and structural factor. Based on the outcome, this study propose further recommendations for the building management of Telekom Tower to implement on new egress strategy such as phased evacuation as well as new vertical egress methods such as helicopter and escape chute system as an effort to improvise the evacuation time at Telekom Tower. Key words: High-rise building, Evacuation, Egress time, Assembly area, Fire safety
INTRODUCTION
In recent decades, urbanization process due to rapid development of economic has contributed to the growth of many big cities around the world. As a result, this has caused limitations in land space due to the increase in the population of occupants in these major cities. Therefore, many ultra large scale high-rise building over 100-meter have been constructed unceasingly by the developers. These high-rise building comprises of residential, office and commercial buildings such as hotel and shopping complex. National Fire Protection Association (NFPA), the United States Trade Association defined high-rise buildings as a building which is built greater than 75 feet in height (approximately 23m or about eight or ten stories and more), where the building height is measured from the lowest level of fire department vehicle till to the highest accessible floor (NFPA 2012). In Malaysia, buildings that built above 12 floors are considered as
UTM Razak School of Engineering and Advanced Technology Kuala Lumpur, Malaysia
10 October 2017
53

high-rise category (Bernama 2011). Examples of high-rise building in Malaysia are the Petronas Twin Tower, Kuala Lumpur Tower, Telekom Tower and many more. Hence, a research was conducted at Telekom Tower located at Jalan Pantai, Kuala Lumpur as it is considered as third tallest building in Malaysia with 55 floors and more than 10,000 occupants. On the other hand, the development of these high-rise building have also proportionally contributes to the increase in potential safety hazards. Some of the example of dangerous hazards that pose serious challenge and being associated with high-rise buildings are such as fire outbreaks, terrorist attack, release of toxic gas and others. Particularly in Malaysia, fire outbreak is one of the common hazard that can cause enormous causalities and property loss and hence influences the social stability and economic development of the country (Prashant 2007). Generally, most of the high-rise buildings in Malaysia are equipped with standard safety features that able to facilitate for minor or moderate emergency evacuations as it is governed by the Uniform Building By-Law, UBBL 1984 regulation (Bernama 2011). Therefore, a major emergency evacuation from a high-rise building is very unlikely to be practiced, which subsequently results in less knowledge on the readiness, capabilities and effectiveness of fast evacuation from a high-rise building. The factors that may influence the length of time for evacuation from a high-rise office building is still remain under-studied. Knowledge from these finding is very vital as it can be used to improvise emergency evacuation procedures and save people from any injury or causalities.
Hence, the main aim of the present work is to identify the possible contributing factors that may results in lengthy evacuation time of high-rise office building and then investigate the ways to improve safety evacuation and proposed a new evacuation procedure for shorter evacuation time. MAIN RESULTS
The primary method is data collection through semi-structured interview where the building safety officer and the Representative from Fire & Rescue Department was interviewed to obtain their opinions on current evacuation procedures at Telekom Tower. The secondary source is based on data collected through questionnaire survey form that were distributed randomly to the occupants residing from varies floor at Telekom Tower. The questions mainly focus on the awareness and knowledge of the occupants on subjects pertaining to emergency fire evacuation at Telekom Tower, opinions on factors that might influence the length of evacuation time as well as their personal experience in participating in the previous fire drill practice that was being conducted. Lastly, observation and visual inspection on the condition and structural of Telekom Tower building were carried out to identify the environmental factors that contribute to lengthy evacuation time. In a nutshell, all these possible contributing factors that leads to delay in evacuation time was gathered, summarized and developed as a framework as shown in Table 1. Results show that factors such as human behaviors and response, lack of coordination between multiple tenants, physical ability, lack of awareness and commitment contributes largely to the lengthy of evacuation time during fire drills. This is proved when
54

only half of the tenants agreed to evacuate immediately from the building when hearing fire alarm.
Table 1. List of identify factors that influence the length of evacuation time at Telekom Tower
Factors List of factors Individual Factor
- Physical Limitation – Age, gender, obesity, fatigue and pregnancy
- Disability & Medical Condition – visual & Hearing Impairment, Mobility Impairment
- Lack of Awareness, Commitment & Involvement - Human Behaviors & Responses-Delaying. Negligence &
Inconsiderate - Sensory Cues - Lack of perception of risk-Exit choices. Route taken,
stopping and others - Low level of knowledge on Emergency Preparedness
Organizational Factor
- Lack of coordination and involvement from multiple tenants
- Inadequate risk communication - Delay and lack of cooperation among the Emergency
Response Team members Environmental Factor
- Situational features – Evacuee density, conditions of escape routes. Confusion and judgments of using exit choices
- Engineering features – no. of exit choices, poor lighting at escape routes, unilluminated staircase and location of the building – encircled in between of major highways and etc.
CONCLUSION
In conclusion, the current evacuation procedure being implemented at Telekom Tower is complete, sufficient and adequate to have a systematic and well-organize emergency evacuation at the building. However, certain amendments and revision such on designated assembly point and re-assignment of designated exit staircase choices to be used based on the density of the occupants in each floor can be considered for future works. Primarily, new strategies and techniques need to be developed in order to increase the awareness as well as increase the effectiveness on implementation of evacuation procedures among the multiple tenants residing at the building.
Acknowledgment: This research is financially supported by Universiti Teknologi Malaysia GRANT (Tier 2 RUG), Vot Q.K130000.2640.12J11. REFERENCES
Bernama, (2012). Are we ready to battle a high-rise fire? Free Malaysia Today.
Mansor, N. B. (2012). Safety Management in High-Rise Building Case Study: Petronas Twin Towers &
Kuala Lumpur Tower. Department of Estate Management Faculty of Architecture, Planning and Surveying, Universiti Teknologi Mara.
55

National Fire Protection Association, (2012). "Life Safety Code", Quicy, NFPA 101. Prashant, (2007). The Essential Aspects of Fire Safety Management in High-Rise Buildings. Faculty of Civil
Engineering, Universiti Teknologi Malaysia. Master of Science (Construction Management).
Rangawala, K. (February 2010). Contextual tall buildings in India. CTBUH 2010 World Conference – India, Remaking Sustainable cities in the vertical age. Mumbai, India.
Zahari, A., Sudirman, Mydin (2014). "A Study on Problems Arises in Practicing Fire Drill in High Rise
Building in Kuala Lumpur " EDP Sciences.
56

A REVIEW ON CONCEPTUAL DESIGN OF OCEAN THERMAL
ENERGY CONVERSION (OTEC) PLATFORM
N.A. Mukhlas*, N. I. Mohd Zaki, M. K. Abu Husain and A. B. Jaafar
UTM Ocean Thermal Energy Centre, Universiti Teknologi Malaysia, 54100 Kuala Lumpur, MALAYSIA
*[email protected], [email protected], [email protected]
ABSTRACT
Recent technological discoveries have made ocean thermal energy conversion (OTEC) a possible source of sustainable energy in the near future. OTEC utilize temperature differences between ocean surface water and cooler deep water to produce energy continuously. For each megawatt of generating electricity, it can produce up to 2 million liters per day. Also, no products of combustion are generated during the process since OTEC has less environmental impact than other sources of energy. All these aspects caused a revival of interest in OTEC, thus in line with the Sustainable Energy Development Authority Act (2011) of Malaysia that focus on the development of renewable energy. The commercialize OTEC platforms are land based and floating types, located in Japan and Hawaii. The platform type is according to the availability of the selected site to utilize enough temperature different for energy generation. Since Malaysia has a different water depth profile, this research will review the relevant conceptual design of the OTEC platform to be utilized in Malaysia region. Key words: Ocean thermal energy, Offshore structure, Renewable energy
INTRODUCTION
Malaysia is dependent on fossil fuel for industrial and transport sector, generating 94.5% electric power. The electrical energy is commonly generated based on heat energy extracted from the combustion of fossil fuel. Instead of using the non-renewable energy sources, OTEC take advantage of the temperature gradient that occurred naturally in the ocean to produce electricity, with an ideal temperature’s different of 20°C (Kempener and Neumann, 2014). One of the of OTEC’s greatest advantages is that it allows the co-production of drinkable water, in addition to electric power through desalination. For each megawatt of generating electricity, it can produce up to 2 million liters per day (Cohen, 1982). Also, no products of combustion are generated during the process since OTEC has less environmental impact than other sources of energy. All these aspects caused a revival of interest in OTEC, thus in line with the Sustainable Energy Development Authority Act (2011) of Malaysia that focus on the development of renewable energy (Chen, 2012; Chong and Lam, 2013).
UTM Razak School of Engineering and Advanced Technology Kuala Lumpur, Malaysia
10 October 2017
57

DEVELOPMENT OF OTEC POWER PLANT
In OTEC plant, the warm seawater from the ocean surface being pumped through heat exchangers to vaporize a secondary working fluid (such as ammonia, propane or chlorofluorocarbon (CFC)) creating a high-pressure vapor to drive a turbine. The vapor is subsequently cooled by seawater to return it to a liquid phase. The process was repeated in a one complete cycle. Hence, an appropriate location must be considered in the planning of OTEC facility where the facility must be located in a region with access to warm surface waters and cold water, where generally located at deep sea area (with the minimal difference about 20°C).
OTEC plant can be located on land if adjacent to a shelf or rapid decrease in depth, but it needed the long length of the cold water intake pipe to reach the required temperature (NOAA, 2009). To date, five land-based OTEC plants are in operation with energy generated between 15kW to 105kW, initiated by Xenesys and Saga University in 1980 (Ikegami, 2015). Alternatively, an offshore, floating, moored, facility with a vertical cold water intake pipe may be more practical. Technological advancements in the offshore oil industry have made floating OTEC platforms a possibility. Floating platforms can be located virtually anywhere above deep water as long as they can be adequately moored, and the power cable can reach a land-based power grid for electricity generation (NOAA, 2009). To this end, 2 major floating OTEC facilities are under construction at La Martinique (France) and Tarawa Island (Kirabati) with potential energy output up to 11MW. To be summarized, the current developments of the OTEC power plant are briefly listed in Table 1.
Table 1. Current development of Ocean Thermal Energy-driven Development
status OTEC structure Description Output
energy Platform type
Operational
La Réunion, France Operational since 2012- with the purpose of research and development
15 kW Land based prototype
Gosung, Korea Operational since 2012- with the purpose of research and development
20 kW Land based prototype
Saga, Japan Operational since 1980 with the purpose of research and development
30 kW Land-based
Kumejima Island Okinawa, Japan
Operational since 2013 with the purpose of research and development for electricity production
100 kW Land-based
Biq Island, Hawaii The first true closed-cycle OTEC plant to be connected to US electrical grid
105 kW Floating Plant
Under Construction
La Martinique, France
Pilot plant awarded under NER300 program by the European commission for NEMO project
10.7 MMW
Floating Plant
Tarawa Island, Kiribati in the South Pacific Ocean
The first practical level of plant on a pathway to building a 100 MW commercial system
1 MW Floating Plant
Planned & Proposed
Int. Airport Curaçao Expected to provide reduction of approx. 2500 of tons of CO2/ year
500 kW Pilot Plant
Zambales, Philipines
The first OTEC plant in Philipines and is expected to start operate commercially by 2018
10 MW Floating Pilot Plant
Kumejima Island Okinawa, Japan
For a 1 MW plant, the plant would make 1.3 – 1.5 MW power and 1 MW nett
1 MW Land-based
58

power Maldives The first commercial OTEC system to be
install in an-eco resort, 2 MW Floating Plant
NAJIB In the perspective of Malaysia region, OTEC has a great potential to be discovered as a possible source of sustainable energy in the near future (Jaafar, 2016). But, the suitable type of OTEC plant that relevant to Malaysia seawater profile need to be identified. Since fixed platforms are already well established and have been validated in other industries (e.g., offshore oil, wind farms), its capability to be used in an OTEC application is uncertain.
METHODOLOGY
Figure 1. Research flow chart This research focused on the conceptual design of OTEC power plant to be utilized in Malaysia, according to the review of commercialized OTEC power plant in the worldwide as discussed in the previous section. Figure 1 illustrated the research flow chart that consists of two stages; feasibility study and structure reliability analysis. In stage 1 during the feasibility study, a critical review of commercialized design of OTEC platform has been done. It involved the type of platform used and the seawater profile of the site selected. This leads to the commercialization of land-based and floating OTEC power plants. With the availability to access on sufficient temperature gradient as OTEC requirement, fixed offshore platform was being selected to be used in Malaysia with the depth of 100 m from seawater level and deep water pipeline extension for cold sea water intake. At the end of stage 1, the conceptual design of fixed OTEC power plant was determined with an aimed to utilize both electric power and water production. In order to ensure that the platform can operate well, according to its service life with a maximum production, stage 2 is required for the purposed of structural reliability analysis (Al-Farisi and Zikra, 2015). Begin with the data collections of both structural data and environmental data, the
Literature Review on the OTEC plant
Basic Structure Modeling
Finish
Mod
elU
pdat
e
Acceptable
Data Collection
Selection OTEC plant
Structure Analysis (In-place, Seismic& Fatigue)
Yes
No
Stage 1: Feasibility Study
Stage 2: Structure Reliability Analysis
59

basic structural modeling will be carried out according to the industrial application based on a software package such as SACS, SESAM and USFOS. Then the structural analysis will be done followed standard code requirement such as API-RP2A and ISO 19902. However, this paper was only focused on the conceptual design of the fixed OTEC platform regarding on the structure and operational concept. While for the stage 2, it will be discussed in details in the next future work.
MAIN FINDINGS
Fixed offshore OTEC plants can be mounted to the continental shelf at depths up to 100 meters. This type of construction is already commercially used for offshore oil rigs. The complexities of operating a fixed OTEC plant in deeper water may make them more expensive than land-based approaches but economical than floating plant. However, the land-based OTEC plant is not suitable for Malaysia region since the water depth for sufficient temperature’s different far from the shoreline. The key challenges of a fixed plant include the stress of open-ocean conditions, heavy load due to OTEC equipment and difficulties of product delivery.
Figure 2. Fixed OTEC power plant concept
Figure 2 illustrated the conceptual design of the fixed OTEC platform, according to the one leg tarpon platform that is capable to withstand up to 310 ton load. The two decks of topside structure provided the facility for OTEC plant equipment, consist of working fluid evaporator and condenser, water production evaporator and condenser, turbine and generator. The equipment capabilities to generate 1MW of electric power that can be supplied to the nearest oil and gas platform. Since, it has been a one leg platform, bigger diameter of the caisson is needed to withstand load due to OTEC equipment itself. Meanwhile, the buoy act as a transit to store the excess cold water intake for the use of water production and crop plantation due to its abundance of nutrients and minerals. The buoy tank help to reduce the load, cater by the platform so that the OTEC platform was successfully operated as the power electric generation and water production system continuously.
60

CONCLUSION
Malaysia has a great potential to utilize the OTEC operation. Based on the review of existing OTEC power plant, the seawater profile of Malaysia makes it possible to install a fixed offshore platform as the OTEC power plant. In order to utilize both electric and water production, the fixed OTEC power plant need to be able to withstand weight load due to OTEC equipment and sea water contain. The process of product delivery also needs to be accounted. As the outcome, the fixed OTEC power plant concept has been proposed in this paper with the application of tarpon structure and additional of buoy tank. However, the details on the structural reliability analysis of the fixed OTEC power plant need to be discussed in the next future work to complete the design work.
Acknowledgment: This work was supported by the UniversitiTeknologi Malaysia (grant no: Q.K130000.2540.09H39 and Q.K130000.2540.09H42) and the Ministry of Higher Education (Malaysia) (grant no: R.K130000.7940.4F584 and R.K130000.7840.4F583).
REFERENCES
Al-Farisi, M. and Zikra, M. (2015). In-Place, Seismic and Fatigue Analysis of Offshore Platform for Life Extension. Journal of Ocean, Mechanical and Aerospace. vol 18: 14-19.
Cohen, R. (1982). Energy from the Ocean. Phil. Transactions, Royal Society. London. A 307: 405-437. Chen, W. (2012). Renewable Energy Status in Malaysia. An Annual Report: Sustainable Energy
Development Chong, H. and Lam, W. (2013). Ocean Renewable Energy in Malaysia: The potential of the Straits of
Malacca. Renewable and Sustainable Energy Reviews 23 (2013) 169-178. Ikegami, Y. (2015). Japan Activity and Strategy of OTEC: Towards Global Innovation of OTEC with
International Collaboration. Proceeding of 3rd OTEC Symposium. 1st September, UTMKL, Malaysia. Kempener, R. and Neumann, F. (2014). Ocean Themal Energy: Technology Brief. IRENA Innovation and
Technology Centre, Gerrmany. Jaafar, A. B. (2016). Harnessing Ocean Thermal Energy from Temperature Differentials of the Water Depth
off the Sabah Trough, Malaysia. Maritime Institue of Malaysia Bulletin, vol 19(1).
61

SIMULATION ON CLOSED KALINA CYCLE OF AU/TIO2 AND
AG/TIO2 OF AMMONIA-WATER HYBRID NANOFLUIDS
S.Z.A.S Ahmad*1,2, M.K. Abu Husain1, N. I. Mohd Zaki1 and A. B. Jaafar1
1 UTM Ocean Thermal Energy Centre, Universiti Teknologi Malaysia, 54100 Kuala Lumpur,
MALAYSIA *[email protected]
2 Universiti Malaysia Terengganu, 21030 Kuala Terengganu, MALAYSIA
ABSTRACT
Simulation analysis of the turbulent flow of heat transfer in a heat exchanger tube will develop to analyse the thermal performance. Meanwhile, the existing working fluid ammonia-water was prepared by mixing Au/TiO2 and Ag/TiO2 hybrid nanocomposites. In this study to investigate the heat transfer coefficient and Nusselt number for forced convection heat transfer between two working fluid of Au/TiO2 and Ag/TiO2 ammonia-water hybrid nanofluid. The range of Reynolds number selected were 20 000 and 40 000 in a horizontal straight tube of diameter 0.01m with a constant heat flux of 1000 W/m2. The volume fraction of nanoparticle considered were 0.1%, 0.3%, 0.5%, 0.7% and 0.9%. This problem also considered the nanoparticle size 10nm and temperature operated at 100°C. Finally, the results were compared with the theoretical values obtained from Ayub Equation by using the tool of the package from ANSYS-FLUENT which show similar results. Key words: Volume fraction, Heat transfer coefficient, Skin friction, Nusselt number
INTRODUCTION
Heat is the amount of energy that transferred from higher temperature to lower temperature. Besides that, heat transfer is widely used in many industrial and consumer product such as heat exchangers, automobile industries, power systems, solar water heater, solar air heater, heating and air conditioning, chemical engineering, electronic chip cooling and aerospace. This subject has received considerable attention to get high efficiency, small size, and light weight. The inherently poor thermal performance of conventional fluids puts a limitation on heat transfer and restricted in developing energy efficient heat transfer fluids that are required for ultra-high performance cooling. Well-designed cooling systems are prerequisites for optimum running operation, keeping operating temperatures and friction of all moving parts within predetermined acceptable limits. High performance and high output operation is the trend of recent design due to its thermal conductivity (Azwadi and Adamu, 2016). Therefore, scientists and engineers have made a great effort to break this fundamental limit by conducted to increase the thermal carrying capacity of conventional heat transfer fluid to overcome the stated restriction on liquids. This concept of new kind of
UTM Razak School of Engineering and Advanced Technology Kuala Lumpur, Malaysia
10 October 2017
62

fluid called nanofluids that were introduced by (Choi, 1995) in 1995. In order to commercialize this new kind of fluid, many researchers have attempted study on heat transfer performance and flow characteristic of this fluid. Introducing nanofluids in various applications will have increase heat transfer besides limited measurement size product hence reducing fuel consumption and higher efficiency to get better performance. From the previous publish report of nanofluid; they have claimed that nanofluids thermal properties are higher than base fluid such as water or mineral oil (Turgut et al., 2009). Eventually, nanofluids technologies have offered a great potential for further development of high performance, compact and cost effective cooling to utilizing in industrial applications (Wu and Zhao, 2013) and (Wen et al., 2009). Ferrofluids are colloidal liquids made of nanoscale ferromagnetic, or ferrimagnetic, particles suspended in a carrier fluid (usually an organic solvent or water). Ferrofluids usually do not retain magnetization in the absence of an externally applied field (Albrecht et al., 1997). MAIN RESULTS
This study investigates the behavior working fluid would be affected to heat transfer performance. Simultaneously, the impact of different types of volume fraction on heat enhancement and fluid flow characteristics will be analyzed. In this paper, a comparison will be conducted by using two working fluids, Au/TiO2 and Ag/TiO2 + ammonia-water nanofluid in a horizontal circular pipe of 0.01m diameter with constant heat flux, 1000W/m2 is investigated. Reynolds number of 20 000 and 40 000 were implemented with six volume fractions nanoparticles which are 0.1%, 0.3%, 0.5%, 0.7% and 0.9%. CFD simulation analysis of enhancement of turbulent flow heat transfer in a horizontal circular pipe by convenient software as Ansys-Fluent was used to predict the heat transfer coefficient and Nusselt number for forced convection heat transfer.
A cylindrical tube in a horizontal position with dimensions of 0.01m diameter and a 0.8m length is considered in the current study. A constant heat flux is applied to the tube wall. The three-dimensional (3D) axisymmetric geometry has been assumed. As the result, a rectangular domain with dimensions of 0.005m x 0.8m is created.
The Nusselt number and heat flux coefficient were calculated by the given equations below. Nusselt numbers based on the present study were calculated as follow:
___ h D
Nuk
(1)
Average heat transfer coefficient (hx) is defined as:
_
_
x _
w b(T (
q"
) T ))
h
x ( x
(2)
Based on the result obtained from the fluent report, the average of both temperature of wall and bulk can be found from Ansys-Fluent simulation. Which solved iteratively using finite volume method (FVM) and a SIMPLE scheme was adopted for the treatment of pressure. The Reynolds number studied in this work
63

is high as the turbulent viscous such as k-𝜀 model has been employed. In this work, converged solutions were considered for residuals lower than 10−6 for all the
governing equations. The results of simulation for nanofluid were compared with the theoretical data available for the conventional water. The theoretical data of water were simulated in FLUENT software too. Data were compared with Ayub correlation (Ayub, 2013).
21 89 6 56 3 69mf n / Re . . R . R
(3)
The modelled cases were solved using ANSYS FLUENT. It’s first involves creating a system of algebraic equations through the process of discretising the governing equations for mass, momentum, and scalar transport. The finite volume method was a particular finite differencing numerical technique and is the most common method of flow calculations in CFD codes. In this project, SIMPLE algorithm was used in the calculation process. A standard pressure interpolation scheme and SIMPLE pressure velocity coupling were implemented. A residual root-mean-square (RMS) target value of 10−6 (10−6 for energy equation) was defined for the CFD simulations. All the problems case, the results show that heat transfer coefficient and Nusselt number in graphically. CONCLUSION
The modified original working fluid properties of ammonia-water with combination two types of nanocomposites (Au and Ag with TiO2) have increased their thermophysical properties totally. As a result of the review of the nanoparticles impact, it is also found that the presence of nanoparticles is a key factor which is capable of changing the flow and heat transfer capability of the base fluids. From this study, there are some areas that arise for further analysis and development likely radiation influencing, interaction magnetic field (Magnetohydrodynamics) or supported by others reliable sources (the wind, wave and solar) that would be increased heat transfer performance.
Acknowledgment: This work was supported by the Universiti Teknologi Malaysia [grant no: Q.K130000.2540.09H39 / Q.K130000.2540.09H42] and the Ministry of Higher Education (Malaysia) [grant no: R.K130000.7940.4F584 / R.K130000.7840.4F583]. REFERENCES
Albrecht, T., Bührer, C., Fähnle, M., Maier, K., Platzek, D. and Reske, J. (1997). First observation of ferromagnetism and ferromagnetic domains in a liquid metal. Applied Physics A: Materials Science & Processing 65 (2), 215.
Ayub, Z. H. (2003). Plate heat exchanger literature survey and new heat transfer and pressure drop correlations for refrigerant evaporators. Heat Transfer Engineering, 24 (5), 3-16.
Azwadi, C. S. N. and Adamu, I. M. (2016). Turbulent force convective heat transfer of hybrid nanofluid in a circular channel with constant heat flux. Journal of Advanced Research in Fluid Mechanics and Thermal Science, 19, 1-9.
Choi, S. U. S. (1995). Enhancing thermal conductivity of fluids with nanoparticles, in: D.A. Siginer, H.P. Wang (Eds.), Developments and Applications of Non-Newtonian Flows , ASME, New York, FED-Vol. 231/MD-Vol. 66, 99-105.
Turgut, A., Tavman, I., Chirtoc, M., Schuchmann, H., Sauter, C. and Tavman, S. (2009). Thermal conductivity and viscosity measurements of water-based TiO2 nanofluids. International Journal of Thermophysics, 30(4), 1213-1226.
64

Wen, D., Lin, G., Vafaei, S. and Zhang, K. (2009). Review of nanofluids for heat transfer applications. Particuology. 7(2), 141-150.
Wu, J. M. and Zhao, J. (2013). A review of nanofluid heat transfer and critical heat flux enhancement—Research gap to engineering application. Progress in Nuclear Energy. 66, 13-24.
65

RESIDUAL SOIL SLOPE STRAIN SENSING USING
DISTRIBUTED OPTICAL FIBRE
Dayangku Salma binti Awang Ismail *1, Azman bin Kassim1 and Hisham
Mohamad2, Ahmad Safuan A. Rashid1, Aliff Ridzuan Bunawan1
1 Faculty of Civil Engineering, Universiti Teknologi Malaysia, 81310 Skudai, Johor, Malaysia * [email protected], [email protected], [email protected],
[email protected] 2 Civil & Environmental Engineering Dept., Universiti Teknologi PETRONAS, 32610 Seri
Iskandar, Perak Darul Ridzuan, Malaysia [email protected]
ABSTRACT
A fully distributed sensing technology named Brillouin Optical Time Domain Analysis (BOTDA) has been introduced into the optical technologies since 1980s, with one of potential applications of this tool is to be used in monitoring the performance of slope stability. In this paper, BOTDA is used to investigate the mechanism of progressive development of soil slope plane failure in a laboratory-based experimental programme. A continuous ribbon optical fibre was embedded with three parallel-arranged fibre segments at different elevations in a 1-g soil slope model of 27 degree inclination. For the pilot test, 1 hour and 2 hour duration of simulated rainfall event was applied on the slope model and eventually the slope model was loaded until failure. The changes in pore water pressure and strain in the soil mass was monitored and measured by using miniature tensiometer and the optical fibre, respectively. It is observed that the rain water infiltration has initiated movement of soil within the slope. The optical fibre was able to detect a mobilisation of soil strain to signify the shear plane progressive development within the slope. It can be summarized that the soil-embedded optical fibre has been able to detect mobilisation of strain in the soil mass which mainly related to progressive development of shear stress in slope.
Key words: Distributed optical fibre, BOTDA, strain development, rainfall infiltration, pore water pressure
INTRODUCTION
Brillouin Distributed Optical Strain Sensing technology which are the Brillouin Optical Time Domain Analysis (BOTDA) and Brillouin Optical Time Domain Reflectometry has been proposed in 1980s by Horiguchi and Tateda (1989). This modernized technology shows positive aspect rather than the traditional sensors due to its long distance measurement, high resolution and low cost of the optical fibers. Zeni et al., (2015) reported a laboratory instrumentation using BOTDA technology for a small-scale model slope in loose unsaturated granular soils where failure triggered by rainfall.
UTM Razak School of Engineering and Advanced Technology Kuala Lumpur, Malaysia
10 October 2017
66

They used a 0.9mm tight buffered single mode telecommunication fibre for the testing. The optical fibre sensor was buried and plastic grid glued for every 20 cm apart to introduce anchoring system in order to determine possible maximum tensile strain in the optical fibre. It was found that the strain readings along the fibre increased with time along with the rainfall infiltration. Then, a feasibility study on strain-based slope stability evaluation has been initiated by Zhu et al., (2016) using BOTDA-based optical fibre sensor been embedded in a two-dimensional (2D) physical slope model. The measurements of horizontal strain averaging from three parallel-arranged fibre segments at different elevations in the model were subjected to axial surcharge load as in previous research done by Zhu et al., (2014). Then, a numerical modelling was done to verify the 1-g physical model results. Their numerical result showed the slip surface occurred in front of where maximum strains had appeared. The occurrence of maximum strain in these parallel segments was an indication of the progression development of shear plane. Also, Yan et al., (2016) conducted a research on the effect of rainfall infiltration to deformation of soil slope using BOTDA. The slope has been instrumented with two moisture probes, four horizontal parallel-arranged and three upright-planted of 2-mm polyurethane tight-buffered optical fibre. The laboratory results showed that the rainfall infiltration do contribute to slope failure mechanism as the strain has been observed to accumulate corresponded to water infiltration area in the slope body mass. MAIN RESULTS
The recent study involves a laboratory instrumentation programme to monitor the deformation behaviour due to rainfall infiltration and surcharge load using distributed optical fibre. The study is limited to the local condition of residual soil slope. The material is selected from weathering grade of Grade VI known as residual soil. The samples are attained from university area and rainfall intensities variation is based on the Intensity-Duration-Frequency curve (IDF Curve) of the Johor station. The soil slope model size is designed based on the Jabatan Kerja Raya ‘Guidelines for Slope
Design’ (JKR, 2010) specification on cut slope and fill slope. This study is aimed on obtaining the mechanism of the progressive development of slope plane failure under coupling effect of rainfall infiltration and loading using optical fibre. From the preliminary tests, a 1 hour and 2 hours artificial rainfall simulation with a rainfall intensity of 51046.2 and 51051.1 m/s were allowed to infiltrate into the model. The mobilization of strain inside the soil slope was occurred due to the occurrences of soil movement based on differences of soil self-weight from dry to wet condition. Then, the model was loaded with a uniform surcharge load by imposing axial load on 0.15m by 0.3m load plate size. Figure 1 shows a 2D view of maximum strain distribution at three-parallel arranged optical fibre segment; A, B and C at different elevations (L1, L2 and L3) and the features obtained when the soil model was failed (Figure 2). The progression of peak strains from the crest to the slope toe have illustrated how the soil shear stress mobilized and resisted the driving stress from the surcharge load and finally created a shear band within the soil slope.
67

Figure 1. Maximum strain at three-parallel arranged fibre segment; A, B and C subjected to 2 hours rainfall
Figure 2. Slope failure features
CONCLUSION
From the preliminary testing programme, it can be concluded that the soil-embedded optical fibre has been able to measure strain in soil mass due to rainfall infiltration and under staged loading. The infiltration had caused an increase of soil weight and subsequently made the soil particle deformed from its original state. The deformation of soil particles in the slope mass were detected by the optical fibre as a strain readings which have been converted from laser frequencies differences. Also, the position of maximum strain in the cable has illustrated the progression development of shear plane within the soil mass.
Acknowledgment: This research is fully supported by Tier 1 Research University Grant (RUG) Vote 11H04. The authors fully acknowledged Universiti Teknologi Malaysia for the approved fund which makes this important research viable and effective.
L1
L2
L3
L2
L3
L1
68

REFERENCES
Horiguchi, T., and Tateda, M. (1989). BOTDA-nondestructive measurement of single-mode optical fiber attenuation characteristics using Brillouin interaction: Theory. Journal of lightwave technology, 7(8), 1170-1176.
Jabatan Kerja Raya (JKR) Guidelines for Slope Design (2010), Slope Engineering Branch, Public Works Department Malaysia.
Yan, J. F., Shi, B., Ansari, F., Zhu, H. H., Song, Z. P., and Nazarian, E. (2016). Analysis of the strain process of soil slope model during infiltration using BOTDA. Bulletin of Engineering Geology and the Environment, 1-13.
Zeni, L., Picarelli, L., Avolio, B., Coscetta, A., Papa, R., Zeni, G., and Minardo, A. (2015). Brillouin optical time-domain analysis for geotechnical monitoring. Journal of Rock Mechanics and Geotechnical Engineering, 7(4), 458-462.
Zhu, H. H., Shi, B., Zhang, J., Yan, J. F., and Zhang, C. C. (2014). Distributed fiber optic monitoring and stability analysis of a model slope under surcharge loading. Journal of Mountain Science, 11(4), 979-989.
Zhu, H. H., Wang, Z. Y., Shi, B., and Wong, J. K. W. (2016). Feasibility study of strain based stability evaluation of locally loaded slopes: insights from physical and numerical modeling. Engineering Geology, 208, 39-50.
69

RELIABILITY SYSTEM FOR FIXED OFFSHORE STRUCTURES
IN MALAYSIAN WATER
E. Mat Soom1,2, M. K. Abu Husain2, N. I. Mohd Zaki2, M. N. K. Mohd Nor3 and
N. U. Azman2,4
1 Sarawak Shell Berhad, 98100 Miri, Sarawak, MALAYSIA, [email protected]
2 Universiti Teknologi Malaysia, 54100 Kuala Lumpur, MALAYSIA [email protected], [email protected]
3 Petroliam Nasional Berhad, PETRONAS Twin Towers, 50088 Kuala Lumpur, MALAYSIA [email protected]
4 Technip Miri Office, 98000 Miri, Sarawak, MALAYSIA [email protected]
ABSTRACT
Offshore jacket platforms are commonly used for oil and gas production in the shallow water depths of Malaysia. Over 250 installations have been operating for more than 20 years. In view of the continuous production required beyond the design life, life extension of these facilities is inevitable. To manage safety and integrity of these structures, the following two methods have been accepted by most major marine operators in the offshore industry: a) Reliability-Based Design and Assessment (RBDA) method and b) Global Ultimate Strength Assessment (GUSA) method. Both approaches are based on the design code for fixed offshore structures by utilising limit state equation of probabilistic model based on load model (wave load) and structure’s strength (load resistance). The outcomes of comparison, i.e., reserve strength ratio (RSR) and the probability of failure (POF) from the two methods contribute to risk management and safety level. Key words: Probabilistic model, reserve strength ratio, probability of failure
INTRODUCTION
Further development of the oil and gas industry while resources are becoming scarcer is challenging. Thus, the increase in development cost has demanded companies to enhance the recovery of oil and gas from developed fields and discover and develop new reserves from existing oil and gas platforms (PETRONAS Research & Scientific Services Sdn. Bhd., 1999). Utilizing existing platforms to recover and enhance oil and gas resources has its challenges, mostly due to space limitation and structural integrity. Structural integrity is one of the major issues for ageing platforms, particularly in the presence of significant modifications or fatigue damage to jacket members (Abu Husain et al. 2017). The results from GUSA and RBDA analysis are required to give a high confidence level of structural strength for extended design life and additional years of production. In this paper, the probability of failure on the ageing existing jacket platform is investigated to evaluate the possibility for life extension using GUSA and RBDA procedures.
UTM Razak School of Engineering and Advanced Technology Kuala Lumpur, Malaysia
10 October 2017
70

STRUCTURAL RELIABILITY ANALYSIS (SRA)
Optimum mitigation measures shall be established through adequately detailed structural integrity reassessment analysis together with an in-depth understanding of structural failure mechanisms (Ayob et al. 2014). In practice, SHELL was a pioneer in the industry when it started to introduce the Reliability-Based Design Assessment (RBDA) since early 1995 for all worldwide facilities. Later, PETRONAS developed the Global Ultimate Strength Assessment (GUSA), in use since 2012 in the region of Malaysian waters. Global Ultimate Strength Assessment, typically known as GUSA, is a comprehensive methodology established to support reassessment activities. Three (3) integrated analyses, i.e. nonlinear plastic collapse (NPC), member importance analysis (MIA) and structural reliability assessment (SRA). The result of these analyses can efficiently assist the understanding of the structure’s failure mechanisms and correctly define the appropriate
type of mitigation required (Ayob et al., 2014). While, the Reliability-Based Design and Assessment (RBDA) is an analytical technique for structural reliability assessment, criteria for design and reassessment are derived regarding the required platform collapse strength and corresponding failure probabilities. This method consists of Type I and II uncertainties used to determine the probability of failure for the structure over its remaining service life. Criteria are derived by reducing risk to a level that is as low as reasonably practicable (the ALARP principle) (Efthymiou and Van de Graaf, 1997). MAIN RESULTS
The flowchart presented in Figure 1, the process begins with a literature review on structural reliability analysis (SRA). Data of met-ocean and model of in-place analysis from linear analysis gathered and reviewed. Followed by non-linear pushover analysis to determine reserve strength ratio (RSR) as per prescribed return period (RP) and calculate the probability of failure (POF) under GUSA or and RBDA, for both results as output outcomes. Finally, the decision made under risk management and safety level is identified and categorised by operator or owner.
Figure 1. Structural Reliability Analysis (SRA) Process
Global Ultimate Strength Assessment (GUSA)
Risk Based Design Analysis (RBDA)
Output Output
Risk Management & Safety Level
Literature Review of Structural Reliability Analysis (SRA)
Data & Model Gathering
Non-Linear Pushover Analysis
71

One of example ageing platform (6 legged with water depth is 27m) in Malaysia water, where due to the demand to prolong the production for further 25 years and it has been evaluated in design level with major modifications and fatigue issues. The result in Table 1 shows the different probability of failure (POF). However, both result still meeting their safety acceptance criteria for target reliability, i.e. the platform is extremely reliable and apparently acceptable for operation. Thus, No cost requires for ad-hoc monitoring and inspection integrity. No loss in production due to No shutdown and decommissioning to be planned.
Table 1. Result from both reliability assessment Type of Reliability Return
Period (RP)
RSR Base Shear (MN)
Probability of Failure (POF)
Risk-Based Design Analysis
100 7.76 1.79 1.95E-18 1000 5.86 2.31
10000 4.23 2.83 Global Ultimate Strength Assessment
100 7.76 1.79 1.37E-16
The accuracy and effectiveness of this approach will assist the industry, especially operators, for decision-making and, more specifically, for their outlining of action items as part of their business risk management. The results of these analyses can efficiently assist the understanding of the structure failure mechanism and correctly define the important types of mitigation required.
The key challenges of fixed offshore structures when it experiences with subsidence and at same time ageing condition due to exceeding the design life. It should be noted that this paper will only present the basic idea of the structural reliability analysis. The detail of assessment will be discussed in details in the next future work. CONCLUSION
GUSA and RBDA methods have been accepted by most of the major marine operators in the offshore industry to manage safety, integrity and reliability of their structures. This study confirmed that both methods give the check and balance in increasing the high confidence level of the result as far as ensuring the safety of these assets to be continued in service.
Acknowledgment: The authors would like to acknowledge the support of the academic and industrial establishments they present. The leading author has undertaken this research as an ex-staff of Petronas Carigali Sdn Bhd and would like to express his gratitude to co-author from Petronas, Project Delivery and Technology (PD & T) for support on data and advice. The paper is financially supported by the Universiti Teknologi Malaysia (Malaysia) [grant number: Q.K130000.2540.11H30 / Q.K130000.2540.12H04] which is gratefully acknowledged.
72

REFERENCES
Abu Husain MK, Mohd Zaki NI, Mallahzadeh H and Najafian G. (2017). Prediction of Offshore Structural Response Extreme Values by Three Different Approaches of Efficient Time Simulation Technique. Ships and Offshore Structures. 12(2): 290-301.
Ayob MS, Kajuputra AE, Mukherjee KB and Wong S. (2014). Requalification of Offshore Jacket Structures in Malaysia Waters. Proceedings of the Offshore Technology Conference (OTC-25021-MS). Kuala Lumpur, Malaysia.
Efthymiou M and Van de Graaf JW. (1997). “Reliabilty Based Design and Reassessment of Fixed Steel Platforms”. SIEP 97-5050, Restricted Document.
Mat Soom, E., Abu Husain, M. K., Mohd Zaki, N. I., Mohd Nor, M. N. K. and Ayob, M. S. (2015). “Global
Ultimate Strength Assessment (GUSA) for Lifetime Extension of Ageing Offshore Structures”. Hawaii,
USA: Proceedings of the Twenty-Fifth International Ocean and Polar Engineering Conference on Civil, Offshore and Environmental Engineering (ISOPE).
Mat Soom, E., Abu Husain, M. K., Mohd Zaki, N. I., Azman, N. U. and Najafian, G. (2016). “Reliability-Based Design and Assessment for Lifetime Extension of Ageing Offshore Structures”. Busan, South
Korea: Proceedings of the ASME 35rd International Conference on Ocean, Offshore and Arctic Engineering (OMAE).
PETRONAS Research & Scientific Services Sdn. Bhd. (1999). Structural Integrity and Inspection Analyses of Old Jackets Reassessment Basis. Part 1. Revision 01. Petronas: Restricted Document.
73

PROCESS PERFORMANCE OF LANDFILL
LEACHATE TREATMENT USING UP-FLOW
ANAEROBIC SLUDGE BED
Sivathass Bannir Selvam1, Hesam Kamyab1,2*, Shreeshivadasan Chelliapan1, Mohd
Fadhil Md Din3, Shahabaldin Rezania3
1Engineering Department, UTM Razak School of Engineering & Advanced, Universiti
Teknologi Malaysia, Jalan Sultan Yahya Petra,54100,Kuala Lumpur, Malaysia [email protected],[email protected], [email protected]
2Department of Mechanical and Industrial Engineering, University of Illinois at Chicago, 845 West Taylor Street, Chicago, IL 60607, USA
[email protected] 3Centre for Environmental Sustainability and Water (IPASA), Department of
Environmental Engineering, Faculty of Civil Engineering, Universiti Teknologi Malaysia, 81310, Johor, Malaysia
[email protected], [email protected]
ABSTRACT
In most countries, sanitary landfilling is nowadays the most common way to eliminate municipal solid wastes (MSW). In spite of many advantages, generation of heavily polluted leachates, presenting significant variations in both volumetric flow and chemical composition, constitutes a major drawback. Year after year, the recognition of landfill leachate impact on environment has forced authorities to fix more and more stringent requirements for pollution control. In the present study, an up-flow anaerobic sludge bed (UASB) was used for the treatment of matured landfill leachate. The process performance of the treatment was characterized in terms of pollutant removal before and after the treatment process. The results showed that VA (volatile acid) concentration was low when operated at OLR in the range of 0.125 to 1.25 kg COD m-3d-1 (157.7 to 156.0 mg L-1 mg HOAc L-1). An increase in OLR beyond 1.25 kg COD m-3d-1 resulted in higher VA concentrations in the effluent. When the OLR was reduced to 0.375 kg COD m-3d-1 the VA concentration started to reduce and recovered to 157.3 mg HOAc L-1. For the COD removal efficiency, at OLR 0.125 kg COD m-3d-1 (HRT of 4 d) the average COD removal efficiency was 65.70%. Further increase of the OLR from 0.375 to 1.250 kg COD m-3d-1 resulted in a low COD removal efficiency, until 9.33% was observed at an OLR of 2.50 kg COD m-3d-1.
Key words: Landfill leachate treatment, Up-flow anaerobic sludge bed reactor, Pollutant removal
UTM Razak School of Engineering and Advanced Technology Kuala Lumpur, Malaysia
10 October 2017
74

INTRODUCTION
The disposal of municipal solid waste by sanitary landfilling is the most common method due to such advantages as simplicity, low price, and landscape-restoration of holes from mineral workings. However, its major weakness is the production of leachate in landfills (Aziz et al., 2010; Halim et al., 2009; Wiszniowski et al., 2007) . Leachate is defined as the liquid formed by the percolation of precipitation through an open landfill or through the cap of a finished site. Leachates could contain huge amounts of pollutants such as organic substances (measured as chemical oxygen demand (COD) and biochemical oxygen demand (BOD5)), ammonia, high concentrations of heavy metals, and inorganic salts (Renou et al., 2008; Foul et al., 2009; Aziz et al., 2009) . Leachate is also rich in phenols, total dissolved salts (TDS), total alkalinity, total acidity, total hardness, chloride, sulfide and phosphorus (Aziz et al., 2010. Obviously, as landfill age increases, the biodegradable fraction of organic pollutants in leachate decreases due to anaerobic decomposition occurring in a landfill site. Thus, mature leachate contains much more refractory organics than young leachate. In this respect, young landfill leachate (age < 5 years) is typically characterized by high BOD5 (4000–13,000 mg/L) and COD (30,000–60,000 mg/L) concentrations, fairly high amount of ammonia (< 400 mg/L), high ratio of BOD5/COD (0.4–0.7), and a pH value of < 6.5. In contrast, stabilized landfill leachate (age > 10 years) normally contains high quantity of ammonia (> 400 mg/L), moderately high strength of COD (< 4000 mg/L), and a low BOD5/COD ratio of less than 0.1 (Guo et al., 2010, Foo et al., 2009) MAIN RESULTS
The UASB used in this experimental study was 18 cm in internal diameter (i.d.) and 110 cm in height, with an active volume of 20 L. The reactor had a 3-phase separator baffle (pore diameter of 2 mm) placed 2 cm below the effluent ports to prevent floating granules from being washed out with the effluent. Sampling ports were placed at 8 cm intervals (lowest being 21 cm from the base) that allowed biological solid and liquid samples to be withdrawn from the sludge bed. The influent wastewater entered through a 2.7 cm i.d. down comer tube in the head plate that extended to within 105 cm of the reactor base and allowed feed to flow upward through the sludge bed. A temperature controller and heater were installed to maintain a reactor temperature of 37C. The UASB reactor can work in a wide range of temperatures, supporting a range of microorganisms from mesophilic to thermophilic species. For this study, a temperature of 37°C was chosen to support mesophilic microorganisms in the treatment of the matured leachate due to its treatment efficiency and lesser energy requirement.
Table 1. Characteristics of leachate Parameter Results Units
pH 8.0 - Temperature 26.0 °C COD 2500 mg L-1 BOD5 @ 20°C 486 mg L-1 Total Suspended Solids 220 mg L-1 Oil & Grease 0.6 mg L-1
75

VFA 500 mg L-1
Arsenic (As) 9.40 mg L-1 Cadmium (Cd) 0.43 mg L-1 Formaldehyde (FA) 8.60 mg L-1 Iron (Fe) 12.80 mg L-1 Nickel (Ni) 0.50 mg L-1
CONCLUSION
This study demonstrates that the UASB reactor can be used to treat matured landfill leachate; however, the treatment efficiency of the reactor was negatively affected at an OLR of 2.5 kg COD m-3d-1, probably due to the inhibition by heavy metal and formaldehyde in the leachate at high OLR. It is recommended that the microbial activity of the reactor sludge to be evaluated in future study to determine the correlation of heavy metal and FA removal by different microorganisms.
Acknowledgment: The authors desired to show the highest gratitude to to Universiti Teknologi Malaysia for funding this study. The authors also thank the Ministry of Education Malaysia for the Research University Grant (Vote number: Q.K130000.2510.13H42). REFERENCES
Aziz, S. Q., Aziz, H. A., Yusoff, M. S., Bashir, M. J., and Umar, M. (2010). Leachate characterization in semi-aerobic and anaerobic sanitary landfills: A comparative study. Journal of Environmental
Management, 91(12), 2608-2614. Halim, A. A., Aziz, H. A., Megat Johari, M. A., Ariffin, K. S., and Hung, Y. T. (2009). Removal of
ammoniacal nitrogen and COD from semi-aerobic landfill leachate using low-cost activated carbon? zeolite composite adsorbent. International Journal of Environment and Waste Management, 4(3-4), 399-411.
Wiszniowski, J., Surmacz-Górska, J., Robert, D., and Weber, J. V. (2007). The effect of landfill leachate composition on organics and nitrogen removal in an activated sludge system with bentonite additive. Journal of environmental management, 85(1), 59-68.
Renou, S., Givaudan, J. G., Poulain, S., Dirassouyan, F., and Moulin, P. (2008). Landfill leachate treatment: review and opportunity. Journal of hazardous materials, 150(3), 468-493.
Foul, A. A., Aziz, H. A., Isa, M. H., and Hung, Y. T. (2009). Primary treatment of anaerobic landfill leachate using activated carbon and limestone: batch and column studies. International Journal of Environment
and Waste Management, 4(3-4), 282-298. Aziz, H. A., Daud, Z., Adlan, M. N., and Hung, Y. T. (2009). The use of polyaluminium chloride for
removing colour, COD and ammonia from semi-aerobic leachate. International Journal of
Environmental Engineering, 1(1), 20-35. Guo, J. S., Abbas, A. A., Chen, Y. P., Liu, Z. P., Fang, F., and Chen, P. (2010). Treatment of landfill
leachate using a combined stripping, Fenton, SBR, and coagulation process. Journal of Hazardous
Materials, 178(1), 699-705. Foo, K. Y., and Hameed, B. H. (2009). An overview of landfill leachate treatment via activated carbon
adsorption process. Journal of hazardous materials, 171(1), 54-60. de Barros, V. G., Duda, R. M., and de Oliveira, R. A. (2016). Biomethane production from vinasse in upflow
anaerobic sludge blanket reactors inoculated with granular sludge. brazilian journal of
microbiology, 47(3), 628-639.
76

77
Keywords Index
Affordable housing 9
Assembly area 53
BCA Green Mark 28
BOTDA 66
Building assessment tool 28
Building Information Modelling 35
Collaboration 35
Construction 1
Construction 17
Construction industry 20
Construction industry 35
Construction slope 45
Consultant firm 13
Contractor assessment 17
Cost effective 45
Dam 39
Dam breach 39
Dam failure 39
Digital technology 5
Distributed optical fibre 66
Eco-costing 1
Egress time 53
Evacuation 53
Fire safety 53
Game based learning 5
Geo-resisitivity 49
Green Building Index 28
Heat transfer coefficient 62
High-rise building 53
Housing supply 9
Human resource development 5
KM challenges 13
KM implementation 13
Knowledge management (KM) 13
Landfill leachate treatment 74
Landslide 49
Low fidelity 5
Malaysia 35
Management 1
Milestone payment 32
MRT 25
Nusselt number 62
Ocean thermal energy 57
Offshore structure 57
Optimum design 45
PMBOK 20
Pollutant removal 74
Pore water pressure 66
Prefabrication technology 9
Probabilistic model 70
Probability of failure 70
Project management 17
Project payment 32
Project performance 20
Project performance 32
Project stakeholder management 20
Rail project 25
Rainfall infiltration 66
Renewable energy 57
Reserve strength ratio 70
Skin friction 62
Slope failure 45

78
Soil nail 45
Stakeholder’s satisfaction 20
Strain development 66
Sustainability 17
Sustainable 1
Sustainable housing 9
Technology transfer 25
Technology transfer model 25
Up-flow anaerobic sludge bed reactor 74
Volume fraction 62
Waste 1
Wenner-Schlumberger 49

THANK YOU
UTMRS-ICAT/SustaIN 2017 Organizing Committee
UTM Razak School of Engineering & Advanced Technology, Universiti Teknologi Malaysia Kuala Lumpur, Jalan Sultan Yahya Petra, 54100 Kuala Lumpur
MALAYSIA Phone: +603-2180 5138; Fax : +603-2180 5380
E-mail: [email protected] Url: http://razakschool.utm.my/sustain
