expression of transferrin receptor on murine hematopoietic
TRANSCRIPT

CELLULAR IMMUNOLOGY 83, 14-25 (1984)
Expression of Transferrin Receptor on Murine Hematopoietic Progenitors’
JAYNE LESLEY, ROBERT HYMAN,~ ROBERTA SCHULTE, AND JOSEPH TROTTER
Department of Cancer Biology, The Salk Institute, Box 85800, San Diego, Cahyornia 92138
Received August II, 1983; accepted September 13, 1983
We have used a monoclonal antibody against the murine transferrin receptor to study the expression of the transferrin receptor on the hematopoietic progenitor cells (BFIJ-E, CFU-E, and CFU-C) present in mouse bone marrow. Elutriation and cell-sorting data are consistent with the hypothesis that most CFU-E are transferrin receptor positive while most BFU-E express much less transferrin receptor. CFU-C comprise both transferrin-receptor-positive and -nega- tive cells.
INTRODUCTION
Transfertin-receptor expression has been shown to correlate with the proliferation state of cells in vitro-proliferating cells expressing large quantities of the receptor (l-4). Within the erythroid series, transferrin receptor appears to be a “differentiation antigen” (5). It is expressed on immature red cells from pronormoblasts to reticulocytes, with a decreased density occurring during erythroid maturation, and is absent on mature red cells (6-8). The distribution of the transferrin receptor on hematopoietic progenitor cells is less well established. In man, Sieff and colleagues (9) have shown that most CFU-E3 and a variable proportion of BFU-E stained with the anti-human transferrin-receptor antibody OKT9. When transferrin binding was studied directly, a greater proportion of BFU-E scored as positive.
We have previously found that only a fraction of adult mouse bone marrow cells stain with a monoclonal antibody directed against the murine transfertin receptor (10). Here we use this antibody to study the distribution of transferrin-receptor- positive cells among late (CFU-E) and early (BFU-E) erythroid progenitors and myeloid progenitors (CFLJ-C). We show that most BFU-E are found in the transferrin-receptor-
’ Supported by National Cancer Institute Grant CA-25893 to R.H. z To whom correspondence should be addressed. 3 Abbreviations used: BFU-E, Day 8 burst-forming unit, erythroid; CFU-E, Day 2 colony-forming unit,
erythroid; VU-C, Day 7 colony-forming unit, myeloid; HepesCS, Hepes-buffered Dulbecco’s modified Eagle’s medium containing 2% newborn calf serum: elutriation buffer, Hepes-buffered Dulbecco’s modified Eagle’s medium containing 5% newborn calf serum; TAC, narrow-angle light scatter-time amplitude con- version.
14
0008-8749184 $3.00 Copyri&t 0 1984 by Academic Press. Inc. All rigIns of reproduction in any form reserved

TRANSFERRIN RECEPTOR ON HEMATOPOIETIC PROGENITORS 15
negative fraction of mouse bone marrow while most CFU-E are present in the trans- ferrin-receptor-positive population.
MATERIALS AND METHODS
Monoclonal anti-transferrin-receptor antibody. The RI7 2 17.1.3 monoclonal an- tibody, recognizing the murine transfetin receptor, was obtained from a fusion of the murine myeloma S 194/5.XXO.BU. 1 with spleen cells from a BDIX rat immunized with the Friend erythroleukemia 745.6 induced for 5 days in 1.5% dimethyl sulfoxide. This monoclonal antibody recognizes a 95,000-D molecule which is present as a disulfide-bonded dimer in the cell membrane. The properties of this antibody are similar to the RI7 208 monoclonal antibody we have described previously (lo), except that it is of the IgG2, class. Supematants from heavy cultures grown in Dulbecco’s modified Eagle’s medium containing 10% horse serum were used for all of the ex- periments.
Centrijkgal elutriation of bone marrow cells. Bone marrow cells were obtained from the femurs and tibias of 20-25 BALB/c mice of 4-6 weeks of age by flushing with Hepes-buffered Dulbecco’s modified Eagles medium containing 2% newborn calf serum (Hepes.CS). The red cells were lysed by treatment with Tris-buffered ammonium chloride (11). A sample was removed and kept on ice for subsequent flow cytometric and colony assays and the remainder (usually 4-7 X 1 O* cells) was suspended in 15 ml of cold Hepes-buffered Dulbecco’s modified Eagle’s medium containing 5% new- born calf serum (elutriation buffer). These cells were introduced under sterile conditions into the chamber of a Beckman JEdB elutriator rotor at 4°C running at 2850 + 10 rpm in a Beckman 52-2 1 centrifuge. The pump speed was set at 750 (10.3 ml/min). A flow-through fraction of 200 ml was collected at this pump speed; this fraction consisted mainly of dead cells and residual red blood cells, and was not assayed further. Stepwise fractions of about 200 ml were then collected at increasing pump speeds (see legend to Fig. 1). During the entire procedure the centrifuge was run at 4°C and the sterile elutriation buffer used to wash out the cell fractions was kept on ice. After the run the cells were spun down, suspended in cold Hepes.CS, and counted.
Flow cytometry. Cells for assay were spun down in 15-ml conical centrifuge tubes. Usually 5 X lo6 cells/tube were used, but in some cases, where the number of cells recovered in a particular elutriator fraction was low, fewer cells were used, with the amount of antibody used for staining adjusted in proportion. The cells were suspended in 200 ~1 of hybridoma tissue culture supematant and incubated on ice for 30 min with occasional mixing. For background controls, tissue culture medium alone was used. At the end of the incubation 2 ml of Hepes-buffered Dulbecco’s modified Eagles medium without phenol red and containing 0.15% polyvinylpyrrolidone K-90 and 2 mA4 sodium azide was added and the cells were centrifuged. After two further washes, the pellet was resuspended in 200 ~1 of fluorescein-conjugated goat anti-rat immunoglobulin which was non-cross-reactive with mouse immunoglobulin (Cappel Laboratories). After incubation and washing as above, the cells were suspended at 4 X 10⁶/ml in cold elutriation buffer and added to an equal volume of propidium iodide, 10 rg/ml in phosphate-buffered saline.
Flow cytometric analysis was done on the Salk Institute flow microfluorimeter. The Spectra-Physics argon laser (Model 164-03) was tuned to 488 nm with an output
16 LESLEY ET AL.
of 500 mW. The filter scheme included a Corning 3-69 barrier filter and a Schott 560-nm short pass dichroic mirror in front of the “green” (5 15-560 nm) detector, and a Schott 6 IO-nm barrier filter in front of the “red” (>6 10 nm) detector. Amplified forward narrow-angle 488-nm light scatter signals were integrated as a measure of total scatter, and sent to a pulse shape analyzer (12) for time-amplitude conversion (TAC) as an estimate of relative cell diameter (13). Analog signals from both green (5 15-560 nm) and red (>610 nm) fluorescence were integrated and logarithmically compressed (14) before digitization, and stored with light scatter parameters as list mode data files via the LACEL data acquisition system (15) using modified LACEL software ( 16) installed in a Digital Equipment Corporation (DEC) LSI- 11/23 computer. After data processing, the relative amount of green (5 15-560 nm) fluorescence was determined by standardizing to the relative fluorescence exhibited by l/8, l/4, and l/2 bright lo-tirn fluorespheres at the same laser output, high voltage, and log amp input sensitivity as used in the cell analysis. The number of cells showing positive fluorescence was determined by normalizing the background fluorescence histogram peak height to that of the unknown at the same channel number and subtracting this normalized background. This procedure was adopted to take account of the fact that many cells exhibited low levels of fluorescence, making it difficult to discriminate between dim positive and negative cells using an arbitrary threshold.
Cell sorting. Bone marrow was prepared and centrifugal elutriation was carried out as above. After removal of a sample for flow cytometric analysis and progenitor cell assay, the remaining cells in the elutriator fraction to be sorted were spun down and stained successively with filter-sterilized RI7 2 17.1.3 anti-transferrin-receptor culture supematant and filter-sterilized fluorescein-labeled goat anti-rat immuno- globulin. Sorting was carried out on a Los Alamos multiparameter cell separator as described previously (17). Recoveries from sorting experiments with bone marrow ranged from about 25% to about 40%. Some of this loss was due to rejection of cells by the pure sort logic and to losses during monitoring of the sort, while some appeared due to physical destruction of cells during sorting.
In vitro colony assays. Methylcellulose culture of bone marrow was carried out using modifications of the techniques described by Worton et al. ( 18): Iscove’s modified Dulbecco’s medium ( 19) was used for all cultures. For CFU-C, bicarbonate was added to this medium for culture in 13% CO*, and the medium was supplemented with 20% fetal calf serum, 3 X lop5 M 2-mercaptoethanol, 30 pg/ml L-asparagine, and 10% supematant from heavy cultures of the WEHI 3 cell line (20) (grown in 5% fetal calf serum in Dulbecco’s modified Eagles medium) as a source of colony-stimulating factor.
For BFU-E and CFU-E, the Iscove’s medium was buffered with bicarbonate for culture in 5% COZ and, in addition to the supplements added for the CFU-C assay, 0.3 U/ml of erythropoietin (Step III, sheep plasma erythropoietin from Connaught Laboratories, Inc., Swiftwater, Pa.) was added. In this case, WEHI 3 supematant was included as a source of burst-promoting activity (21).
For each assay bone marrow cells were plated out in duplicate in 35-mm-diameter plastic petri dishes (Falcon No. 1008) in 1 .O ml of the appropriate medium at three different cell concentrations: 106/ml and/or 3.3 X lO’/ml, 1.1 X lO’/ml and/or 3.7 X 10⁴/ml. CFU-E were counted at approximately 48 hr at 150-fold magnification on an inverted microscope after staining the dish with 0.5 ml of 0.1% benzidine dihydrochloride in 3% acetic acid in normal saline. BFU-E were counted at 8 days
TRANSFERRIN RECEPTOR ON HEMATOPOIETIC PROGEMTORS 17
on a dissecting microscope at about 30- to 48fold magnification after benzidine staining as for CFU-E. CFU-C were counted at 7 days on a dissecting microscope at about 30-fold magnification.
RESULTS
Transferin-Receptor Expression and Progenitor Cell Expression in Elutriator Fractions of Bone Marrow The murine transfer-r-in receptor is expressed on only a fraction of adult bone
marrow cells (10). We wished to investigate whether any progenitor cell class was selectively represented among these transfenin-receptor-positive cells. Pilot experiments indicated that it would be necessary to perform a preliminary enrichment for the transferrin-receptor-positive cells before sorting in order to obtain sufficient sorted cells for assay within a reasonable time period. Centrifugal elutriation, which separates cells primarily on the basis of size (22) provides a rapid method of cell fractionation.
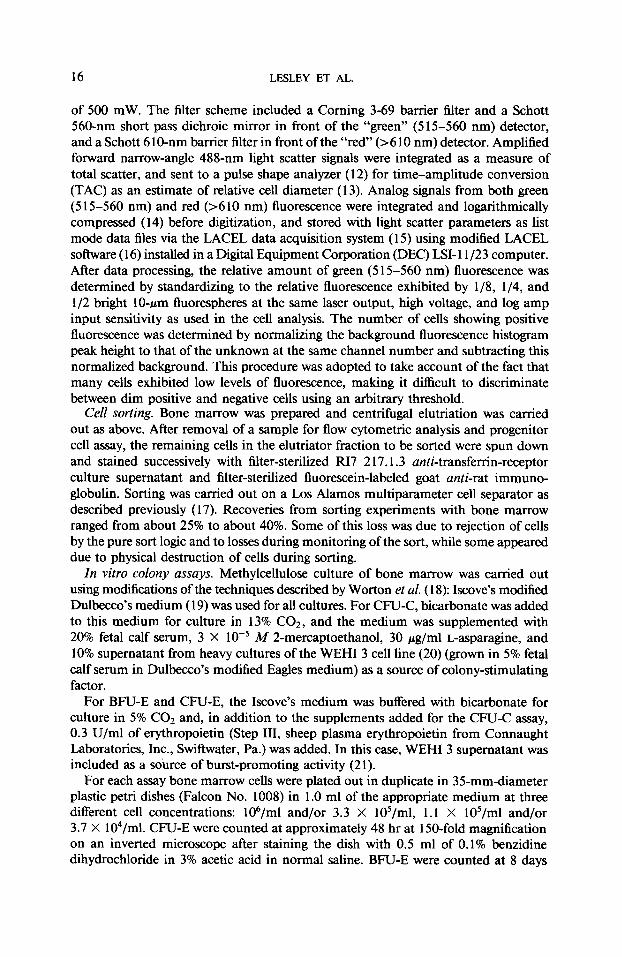
A typical fractionation of BALB/c bone marrow into three elutriator fractions and their staining with anti-transfer-r&receptor antibody is presented in Fig. 1. Under
0 256 I IO CHANNEL NUMBER
800
950
RELATIVE FLUORESCENCE
FIG. 1. Flow cytometric measurement of cell size (left) (light scatter-TAC) and transferrin receptor (right) in elutriator fractions of BALB/c bone marrow. Unfractionated bone marrow is shown in each panel for comparison (dots). Elutriator fractions were taken at the following pump speeds: 800, 15.0 ml/min; 880, 26.8 ml/min; 950, 57.7 ml/min. Full scale of ordinate = 1998 cells.

18 LESLEY ET AL.
our elutriation conditions we obtained three classes of progressively increasing size. The smallest-sized elutriator fraction usually had few transferrin-receptor-positive cells. The intermediate 880 fraction contained appreciable numbers of transferrin- receptor-positive cells, but most of these positive cells stained only weakly. The bulk of the bright cells were concentrated in the very largest (950) fraction. Cell recoveries ranged from 70 to 100% (usually 85- 100%) in a number of replicate experiments.
The results of assays for progenitor cell activity in the elutriation experiments are presented in Table 1. The small cell fraction was depleted of progenitor cells. The CFU-E activity was concentrated in the two largest-sized fractions. On a per cell basis, the largest 950 fraction showed an enrichment over unfractionated bone marrow. In terms of actual numbers of CFU-E, however, the 880 fraction showed considerable activity, a reflection of the larger total number of cells in this fraction. The bulk of the BFU-E activity was found in the intermediate-sized fraction. CFU-C activity was present mainly in the two largest fractions, with a two- to threefold relative enrichment on a per cell basis in the large cell fraction.
The total amount of progenitor cell activity recovered from all elutriator fractions was less than that expected from the activity of the unfractionated population. We considered the possibility that this loss in activity might be due to the separation of a progenitor cell from a second cell type which acted to enhance the response. To test this idea, we assayed a mixture of the elutriator fractions (data not shown). We did not observe any consistent relationship which would allow us to conclude that such a synergistic cell existed.
Progenitor Cell Activity in Transferrin-Receptor-Positive and -Negative Fractions of Elutriated Bone Marrow Cell Populations
The relative enrichment of CFU-E and transferrin-receptor-positive cells in the large cell fraction suggested that the CFU-E may be a large, transferrin-receptor- positive cell. To examine this point further, we sorted the large cell fraction into transferrin-receptor-positive and -negative fractions. Our sorting experiments revealed two problems of this antigenic system. One difficulty was the nearly continuous distribution of transfenin-receptor expression. This made the cutoff between “positive” and “negative” somewhat arbitrary. To minimize this problem we discarded a portion of the cells between the sorting windows corresponding to 5-10% of the total cells.
A second difficulty arose when we consistently observed that “mock-sorted pop- ulations,” sorted using the same light scatter gates but ignoring their specific fluo- rescence, were less fluorescent than cells analyzed without passage through the sorter. Also transferrin-receptor-positive sorted fractions, although enriched over mock sorts, always showed a variable proportion of transferrin-receptor-negative cells. This behavior was in contrast to the elutriated cells sorted for other surface antigens, where nearly 100% positive populations were obtained. For reasons discussed below, we believe that most or all of these transfenin-receptor-negative cells represent transferrin-receptor- positive cells which have undergone an antibody-induced “modulation.”
Progenitor cell assays for the two elutriation experiments of Table 1 after sorting the 950 elutriator fraction into transfenin-receptor-positive and -negative fractions are presented in Table 2. In both experiments (and in other experiments not shown), the bulk of the CFU-E activity recovered from the 950 fraction was seen in the transferrin-receptor-positive fraction. The transfer-r&receptor-negative fraction was

TABL
E 1
Prog
enito
r C
ell A
ctiv
ity
in E
lutri
ator
Fra
ctio
ns
CFU
-E
CN
-C
BN-E
5
Tran
sfer
rin-
% o
f rec
over
ed
rece
ptor
- %
of
w o
f %
of
E
cells
in
posi
tive
activ
ity
Rel
ativ
e ac
tivity
R
elat
ive
activ
ity
Rel
ativ
e 2
Expt
Fr
actio
n fra
ctio
n ce
lls (%
) re
cove
red“
en
richm
ent’
reco
vere
d en
richm
ent
reco
vere
d en
richm
ent
?i
i2
1 N
FC
100
29.0
10
0.0
100
100.
0 10
0 10
0.0
loo
s 80
0 29
8.
8 0.
0 0
0.0
0 0.
3 1
$ 88
0 60
30
.3
18.4
30
34
.9
52
50.2
83
95
0 11
74
.3
30.4
28
1 22
.4
200
2.0
18
9
2 N
F 10
0 37
.0
100.
0 10
0 10
0.0
100
100.
0 10
0 %
800
37
34.4
d 0.
0 0
1.2
3 7.
4 20
21
.8
90
42.3
5
880
51
43.8
43
46
.4
83
950
12
66.0
39
.9
338
36.4
30
7 5.
8 49
3 8
’ Per
cent
age o
f act
ivity
rec
over
ed =
num
ber
of c
olon
ies
in t
he fr
actio
n/nu
mbe
r of
col
onie
s in
unf
ract
iona
ted
bone
mar
row
int
rodu
ced
into
elu
triat
or X
10
0.
b Rel
ativ
e en
richm
ent
= (n
umbe
r of
col
onie
s/l
X IO
6 cel
ls in
the
frac
tion)
/(num
ber
of c
olon
ies/
l X
lo6
cells
in u
nfra
ctio
nate
d bo
ne m
arro
w)
X 10
0.
’ NF
= un
fract
iona
ted
bone
mar
row
. Abs
olut
e nu
mbe
rs o
f pr
ogen
itor
cells
per
1 X
lo6
cel
ls in
unf
ract
iona
ted
mar
row
:
Expt
C
N-E
C
N-C
BN
-E
1
1 7.
6 X
IO3
1.7
x 10
3 7.
0 x
102
2 5.
1 x
10’
1.2
x IO
3 4.
3 x
102
$ CI)
d All
of th
ese c
ells
wer
e ex
trem
ely
dim
.
20 LESLEY ET AL.
depleted in CFU-E, and the amount of activity remaining in the negative fraction roughly paralleled the proportion of transferrin-receptor-positive cells contaminating this fraction (compare Experiments 1 and 2). In contrast to CFU-E activity, CFU-C activity was more or less equally distributed between the transfenin-receptor-positive and -negative fractions. Most of the BFU-E activity was present in the transfenin- receptor-negative fraction; however, since only a minor proportion of the total BFU- E activity was present in the large cell fraction, no conclusion can be drawn from this result.
It should be pointed out that there was differential survival among the progenitor cell classes upon sorting. In Experiment 1, for example, recovery of the 950 fraction after sorting was 41%; however, over 60% of CFU-C activity and 80% of the BFU- E activity in the 950 fraction were recovered. Recovery of CFU-E activity was only 16.2%. This effect seemed to be a consequence of sorting itself rather than of separating the population into transferrin-receptor-positive and -negative fractions since enrich- ment of CFU-C and BFU-E and depletion of CFU-E was seen in “mock sorts.” These results suggest that cell loss during sorting is nonrandom and that a population which includes the CFU-E is lost selectively.
Since the majority of BFU-E were found in the intermediate cell fraction, the experiments summarized in Table 2 left it unclear whether the BFU-E was transferrin receptor positive. Therefore, we modified our elutriation protocol to include the bulk of the transferrin-receptor-positive cells by taking only two fractions: one corresponding to the small cell fraction (800) and a second intermediate-large fraction (950), which included the cells comprising the previously described intermediate and large cell fractions. Essentially no progenitor cell activity was present in the small cell fraction (data not shown). The intermediate-large population was sorted for transferrin-re- ceptor-positive and -negative cells, excluding a window corresponding to 23.4% of the cells passed through the sorter. Transferrin-receptor expression of the sorted pop- ulations is illustrated in Fig. 2 and the progenitor activity of the sorted fractions is given in Table 3.
As before, the bulk of the CFU-E activity was found in the transferrin-receptor- positive population, which had a nearly fivefold enrichment in CFU-E over the “mock sort.” Also, CFIJ-C activity was distributed in both the transfenin-receptor-positive and -negative cell fractions in approximately the same ratio as the total cell recovery in these fractions. BFU-E activity, in contrast, was depleted in the transferrin-receptor- positive fraction. Most of the BFU-E were present in the transferrin-receptor-negative fraction which, however, did not show any relative enrichment for BFU-E activity, Presumably, the “window,“’ consisting of cells showing intermediate levels of transferrin receptor, was moderately enriched for BFU-E; however, this fraction was not assayed directly.
“‘Modulation ” of Transferrin-Receptor-Positive Bone Marrow Cells As mentioned above, one problem with the interpretation of the cell-sorting ex-
periments was the consistent appearance of negative cells in populations sorted for transferrin-receptor-positive cells. It is known that in HeLa cells transferrin receptor is rapidly recycled with a half-life on the cell of approximately 5 min (23). It seemed possible that during sorting a similar “modulation” of the transferrin receptor was occurring on bone marrow cells. Therefore we stained the 950 fraction as for sorting, incubated the stained cells at O’C, room temperature, or 37°C for various times, and

TABL
E 2
Prog
enito
r C
ell A
ctiv
ity
in t
he L
arge
Cel
l Fr
actio
n (9
50) S
orte
d fo
r Tr
ansf
errin
-Rec
epto
r-Pos
itive
and
-Neg
ativ
e C
ells
CFU
-E
CFU
-c
BFU
-E
‘1
% o
f to
tal
% o
f %
of
% o
f z
Tran
sfer
rin-re
cept
or-
cells
ac
tivity
R
elat
ive
activ
ity
Rel
ativ
e ac
tivity
R
elat
ive
Expt
Fr
actio
n po
sitiv
e ce
lls (%
) so
rted
reco
vere
d”
enric
hmen
th
reco
vere
d en
richm
ent
reco
vere
d en
richm
ent
?i
l2
1 Tf
r-‘
3.0
47
5.1
10
50.8
97
82
.3
172
3
Tfr+
d
66.5
49
94
.9
180
49.2
10
4 17
.7
36
$ W
indo
w’
- 4
- -
- -
- -
8 2
Moc
k so
rt’
44.8
10
0 10
0.0
100
100.
0 10
0 10
0.0
100
Tfr-
29
.0
55
31.4
47
66
.2
99
90.6
13
5 E
Tfr+
61
.4
27
65.3
20
0 31
.0
94
13.0
40
5
Win
dow
-
18
3.3
- 2.
8 -
0 -
’ Per
cent
age o
f act
ivity
rec
over
ed =
num
ber
of c
olon
ies
in fr
actio
n/nu
mbe
r of
col
onie
s in
moc
k so
rt (E
xper
imen
t 2)
or s
um o
f pos
itive
and
neg
ativ
e fra
ctio
ns (E
xper
imen
t M
1) x
100.
3 z
* Rel
ativ
e en
richm
ent
= nu
mbe
r of
col
onie
s pe
r 1
X 10
6 cel
ls in
fra
ctio
n/nu
mbe
r of
col
onie
s pe
r 1
X IO
6 cel
ls in
moc
k so
rt (E
xper
imen
t 2)
or
sum
of
posi
tive
and
’ ’
nega
tive
fract
ions
(Exp
erim
ent
I).
3 ’ 9
50 e
lutri
ator
fra
ctio
n so
rted
for
trans
ferti
n-re
cept
or-n
egat
ive
cells
. d 9
50 e
lutri
ator
fra
ctio
n so
rted
for
trans
ferri
n-re
cept
or-p
ositi
ve c
ells
. 8
’ 950
elu
triat
or f
ract
ion
excl
uded
from
sor
t. In
Exp
erim
ent
2, a
ctiv
ities
are
cal
cula
ted
by s
ubtra
ctin
g th
e su
m o
f the
act
iviti
es i
n th
e po
sitiv
e an
d ne
gativ
e po
pula
tions
t?
from
that
in t
he m
ock
sort.
‘A
bsol
ute
num
ber
of p
roge
nito
r ce
lls p
er 1
X l
o6 c
ells
in m
ock
sort
(Exp
erim
ent
2) w
ere
CFU
-E/7
.23
X 10
’; C
FU-C
/7.2
X 1
0’;
BFU
-E/4
.39
X 10
2. Th
e re
cove
ries
3 UJ
of th
e 95
0 fra
ctio
n af
ter
sorti
ng w
ere
41%
in E
xper
imen
t 1
and
32%
in E
xper
imen
t 2.

22 LESLEY ET AL.
. INT.- LARGE FRACTION
_. 1 . . :
MOCK SORT
NEGATIVE SORT ‘. :
I IO 100 I IO 100 RELATIVE FLUORESCENCE
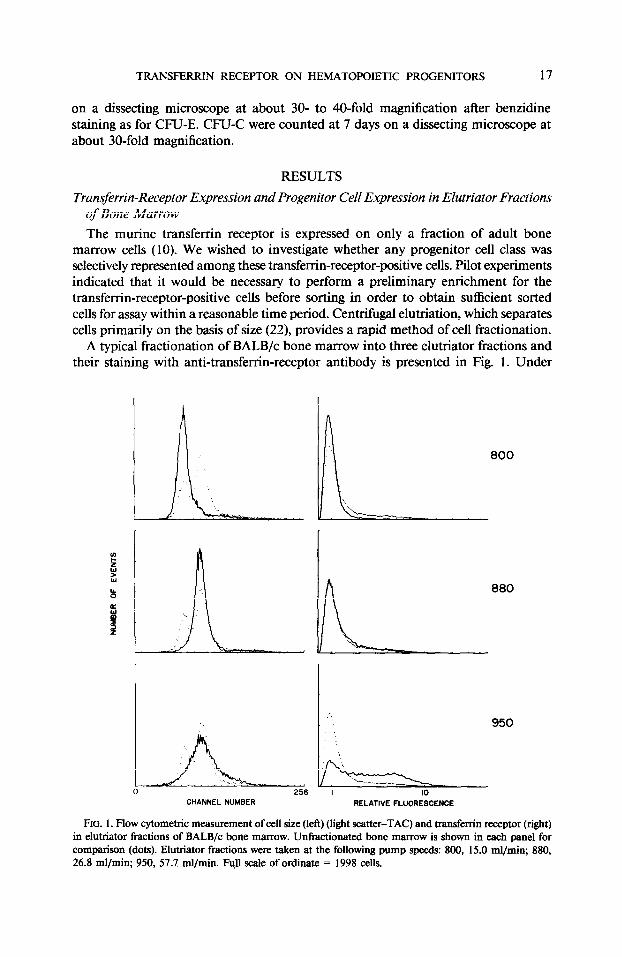
FIG. 2. Transferrin-receptor expression of the intermediate-large cell fraction (950) sorted into positive and negative populations. The background fluorescence of the 950 fraction is shown for comparison (dots). A window corresponding to 23.4% of the 950 fraction showing intermediate levels of fluorescence was discarded. Full scale of ordinate = 1372 cells.
then placed the cells on ice until analysis. We also restained some of these incubated samples. Results of this experiment are presented in Fig. 3.
A rapid, temperature-dependent loss of fluorescence was observed, followed by a slower decline. Some of this initial loss of fluorescence may be due to dissociation of antibody (24) and/or to recycling of transfer-r-in receptor and loss from the cell
TABLE 3
Progenitor Cell Activity in the Intermediate-Large Cell Fraction (950) Sorted for Transferrin-Receptor-Positive and -Negative Cells
Fraction
CN-E CN-C BN-E Transferrim
receptor- % of total % of Relative I of R&the 5% of Relative positive cells activity emich- activity emich- activity enrich- cells (W) sorted recovered” mentb recovered ment recovered meat
Mock sortc 36.4 100 100 100 100 100 loo 100 Sort Tfr? 23.6 61.9 26.8 43 56.3 91 61.7 100 Sort Tfr+ e 12.9 14.7 71.9 489 22.8 155 4.9 34 Window’ - 23.4 1.3 - 20.9 - 33.4 -
4 Percentage of activity recovered = number of colonies in fraction/number of colonies in mock sort X 100. b Relative enrichment = (number of colonies/l X 106 cells in fmction)/(number of colonies/l X IO6 cells in mock sort)
x 100. c Percentage of ttansferrin-receptor-positive cells in unfractionatcd = 4 I .O%. Percentage of transfenin-receptor-positive
cells in 950 fraction = 46.3%. d 950 elutriator fraction sorted for transfertin-receptor-negative cells. e 950 elutriator fraction sorted for transferrio-receptor-positive cells. ‘950 elutriator fraction excluded from sort. Activities arc calculated by subtracting the sum of the activities in the positive
and negative populations from that in the mock sort.
TRANSFERRIN RECEPTOR ON HEMATOPOIETIC PROGENITORS 23
1.O.j 1 1 1 1 I
0 10 20 30 40 50 60
INCUBATION TIME (MIN)
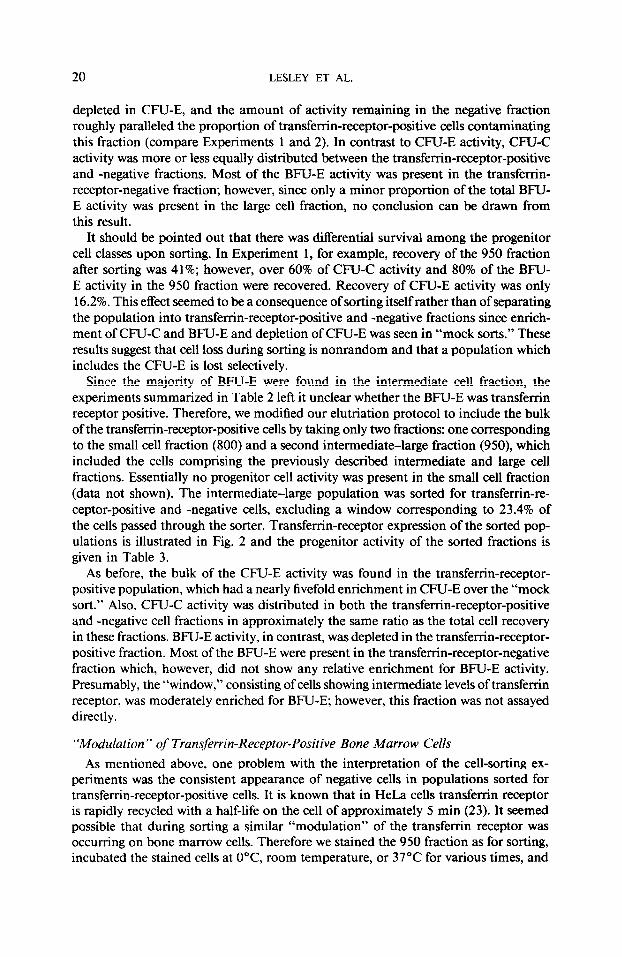
FIG. 3. Modulation of transferrin receptor. The large cell fraction of murine bone marrow was stained with anti-transferrin-receptor antibody as for sorting as described under Materials and Methods, incubated at various temperatures, and placed on ice until analysis. Some samples (RS, open symbols) were restained in the cold and reanalyzed. The mean relative fluorescence compared to samples stained with medium alone is given on the ordinate; the mean relative fluorescence of samples incubated at O’C for 60 min was 3.6 while that of samples incubated at 0°C for 60 min and restained was 4.9.
surface of its associated antibody (23) since samples incubated at room temperature or 37°C for 5 min and restained showed increased levels of fluorescence over samples which were not restained. Samples which were incubated at 37°C for 60 min and then restained, however, did not return to control values, suggesting that an antibody- induced loss of transferrin receptor (as opposed to recycling) may also be occur- ring (24).
The experiment summarized in Fig. 3 therefore suggests that one explanation for the loss of fluorescence in “mock-sorted” samples is loss of antibody occurring due to warming during the sorting procedure and subsequent handling. Although we tried chilling the sample, the sheath buffer, and the collection tubes, it was not possible to entirely eliminate this effect. Sodium azide appeared of little or no benefit.
DISCUSSION
We have used centrifugal elutriation and cell sorting to characterize the erythroid (CFU-E and BFU-E) and myeloid (CFU-C) progenitors in mouse bone marrow in terms of transferrin-receptor expression. Most of the progenitor cell activity is found among the intermediate-large-sized cells, with the CFU-E tending to be larger than the BFU-E. Although there appears to be selective loss of CFU-E during the sorting procedure and while “modulation” occurring during handling may lead to under- estimation of the number of transferrin-receptor-positive cells in sorted fractions (Fig. 3) the bulk of the CFU-E is consistently found in the transfer-tin-receptor-positive population. This relationship argues that most or all of the CFU-E are, themselves, transferrin receptor positive. In support of this conclusion we have found that ricin- coupled anti-transferrin-receptor antibody inhibits CFU-E when bone marrow cells

24 LESLEY ET AL.
are pulsed with the conjugate and then plated in the CPU-E assay.4 In contrast, the bulk of the BFU-E sort into the transferrin-receptor-negative fraction (Table 3). Since BFU-E represent only about 0.1% of the cells in the negative fraction, which itself contains 20-25% weakly transferrin-receptor-positive cells, and since an appreciable proportion of BF’U-E activity could be accounted for in the “window” of cells showing intermediate levels of transfenin-receptor expression (Table 3), it is not possible to conclude that BFU-E do not express transferrin receptor. It does seem clear, however, that on average BFU-E express much less transferrin receptor than CPU-E.
Our data, therefore, together with that of others who have studied the later stages of erythroid maturation (6-8) are consistent with a maturation scheme in which an intermediate-sized cell expressing low amounts of transferrin receptor (BFU-E) matures to a larger cell expressing increased levels of transferrin receptor (CPU-E). Transferrin receptor is then expressed during the later stages of erythroid maturation, while he- moglobin synthesis is occurring, and is then lost during the last stages of red cell maturation. Presumably the bulk of the transferrin-receptor-positive cells in the large and intermediate-sized fractions represent later (postprogenitor) stages of erythroid (or myeloid) maturation.
The data from the mouse are in broad agreement with those in the human (9). In man, the majority of the CPU-E recovered from normal bone marrow has been shown to be transfenin-receptor-positive by cell sorting after labeling either with the anti-transferrin-receptor monoclonal antibody OKT9 or with fluorescein-labeled transferrin. The majority of human BPU-E did not sort into the OKTPpositive fraction, similar to our results in the mouse with our monoclonal anti-transferrin- receptor antibody. In the human, however, most BFU-E were positive when sorted using fluorescein-labeled transferrin.
The expression of transferrin receptor by the bulk of CPU-E is in accord with the observation that most CPU-E are proliferating, as assessed by tritiated thymidine and vinblastine (25) or hydroxyurea treatment (26). Recently Nijof and Wirenga (27) have obtained nearly pure populations of CPU-E from the spleens of mice recovering from thiamphenicol treatment and have shown that the CPU-E is a large, proliferating cell, in accord with our data. The fractionation of CPU-C between transfetrin-receptor- positive and -negative cells is in agreement with reports that only a portion of these myeloid progenitor cells are in cycle (26, 28, 29).
Our finding that most BFU-E express little, if any, transferrin receptor is also consistent with the proliferation status of these cells. Velocity sedimentation exper- iments (30) indicate that the BFU-E is smaller than the CPU-E, similar to the dis- tribution of these cells in elutriation. Most BFU-E are not in cycle as assessed by sensitivity to vinblastine (25, 26) and tritiated thymidine (25) suicide. Broadly, the distribution of transfenin-receptor-positive hematopoietic progenitors in normal mouse bone marrow correlates well with the number of these non-hemoglobin-synthesizing progenitors which are in cycle.
REFERENCES I. Larrick, J., and Cresswell, P., J. Supramol. Strut. 11, 579, 1979. 2. Trowbridge, I., and Omary, M., Proc. Natl. Acad. Sci. USA 78, 3039, 1981.
’ J. Wesley, D. Domingo, R. Schulte, and I. Trowbridge. Effects of an anti-murine transferrin-receptor- ricin A conjugate on bone marrow stem and progenitor cells treated in vitro, Exp. Cell Rex, in press.
TRANSFERRIN RECEPTOR ON HEMATOPOIETIC PROGENITORS 25
3. Judd, W., Poodry, C., and Strominger, J., J. Exp. Med. 152, 1430, 1980. 4. Sutherland, R., Delia, D., Schneider, C., Newman, R., Kemshead, J., and Greaves, M., Proc. Nutl.
Acad. Sci. USA 78, 4515, 1981. 5. Boyse, EL., and Old, L., Ann. Rev. Genet. 3, 269, 1969. 6. Jandl, J., and Katz, J., J. Clin. Invest. 42, 314, 1963. 7. Nunez, M., Glass, J., Fisher, S., Lavidor, L., Lessk, E., and Robinson, S., Brit. J. Hematol. 36, 5 19,
1977. 8. Sullivan. A., and Weintraub, L., Blood 52, 436, 1978. 9. Sieff, C., Bicknell, D., Caine, G., Robinson, J., Lam, G., and Greaves, M., Blood 60, 703, 1982.
10. Trowbridge, I., Lesley, J., and Schulte, R., J. Cell. Physiol. 112, 403, 1982. 11. Hudson, L. and Hay, F., “Practical Immunology,” p. 276. Blackwell, Oxford, 1976. 12. Hiebert, R., “Los Alamos Scientific Laboratories, Model 8 178, pulse-shape analyzer.” Dwg. No. 4Y-
223131, 1978. 13. Wheeless, L., In “Flow Cytometry and Sorting” (M. Melamed, P. Mulhaney, and M. Mendelsohn,
Eds.). Wiley, New York, 1979. 14. Hiebert, R., “Los Alamos Scientific Laboratories, Model 8130, dual log amplifier.” Dwg. No. 4Y-
89749, 1975. 15. Hiebert, R., Jett, J., and Salzman, G., Cytometry 1, 337, 198 I. 16. Salzman, G., Wilkins, S., and Whitfill, J., Cytometry 1, 325, 1981. 17. Hyman, R., Trowbridge, I., Stallings, V., and Trotter, J., Immunogenetics 15, 415, 1982. 18. Worton, R., McCulloch, E., and Till, J., J. Cell. Physiol. 74, 17 1, 1969. 19. Iscove, N., Guilbert, L., and Weyman, C., Exp. Cell Rex 126, 121, 1980. 20. Ralph, P., Moore, M., and Nilsson, K., J. Exp. Med. 143, 1528, 1976. 21. Iscove, N., Roitsch, C., Williams, N., and Guilbert, L., J. Cell Physiol. Suppl. 1, 65, 1982. 22. Sanderson, R., and Bird, K., Methods Cell Biol. 15, 1, 1977. 23. Bleil, J., and Bretscher, M., Eur. Mol. Biol. J. 1, 351, 1982. 24. Lesley, J., and Hyman, R., Eur. J. Immunol. 4, 732, 1972. 25. Gregory C., and Eaves, A., Blood 51, 527, 1978. 26. Wagemaker, G., Peters, M., and Bol, S., Cell Tissue Kinet. 12, 521, 1979. 27. Nijhof, W. and Wierenga, P., J. Cell Biol. 96, 386, 1983. 28. Metcalf, D., Proc. Sot. Exp. Biol. Med. 139, 51 I, 1972. 29. Lajtha, I.., Pozzi, L., Schofield, R., and Fox, M., Cell Tissue Kinet. 2, 39, 1969. 30. Heath, D., Axelmd, A., McLeod, P., and Shreeve, M., Blood 47, 777, 1976.