exports, real exchange rates and external exposures
TRANSCRIPT
WORKING PAPER NO: 16/24
Exports, Real Exchange Rates and
External Exposures: Empirical Evidence
from Turkish Manufacturing Firms
November 2016
Nazlı TORAGANLI Cihan YALÇIN

The views expressed in this working paper are those of the
author(s) and do not necessarily represent the official views of the
Central Bank of the Republic of Turkey. The Working Paper Series
are externally refereed.
© Central Bank of the Republic of Turkey 2016
Address:
Central Bank of the Republic of Turkey
Head Office
Structural Economic Research Department
İstiklal Caddesi No: 10
Ulus, 06050 Ankara, Turkey
Phone:
+90 312 507 80 04
Facsimile:
+90 312 507 57 33

1
Exports, Real Exchange Rates and External Exposures: Empirical
Evidence from Turkish Manufacturing Firms
Nazlı Toraganlıa,1 and Cihan Yalçınb,2
Abstract
Turkish manufacturing firms are highly exposed to foreign currency (FX) denominated costs in the forms of liability dollarization and high imported input content in domestic production. This might limit the competitiveness effects of currency depreciation on exports. We attempt to uncover the relationship between the real exchange rates and exports of manufacturing firms in Turkey by taking account FX exposures and various firm characteristics. We use a large panel of manufactıring firms to carry out an empirical analysis for the period 2002-2010. We document that a real depreciation of the Turkish lira has a positive impact on export volumes and its impact is muted for manufacturing firms operating in sectors that use imported inputs intensively. That is, the cost of production channel seems to be effective in export performance of firms. In addition, we estimate that exports are less sensitive to real exhange rates for firms having moderate or low FX debt-to-export ratios (naturally hedged) and those are large and mature. Contrary to macro evidence, firm level findings suggest that a depreciation of Turkish lira seems to favor the external competitiveness of firms in general while for naturally hedged, large, mature, and high import intensity firms, the sensitivity is estimated to be smaller.
Keywords: exports, real exchange rates, currency mismatch, firm characteristics
JEL Classification: F23, F31, G15, G31, G32
a MEF University, Faculty of Economics Administrative and Social Sciences/ Economics, TR-34396 Istanbul,
Turkey, [email protected]. b The Central Bank of the Republic of Turkey, İstikbal Cad. 10 Ulus, 06100, Ankara, [email protected]
(Corresponding author).

2
I. Introduction
With the availability of firm-level evidence, the dynamics of exporting activity has been a
major area of interest among empirical researchers following Bernard and Jensen (1999).
This line of research has demonstrated the presence of substantial productivity differences
among establishments in similar industries which are strongly correlated with the
establishments’ export status (Bernard and Jensen, 1999, Baldwin and Gu, 2003). These
findings contributed to the development of the new-new trade theory with the seminal
paper of Melitz (2003). In this setting individual firms are subject to sunk costs such as cost
of acquiring local information, establishing a local distribution network, and modifying goods
to adjust the local market tastes. In the presence of these entry costs, only relatively more
productive firms are able to export and productivity appears as an important determinant
for firms to engage in exporting activity.
These sunk costs of exporting can be perceived as a form of investment and need to be
financed (Bernard et al., 2003; Bernard and Jensen, 2004; Campa, 2004; Helpman et al.,
2004; Roberts and Tybout, 1997; Roberts et al., 1997 and Tybout, 2003). Empirical literature
has documented that financially strong firms are more likely to enter the export markets
since their financial positions affect their investment and spending decisions associated with
sunk costs (Greenaway et al. 2007). This literature opened a line of empirical research
testing the role of financial constraints in firms’ intensive and extensive margins of trade by
using rich micro datasets mostly available for developed economies (see, for example,
Forlani, 2010; Minetti and Zue, 2011 for Italy; Gorg and Spailara (2014), for the UK, Bellone
et al. 2010 for France). Further research in this field has stressed the role of financial health
in generating an additional source of heterogeneity that could possibly account for
differences in exporting behavior across firms. In this framework, financial constraints can
create a disconnection between productivity and exporting such that productivity can be
major determinant of the export decision only if the firm has a sufficient access to external
finance (Berman and Hericourt, 2010; Liu and Li, 2015).
The empirical trade literature has so far paid little attention to the possible effects of FX
exposures (or FX denominated cost items including debt) on financial positions of firms in
examining the impact of exchange rates on exporting behavior. Under perfect capital
markets, a firm’s financial position is irrelevant to its decisions on production and
investment activities (Modigliani and Miller, 1958). However, in imperfect financial markets,
informational asymmetries create a wedge between internal and external finance (Bernanke
and Gertler, 1995). Therefore, the extent of the changes in activities of firms as a result of
external shocks depends very much on how these activities are financed. That is, the
activities of firms with limited internal funds or financially constrained firms are more
sensitive to retained earnings or cash flows as empirically documented by Fazzari et
al.(1988).

3
Consequently, for firms with large foreign exchange denominated debt (a form of external
finance), a shock to capital inflows or sudden stops may lead to a rise in exchange rate
volatility and have strong implications for their financial positions thus their real activities
(Calvo and Reinhart, 2002; Calvo et al., 2004). The potential effects of these shocks are
amplified, particularly in the case of “currency mismatch” when firm’s debt is largely in the
form of FX and its income and assets are mostly denominated in domestic currency.
Particularly in the context of developing countries, this is an important area of research as
exchange rates are more volatile, hedging instruments are not widely used, and domestic
production is highly dependent on foreign exchange denominated cost items.
In a simple framework, a real depreciation of domestic currency (a decline in the real
exchange rate index) may affect firms’ exports through three channels. First channel is the
rise in the foreign demand for exports as a result of a decrease in the FX value of the
exported goods. In this way, a firm will gain competitive advantage in international markets,
and a margin is created both for an increase in the quantity and the local currency
denominated unit price of the exported goods. The second channel exhibits itself through
imported and FX indexed domestic inputs. Accordingly, currency depreciation will increase
production costs of companies that rely heavily on these inputs. In this study, we particularly
pay attention to the fact that the domestic production of manufacturing firms is highly
exposed to FX denominated costs. Therefore, the competitiveness impact of a real
depreciation of domestic currency might be muted by these counter-acting cost items. That
is, an exchange rate policy intending to reduce external imbalances might not be fully
effective as noted by Campa and Goldberg (1997) and Greenaway et al. (2010). Finally, the
third channel is that, after currency depreciation, firms that are indebted in terms of FX, lose
their competitive advantage in the international markets through balance sheet effects due
to the increase in the book value of their debts. Especially those firms that have currency
mismatch in their liabilities and assets are impacted by exchange rate volatility negatively
through balance sheets and production cost channels. Under such circumstances, the
depreciation of the local currency reduces the net worth of the firm, restricts the availability
of export financing and causes a loss of competitive advantage.
This paper builds on the literature focusing on the effects of exchange rate variations on
firm-specific performance measures (exports, growth, productivity, survival) by taking into
account the role of financial constraints. We particularly incorporate foreign exchange
denominated costs (foreign exchange denominated debt and imported inputs) into the
analysis to control firm-level currency mismatch. That is, we estimate exchange rate
elasticity of exports by allowing heterogeneity among firms by using data for the period
2002-2010 when flexible exchange rate regime was effective in Turkey.
The analysis done, referencing the related literature, involves empirical tests that use firm
specific variables such as the liability dollarization ratio, labor productivity, real sales,
leverage ratio, collateral ratio; industry based variables such as industry-specific real

4
exchange rates and imported inputs intensity as well as macro variables that reflect
domestic and foreign demand and macro volatility. In this context, we intent to control how
exchange rate elasticity of exports react to firms heterogeneity in terms of imported inputs
intensity, liability dollarization, degree of currency mismatch, size, and age.
Our findings suggest that a real depreciation of the Turkish lira has a positive impact on
exports of firms. This positive impact is muted for manufacturing firms operating in sectors
that use imported inputs intensively. Similarly, exports of firms with moderate or low FX
debt-exports ratios, so called “naturally-hedged”, are less sensitive to real exchange rates as
expected. In addition, estimations show that the exports of medium, small, and young firm
groups are generally more sensitive to the real exchange rate while the exports of mature
and large firms are estimated to be less sensitive. In short, firm level findings suggest that a
depreciation of Turkish lira favor the external competitiveness of firms in general while the
sensitivity is estimated to be smaller for naturally hedged, large, mature and high import
intensity firms.
The rest of the paper is organized as follows. Section II reviews the existing literature.
Section III presents economic developments and FX exposure structure in Turkey. Section IV
describes the firm-level data and other data sources. Section V contains the empirical
analysis of the links between export patterns and exchange rates considering various firms
characteristics. Section VI concludes.
II. Literature Review
The empirical trade literature has remained fairly limited to the impact of foreign exchange
exposures or FX debt on financial positions of firms in examining the impact of exchange
rates on exporting behavior. Although a number of studies focused on emerging market
countries using firm-level data investigate the impact of debt dollarization on investment
(Bleakley and Cowan, 2008; Carranza et al., 2003), sales and employment (Alp and Yalçın,
2015), with the exception of Cheung and Sengupta (2013), none of them incorporates
foreign exchange denominated debt to explore exchange rate and export link. Cheung and
Sengupta (2013), using a sample of Indian firms, document a negative effect of currency
appreciation and currency volatility on Indian firms’ exports-to-sales ratio while the impact
of firm-level determinants on financial constraints such as FX debt or collateral do not
appear to have a significant effect on firms’ exports-to-sales ratios. At a macro level, using
quarterly data for 27 developed and developing countries, Berman and Berthou (2009) finds
that the impact of currency depreciation on exports is negative in a given country if firms
heavily borrow in FX.1 Manova (2015) based on a heterogeneous-firm model with cross-
1 On the theoretical side, Chaney (2016) in a Melitz (2003) type heterogeneous firm framework, assuming that
firms finance the costs for entering foreign markets using cash flows from domestic sale, stresses the positive impact of exchange rate appreciation on alleviating liquidity constraints by increasing the value of domestic assets owned by potential exporters. As a result firms that could not enter foreign markets because of liquidity constraints, start to export as the value of their assets has appreciated.

5
country differences in financial development and cross-industry variation in financial
vulnerability, demonstrates that weak financial institutions lead to fewer destination
markets, reduced export product variety, and lower aggregate trade volumes and these
distortions are amplified in financially vulnerable sectors.
Our paper is also related to the firm-level studies examining the impact of exchange rates on
firm-level performance measures with an emphasis on financial constraints. Gezici et. al.
(2016) find evidence that less financially constrained firms are more likely to start exporting
in Turkish manufacturing. Çağlayan and Demir (2014) and Demir (2013), using a panel of
Turkish firms, document that when they have access to foreign or domestic equity, or debt
markets, the negative impacts of exchange rate volatility on firms’ growth is muted. On the
other hand, the negative impact of exchange rate volatility on firms’ productivity growth is
not decreased. Hericourt and Poncet (2015), using a panel of Chinese firms show that firms’
decision to start exporting and the exported value decrease for destinations with higher
exchange rate volatility and this effect is increased for financially vulnerable firms. In these
studies, foreign exchange denominated costs or the level of imported inputs have not been
considered.2
None of the studies mentioned addresses the role of foreign exchange denominated costs or
imported inputs. In this study, in addition to foreign exchange denominated debt, we also
take into consideration sectoral level imported input use. A depreciation of the real
exchange rate results in cheaper exported goods and services, but also makes the imported
input expensive creating a cost disadvantage (for example, see Campa and Goldberg, 1997,
for the US, UK, Canada and Japan; Hummels et al., 2001, for several OECD countries,
Greenaway et al. 2010 for UK). Ahmed et al. (2015) find evidence that the elasticity of
exports to the real exchange rate has been declining mainly due to the intensification of
vertical integration the in global value chain which increases the usage of imported inputs all
around the world. In this context, Turkish industrial production which is highly dependent on
imported inputs represents an ideal natural experiment for testing the muting effects of
currency depreciations on exports due to growing imports bill.
In this paper, we also contribute to the literature investigating the relative irresponsiveness
of exports to exchange rate movements at the aggregate level, a phenomenon referred as
exchange rate disconnect puzzle. Heterogeneous responses of export volumes to exchange
rates depending on firms’ characteristics may partly explain the weak impact of exchange
rate movements on aggregate exports. Micro level empirical investigation has potential to
2 In Hericourt and Poncet (2015) financial constraints or vulnerability has been measured using standard measures such as share of capital expenditures not financed with cash flows from operations as in Rajan and Zingales (1998) or the ratio of intangible assets to fixed assets as in Braun (2003), and the share of R&D spending in total sales (R&D) as in Manova (2015). These are good proxies for ranking industries in all countries. In Cağlayan and Demir (2014) and Demir (2013) firm-specific variable reflecting firms’ access to domestic and foreign equity and debt markets has been considered as an indicator of financial development.

6
reconcile conflicting macro and micro evidence (see, e.g., Dekle et al., 2009) in explaining the
relative insensitivity of exports to exchange rates.
For the Turkish case, the micro evidence on the impact of exchange rate variations on firm-
level exports is almost not present. The impact of real exchange rate variations on exports
has been studied extensively using aggregate level data at macro or industry level (Aydın et
al. 2004, 2007; Bozok et al. 2015; Çulha and Kalafatacılar; 2014; Berument et al., 2014;
Neyaptı et al., 2007). These studies often fail to report strong impact of real exchange rate
depreciations on exports, mainly attributed to high import content in the production (Aydın
et al., 2007), the destination specific differences (Culha and Kalafatacılar, 2014), and product
or sectoral variations (Berument et al., 2014; Coşar, 2002). Nazlioglu (2013) and Dinçer and
Kandil (2011) stresses that growth in importing countries is a key determinant of sectoral
export growth.
There are several studies investigating exporting behavior using firm-level data, but one of
them investigates firm-level exports’ sensitivity to real exchange rates. Amongst the firm-
level studies, Demirhan (2015) using CBRT Company Accounts Database documented the
superiority of exporting firms in terms of productivity, profitability, and size compared to
non-exporters explained by self-selection and learning-by-exporting hypotheses. Using the
same database, Aldan and Günay (2008), investigate the effect of entering into export
market on firm-level productivity and employment documenting that larger and more
productive firms self select into export market and starting to export further increases labor
productivity and employment. Akarım (2013) investigates the impact of financial contraints
using a dataset of manufacturing firms whose stocks are traded in Istanbul Stock Exchange
(ISE) and find no significant relations between financial factors and the probability of
exporting.
III. A Short Evaluation on Foreign Exchange Exposures in Turkey
High current account deficit (or low domestic savings) has been a major obstacle for
achieving high and sustainable growth in Turkey. Heavy dependence on imported inputs and
foreign savings raises the sensitivity of the economic activity and prices to fluctuations in
capital flows and international commodity prices. In this environment, exchange rates
appear to be one of the key variables reflecting the conditions of the economy. In addition
to unfavorable external position of the economy mentioned above, relatively high and
unstable inflation rates were one of the underlying factors behind volatile exchange rates
putting economic agents in a position where their pricing and investment decisions are more
complicated.
To overcome the uncertainty due to unstable macro environment and volatility in exchange
rates and international risk appetite, economic agents in Turkey tend to hold large amounts
of FX liabilities and assets and they adopted a widespread FX indexed domestic pricing
behavior especially during 1990s. In other words, economic transactions were highly

7
dollarized. Although there has been a decline in both liability and asset dollarization in 2000s
as a consequence of improvement in underlying fundamentals, dollarization and FX indexed
pricing have gained momentum again in recent years.
Before going into details of the empirical model, we will present several factors, which have
affected the sensitivity of the Turkish economy to the exchange rates through increasing its
FX exposure. Firstly, Turkish economy was transformed in a way that it has started to use
more imported inputs in the production activity especially in 2000s. Secondly, in addition to
growing import bill, fixed investments were largely financed by growing capital inflows
which not only supported Turkish lira especially before the great recession in 2008, but also
increased the fragility of the real sector to external shocks. Lastly, although there has been a
decline in the extent of liability dollarization, the FX indexed pricing in the domestic
economy has not lost its importance (Hülagü and Yalçın, 2014). We provide brief discussions
on the first two factors below, respectively.
Turkish economy is characterized by a large trade deficit which is triggering the boom and
bust cycles in the economy. Although various initiations were taken to encourage exports
and reduce the reliance on imported inputs in the production, they failed to stop the
widening the external gap. In fact, trade deficit has deteriorated further in recent years
resulting from increasing trend in imports which have grown rapidly due to the increasing
imported input content of domestic production especially after 2001 (Figure 1 and 2).
Intermediate goods imports which has been always larger than exports of goods, reached as
much as 22 percent of GDP in 2014. Insufficient domestic production in parallel to the strong
economic performance during post-2001 crisis period was one of the major reasons of this
increasing trend (Saygılı et al., 2010).
During this period, the finance costs and the price of capital goods went down, capital
inflows accelerated and the Turkish lira appreciated significantly. Firms tended to allocate
more resources to capital intensive production activities such as automotive, machinery and
equipment, basic metal, metal products etc. which relied relatively more on imported
intermediate and capital (machinery and equipment) inputs. The unavailability of domestic
production, the need for high quality and uninterrupted supply to ensure technology
transfer, and the possibility of cheaper supply due to domestic currency appreciation and
competitive prices in the trading partners (e.g. China) were other major factors contributing
to the increasing trend in imported inputs.
Turkish financial system do not produce sufficient Turkish lira denominated resources with
reasonably long maturity to finance financially constrained domestic agents. The most
important reasons for this are the relatively low domestic financial savings mostly
characterized by short maturity structure. Banks are the primary financial institutions and
have to borrow from abroad in order to extend credits with longer maturity. These credits
are provided mostly in terms of FX in order to avoid the currency risk. On the other hand,

8
non-financial firms also borrow heavily from abroad directly. In other words, the growing
imports bill and investments are largely financed by FX denominated debt. As a result, the FX
liabilities of non-financial firms reached to 35 percent of GDP in 2014 from 14 percent in
2002 and short net FX position3 of these firms have increased from 3 percent of GDP to 22
percent in the same period (Figure 3). The net FX short position of non-financial firms in
Turkey surpassed 180 billion US dollars recently.
The liability dollarization ratio, calculated as the share of FX debt in total debt, of non-
financial firms in Turkey can be interpreted as high when compared internationally as well.
According to IMF (2015, p.42), Turkey has the third highest FX-denominated debt to GDP
ratio as of 2014 after Chile and Poland. Based on firm level data, during the post-2001 crisis
period, liability dollarization ratio, decreased from 85 percent in 2001 to 65 percent in 2010
in parallel to the declining inflation, structural reforms, and the newly adopted flexible
exchange rate system (Alp and Yalçın, 2015). Short-term liability dollarization ratio has been
on a declining trend as well. From 76 percent in 1996, it decreased to 50 percent in 2001,
and with the positive impact of the reduced uncertainty during the post-2001 period it
further shrank to 25 percent in 2010. Despite the improvements in the maturity structure
and the decreased share of FX-denominated debt, liability dollarization ratio of Turkey is still
high. This situation increases the fragility of non-financial companies to external shocks such
that in the case of a sudden stop foreign funding remains limited and credit to the real
sector freezes. However, in spite of risk involved in FX debt, they undermine the extent of
financial constraints and contribute to the enhancement of domestic economic activity in an
environment where domestic financial system fail to produce enough domestic currency
denominated funds mainly due to low domestic savings and short maturity of financial
savings. Note that although there has been a decline in the extent of liability dollarization,
the FX indexed pricing in the domestic economy has not lost its importance. FX-indexed
pricing behavior prevailing in the domestic sector in some sectors has a positive impact on
lowering currency risk (Hülagü and Yalçın, 2014).
In addition to imported inputs, it is also important to note that financial expenditures in
terms of FX is an important cost item for non-financial firms particularly in times of currency
depreciations as FX denominated debt in terms of the domestic currency increases. Figure 4
shows that net profit margins of firms with poor natural hedging (risky firms) melt down
significantly when Turkish lira depreciated sharply during the post-2008 financial crisis
period. On the other hand, firms that are able to match the currency composition of their
debt with their income streams, so called low-risk firms, seem to be affected from currency
depreciations to a lesser extent.
3 Net FX deficit is calculated as FX denominated assets minus FX denominated liabilities.

9
Figure 1: Exports and Imports in 2000-2014 (in billion US dollar)
Exports Imports
Source: TURKSTAT
Figure 2: The Share of Imported Intermediate Inputs in Total Cost of Production (Percent)
Source: Saygılı, Cihan, Yalçın and Hamsici (2010)
28
158
0
50
100
150
200
250
2000 2014
Consumption goods exports
Capital goods exports
Intermediate goods exports
55
242
2000 2014
Consumption goods imports
Capital goods imports
Intermediate goods imports
48,4
52,5
54,6
45
47
49
51
53
55
57
2002 2005 2007

10
Figure 3: FX Liabilities and Net FX Position of Non-Financial Firms in Turkey
(As percent of GDP)
Source: Central Bank of Turkey
Any change in the pace of capital inflows and the price of international commodity prices
has strong implications for the real exchange rates and thus domestic economy. The Turkish
lira has usually exhibited a very volatile pattern over the time given heavy reliance on foreign
capital and imported inputs. The Turkish lira has appreciated significantly when capital
inflows speeded up in 2000s while it has depreciated during the great recession and
afterwards (Figure 5). Given the volatility in the exchange rate and economy’s strong
reliance on imported inputs, empirical evidence for Turkey documents very strong exchange
rate and import price pass through to domestic prices as well (Kara and Öğünç; 2008; 2012).
Although there has been a decline in recent years in the exchange rate pass through, it is still
large in international standards. Consequently, the export performance has been also
affected by strong exchange rate and import price pass-through to domestic prices
prevailing in the Turkish economy, which deteriorates firms’ relative competitiveness in
external markets.
14
21
35
-3 -10
-22 -30
-20
-10
0
10
20
30
40
20
02
20
03
20
04
20
05
20
06
20
07
20
08
20
09
20
10
20
11
20
12
20
13
20
14
Total Liabilities Net FX Position

11
Figure 4: Profit Margins of Non-financial Firms (Percent)
Source: Hülagü and Yalçın (2014)
Figure 5: CPI Based Real Exchange Rates
Source: CBRT
-2
0
2
4
6
8
10
2006 2007 2008 2009 2010 2011 2012
Yüksek Riskli Orta Riskli Düşük Riskli Tüm FirmalarRisky Medium
risky Low risky All firms
70
80
90
100
110
120
130
2000 2002 2004 2006 2008 2010 2012 2014

12
IV. Data and Variables
IV.1. Database
The firm level data used in this study is based on two sources: i) The Central Bank of the
Republic of Turkey (CBRT) Company Accounts and ii) Risk Center Database of Banks’
Association of Turkey. The CBRT Company Accounts Database is the most comprehensive
database regarding financial data of non-financial firms in Turkey. It includes information on
balance sheet and income statement items, economic activity classified according to
industry or sector, establishment date, number of employees, provinces operated in, and
the legal status. Risk Center Database provides information on firm-level foreign and local
currency denominated debts and their maturities. We merge two datasets by using firm
identifiers, which enables us to incorporate information from balance sheet, income
statements, and FX denominated debts items into the same analysis.
One of the drawbacks of the CBRT data is that it does not meet sampling standards as it
covers mainly large firms. The database also covers only the participating firms those submit
their financial statements regularly to the commercial banks. Any firm whose data of last
three years is not available is kept out of the analysis. However, firms included in the dataset
are of great weight in total activities, which renders the representative power of this analysis
high. The dataset also includes substantial portion of small and medium-sized enterprises in
addition to large firms (about two third of the sample) operating in Turkey. About half of the
firms in the dataset operate in the manufacturing industry and these firms cover a significant
portion of aggregate economic activity. Based on 2010 data, these firms hold about 77
percent of manufacturing sales, over 95 percent of manufacturing exports and about half of
manufacturing FX-denominated debts. Firms in the database account for 35 percent of total
manufacturing employment.
IV.2. Variables of Interest
We use various firm specific, sectoral and macro variables in our analysis. As often used in
the literature we utilize logarithms of real sales and logarithms of labor productivity (the
ratio real sales to employment) to control for firms’ size and productivity, respectively. To
control financial conditions, following variables are used in the analysis: (i) leverage ratio,
defined as the firm's ratio of total liabilities to total assets, (ii) collateral ratio, defined as real
tangible assets over total assets to control capital intensity of firms and (iii) liability
dollarization ratio, defined as the ratio of FX liabilities to total liabilities. The first two
indicators have been extensively used in the literature dealing with financial constraints and
all these variables reveals the degree of the firms’ financial health (see Greenaway et al.,
2007).
Foreign currency liabilities is a central variable when examining the impact of exchange rate
variations on firm-level exports particularly in the context of developing countries as most of

13
them suffer from high liability dollarization (IMF, 2015). This situation is often referred as
“original sin”, following Eichengreen et al. (2005) measuring the inability of an economy to
borrow internationally in its own currency. In this situation, “currency mismatch” creates a
potential source of vulnerability if firm’s debt is in the form of FX while the income and
assets are mostly denominated in domestic currency. Therefore when evaluating the risks
associated with liability dollarization of companies, FX revenues (if any FX denominated
revenue exists) should also be considered. Since there is no available data that reflecting the
overall FX exposure of Turkish companies’ balance sheets, liability dollarization is analysed
by taking into account the export revenues of companies. In other words, export revenues
are considered as a “natural hedge” for companies that has FX denominated cash loans. If
the liability dollarization of a company is high whereas its export revenue is low (or no
export revenue), then the financial fragility of those kinds of companies are considered as
high due to currency mismatch. In order to measure the degree of currency mismatch, we
adopt Echeverry et al. (2003) methodology. Accordingly, we identify each firm as belonging
to one of the three zones in the foreign debt-exports space: hell, heaven, and hedge. Firms
are classifed as hedged if the magnitude of their exports is similar to the magnitude of their
foreign denominated liabilities. We construct our measure for currency mismatch by taking
the ratio of foreign exchange denominated debt to exports and set upper and lower bound
as FX Debt =0.15 Exports and FX Debt =3.2 Exports, representing the upper and lower 25th
percentile of the distribution. 4 On the hand hand, beyond the currency mismatch, having
access to FX-denominated debt at reasonably longer maturity may relax financially
constraints domestic agents and may support economic activity.
At sectoral level, we construct export-weighted real effective exchange rates. The trade
weights of each industry are constructed using the methodology described in Goldberg
(2004). The trade shares are averaged (within an industry) across the pre-sample time period
(1996-2000), therefore the variation in exchange rate over time comes only from changes in
the real exchange rate changes and not from fluctuations in partners' trade shares.5 A rise in
this index represents an appreciation of the domestic currency. Figure 6 shows time varying
patterns of industry specific exchange rate index for the period 2000-2010. The index both
includes periods of appreciation and depreciation. Further details on the construction of this
index can be found in the Appendix 1.
At macro level, we use domestic GDP with constant prices to reflect domestic demand that
may be considered a substitute for external markets. For the external demand, we used the
weighted average of OECD countries’ GDPs (constant prices), where bilateral trade flows as
4 Echeverry et al. (2003) set the upper and lower bounds of the hedge area as Liability Dollarization (FX to Total Debt) =(3/2)Export to Sales Ratio (EXPS) and LD=(2/3) EXPS, respectively. For the period of 1992 to 2003 using Turkish sectoral data on nonfinancial sectors, in Kesriyeli et al. (2011), the lower and upper bounds of the hedge area are set as LD=(1/2)EXPS and LD=EXPS respectively. 5 We conduct robustness checks using time varying weights and weights calculated based on 2000-2010
average trade shares. The findings do not exhibit significant variation.

14
shares in total trade of Turkey are used as weights and data are from IMF. In addition, we
use Chicago Board of Exchange (CBOE) Volatility Index (VIX index) as measure of macro
volatility.6
Figure 6: Industry Specific Exchange Rate Index
Source: TURKSTAT, IMF International Financial Statistics
To mitigate the impact of outliers on the regression results, we drop 0.1 percentile of firms
both ends of the distributions of labor productivity, leverage ratio and collateral ratio. We
also excluded companies that have missing values and that possess inconsistent values.
Subsequently, we end up with about 24 thousand firm-year observations consisting of 4227
firms belonging to 22 manufacturing industries over the period 2002-2010. We deflate all
the nominal values using the sectoral-level producer price indices (PPI) obtained from the
Turkish Statistical Institute.
We categorize firms into small, medium, and large according to their employment levels.
Firms below 50 average employees during the period are grouped as small firms, firms
between 50 and 250 average employees are labeled as medium-sized firms and the rest of
firms with more than 250 employees are considered as large firms. We also define young
firms as belonging to the lowest 25 percentile of the age distribution, and mature firms as
6 We use various measures of exchange rate volatility namely the conditional variances of GARCH (1.1) for macro and sectoral real exchange rates, average annual standard deviation of percentage change in monthly real effective exchange rates at macro and sectoral levels. Unfortunately, the estimated coefficients for these alternative volatility measures are not significant and stable in terms of signs. Therefore, following the referee’s suggestion, we use VIX index as volatility measure in our analysis.

15
those belonging to the highest 25th percentile. In addition, we classify firms according to
their export shares. We call exporting firms as low exporters, high exporters and medium
exporters if their average export shares are in the lowest the 25 percentile, the highest 25
and those between 25-75 percentile.
Table 1 provides the basic descriptive statistics of the variables used in the empirical
analysis. We provide statistics across different categories based on size, age, the degree of
currency mismatch and export shares and imported input intensity. When we compare
young vs mature firms, small vs. large firms, we find consistent results concerning labor
productivity and sales (Table 1-a and 1-b). Accordingly, larger and mature firms tend to be
more productive and have higher sales.
With regard to currency mismatch categorization, firms under the hell category tend have
lower export shares, higher real sales, and liability dollarization and leverage ratios. They
also hold higher tangible assets (Table 1-c). These firms are highly dollarized and are mostly
selling in the domestic market evidenced by considerable lower export shares. Firms in the
heaven region, are relatively smaller in terms of both employment and real sales, have lower
dollarization and leverage ratios. In terms of exporting, they in general export more than
firms in the hell region but still considerable lower than firms in the hedged area. Firms in
the hedged region have high export shares and they are slightly older than their
counterparts in the heaven and hell regions.
According to Table 1-d, consistent with the empirical literature exporters on average have
higher employment and labor productivity than non-exporters (see, for example, Bernard
and Jensen, 1999 , for the US; and Greenaway and Kneller, 2004 , for the UK). Firms
operating in sectors that use lower imported inputs have higher dollarization rate, export
shares, employment, and lower productivity. On the other hand, there is no
significant variation in collateral ratios, leverage ratios, real sales, and real export values
between firms operating in sectors which have low and high-imported input intensities
(Table 1-e).
We further present the distribution of the export share and dollarization rate in the three
zones of the foreign debt-exports space in Figure 7 (Panel a-c). It appears that firms
belonging to the hedge region both export and carry substantial amount of FX debt. The
descriptive analysis reflects that companies in hedged region possess both high export share
and liability dollarization ratios. Firms in heaven have an export share distribution skewed to
the left ranging between 0 and 1, while the distribution of the dollarization ratio suggest that
they tend to not carry foreign exchange denominated debt as their counterparts in hell and
hedged regions. Firms in the hell region are characterized by low export shares and high
dollarization rates.

16
Table 1-a: Descriptive Statistics - Size Categorization
N Mean Median Sd Min Max
Log of Labour Productivity Small 5755 11.6 11.51 1.0 5 17.0 Medium 12126 11.63 11.54 0.9 7 18.6 Large 6164 11.74 11.61 0.9 7 19.3 Total 24045 11.65 11.55 0.9 5 19.3
Log of Real sales Small 5755 15.12 15.13 1.1 8 19.6 Medium 12126 16.5 16.49 1.0 11 23.6 Large 6164 18.19 18.06 1.2 12 23.8 Total 24045 16.6 16.55 1.5 8 23.8
Log of Real Exports Small 5755 12.78 13.05 2.1 0 18.6 Medium 12126 14.31 14.7 2.1 1 23.2 Large 6164 16.27 16.61 2.2 3 22.0 Total 24045 14.45 14.74 2.5 0 23.2
Export Share (Exports/ Total sales) Small 5755 0.27 0.17 0.3 0 1.0 Medium 12126 0.3 0.22 0.3 0 1.0 Large 6164 0.35 0.3 0.3 0 1.0 Total 24045 0.31 0.22 0.3 0 1.0
Employment Small 5755 32.17 33.6 11.5 3 49.9 Medium 12126 124.74 114.33 54.5 50 248.6 Large 6164 751.23 458.6 1075.9 249 17482.1 Total 24045 263.18 117.27 617.9 3 17482.1
Age Small 5733 21.11 19 8.9 3 110.0 Medium 12068 24.16 22 10.7 3 134.0 Large 6146 28.27 26 12.5 4 122.0 Total 23947 24.48 22 11.1 3 134.0
Dollarization Ratio Small 5755 0.38 0.17 0.4 0 1.0 Medium 12126 0.52 0.65 0.4 0 1.0 Large 6164 0.61 0.81 0.4 0 1.0 Total 24045 0.51 0.64 0.4 0 1.0
Leverage Ratio Small 5755 0.6 0.61 0.3 0 3.2 Medium 12126 0.58 0.59 0.3 0 5.1 Large 6164 0.54 0.53 0.3 0 3.4 Total 24045 0.57 0.58 0.3 0 5.1
Collateral Ratio Small 5755 0.25 0.2 0.2 0 1.0 Medium 12126 0.28 0.26 0.2 0 1.0 Large 6164 0.32 0.3 0.2 0 1.0 Total 24045 0.28 0.26 0.2 0 1.0

17
Table 1-b: Statistics - Age Categorization
N Mean Median Sd Min Max
Log of Labour Productivity Young 6979 11.58 11.48 0.92 4.74 19 Medium age 11144 11.6 11.49 0.95 7.93 17 Mature 5824 11.83 11.75 0.93 6.94 19 Total 23947 11.65 11.55 0.94 4.74 19
Log of Real sales Young 6979 16.22 16.23 1.42 8.18 21 Medium age 11144 16.52 16.48 1.47 8.35 24 Mature 5824 17.23 17.13 1.64 10.25 24 Total 23947 16.61 16.56 1.54 8.18 24
Log of Real Exports Young 6979 13.93 14.24 2.34 0.22 20 Medium age 11144 14.43 14.75 2.44 1.1 22 Mature 5824 15.11 15.34 2.49 1.47 23 Total 23947 14.45 14.74 2.46 0.22 23
Export Share (Exports/ Total sales) Young 6979 0.3 0.2 0.28 0 1 Medium age 11144 0.33 0.24 0.28 0 1 Mature 5824 0.28 0.21 0.24 0 1 Total 23947 0.31 0.22 0.27 0 1
Employment Young 6979 168.64 85 294.54 3 4105 Medium age 11144 222.68 109.43 361.86 4.42 4527 Mature 5824 455.16 187.5 1081.68 5.25 17482 Total 23947 263.47 117.27 618.92 3 17482
Age Young 6979 13.65 14 2.90 3 17 Medium age 11144 23.27 23 3.65 17.08 30 Mature 5824 39.79 37 9.59 30.18 134 Total 23947 24.48 22 11.08 3 134
Dollarization Ratio Young 6979 0.51 0.63 0.41 0 1 Medium age 11144 0.52 0.65 0.41 0 1 Mature 5824 0.5 0.62 0.42 0 1 Total 23947 0.51 0.64 0.41 0 1
Leverage Ratio Young 6979 0.61 0.63 0.24 0.01 5 Medium age 11144 0.57 0.57 0.25 0 5 Mature 5824 0.54 0.52 0.29 0 4 Total 23947 0.57 0.58 0.26 0 5
Collateral Ratio Young 6979 0.28 0.25 0.19 0 1 Medium age 11144 0.28 0.25 0.18 0 1 Mature 5824 0.3 0.27 0.18 0 1 Total 23947 0.28 0.26 0.18 0 1

18
Table 1-c: Descriptive Statistics - Mismatch Categorization
N Mean Median Sd Min Max
Log of Labour Productivity Hell 5863 11.71 11.62 0.94 4.74 16.93 Hedged 13561 11.69 11.57 0.94 7.06 19.29 Heaven 4621 11.47 11.40 0.93 8.21 16.17 Total 24045 11.65 11.55 0.94 4.74 19.29
Log of Real sales Hell 5863 16.79 16.77 1.42 8.18 22.62 Hedged 13561 16.74 16.67 1.53 10.63 23.60 Heaven 4621 15.97 15.87 1.56 8.35 23.82 Total 24045 16.60 16.55 1.54 8.18 23.82
Log of Real Exports Hell 5863 13.37 13.59 2.56 1.10 21.88 Hedged 13561 15.24 15.37 2.03 1.32 23.24 Heaven 4621 13.48 13.68 2.62 0.22 22.00 Total 24045 14.45 14.74 2.46 0.22 23.24
Export Share (Exports/ Total sales) Hell 5863 0.14 0.08 0.16 0.00 0.99 Hedged 13561 0.40 0.34 0.27 0.00 1.00 Heaven 4621 0.26 0.14 0.29 0.00 0.99 Total 24045 0.31 0.22 0.27 0.00 1.00
Employment Hell 5863 252.30 135.43 413.57 4.67 5555.80 Hedged 13561 283.67 127.85 537.08 3.17 7967.27 Heaven 4621 216.86 65.92 958.89 3.00 17482.13 Total 24045 263.18 117.27 617.85 3.00 17482.13
Age Hell 5830 23.67 22.00 10.83 3.00 122.00 Hedged 13521 24.96 23.00 11.06 4.00 93.00 Heaven 4596 24.12 22.00 11.39 3.00 134.00 Total 23947 24.48 22.00 11.08 3.00 134.00
Dollarization Ratio Hell 5863 0.63 0.80 0.37 0.00 1.00 Hedged 13561 0.60 0.76 0.38 0.00 1.00 Heaven 4621 0.09 0.00 0.24 0.00 1.00 Total 24045 0.51 0.64 0.41 0.00 1.00
Leverage Ratio Hell 5863 0.61 0.60 0.28 0.00 3.39 Hedged 13561 0.58 0.59 0.25 0.00 5.13 Heaven 4621 0.51 0.50 0.28 0.00 3.83 Total 24045 0.57 0.58 0.26 0.00 5.13
Collateral Ratio Hell 5863 0.33 0.30 0.20 0.00 0.97 Hedged 13561 0.27 0.25 0.18 0.00 0.99 Heaven 4621 0.26 0.22 0.18 0.00 0.98 Total 24045 0.28 0.26 0.18 0.00 0.99

19
Table 1-d: Descriptive Statistics - Exporter Categorization
N Mean Median Sd Min Max
Log of Labour Productivity
Non-exporter 2934 11.46 11.45 1.14 5.03 16.86
Low - Exporter 2014 11.78 11.74 0.98 7.75 16.64
Med. - Exporter 14236 11.68 11.58 0.93 4.74 16.93
High - Exporter 7795 11.56 11.44 0.94 6.84 19.29
Log of Real sales
Non-exporter 2934 14.96 15.00 1.63 5.25 20.46
Low - Exporter 2014 16.45 16.39 1.57 12.19 22.41
Med. - Exporter 14236 16.6 16.55 1.56 8.18 23.82
High - Exporter 7795 16.64 16.59 1.51 10.2 23.6
Employment
Non-exporter 2934 64.07 28 164.64 0.86 1852
Low - Exporter 2014 221 77 729 3 10726
Med. - Exporter 14236 250 113 659 3 17482
High - Exporter 7795 299 141 495 5 5245
Age
Non-exporter 2906 21.43 18 10.24 5 77
Low - Exporter 2002 23 21 11 4 134
Med. - Exporter 14173 25 23 11 3 122
High - Exporter 7772 24 22 10 3 110
Dollarization Ratio
Non-exporter 2934 0.09 0 0.25 0 1
Low - Exporter 2014 0.28 0 0.38 0 1
Med. - Exporter 14236 0.46 0.5 0.4 0 1
High - Exporter 7795 0.66 0.86 0.38 0 1
Leverage Ratio
Non-exporter 2934 0.59 0.6 0.3 0 3.81
Low - Exporter 2014 0.54 0.54 0.25 0.01 1.92
Med. - Exporter 14236 0.57 0.57 0.27 0 4.67
High - Exporter 7795 0.59 0.6 0.25 0 5.13
Collateral Ratio
Non-exporter 2934 0.28 0.24 0.21 0 0.99
Low - Exporter 2014 0.3 0.28 0.19 0 0.97
Med. - Exporter 14236 0.28 0.26 0.18 0 0.97
High - Exporter 7795 0.28 0.25 0.19 0 0.99

20
Table 1-e: Descriptive Statistics – Imported Input Intensity (III)
N Mean Median Sd Min Max
Log of Labour Productivity
High III 9485 11.74 11.64 0.96 6.94 19.29
Low III 14560 11.59 11.5 0.93 4.74 16.34
Log of Real sales
High III 9485 16.64 16.54 1.66 8.35 23.82
Low III 14560 16.58 16.56 1.46 8.18 22.41
Employment
High III 9485 247.58 109.43 551.77 3 6796
Low III 14560 273.35 125 657.14 3 17482
Age
High III 9464 25.42 24 11.04 3 110
Low III 14483 23.87 22 11.07 3 134
Dollarization Ratio
High III 9485 0.46 0.49 0.4 0 1
Low III 14560 0.54 0.72 0.41 0 1
Leverage Ratio
High III 9485 0.56 0.57 0.25 0 3.5
Low III 14560 0.58 0.58 0.27 0 5.13
Collateral Ratio
High III 9485 0.28 0.26 0.18 0 0.97
Low III 14560 0.28 0.26 0.19 0 0.99
V. Model and Estimation Results
In our empirical specifications described below, we test the relative importance of different
above-mentioned channels through which exchange rate variations may affect exports.
These channels are often classified as competitiveness, the cost of production and the
balance sheets. We start empirical tests with baseline specification and then extent the
empirical model by introducing interaction terms representing firm characteristics.
V.1. Baseline Specification
We construct an econometric model to investigate the determinants of export volume of
manufacturing firms (intensive margin). 7 Our baseline model is standard where the
logarithm of firm level export volumes are explained by sectoral logarithm (log) of real
exchange rates (both level and change), VIX index as a measure of macro volatility, domestic
output and foreign demand as well as firm specific variables. That is, we utilize variables
that allow us to control for macro, sectoral, and firm level dynamics. More specifically, we
use the following baseline specification to quantify the impact of exchange rate movements
on firm level exports.
7 Although firms in the sample carry out a significant portion of economic activity, firms’ responses are on voluntary basis therefore our data is not convenient for testing extensive margin of trade.

21
Figure 7: Mean Dollarization Ratio vs. Export Ratio
(a) (b) (c)

22
ln(𝑋𝑖𝑡) = 𝛼1ln(𝑅𝐸𝑅𝑗𝑡) + 𝛼2𝑉𝑂𝐿𝑡 + 𝛼3𝑍𝑖𝑡 + 𝛼7𝑙𝑛(𝐺𝐷𝑃𝑡𝐷) + 𝛼8𝑙𝑛(𝐺𝐷𝑃𝑡
𝐹) + 𝜏𝜇𝑖 + 𝜀𝑖𝑡 (1)
where 𝑖 indexes firms, 𝑡 shows time (years), 𝑗 is the industry to which firm 𝑖 belongs to, Xit is
firm level real exports, 𝑅𝐸𝑅𝑗𝑡 stands for industry-specific pre-period trade weighted real
exchange rate (a rise in this index represents a real appreciation of the domestic currency),
𝑉𝑂𝐿𝑡 is time varying VIX index, 𝑍𝑖𝑡 is a vector of firm-specific variables including labor
productivity, log of real sales, liability dollarization ratio (the ratio of FX denominated debt to
total debt), collateral ratio leverage ratio, 𝑙𝑛(𝐺𝐷𝑃𝑡𝐷) and𝑙𝑛(𝐺𝐷𝑃𝑡
𝐹) are logs of domestic
income and export weighted foreign income, respectively, 𝜇𝑖 shows non-time-varying firm-
specific idiosyncrasies and 𝜀𝑖𝑡 is the error term of the regression.
We start our analysis firstly by employing fixed effect regressions. Estimation results for the
baseline specification using fixed effects are presented in Table 2. For the sake of
robustness, we report alternative specifications using the levels and changes in logs of real
exchange rates and labor productivity. Under fixed effects model, we also report the findings
with and without firm size variable (the log of sales, lrsale) to show the potential
multicollinearity and to stress the need for a better estimation technique. Consequently, we
report our findings based on eight alternative specifications.
Our estimation results from fixed effects model which does not include firm size suggest that
real appreciation of Turkish lira (a rise in log of RERjt or change in the log of RERjt) has a
negative and significant impact on the log of real exports in most specifications. The
coefficient of the change in log of real exchange rate is estimated to be smaller in absolute
term than the coefficients of the log of real exchange rate. That is, a ten percent (or
percentage point for the change) rise in real exchange rates (appreciation) reduces export
volume over 6 percent (or about 4 percent) in specifications where size variable is not used
as regressor. Consistent with the literature, the coefficients of both the log level of labor
productivity (LPit) and the change in the log level are estimated to be positive and significant
when the size variable is not included as an explanatory variable. That is, more productive
labor usage would support the competiveness of the firm in the export markets and
contribute to the export performance.
We estimate that coefficients of liability dollarization ratio (Dolratioit) are positive and
significant and verify that having access to foreign finance supports exports performance.
These coefficients are estimated to be smaller when the size variable is included as
regressor. The coefficients of collateral ratio (Collateralit) are estimated to be negative and
significant and they are smaller in absolute term when the size variable is included. We
document generally negative coefficients for the leverage ratio (Leverageit) and they are
significant only when size variable is included. We estimate negative and significant
coefficients for the export-weighted logarithms of foreign income (𝑙𝑛 𝐺𝐷𝑃𝑡𝐹) when size
variable is included while they appear insignificant (and mostly positive) when it is not
included. On the other hand, the coefficients of the logarithms of domestic income

23
(ln 𝐺𝐷𝑃𝑡𝐷) are generally positive and significant only when size variable is used as regressor.
Lastly, contrary to expectations, the coefficients of VIX index as measure of volatility are
estimated to be mostly positive and significant when size variable is used as regressor.
Estimation results change significantly when the size variable is added as explanatory
variable. For example, the coefficients of the change in real exchange rate are estimated to
be smaller and insignificant, the coefficients of labor productivity become negative when the
size variable is introduced as explanatory variable and coefficients of volatility and foreign
income are not in line with the expectations. This may suggest that fixed effects model fails
to control the potential endogeneity and dynamic aspects; therefore it is not a good
candidate for estimation. Findings from fixed effects model also show that the log of real
sales is an important variable statistically. That is, the coefficient of determination of the
regression (R2) increases from 2-6 percent to 21 percent when it is included as regressor. The
firm size is not only important statistically but also theoretically in explaining exports
(Bernard and Jensen, 1995, 1999; Wagner, 2001; Greenaway and Kneller; 2004) Findings
seem to be more consistent with theory when the size variable is included as regressor.
In order to cope with these issues in the remainder of our analysis we use a dynamic panel
framework where difference GMM estimations are carried out. The difference GMM
estimation introduces the lag(s) of dependent variable to control for potential dynamic
effects and uses the lags of dependent and explanatory variables as instruments to tackle
potential endogeneity problem. Estimation results for the baseline specification using GMM
are presented in Table 3 across four alternative specifications.
We use the first lag of dependent variable as a regressor to control for the inertia in real
exports and use its third lag as instrument variable in all GMM regressions. In addition, we
treat liability dollarization ratio, labor productivity (change and its level), and log of real sales
as endogenous variables given their endogenous relationships with employment and real
sales and we use their up to three lagged values as the GMM-type instruments. Similarly,
depending on specification used macro variables and sectoral real exchange rates (change
and its level) are employed as standard differenced instruments. We report the Sargan test
of over-identification to test for the validity of our instruments. Estimations results are from
the one-step GMM procedure while the Sargan and autocorrelation tests, which are
obtained from the two-step procedure.8 Second order autocorrelation tests (arm2) do not
reject the hypothesis of no serial correlation in the error terms for almost all regressions.
Similarly, the Sargan tests do not reject the hypothesis of the validity of over-identifying
restrictions almost in all regressions suggesting that instruments are valid.
8 We use two-step results because only for a homoskedastic error term the Sargan test has an asymptotic chi-
squared distribution. Arellano and Bond (1991) show that the one-step Sargan test overrejects in the presence of heteroskedasticity. As an alternative, we perform the Sargan test after the two-step estimator.

24
Table 2: Baseline Specification: Estimation Results for Fixed Effects Model
Standard errors in parentheses, *** <0.01, ** p<0.05, * p<0.1
(1) (2) (3) (4) (5) (6) (7) (8)
ln(RERjt) -0.623*** -0.370** -0.721*** -0.293* - - - -
(0.184) (0.168) (0.194) (0.174)
ln(RERjt)) - - - - -0.358*** -0.0145 -0.437*** -0.0245
(0.126) (0.115) (0.130) (0.117)
ln(LPit) 0.495*** -0.0617*** - - 0.494*** -0.0616*** - -
(0.0171) (0.0180)
(0.0171) (0.0180)
ln(LPit)) - - 0.214*** -0.0137 - - 0.213*** -0.0137
(0.0155) (0.0143)
(0.0155) (0.0143)
ln(lrsaleit) - 1.168*** - 1.153*** - 1.169*** - 1.154***
(0.0187)
(0.0177)
(0.0187)
(0.0177)
Dolratioit 0.430*** 0.255*** 0.443*** 0.259*** 0.426*** 0.252*** 0.440*** 0.257***
(0.0302) (0.0277) (0.0323) (0.0292) (0.0301) (0.0277) (0.0323) (0.0292)
Collateralit -0.443*** -0.285*** -0.617*** -0.252*** -0.460*** -0.289*** -0.634*** -0.254***
(0.0813) (0.0743) (0.0862) (0.0778) (0.0813) (0.0744) (0.0863) (0.0779)
Leverageit 0.00703 -0.113** -0.0272 -0.111** 0.0163 -0.111** -0.0160 -0.110**
(0.0514) (0.0471) (0.0540) (0.0486) (0.0515) (0.0471) (0.0540) (0.0486)
ln(𝐺𝐷𝑃𝑡𝐹) -0.0700 -3.132** 1.167 -3.023** 0.668 -2.896** 2.144 -2.797**
(1.452) (1.328) (1.486) (1.339) (1.453) (1.330) (1.487) (1.340)
ln(𝐺𝐷𝑃𝑡𝐷) 0.970 1.676** 0.348 1.552** -0.0109 1.243* -0.844 1.192*
(0.784) (0.717) (0.805) (0.725) (0.761) (0.696) (0.780) (0.703)
VIXt -0.00134 0.00941*** -0.00243 0.00879*** -0.00252 0.00946*** -0.00418 0.00871***
(0.00261) (0.00239) (0.00268) (0.00242) (0.00265) (0.00243) (0.00274) (0.00247)
Constant 0.724 -6.564*** 8.132*** -6.501*** 5.530*** -4.481*** 13.74*** -4.848***
(2.011) (1.842) (2.067) (1.873) (1.805) (1.658) (1.860) (1.698)
Observations 24,045 24,045 22,162 22,162 24,045 24,045 22,162 22,162 Number of firms 4,227 4,227 4,151 4,151 4,227 4,227 4,151 4,151 R-squared 0.056 0.212 0.026 0.212 0.056 0.211 0.026 0.211

25
Findings from difference GMM estimation are generally in line with those from fixed effects
estimations with some important differences. The GMM estimation enables us to test the inertia in
exports or its dynamic aspect. The coefficients of lag dependent variable are estimated to be
positive and statistically significant across all specifications suggesting that real export variable has
an inertia and its coefficient is estimated around 0.25, i.e. a ten percent rise in the previous year’s
exports adds about 2.5 percent to current real exports.
Estimation results suggest that real appreciation of domestic currency (a rise in lnRERjt)) has a
negative impact on exports. That is, a ten percentage point rise in real exchange rates (appreciation)
reduces export volume by around 3 percent. Contrary to coefficients in fixed effect model, the
coefficients of the real exchange rate do not change significantly when the log of RERjt is used
instead of the change in the log of RERjt. In other words, the real exchange rate elasticity of exports
is estimated to be around 3 percent in all specifications of the baseline model.
We estimate that firm size has positive impact on exports. The coefficients of lrsale are significant
and larger than unity in specifications where the log of labor productivity is used as regressors. This
suggests that firms’ exports increase faster than their total sales as sales rise. This finding is
consistent with literature, exporting activity incurs a sunk-cost and this cost is less important for
larger firms thus they are expected to enter the export markets more easily. We use the log of labor
productivity as explanatory variables as the literature suggests. As described under findings of fixed
effects models, the coefficients of this variable are estimated to be positive and significant in the
specification without lrsale. When lrsale is introduced coefficients turns to be insignificant. Under
difference GMM, we get similar results. In order to address the potential multi-collinearity between
lrsale and llabprod we report the findings with both level and change in log of labor productivity.
We estimate positive and significant coefficients for change in log of labor productivity (dllabprod)
suggesting that a ten percentage point rise in labor productivity lead to a rise in export around 3-5
percent. These results are in line with the empirical evidence and theoretical predictions
documenting that more productive firms tend to export more than less productive firms (Melitz,
2003).
Liability dollarization ratio is used to control for several factors: (i) access to foreign finance which is
evidently to be cheap and mutes financial constraints, (ii) an instrument of hedging mechanism (iii)
the extent of FX-denominated liability exposure or currency mismatch. The first two channels may
suggest a positive coefficient for this variable while the last channel suggests a negative coefficient
especially when domestic currency depreciates to a large extent. Cheap FX-denominated debt with
better terms compared to domestic currency denominated debt is apparently supportive for
exports. However, one may expect a potential endogeneity between foreign exchange loans and
exports as a firm starting to export is more likely to have access to these loans. This deserves
further research and we do not go into detail in this paper.9 The estimation results usually suggest a
9 Until mid-2009, only firms that have FX revenues could borrow in FX. Therefore, we believed that the assumption that having access to FX loans supports exports is reasonable one.

26
positive and significant association between liability dollarization ratio and export volume. The last
channel as an element of production cost and balance sheet effects, suggests that large share of FX
debt may not be supportive for exports in case of currency depreciation. We will test these
channels in the next section.
We use the leverage ratio and collateral ratio as explanatory variables in order to control the
financial health or capital of firms. Estimations suggest no statistically significant link between
leverage ratio and exports. We estimate often insignificant coefficients for collateral ratio except in
one specification (Table 3 in column 3) where we have negative and significant coefficient, implying
that as the share of tangible assets rises, firm’s exports declines. Data shows that exports of firms in
the lowest 25 percentile in terms of collateral ratio grew faster than exports of firms in the 75
percentile. Contrary to this findings, empirical literature document that industries with more
tangible assets enjoy easier access to outside capital because firms can pledge more collateral
(Braun, 2003; Claessens and Laeven, 2003; Manova,2015). Literature also documents that export
starters have a significant ex-ante financial advantage, compared to non-exporters (Bellone et al.
2010; Muuls, 2012). That is, firm capital is more vital for the new exporter starters. However, even
though better financial health has been associated with increasing export market participation (the
extensive margin of trade) it does not necessarily increases intensive margin (Berman and
Hericourt, 2010; Muuls, 2008) which is in line with the existence of large sunk costs which have to
be paid to access the export market for the first time. Manova (2013) and Hur et al. (2006) find that
in economies with higher levels of financial development, exports of vulnerable industries with
fewer tangible assets grow faster. Therefore our finding on the impact of tangibility on intensive
margin do not contradict fully with the empirical findings given the fact that recent improvement in
conditions of accessing to credits by Turkish exporters and new incentives supporting exports might
have increased the export performance of firms with lower collateral ratios.
For the macro variables, we use time varying VIX index as a regressor. In line with expectation and
contrary to findings in fixed effect estimations, coefficients of this variable are estimated to be
negative and significant in specifications where the log change of labor productivity while they are
mostly negative and significant in the extended model estimations. In addition, we use 𝑙𝑛(𝐺𝐷𝑃𝑡𝐹) to
control for foreign demand and we estimate positive as expected but not always significant
coefficients for this variable. We also use domestic demand, 𝑙𝑛(𝐺𝐷𝑃𝑡𝐷), to control for potential
substitution between domestic sales and exports. We estimate negative and significant coefficients
for this variable, implying a substitution between domestic sales and exports. Anecdotal evidence
for Turkish manufacturing suggests that firms substitute exports for domestic sales in the periods of
weak domestic activity. This evidence is supported by Şahinbeyoğlu and Ulaşan (1999) that estimate
a negative association between exports and domestic income. Parallel with our findings, empirical
studies carried out for EU countries suggest a strong substitution between domestic sales and
exports in the short run especially when domestic demand is weak (Bobeica, Esteves, Rua and
Staehr, 2015), and economies are highly diversified in exporting or activities are less concentrated
(Esteves and Prades, 2016).

27
Table 3: Baseline Specification: Estimations with Difference GMM Model
(1) (2) (3) (4)
lrexpi,t-1 0.198*** 0.254*** 0.230*** 0.254***
(0.0328) (0.0387) (0.0346) (0.0374)
ln(RERjt) -0.319** -0.276* - -
(0.154) (0.164)
ln(RERjt)) - - -0.340*** -0.230***
(0.0714) (0.0733)
ln(LPit) 0.160 - -0.202 -
(0.163) (0.186)
ln(LPit)) - 0.530*** - 0.338**
(0.135) (0.152)
ln(lrsaleit) 1.088*** 0.824*** 1.117*** 0.878***
(0.127) (0.148) (0.130) (0.142)
Dolratioit 0.424** 0.323 0.525*** 0.412**
(0.189) (0.215) (0.193) (0.208)
Collateralit -1.026 0.361 -2.155** -0.501
(0.973) (1.251) (1.021) (1.219)
Leverageit 0.218 0.739 0.260 0.584
(0.502) (0.650) (0.517) (0.630)
ln(𝐺𝐷𝑃𝑡𝐹) 1.489 3.735*** 0.501 2.360
(1.160) (1.414) (1.222) (1.450)
ln(𝐺𝐷𝑃𝑡𝐷) -1.488** -2.620*** -1.294** -2.173***
(0.608) (0.722) (0.607) (0.710)
VIXt -0.004 -0.007** -0.003 -0.006**
(0.003) (0.003) (0.003) (0.003)
Constant 2.918 9.579*** 7.618*** 9.304***
(2.701) (2.853) (2.887) (2.700)
Observations 20,969 20,908 20,969 20,908
Number of firms 3,855 3,847 3,855 3,847
Sargan (P-value) 0.0172 0.553 0.399 0.670 arm2 (p-value) 0.0704 0.954 0.313 0.672
arm1 (p-value) 0 0 0 0
Standard errors in parentheses. *** p<0.01, ** p<0.05, * p<0.1
V.2. The Extended Specification
We extend the baseline specification by introducing dummy variables interacted with industry-
specific real exchange rate (both level and change) to examine the sensitivity of exports to sectoral
real exchange rates across various firm characteristics.10. We construct dummy variables reflecting
the imported input intensity, the degree of liability of dollarization, the degree of currency
mismatch, the firm size, and the firm age. We interact these dummy variables with the real
exchange rate to test how the sensitivity of real exports to the real exchange rate alters across
these characteristics. The model that includes the interaction terms mentioned above (the
10 In our analysis we consider both the level of trade-weighted real exchange rate and its change from year t - 1 to year t. In our estimation tables we do not report findings where the change in log of labor productivity is used as a regressor for the sake of avoiding duplications.

28
extended specification) is given in equation (2) below and is estimated by using the difference GMM
estimation technique.
ln(𝑋𝑖𝑡) = 𝛼1∆ln(𝑅𝐸𝑅𝑗𝑡) + 𝛼2𝑉𝑂𝐿𝑡 + 𝛼3𝑍𝑖𝑡 + 𝛼7ln(𝐺𝐷𝑃𝑡𝐷) + 𝛼8ln(𝐺𝐷𝑃𝑡
𝐹) +
𝛼9(𝐹𝐶𝐷 × ∆ln(𝑅𝐸𝑅𝑗𝑡)) + 𝜏𝜇𝑖 + 𝜀𝑖𝑡 (2)
where FCD is a dummy variable reflecting firm characteristics and sets equal to “1” for firms that
have specific characteristics mentioned above and “0” otherwise. We report and discuss findings
concerning these interaction terms and provide details on how these dummies are constructed
under the relevant sub-sections below, respectively.
V.2.1 Imported Inputs
Campa and Goldberg (1997) and Greenaway, Kneller and Zhang (2010) find evidence that the
impact of real exchange rate on exports is muted to some extent by the usage of imported
intermediate inputs in the domestic production. We follow similar path to test the impact of real
exchange rate on firm level export volume in Turkey. Evidence suggests that domestic
manufacturing production is highly exposed to imported inputs in Turkey. Saygılı et al (2010)
estimated that about 55 percent of total intermediate inputs are made up of imported inputs and it
has been rising over the period of our study. In addition, there is widespread foreign exchange
denominated pricing in domestic economy including in housing, manufacturing, tourism sectors and
especially commodities. For example, rents in shopping centers, commodity prices in manufacturing
are often in terms of FX. Therefore, due to high content of FX-denominated cost in domestic
activity, the exchange rate pass through to CPI inflation is estimated to be very high compared to
other countries. Based on this background, the competitive impact of currency depreciation on
export volume in Turkey might be muted by the degree of foreign exchange exposures through the
cost of production channel.
We construct a dummy variable based on sectoral imported inputs intensity following Saygılı et al.
(2010) which reports sectoral imported input intensity ratio based on 2002 Input-Output Table. We
define the sector in which firms are classified as high imported input intensity if this ratio is larger
than 0.29 (IMj is equal to “1”, otherwise it is “0”) which is the median ratio of the imported input
intensities for two digit manufacturing industries in our analysis. In this context, the first dummy
variable is based on sectoral imported inputs intensity. We test the cost of production channel by
using the interaction term between the real exchange rate variable and imported intensity dummy
(IMj) as regressor. We expect the coefficient of interaction terms between the sectoral exchange
rate variable and the imported input intensity dummy to be positive. That is, the exports of
manufacturing firms with high imported inputs in their production are expected to be less sensitive
to real exchange rate (the sum of interaction term and the log real exchange rate is smaller in
absolute term). In other words, a depreciation of the domestic currency is expected to raise
production costs of companies that rely on imported inputs or FX denominated inputs and thus
reduce the sensitivity of exports to the real exchange rate.

29
Table 4 provides the estimation results in which interaction terms of the level and change the log of
real exchange rate with IMj are used as explanatory variable, respectively. In line with expectations,
estimations show that the coefficients of these interaction terms are positive but it is statistically
significant only for the interaction term with the log of real exchange rate. This suggests that
exports of firms belonging to sectors with high imported inputs intensity are less sensitive to level
real exchange rate. That is, imported inputs as an item of production cost may mute the impact of
the competitiveness channel of the real exchange rate, i.e. the sums of coefficients of interaction
terms and real exchange rate variables are smaller in absolute value. Moreover, the estimated
coefficients of other variables are generally in line with those in the baseline model.
Table 4: Extended Specification with Imported Inputs:
Estimations with Difference GMM Model (1) (2)
lrexpi,t-1 0.252*** 0.253***
(0.0386) (0.0375)
ln(RERjt) -0.392** -
(0.185)
ln(RERjt)) - -0.270***
(0.104)
ln(RERjt)*IMj 0.344* -
(0.202)
ln(RERjt))*IMj - 0.0989
(0.147)
ln(LPit)) 0.531*** 0.330**
(0.135) (0.158)
ln(lrsaleit) 0.829*** 0.882***
(0.147) (0.143)
Dolratioit 0.297 0.410**
(0.215) (0.208)
Collateralit 0.317 -0.530
(1.245) (1.218)
Leverageit 0.717 0.577
(0.648) (0.628)
ln(𝐺𝐷𝑃𝑡𝐹) 3.664*** 2.305
(1.406) (1.457)
ln(𝐺𝐷𝑃𝑡𝐷) -2.598*** -2.145***
(0.720) (0.714)
VIXt -0.007** -0.006**
(0.003) (0.003)
Constant 9.571*** 9.204***
(2.854) (2.722)
Observations 20,908 20,908
Number of firms 3,847 3,847
Sargan (P-value) 0.534 0.666
arm2 (p-value) 0.955 0.670
arm1 (p-value) 0 0
Standard errors in parentheses. *** p<0.01, ** p<0.05, * p<0.1

30
V.2.2 Liability Dollarization
In the analysis, we also control for foreign exchange exposures in the form of foreign exchange
liabilities, which is an important cost item in terms of FX especially during large currency
depreciations. On the other hand, foreign exchange liabilities are instruments in muting financial
constraints and thus supporting economic activity of manufacturing sector in Turkey (Alp and Yalçın,
2015). After 2001 crisis, liability dollarization ratio in Turkey decreased from 85 percent in 2001 to
65 percent in 2010 in parallel to the declining inflation rate, structural reforms, and the newly
adopted flexible exchange rate system. Although the average liability dollarization ratio of non-
financial firms in Turkey (the ratio of FX liabilities to total liabilities) has been declined following the
crisis, it is well above that of firms in peer countries (Özmen and Yalçın, 2007; Hülagü and Yalçın,
2014, IMF 2015).
It would be informative to know how exports of firms with different degree of dollarization ratios
are affected by exchange rate fluctuations. The empirical findings document mixed evidence on the
impact of balance sheet effects on firm or aggregate level performance measures. If firms have net
foreign exchange debt on their balance sheets, real exchange rate depreciations may negatively
affect the level of exports through raising financial expenditure and reducing the net worth of firms
(currency mismatch), the balance sheet channel. On the other hand, if firms are able to match their
foreign exchange debts with their FX-denominated revenues or assets, the impact of exchange rate
depreciation may be muted. In order to assess the balance sheet effect, we construct three
different dummies reflecting the degree of liability dollarization for the possibility of nonlinear
relation between exports and dollarization ratio and its interaction with real exchange rates. For
robustness checks, we alternatively construct interaction terms using continuous dollarization ratio.
We construct three firm-specific dummies based on the period average of liability dollarization
ratios. The first dummy (LDOLDi) is equal to “1” if firms’ period average dollarization ratios are in
the lower 25 percentile of the distribution and “0” otherwise. The second dummy (HDOLDi) is equal
to “1” if firms’ period average dollarization ratios are in the upper 25 percentile of the distribution
and “0” otherwise. A positive coefficient for the interaction term with high dollarization dummy
(HDOLDi) may imply that the depreciation of the real exchange rate might have negative impact on
exports due to currency mismatch binding through production cost and balance sheets channels.
On the other hand, a negative coefficient may imply that these channels may not be binding and
competitiveness channel dominates. That is, high dollarization supports economic activity including
exports through muting financial constraints as forwarded by Alp and Yalçın (2015).
We estimate the model given in equation (2). In this case interaction terms are constructed based
on liability dollarization dummies instead of import intensity dummy. The findings are reported in
Table 5. We estimate mostly positive but insignificant coefficients for the interaction terms in the
specifications where the log of real exchange rates are used as regressor for high and low
dollarization firms. We compare the absolute size of the sums of coefficients of the log of real
exchange rate and respective interaction terms in the first and the third columns, and in the second
and forth columns. We find that exports by firms with high dollarization ratios are slightly more

31
sensitive to the exchange rate than exports by firms with low dollarization. This result is somewhat
different from Cheung and Sengupta (2013) which report insignificant effects of FX debt on firms’
exports-to-sales ratios. The insignificant relationship between FX debt and exports does not seem
surprising as India is a country where liability dollarization is fairly limited.
Our findings hardly supports the idea that liability dollarization may reduce the sensitivity of exports
to the real exchange rates and thus mute the competitiveness channel of the currency depreciation
as estimated coefficients for the interaction terms are not statistically significant. Although our
results supports the idea that the ability to borrow in FX may increase exporting activity through
muting financial constraints, the insignificant coefficients reported for interaction terms blurs the
picture. The liability dollarization per se is not a good proxy for currency mismatch as we are only
considering firm-level measure for foreign exchange denominated debts without taking into
account firm-level foreign exchange denominated assets. To deepen our analysis further, we will
introduce a firm-level proxy for currency mismatch in the next section below.
V.2.3 Currency Mismatch: Firms in Hell, Heaven or Hedged Regions
We extend our analysis by introducing a better firm-level proxy for currency mismatch, calculated
by taking the period averages of the ratio of FX-denominated debt to exports (MISMATCHi). The
numerator represents liabilities while the denominator represents revenues thus larger MISMATCHi
implies higher degree of currency mismatch. Although the ideal way of calculating a proxy for the
currency mismatch is to consider also FX-denominated assets and FX indexed domestic sales, due to
lack of data we use only exports in the denominator of the ratio. We think this proxy is biased
upward as the denominator may be larger than the actual export figures. We use the period
average of MISMATCHi and classify firms into three groups and named them “heaven”, “hedged”
and “hell” inspired by Echeverry et al. (2003). The first group is reflected by a dummy that
represents firms in the lower 25 percentile of average MISMATCHi, “heaven”. The second group is
made up of firms in the upper 25 percentile of average MISMATCHi, “hell”. The last group
represents the rest of the firms, “hedged”. We use interaction terms of these three dummies with
levels and change in log real exchange rate and run regression for the model given in equation (2).
We expect the export sensitivity of hedged firms to the real exchange rate be small, that is, the
coefficient of the interaction term of hedged firms is expected to be positive. We expect an
insignificant coefficient for the interaction term for the firms belonging to the heaven region as the
mismatch is not a problem for these firms and thus the impact through cost of production and
balance sheets channels are muted. However, it is not straightforward to guess the expected sign of
the coefficient for interaction term for the firms belonging to the hell region. Counteracting
channels may determine the sign of this coefficient. A depreciation of the domestic currency may
hit the firms’ overall economic activity negatively including exports through cost of production and
balance sheet channels when currency mismatch exists to a great extent. Therefore, we may expect
a positive sign for the coefficient of the interaction term. On the contrary, we may expect a negative
sign for the coefficient of the interaction term when the competitiveness channel dominates.

32
Table 5: Extended Specification with Liability Dollarization Degree: Estimations with Difference GMM Model
(1) (2) (3) (4)
lrexpi,t-1 0.259*** 0.253*** 0.251*** 0.253***
(0.039) (0.037) (0.040) (0.037)
ln(RERjt) -0.334* - -0.301* -
(0.179)
(0.166)
ln(RERjt)) - -0.180** - -0.249***
(0.077)
(0.078) ln(RERjt)*HDOLDi 0.153 - - -
(0.183)
ln(RERjt))*HDOLDi - -0.179 - -
(0.146) ln(RERjt)*LDOLDi -
0.328 -
(0.296) ln(RERjt))*LDOLDi - - - 0.131
(0.207)
ln(LPit)) 0.548*** 0.288* 0.508*** 0.314**
(0.138) (0.170) (0.134) (0.153)
ln(lrsaleit) 0.819*** 0.889*** 0.836*** 0.885***
(0.148) (0.143) (0.147) (0.143)
Dolratioit 0.366* 0.373* 0.243 0.404**
(0.222) (0.204) (0.202) (0.202)
Collateralit 0.380 -0.434 0.503 -0.508
(1.259) (1.205) (1.250) (1.210)
Leverageit 0.754 0.635 0.805 0.588
(0.654) (0.623) (0.655) (0.619)
ln(𝐺𝐷𝑃𝑡𝐹) 3.798*** 2.260 3.686*** 2.292
(1.424) (1.455) (1.417) (1.454)
ln(𝐺𝐷𝑃𝑡𝐷) -2.648*** -2.116*** -2.594*** -2.138***
(0.727) (0.713) (0.722) (0.711)
VIXt -0.007** -0.006** -0.007** -0.006**
(0.003) (0.003) (0.003) (0.003)
Constant 9.619*** 8.945*** 9.277*** 9.139*** (2.870) (2.725) (2.826) (2.675)
Observations 20,908 20,908 20,908 20,908 Number of firms 3,847 3,847 3,847 3,847 Sargan (P-value) 0.594 0.647 0.379 0.609 arm2 (p-value) 0.902 0.625 0.753 0.456 arm1 (p-value) 0 0 0 0
Standard errors in parentheses. *** p<0.01, ** p<0.05, * p<0.1
Findings from estimations are often in line with these expectations. We estimate insignificant
coefficients for the interaction terms with heaven firms dummy (Table 6). That is, the exports of
these firms are unlikely to be sensitive to real exchange rates. On the other side of the distribution,
however, we estimate significant and negative signs for the interaction terms of firms in the hell
region. In this case, firms seem to be more sensitive to the real exchange rate fluctuations. This
finding is interesting as it suggests that exports of firms with high currency mismatch are more
sensitive to the change in real exchange rate thus a depreciation of domestic currency is favorable
for the exports of these firms. Contrary to our expectation, the cost of production and the balance
sheets channels seem to be not binding when domestic currency depreciates implying that
competitiveness channel dominates. This finding supports the idea that firms with high FX debt

33
relative to their exports are somehow able to sustain their export performance with a depreciation
of the domestic currency. We discover that these firms seem to be largely domestic oriented (14
percent export share, compared to 40 and 26 percent for firms in the hedged and heaven regions,
respectively) and they have relatively lower imported inputs which may be a potential explanation
for the strong sensitivity of their exports to the real exchange rates.
Table 6: Extended Specification with Natural Hedge Position: Estimations with Difference GMM Model
(1) (2) (3) (4) (5) (6)
lrexpi,t-1 0.256*** 0.253*** 0.273*** 0.260*** 0.272*** 0.261***
(0.0392) (0.0374) (0.0386) (0.0380) (0.0381) (0.0374)
ln(RERjt) -0.274 - -0.680***
-0.0747 -
(0.167)
(0.201)
(0.173)
ln(RERjt)) - -0.245*** - -0.450*** - -0.107
(0.0799)
(0.101)
(0.0846) ln(RERjt)*HEAVENi 0.00248 - - - - -
(0.231)
ln(RERjt)*HEAVENi - 0.0742 - - - -
(0.164) ln(RERjt)*HEDGEDi - - 0.639*** - - -
(0.185) ln(RERjt)*HEDGEDi - - - 0.384*** - -
(0.132) ln(RERjt)*HELLi - - - - -0.845*** -
(0.234) ln(RERjt)*HELLi - - - - - -0.552***
(0.156)
ln(LPit)) 0.526*** 0.326** 0.556*** 0.417*** 0.518*** 0.345**
(0.135) (0.153) (0.136) (0.161) (0.136) (0.153)
ln(lrsaleit) 0.824*** 0.883*** 0.812*** 0.854*** 0.837*** 0.872***
(0.149) (0.143) (0.149) (0.144) (0.150) (0.143)
Dolratioit 0.297 0.415** 0.386* 0.446** 0.209 0.408**
(0.209) (0.204) (0.221) (0.211) (0.210) (0.208)
Collateralit 0.468 -0.548 0.353 -0.523 0.548 -0.528
(1.258) (1.214) (1.269) (1.236) (1.273) (1.221)
Leverageit 0.803 0.557 0.779 0.546 0.841 0.558
(0.659) (0.624) (0.656) (0.639) (0.663) (0.631)
ln(𝐺𝐷𝑃𝑡𝐹) 3.765*** 2.313 3.872*** 2.579* 3.793*** 2.418*
(1.422) (1.452) (1.427) (1.471) (1.428) (1.453)
ln(𝐺𝐷𝑃𝑡𝐷) -2.632*** -2.152*** -2.692*** -2.290*** -2.675*** -2.211***
(0.725) (0.710) (0.729) (0.721) (0.726) (0.711)
VIXt -0.007** -0.007** -0.008** -0.006** -0.008** -0.006**
(0.003) (0.003) (0.003) (0.003) (0.003) (0.003)
Constant 9.493*** 9.252*** 9.751*** 9.908*** 9.380*** 9.476*** (2.850) (2.688) (2.890) (2.750) (2.863) (2.710)
Observations 20,908 20,908 20,908 20,908 20,908 20,908 Number of firms 3,847 3,847 3,847 3,847 3,847 3,847 Sargan (P-value) 0.538 0.670 0.575 0.676 0.362 0.679 arm2 (p-value) 0.969 0.645 0.846 0.752 0.988 0.592 arm1 (p-value) 0 0 0 0 0 0
Standard errors in parentheses. *** p<0.01, ** p<0.05, * p<0.1

34
We estimate a positive and significant coefficient for the interaction terms with hedged firms
dummy. These firms, by definition, may be treated as candidates for naturally hedged ones whose
activities including exports are expected to be less sensitive to the variations in the real exchange
rate. This suggests that the sensitivity of the exports to real exchange rate is muted, i.e. the cost of
production channel limits the impact of competitiveness channel to some extent. These results are
in line with findings in Bleakley and Cowan (2008), and confirm that firms tend to match the
currency composition of their liabilities with their ex-ante sensitivity of revenues to the real
exchange rate.
Table 7 Extended Specification with Size: Estimations with Difference GMM Model
(1) (2) (3) (4) (5) (6)
lrexpi,t-1 0.265*** 0.254*** 0.255*** 0.253*** 0.259*** 0.254***
(0.0398) (0.0376) (0.0388) (0.0375) (0.0392) (0.0373)
ln(RERjt) -0.449** - -0.127 - -0.219 -
(0.179)
(0.183)
(0.170)
ln(RERjt)) - -0.260*** - -0.132 - -0.268***
(0.0825)
(0.0968)
(0.0802)
ln(RERjt)*LARGEi 0.576*** - - - - -
(0.203)
ln(RERjt))*LARGEi - 0.111 - - - -
(0.139)
ln(RERjt)*MEDi - - -0.300* - - -
(0.175)
ln(RERjt))*MEDi - - - -0.194 - -
(0.123)
ln(RERjt)*SMALLi - - - - -0.281 -
(0.226)
ln(RERjt))*SMALLi - - - - - 0.170
(0.155)
ln(LPit)) 0.558*** 0.354** 0.530*** 0.340** 0.545*** 0.315**
(0.138) (0.154) (0.135) (0.152) (0.137) (0.153)
ln(lrsaleit) 0.824*** 0.877*** 0.826*** 0.880*** 0.820*** 0.882***
(0.149) (0.143) (0.148) (0.143) (0.149) (0.142)
Dolratioit 0.321 0.417** 0.322 0.425** 0.323 0.403*
(0.217) (0.211) (0.215) (0.209) (0.216) (0.208)
Collateralit 0.541 -0.522 0.385 -0.574 0.444 -0.460
(1.278) (1.238) (1.252) (1.227) (1.264) (1.216)
Leverageit 0.840 0.560 0.752 0.547 0.785 0.613
(0.666) (0.640) (0.652) (0.634) (0.658) (0.627)
ln(𝐺𝐷𝑃𝑡𝐹) 3.862*** 2.392* 3.735*** 2.322 3.814*** 2.310
(1.437) (1.452) (1.415) (1.451) (1.428) (1.447)
ln(𝐺𝐷𝑃𝑡𝐷) -2.689*** -2.194*** -2.619*** -2.157*** -2.662*** -2.143***
(0.734) (0.710) (0.723) (0.710) (0.729) (0.708)
VIXt -0.007** -0.006** -0.007** -0.006** -0.007** -0.006**
(0.003) (0.003) (0.003) (0.003) (0.003) (0.003)
Constant 9.546*** 9.410*** 9.527*** 9.327*** 9.648*** 9.107*** (2.882) (2.719) (2.855) (2.701) (2.870) (2.702)
Observations 20,908 20,908 20,908 20,908 20,908 20,908 Number of firms 3,847 3,847 3,847 3,847 3,847 3,847 Sargan (P-value) 0.609 0.657 0.563 0.665 0.579 0.676 arm2 (p-value) 0.821 0.705 0.947 0.668 0.900 0.624 arm1 (p-value) 0 0 0 0 0 0
Standard errors in parentheses. *** p<0.01, ** p<0.05, * p<0.1

35
V.2.4 Size and Age
We interact firm size and age dummy variables with the change and level of log of real exchange
rate and report regression results in Table 7 and Table 8, respectively. We expect to estimate a
positive signs for the coefficients of interaction terms with large and old dummies and negative
signs for small, medium, and young dummies. The latter group of firms is expected to be financially
constrained and is not mature enough both in terms of size and age to manage the currency
mismatch which makes their exports sensitive to the real exchange rate fluctuations. Estimations
results are generally in line with expectations. We estimate generally positive and only significant
coefficients for the interaction terms with log of real exchange rate for large and old dummies while
generally negative and only significant coefficients for the interaction term with log of real exchange
rate for medium and young dummies. The coefficient of interaction terms with small dummy is
estimated to be generally insignificant. In short, estimations show that the exports of large and old
groups are generally less sensitive to the real exchange rate.
Table 8: Extended Specification with Age: Estimations with Difference GMM Model (1) (2) (3) (4)
lrexpi,t-1 0.257*** 0.253*** 0.257*** 0.251***
(0.0389) (0.0375) (0.0387) (0.0373)
ln(RERjt) -0.407**
-0.191
(0.177)
(0.169)
D(ln(RERjt))
-0.272***
-0.189**
(0.0876)
(0.0808) ln(RERjt)*OLDi 0.411**
(0.189) Dln(RERjt)*OLDi 0.144
(0.133)
ln(RERjt)*YOUNGi
-0.449
(0.217) Dln(RERjt)*YOUNGi
-0.202
(0.153) D(ln(LPit)) 0.533*** 0.344** 0.531*** 0.341**
(0.135) (0.152) (0.135) (0.153)
ln(lrsaleit) 0.823*** 0.878*** 0.831*** 0.876***
(0.148) (0.143) (0.148) (0.143)
Dolratioit 0.310 0.417** 0.314 0.435**
(0.215) (0.209) (0.215) (0.207)
Collateralit 0.414 -0.549 0.365 -0.646
(1.255) (1.228) (1.251) (1.209)
Leverageit 0.802 0.563 0.795 0.531
(0.655) (0.632) (0.650) (0.626)
log_GDP_Partners 3.758*** 2.369 3.722*** 2.377
(1.418) (1.450) (1.417) (1.453)
log_GDP -2.618*** -2.181*** -2.602*** -2.190***
(0.724) (0.710) (0.724) (0.712)
VIXt -0.007** -0.006** -0.007** -0.006**
(0.003) (0.003) (0.003) (0.003)
Constant 9.487*** 9.390*** 9.422*** 9.553*** (2.857) (2.702) (2.864) (2.714)
Observations 20,908 20,908 20,908 20,908 Number of id 3,847 3,847 3,847 3,847 Sargan (P-value) 0.575 0.664 0.578 0.651 arm2 (p-value) 0.946 0.675 0.950 0.646 arm1 (p-value) 0 0 0 0 Standard errors in parentheses. *** p<0.01, ** p<0.05, * p<0.1
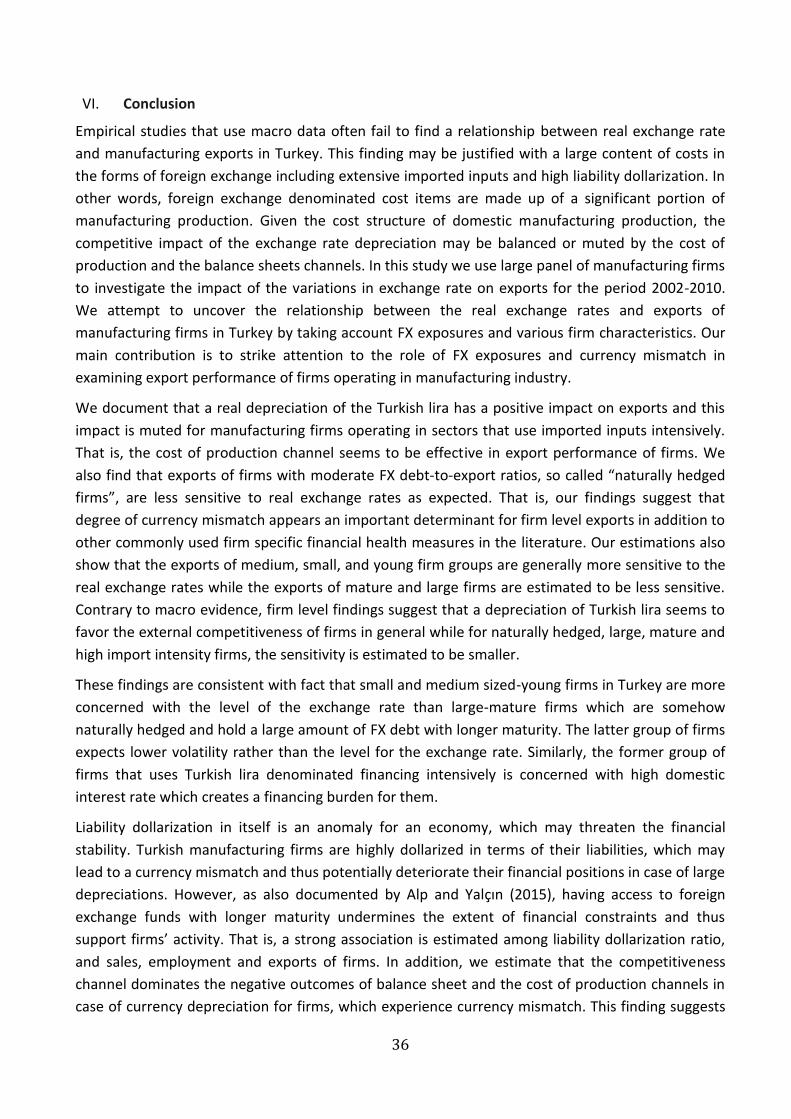
36
VI. Conclusion
Empirical studies that use macro data often fail to find a relationship between real exchange rate
and manufacturing exports in Turkey. This finding may be justified with a large content of costs in
the forms of foreign exchange including extensive imported inputs and high liability dollarization. In
other words, foreign exchange denominated cost items are made up of a significant portion of
manufacturing production. Given the cost structure of domestic manufacturing production, the
competitive impact of the exchange rate depreciation may be balanced or muted by the cost of
production and the balance sheets channels. In this study we use large panel of manufacturing firms
to investigate the impact of the variations in exchange rate on exports for the period 2002-2010.
We attempt to uncover the relationship between the real exchange rates and exports of
manufacturing firms in Turkey by taking account FX exposures and various firm characteristics. Our
main contribution is to strike attention to the role of FX exposures and currency mismatch in
examining export performance of firms operating in manufacturing industry.
We document that a real depreciation of the Turkish lira has a positive impact on exports and this
impact is muted for manufacturing firms operating in sectors that use imported inputs intensively.
That is, the cost of production channel seems to be effective in export performance of firms. We
also find that exports of firms with moderate FX debt-to-export ratios, so called “naturally hedged
firms”, are less sensitive to real exchange rates as expected. That is, our findings suggest that
degree of currency mismatch appears an important determinant for firm level exports in addition to
other commonly used firm specific financial health measures in the literature. Our estimations also
show that the exports of medium, small, and young firm groups are generally more sensitive to the
real exchange rates while the exports of mature and large firms are estimated to be less sensitive.
Contrary to macro evidence, firm level findings suggest that a depreciation of Turkish lira seems to
favor the external competitiveness of firms in general while for naturally hedged, large, mature and
high import intensity firms, the sensitivity is estimated to be smaller.
These findings are consistent with fact that small and medium sized-young firms in Turkey are more
concerned with the level of the exchange rate than large-mature firms which are somehow
naturally hedged and hold a large amount of FX debt with longer maturity. The latter group of firms
expects lower volatility rather than the level for the exchange rate. Similarly, the former group of
firms that uses Turkish lira denominated financing intensively is concerned with high domestic
interest rate which creates a financing burden for them.
Liability dollarization in itself is an anomaly for an economy, which may threaten the financial
stability. Turkish manufacturing firms are highly dollarized in terms of their liabilities, which may
lead to a currency mismatch and thus potentially deteriorate their financial positions in case of large
depreciations. However, as also documented by Alp and Yalçın (2015), having access to foreign
exchange funds with longer maturity undermines the extent of financial constraints and thus
support firms’ activity. That is, a strong association is estimated among liability dollarization ratio,
and sales, employment and exports of firms. In addition, we estimate that the competitiveness
channel dominates the negative outcomes of balance sheet and the cost of production channels in
case of currency depreciation for firms, which experience currency mismatch. This finding suggests

37
that the corporate sector has potential to deal with the negative impact of depreciation of the
domestic currency.
The data used in this study is confined with balance sheets and income statements of firms. There is
extensive foreign exchange indexed pricing in Turkey, which has important implications for the
impact of real exchange rate depreciation on firms activity and their financial positions. To better
measure the extent of currency mismatch and assess the impact of exchange rate on export, foreign
exchange indexed pricing and foreign exchange denominated assets of firms should be
incorporated into the analysis. This is a starting point for future research.
Appendix 1: Industry Specific Exchange Rates
We construct industry-specific trade-weighted real exchange rate to exploit time-series variation in
the industry-level currency movements to identify the effect of exchange rates on the exports.
We build the industry specific real exchange rate using the following steps. First we normalized the
bilateral nominal exhange rates denominated in local currency (increase meaning an depreciation of
Turkish Lira) for each country using 2005 as the base year. For price index, we use aggregate
consumer price index of the partner country. We construct industry specific weights based on the
sum of exports for each industrys’ 30 largest trading partners for a given period. Due to the lack of
consistency in the data availability we drop several countries. Consequently, across the two digit
manufacturing industries, the number of trading partners varies between 27-30 constituiting %75-
90 percent of total exports depending on the industry.
We follow Goldberg (2004) to calculate three real exchange rate measures by industry using i) time
varying weights, ii) pre-period weights (1996-1999), and period average weights (2002-2010). In this
framework, we construct industry specific exchange rates by using the trade-weights of each
industry’s trading partners in exports and corresponding bilateral real exchange rates. Export
weighted industry-specific real exchange rate (based on pre-period, t1-t2, weights) is calculated as:
𝑟𝑒𝑟𝑗𝑡 = ∑𝑤𝑗𝑘𝑡1−𝑡2𝑟𝑒𝑟𝑘𝑡
30
𝑘=1
where
𝑤𝑗𝑘𝑡1−𝑡2 = (
1
𝑡2 − 𝑡1 + 1) × (∑
𝑋𝑗𝑘𝑡∑ 𝑋𝑗𝑘𝑡𝑛𝑘=1
⁄
𝑡2
𝑡=𝑡1
)
j represent industry, k repsents trading partner, and t is time. For pre-period weights t1 stands for
the year 1996 and t2 stands for the year 1999. rerktis the bilateral real exchange rate of trading
partner k at time t. wjkt is the corresponding weight based on export value,Xjkt, of the trading
partner k in sector j.

38
References Ahmed. S., M. Appendino and M. Ruta (2015) “Global Value Chains and the Exchange Rate Elasticity of Exports” IMF Working Paper No: WP/15/252.
Alp, H. B., and C.Yalçın (2015) “Türkiye’de Şirketlerin Borç Dolarizasyonu ve Büyüme Performansı (Liability Dollarization and Growth Performance of Non-Financial Firms in Turkey)” in Turkish, The Central Bank of Turkey Working Paper No. 1501.
Arellano, M., and S. Bond (1991) “Some tests of specification for panel data: Monte Carlo evidence and an application to employment equations” The Review of Economic Studies, 58(2), 277-297.
Akarım, Y.D. (2013) "The impact of financial factors on export decisions: The evidence from Turkey." Economic Modelling, 35, 305-308.
Aldan, A. and M. Günay (2008) “Entry to export markets and productivity: Analysis of matched firms in Turkey,” The Central Bank of the Turkey Working Papers No.0805
Aydın, M. F., U.Çıplak and M. E. Yücel (2004) “Export supply and import demand models for the Turkish economy” The Central Bank of the Turkey Working Paper No. 04/09.
Aydın, F., H. Saygılı, and M. Saygılı (2007) “Empirical analysis of structural change in Turkish exports” The Central Bank of the Turkey Working Paper No.07/08.
Baldwin, J. R. and W.Gu (2003) “Export‐market participation and productivity performance in Canadian manufacturing” Canadian Journal of Economics/Revue canadienne d'économique, 36(3), 634-657.
Bellone, F., P.Musso, L.Nesta and S. Schiavo (2010) “Financial constraints and firm export behaviour” The World Economy, 33(3), 347-373.
Berman, N., and A.Berthou (2009) “Financial Market Imperfections and the Impact of Exchange Rate Movements on Exports” Review of International Economics, 17(1), 103-120.
Berman, N., and J. Héricourt (2010) “Financial factors and the margins of trade: Evidence from cross-country firm-level data” Journal of Development Economics, 93(2), 206-217.
Bernanke, B. S., and M. Gertler (1995) “Inside the black box: the credit channel of monetary policy transmission” NBER Working Paper No. w5146.
Bernard, A. B., J. B., Jensen and R. Z. Lawrence (1995) “Exporters, jobs, and wages in US manufacturing: 1976-1987” Brookings Papers on Economic Activity. Microeconomics, 67-119.
Bernard, Andrew B. and J. B. Jensen (1999) “Exceptional exporter performance: cause, effect, or both?” Journal of International Economics, 47, 1-25.
Bernard, A. B., J. B.Jensen, and P. K. Schott, (2003) “Falling trade costs, heterogeneous firms, and industry dynamics” NBER Working Paper No. 9639.
Bernard, A. B., Jensen J. B. 2004. “Why some firms export?” Review of Economics and Statistics, 86, 561-56.
Berument, M. H., N. N. Dincer, and Z.Mustafaoglu, (2014) “External income shocks and Turkish exports: A sectoral analysis” Economic Modelling, 37, 476-484.
Bleakley, H., and K.Cowan (2008) “Corporate dollar debt and depreciations: much ado about nothing?” The Review of Economics and Statistics, 90(4), 612-626.
Bobeica, E., P. S. Esteves, A. Rua and K. Staehr (2015) “Exports and domestic demand pressure: a dynamic panel data model for the euro area countries” ECB Working Paper Series No: 1777.
Bozok, İ., B. S. Dogan and C. Yunculer (2015) “Estimating Income and Price Elasticity of Turkish Exports with Heterogeneous Panel Time-Series Methods” The Central Bank of Turkey Working Paper No. 1526.

39
Braun, M. (2003). "Financial Contractibility and Asset Hardness" University of California - Los Angeles mimeo.
Calvo, Guillermo A. and Carmen M. Reinhart (2002) "Fear Of Floating," Quarterly Journal of Economics, 107(2), 379-408.
Calvo, G. A., Izquierdo, A., ve Mejia, L. (2004) “On the Empirics of Sudden Stops: The Relevance of Balance-Sheet Effects” NBER Working Paper No: 10520.
Cağlayan, M. and F. Demir (2014) "Firm productivity, exchange rate movements, sources of finance, and export orientation" World Development, 54, 204-219.
Campa, J., and L. S.Goldberg (1997). “The evolving external orientation of manufacturing industries: evidence from four countries” NBER Working Paper No.5919).
Campa, J. M. (2004). Exchange rates and trade: How important is hysteresis in trade?. European Economic Review, 48(3), 527-548.
Carranza, L. J., J. M.Cayo , and J. E. Galdón-Sánchez (2003) “Exchange rate volatility and economic performance in Peru: a firm level analysis” Emerging Markets Review, 4(4), 472-496.
Chaney, T. (2016) “Liquidity constrained exporters” Journal of Economic Dynamics and Control. Advance online publication. doi: 10.1016/j.jedc.2016.03.010
Cheung, Y. W. and R. Sengupta, (2013). Impact of exchange rate movements on exports: an analysis of Indian non-financial sector firms. Journal of International Money and Finance, 39, 231-245.
Coşar, E. E. (2002).“Price and income elasticities of turkish export demand: a panel data application” Central Bank Review, 2(2).
Çulha, O. Y., and M. K.Kalafatcilar (2014) “Türkiye’de ihracatin Gelir ve Fiyat Esnekliklerine Bir Bakiş: Bölgesel Farklılıkların Önemi” The Central Bank of the of Turkey Working Paper No. 1405.
Claessens, S. and L. Laeven (2003) “Financial development, property rights, and growth” The Journal of Finance, 58(6), 2401-2436.
Dekle, R., Jeong, H., and H.Ryoo (2009) “A Re-Examination of the Exchange Rate Disconnect Puzzle: Evidence from Firm Level Data”University of Southern California mimeo.
Demir, F. (2013) “Growth under exchange rate volatility: does access to foreign or domestic equity markets matter?” Journal of Development Economics, 100(1), 74-88.
Demirhan, A. ( 2015) "Export Behavior of the Turkish Manufacturing Firms," The Central Bank of the Turkey Working Papers No.1522.
Dinçer, N. and M. Kandil (2011) "The effects of exchange rate fluctuations on exports: A sectoral analysis for Turkey." The Journal of International Trade & Economic Development, 20(6), 809-837.
Echeverry, J. C., L.Fergusson, R.Steiner and C. Aguilar (2003) “ Dollar debt in Colombian firms: Are sinners punished during devaluations?” Emerging Markets Review, 4(4), 417-449.
Eichengreen, B., R.Hausmann and U. Panizza (2005) The mystery of original sin. Other People’s Money: Debt Denomination and Financial Instability in Emerging Market Economies, 233-65.
Esteves, P.S. and E.Prades (2016) “On domestic demand and export performance in the euro area countries: does export concentration matter?” ECB Working Paper Series No: 1909.
Forlani, E. (2010). Liquidity constraints and firm's export activity. Centro Studi Luca d'Agliano Development Studies Working Paper No. 291.
Fazzari, S.M., R.G. Hubbard and B.C. Petersen (1988) “Financing Constraints and Corporate Investment,” Brooking Papers on Economic Activity 1, 141-19

40
Gezici, A., Ö. Orhangazi and C. Yalçın (2016) “Financial Constraints and Export Decisons: Evidence from a major emerging market economy” Unpublished manuscript.
Goldberg, L. S. (2004) “Industry-specific exchange rates for the United States” Federal Reserve Bank of New York Economic Policy Review, 10(1).
Görg, H., and M. E. Spaliara (2014) “Financial Health, Exports and Firm Survival: Evidence from UK and French Firms” Economica, 81(323), 419-444.
Greenaway, D. and R.Kneller (2004) “Exporting and productivity in the United Kingdom” Oxford Review of Economic Policy, 20(3), 358-371.
Greenaway, D., A.Guariglia and R.Kneller (2007) “Financial factors and exporting decisions” Journal of international economics, 73(2), 377-395.
Greenaway, D., R.Kneller and X.Zhang (2010) “The effect of exchange rates on firm exports: The role of imported intermediate inputs” The World Economy, 33(8), 961-986.
Helpman, E., M.J. Melitz and S. R. Yeaple (2004) "Export Versus FDI with Heterogeneous Firms" The American Economic Review, 94(1), 300-316.
Héricourt, J., and S. Poncet (2015) “Exchange rate volatility, financial constraints, and trade: empirical evidence from Chinese firms” The World Bank Economic Review, 29(3), 550-578.
Hur, Jung, Manoj Raj, and Yohanes E. Riyanto. "Finance and trade: A cross-country empirical analysis on the impact of financial development and asset tangibility on international trade." World Development 34.10 (2006): 1728-1741.
Hummels, D., J. Ishii and K. Yi (2001) “The Nature and Growth of Vertical Specialization in World Trade”, Journal of International Economics, 54, 75–96
Hülagu, T., and C.Yalçın (2014) “Turkiye’de Firmalarin Yabanci Para Borclulugu ve Kur Riskine Iliskin Mikro Degerlendirmeler” Central Bank of the of Turkey Research Notes in Economics No. 1413.
IMF (2015) Global Financial Stability Report, Chapter 3.
Kara, H., and F. Öğünç (2008) “Inflation targeting and exchange rate pass-through: the Turkish experience” Emerging Markets Finance and Trade, 44(6), 52-66.
Kara, H. and F.Öğünç (2012) “Döviz kuru ve ithalat fiyatlarının yurt içi fiyatlara etkisi. İktisat İşletme ve Finans, 27(317), 9-28.
Kesriyeli, M., E. Özmen and S. Yiğit (2011) “Corporate sector liability dollarization and exchange rate balance sheet effect in Turkey” Applied Economics, 43(30), 4741-4747.
Liu, X., and H. Li (2015) “Financial constraints and the productivity–survival link: evidence from China’s firm-level data” Industrial and Corporate Change, 1-17.
Melitz, M. J. (2003) “The impact of trade on intra‐industry reallocations and aggregate industry productivity” Econometrica, 71(6), 1695-1725.
Manova, K., Wei, S. J., & Zhang, Z. (2015). Firm exports and multinational activity under credit constraints. Review of Economics and Statistics, 97(3), 574-588.
Manova, K. (2013) “Credit constraints, heterogeneous firms, and international trade” The Review of Economic Studies, 80, 711–744.
Minetti, R., and S. C. Zhu (2011).“Credit constraints and firm export: Microeconomic evidence from Italy” Journal of International Economics, 83(2), 109-125.
Modigliani, F., and M. H. Miller (1958) “The cost of capital, corporation finance and the theory of investment” The American Economic Review, 48(3), 261-297.

41
Muûls, M. (2008). Exporters and credit constraints: A firm-level approach (No. 139). Brussels: National Bank of Belgium.
Muûls, M. (2015) “Exporters, importers and credit constraints” Journal of International Economics, 95(2), 333-343.
Nazlıoğlu, S. (2013) "Exchange rate volatility and Turkish industry-level export: Panel cointegration analysis." The Journal of International Trade & Economic Development 22(7), 1088-1107.
Neyaptı, B., F. Taşkın and M. Üngör (2007). “Has European customs union agreement really affected Turkey's trade?” Applied Economics, 39(16), 2121-2132.
Özmen, E. and C. Yalçın (2007) “Küresel finansal riskler karşısında Türkiye’de reel sektörün finansal yapısı ve borç dolarizasyonu” Iktisat Isletme ve Finans, 22(258), 5-39.
Rajan, R. and L. Zingales (1998). "Financial Dependence and Growth." The American Economic Review, 88(3), 559-86.
Roberts, M. J., and J. R. Tybout, (1997) “The decision to export in Colombia: an empirical model of entry with sunk costs” The American Economic Review, 87(4), 545-564.
Saygılı, S., C.Cihan, C.Yalçın and T. Hamsici (2010) “Türkiye İmalat Sanayiin İthalat Yapısı”The Central Bank of Turkey Working Paper No. 1002.
Şahinbeyoglu G. and B. Ulaşan (1999) "An Empirical Examination of the Structural Stability of Export Function : The Case of Turkey," Discussion Papers 9907, Central Bank of the Republic of Turkey.
Tybout, J. R. (2003) Plant-and firm-level evidence on “new” trade theories. Handbook of international trade, 1, 388-415.
Wagner, J. (2001) “A note on the firm size–export relationship” Small Business Economics, 17(4), 229-237.

Central Bank of the Republic of Turkey
Recent Working Papers
The complete list of Working Paper series can be found at Bank’s website
(http://www.tcmb.gov.tr)
Entrepreneurship in the Shadows: Wealth Constraints and Government Policy (Semih Tümen, Working Paper No. 16/23, November 2016)
Ex-Ante Labor Market Effects of Compulsory Military Service (Huzeyfe Torun Working Paper No. 16/22 November 2016)
Co-movement of Exchange Rates with Interest Rate Differential, Risk Premium and FED Policy in "Fragile Economies" (M. Utku Özmen, Erdal Yılmaz Working Paper No. 16/21 September 2016)
Job Security and Housing Credits
(Kurmaş Akdoğan, Ayşe Tatar, Ayşe Arzu Yavuz Working Paper No. 16/20 September 2016)
Cyclical Variation of Fiscal Multiplier in Turkey (Cem Çebi, K. Azim Özdemir Working Paper No. 16/19 September 2016)
Unemployment Hysteresis and Structural Change in Europe (Kurmaş Akdoğan Working Paper No. 16/18 August 2016)
Asymmetric Government Expenditure: A Comparison of Advanced and Developing Countries (Ali Aşkın Çulha Working Paper No. 16/17 August 2016)
Firmaların Sabit Sermaye Yatırım Kararlarının Analizi: Türkiye İmalat Sanayine Dair Bulgular (Evren Erdoğan Coşar Çalışma Tebliği No. 16/16 Temmuz 2016)
Cross-Border Capital Flows in Emerging Markets: Demand-Pull or Supply-Push? (Kurmaş Akdoğan, Neslihan Kaya Ekşi, Ozan Ekşi Working Paper No. 16/15 June 2016)
Minimum Wage Effects on Labor Market Outcomes in Turkey (H. Burcu Gürcihan Yüncüler, Çağlar Yüncüler Working Paper No. 16/14 June 2016)
On Estimation of the Normalized CES Production Function for Turkey (Selen Başer Andıç Working Paper No. 16/13 June 2016)
A Dynamic Approach to Analyzing the Effect of the Global Crisis on Non-Performing Loans:
Evidence from the Turkish Banking Sector (Vuslat Us Working Paper No. 16/12 April 2016)
Forecasting Turkish Real GDP Growth in a Data Rich Environment (Bahar Şen Doğan, Murat Midiliç Working Paper No. 16/11 March 2016)
Does Multiplicity of Equilibria Arise in the Eaton-Gersovitz Model of Sovereign Default? (Yasin Kürşat Önder Working Paper No. 16/10 March 2016)
Revisiting Capital Structure of Non-financial Public Firms in Turkey (Ramazan Karaşahin, Doruk Küçüksaraç Working Paper No. 16/09 March 2016)
Faiz Koridoru ve Banka Faizleri: Parasal Aktarım Mekanizmasına Dair Bazı Bulgular (Mahir Binici, Hakan Kara, Pınar Özlü Çalışma Tebliği No. 16/08 Mart 2016)
Search by Firms and Labor Market Policies (Gönül Şengül Working Paper No. 16/07 March 2016)
Life Satisfaction and Keeping up with Other Countries (Ozan Ekşi, Neslihan Kaya Ekşi Working Paper No. 16/06 February 2016)