exports diversification; trade policy; trade openness; structural … · 2020-01-23 · countries...
TRANSCRIPT
© 2019 United Nations
Exports diversification; trade policy; trade openness; structural
economic transformation; SSA
C33, F63, O19, O55

2 UNCTAD Research Paper No. 3 _____________________________________________________________________________________
_____________________________________________________________________________________
Contents
1. Introduction ................................................................................................ 3
2. Data description and analyses ................................................................... 4
3. Empirical methodology and analyses ........................................................ 11
4. Conclusion and policy implications ........................................................... 19
References ...................................................................................................... 22
Acknowledgements
The authors are grateful to anonymous referees for useful comments on this paper.
3 UNCTAD Research Paper No. 3 _____________________________________________________________________________________
_____________________________________________________________________________________
1. Introduction The new conventional wisdom in the development literature is that poor developing countries should transform their production and export structures to achieve sustained growth and poverty reduction (UNIDO, 2015; Weiss, 2017). The Sustainable Development Goals (SDGs), the Istanbul Programme of Action for the Least Developed Countries (LDCs) and the African Union's Agenda 2063 emphasize the importance of export diversification and structural transformation in achieving national development objectives (United Nations, 2011 and 2015; AUC, 2015). Given the crucial role that diversification is expected to play in transforming economies and achieving goals expounded in recent national, regional and global development initiatives, it is necessary to examine the determinants of export diversification in developing countries, particularly those in Africa and the LDCs. While many papers have been written on the subject, existing studies do not account simultaneously for the role of energy infrastructure and services, weak domestic production structure, and natural resource endowments in the diversification process. This is an important limitation, particularly in the case of African countries and LDCs, because poor energy services have been identified as binding constraints to production and export in these groups of countries. For example, Osakwe (2018) suggests that poor energy infrastructure has a negative impact on industrialization and growth in Nigeria because it reduces capacity utilization rates, makes domestic firms less competitive, and discourages banks and finance houses from lending to local manufacturing firms. Similar energy infrastructure challenges are faced in other African countries and LDCs (UNECA, 2017). With regard to domestic production structure, there are indications that weaknesses in export performance in LDCs are associated with weaknesses in industrial performance (United Nations, 2016). In particular, countries that have weak domestic production structures, as reflected in weak industrial performance, generally lack the capability to produce varieties of goods and services and so have weak trade performance. In this context, there is the need to incorporate the roles of poor energy infrastructure and services and a weak domestic production structure in studies on the determinants of diversification in Africa and LDCs. There is also the need to take into account the role of natural resource endowments given the fact that many countries in Africa and LDCs are resource-rich and the economic literature suggests that resource endowments play a role in the growth and diversification process of developing countries (Sachs and Warner, 1995; Wood and Berge, 1997).
This paper attempts to fill the existing gap in the literature. It uses a large sample of developing countries and different regression techniques to analyse the role of various factors on export diversification in developing countries, particularly those in Africa and LDCs.1 Two measures or indicators of export diversification are used in the study: the number of export lines and the Relative Theil index (widely used to capture export concentration).2 With regards to explanatory variables, six categories of independent variables are used in the paper: (i) a measure of domestic production structure and industrial performance proxied by the share of manufacturing value added in gross domestic product (GDP), (ii) a measure of natural resource endowments (captured by the ratio of mineral rents to GDP), (iii) two indicators of infrastructure, namely energy consumption and the number of telephone line subscriptions, (iv) financial depth, (v) market size, and (vi) openness to trade and foreign direct investment (FDI) inflows.
The results of the regression analyses show that domestic production structure is a determinant of export specialisation patterns in developing countries. In particular, an increase in the share of manufacturing value-added in GDP is positively associated with export diversification, while an increase in the share of mineral rents in GDP results in a more concentrated export structure. Infrastructure, both physical and information or technology-related, as well as financial depth and openness to trade, also foster export diversity. However, mixed results are obtained about the effect of FDI. In some estimations, FDI inflows appear to have a positive effect on export diversity while in other cases it has a negative effect. This may capture the fact that in
1 See section 3 for a detailed description of the empirical strategy. 2 It should be noted that export concentration is the opposite of export diversification.
4 UNCTAD Research Paper No. 3 _____________________________________________________________________________________
_____________________________________________________________________________________
developing countries in Africa and LDCs, most FDI goes to specific industries (such as mining) and more generally the extractive sector of an economy.
The present study is a complementary addition to the growing literature on the determinants of export diversification. Cadot, Carrère and Strauss-Khan (2011a, hereafter CCSK) find a hump-shaped relationship between export diversification and the level of income.3 In other words, the number of a country’s export products increases with its income up to a threshold (the “diversification process”) beyond which it decreases to reflect the country’s comparative advantage (the “reconcentration”).4 In a subsequent study, CCSK (2011b) shed light on other drivers of export diversification. Using OLS and negative binomial estimations, they show that FDI and remoteness to main trading partners contribute to export concentration. Conversely, market size, infrastructure, human capital, good institutions and preferential trade agreements favour export diversification.5 Based on a system GMM (generalised method of moments) estimation, Agosin, Alvarez and Bravo-Ortega (2012, hereafter AABO) use different indices of export concentration and find that openness to trade induces export specialisation, while higher schooling or education contributes to export diversification. As in CCSK (2011b), they also find that the higher the distance to main trading partners the more specialised is the export structure.
The key contribution of this paper to the extant literature is that it incorporates simultaneously the roles of domestic production structure, natural resource endowments, and energy infrastructure and services in export diversification in developing countries. The incorporation of measures of domestic production structure and energy infrastructure capture the well-known idea that poor energy services and weak domestic production structures are binding constraints to exports, diversification and development in Africa and LDCs. The incorporation of natural resource endowments is justified because many countries in Africa and LDCs are resource-rich and economic theory suggests that resource endowments play a role in the diversification process. The rest of the paper is organized as follows: section 2 describes the data while section 3 presents the empirical strategy and the regression analyses. Section 4 contains concluding remarks and policy implications.
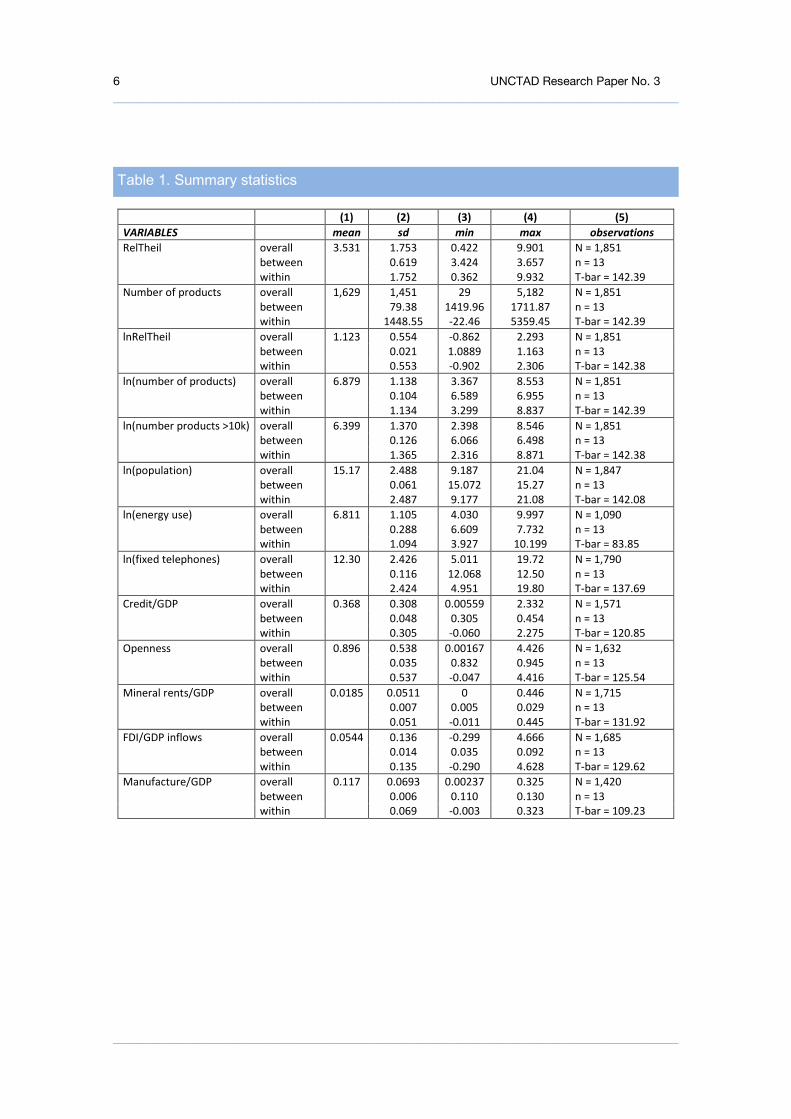
2. Data description and analyses Two indicators of a country's export structure are used in the empirical estimation: a count variable that gives the number of goods a country exports in each year as in CCSK (2011 a. & b.); and the relative Theil index used by Parteka (2010), Parteka and Tamberi (2013a & b) and Basile, Parteka and Pittiglio (2017). Parteka (2010) argues that the relative Theil (RelTheil) index is a preferred measure over the absolute Theil (Theil) index because the latter describes the degree of export concentration with no comparison to world trends, while the former measures the specialisation of a given country’s export structure in comparison with the world.6 For the empirical analyses, the word “diversification” would be used to refer to the count variable and “concentration” to the relative Theil index. In principle, both notions should convey similar qualitative information since an increase in diversification corresponds to a decrease in concentration. To build these indicators, we rely on the BACI2002 disaggregated trade data provided by CEPII (Centre d'Etudes Prospectives
3 They use similar indicators of export structure: the Theil entropy index and the number of export lines at the 6-digit level
of Harmonized System classification (HS6). For Parteka (2010), the hump shape is due to the omission of cross-country heterogeneity; the hump shape disappears once she introduces fixed effects.
4 Mau (2016) provides new evidence that casts doubt on the reconcentration process using the system GMM with data on manufacturing goods.
5 Parteka and Tamberi (2013) find similar results about the effects of market size and remoteness on manufacturing export diversification, using the relative Theil entropy index in an instrumental variable – two stage least square (IV-2SLS) estimation with SITC Rev.2 3 digit manufacturing data.
6 The term “world” refers to the set of economies included in the dataset.

5 UNCTAD Research Paper No. 3 _____________________________________________________________________________________
_____________________________________________________________________________________
et d'Informations Internationales). 7 The dataset distinguishes 5219 products at the HS6 level and encompasses 145 developing countries over the years 2003–2015 in an unbalanced panel due to irregular reporting from several developing countries.8 The following explanatory variables where used in the regression analyses:9
• Manufacture/GDP: is the manufacturing sector value added as a share of GDP. This variable is a proxy for the extent of diversification of a country's production structure.
• Mineral rents/GDP: corresponds to the share of mineral rents in GDP. It captures the role of natural resource endowments and also the extent to which a country has a diversified production structure.
• ln(energy use): is energy use per capita in a given country in logarithm. It captures the role of energy and, more generally, infrastructure in the diversification process.
• ln(fixed telephones): refers to the number of fixed telephone subscriptions in logarithm. It is widely used in the economic literature as a measure of the state of infrastructure.
• Credit/GDP: corresponds to the share of financial resources given to the private sector by financial corporations (domestic credit) in GDP. This indicator measures financial development.
• ln(population): is the logarithm of a country's population and is a proxy for the size of the economy.
• Openness: is a traditional indicator of openness to trade. It is computed as the sum of exports and imports of goods and services as a share of GDP.
• FDI/GDP inflows: is net foreign direct investment inflow as a share of GDP. It captures the impact of foreign capital flows or technology transfer.
Data on all explanatory variables are taken from the World Development Indicators online database. Table 1 presents the summary statistics. In the table, RelTheil refers to the “concentration” variable and Number of products to the "diversification" variable. Their logarithms are also reported as lnRelTheil and ln(Number of products) respectively. ln(Number of products)> 10k corresponds to the "diversification variable" for which a threshold of US$ 10,000 is imposed for a given product to be counted. The imposition of a threshold follows Mau (2016) and provides a robustness check in the regression analysis.
7 BACI is the World trade database built by the CEPII from the COMTRADE database (United Nations Statistical Division).
It is developed through an original procedure that reconciles the declarations of the exporter and the importer. 8 The list of countries included in the dataset is presented in Table 7. 9 Following CCSK (2011 a.), most studies include the logarithm of GDP per capita (PPP) as a measure of income in the
regression. We do not follow this practice, because of high correlation between this variable and ln(fixed telephones).
6 UNCTAD Research Paper No. 3 _____________________________________________________________________________________
_____________________________________________________________________________________
(1) (2) (3) (4) (5) VARIABLES mean sd min max observations RelTheil overall 3.531 1.753 0.422 9.901 N = 1,851 between 0.619 3.424 3.657 n = 13 within 1.752 0.362 9.932 T-bar = 142.39 Number of products overall 1,629 1,451 29 5,182 N = 1,851 between 79.38 1419.96 1711.87 n = 13 within 1448.55 -22.46 5359.45 T-bar = 142.39 lnRelTheil overall 1.123 0.554 -0.862 2.293 N = 1,851 between 0.021 1.0889 1.163 n = 13 within 0.553 -0.902 2.306 T-bar = 142.38 ln(number of products) overall 6.879 1.138 3.367 8.553 N = 1,851 between 0.104 6.589 6.955 n = 13 within 1.134 3.299 8.837 T-bar = 142.39 ln(number products >10k) overall 6.399 1.370 2.398 8.546 N = 1,851 between 0.126 6.066 6.498 n = 13 within 1.365 2.316 8.871 T-bar = 142.38 ln(population) overall 15.17 2.488 9.187 21.04 N = 1,847 between 0.061 15.072 15.27 n = 13 within 2.487 9.177 21.08 T-bar = 142.08 ln(energy use) overall 6.811 1.105 4.030 9.997 N = 1,090 between 0.288 6.609 7.732 n = 13 within 1.094 3.927 10.199 T-bar = 83.85 ln(fixed telephones) overall 12.30 2.426 5.011 19.72 N = 1,790 between 0.116 12.068 12.50 n = 13 within 2.424 4.951 19.80 T-bar = 137.69 Credit/GDP overall 0.368 0.308 0.00559 2.332 N = 1,571 between 0.048 0.305 0.454 n = 13 within 0.305 -0.060 2.275 T-bar = 120.85 Openness overall 0.896 0.538 0.00167 4.426 N = 1,632 between 0.035 0.832 0.945 n = 13 within 0.537 -0.047 4.416 T-bar = 125.54 Mineral rents/GDP overall 0.0185 0.0511 0 0.446 N = 1,715 between 0.007 0.005 0.029 n = 13 within 0.051 -0.011 0.445 T-bar = 131.92 FDI/GDP inflows overall 0.0544 0.136 -0.299 4.666 N = 1,685 between 0.014 0.035 0.092 n = 13 within 0.135 -0.290 4.628 T-bar = 129.62 Manufacture/GDP overall 0.117 0.0693 0.00237 0.325 N = 1,420 between 0.006 0.110 0.130 n = 13 within 0.069 -0.003 0.323 T-bar = 109.23
Table 1. Summary statistics

7 UNCTAD Research Paper No. 3 _____________________________________________________________________________________
_____________________________________________________________________________________
The empirical analysis starts with an examination of the correlations between the above-mentioned explanatory variables and the two measures of export concentration and diversification. Since we have two indicators of diversification/concentration, we present two figures (one for each indicator). Note that each figure has eight graphs (numbered from A to H); each one portrays the relationship between export diversification (measured by the number of exported products) and one explanatory variable. Scatter plots describe correlations between the variables, while curves depict a parametric regression of the export concentration/diversification measure on each independent variable.10 In all graphs, a “small blue x” represents a least developed country (LDC), whereas a “hollow grey circle” represents a non-LDC country. It is interesting to note that in contrast to LDCs, the non-LDCs’ scatter plots are more spread out across all the graphs (in fact, some hollow grey circles are hidden by the blue “x”s).
Figure 1 presents the correlations between our explanatory variables and export diversification measured by the number of exported products. Except for the variables Mineral rents/GDP and FDI/GDP inflows, all other variables display a positive relationship with the number of export lines. With regard to the proxies for economic structure, it turns out that the higher the industrial base, measured by the ratio of manufactures to GDP (Manufacture/GDP), the higher the number of products exported by a country (Figure 1.A). As a matter of fact, the great majority of LDCs have Manufacture/GDP ratio smaller than 0.20 and exported less than 200 goods between 2003 and 2015. Conversely, many of their non-LDC counterparts exported two times more than LDCs over the same period. Interestingly, the ratio of mineral rents to GDP (Mineral rents/GDP) is negatively associated with the number of exported products (Figure 1.B). On the one hand, most of the countries exporting more than 300 products have a mineral rents’ share of GDP smaller than 0.10. On the other hand, countries with a Mineral rents/GDP ratio above 0.40 export less than 100 goods. This suggests that economies that are endowed with natural resources and depend heavily on mineral rents export a small number of products.
10 These figures are obtained with the Stata command “lfit” on pooled data. Subject to data availability, the sample
includes 112 to all 145 countries. R2 are reported for each graph.

8 UNCTAD Research Paper No. 3 _____________________________________________________________________________________
_____________________________________________________________________________________
Note: “blue x” for Least Developed Countries (LDC), “grey o” for non-LDCs
Figure 1. Number of exported products (ln) and each of the explanatory variables, 2003-2015

9 UNCTAD Research Paper No. 3 _____________________________________________________________________________________
_____________________________________________________________________________________
With regard to the infrastructure indicators, Figure 1.C shows a positive association between the number of export products and energy consumption. Overall, LDCs appear to have lower energy consumption levels than non-LDCs and this may account for the fewer number of export lines observed in LDCs. The data also show that the number of fixed telephone subscriptions is positively related to the number of products exported. Once again, the performance of LDCs is limited compared to those of other developing countries (Figure 1.D.). These findings suggest that improving both physical and information infrastructure should increase the number of products exported.
Domestic credit to the private sector is another variable that seems to be positively associated with the number of products exported by a country. In figure 1.E, one can see that the share of domestic credit to the private sector in GDP is less than 0.50 in most LDC countries. Given the positive relationship between Credit/GDP and the number of export products, relaxing credit constraints can play a positive role in fostering export diversification in LDCs. With regard to the size of the economy (proxied by ln(population) ), the data show that it is also positively associated with export diversification (Figure 1.F). The plots for LDCs as well as non-LDCs are well spread out along the x-axis. However, virtually all LDCs are confined below the curve. This suggests that for a given size of the economy, LDCs are more likely to export less products than other developing countries. This is not surprising giving the poor performance of LDCs on other variables analysed above. In fact, economic size matters for diversification when a country has an industrial base, adequate infrastructure and a developed financial sector.
The curve in Figure 1.G shows that the number of export products increases with the degree of an economy's openness to trade. Scatter plots related to non-LDCs are more spread out across the graph while those for LDCs are in the lower left corner of the graph, which corresponds to less openness and lower export diversification. It should be noted that a few LDCs appear to be very open (degree of openness > 3.0) but still export only few products. Linking this last observation to the previous remarks, we can say that the link between trade openness and export diversification is not automatic. In particular, openness to trade is likely to be conducive to export diversification when it is accompanied with a strong industrial base, good infrastructure and a deep financial system. Finally, in Figure 1.H, one can see that export diversification decreases with FDI. This may reflect the fact that developing countries usually attract significant foreign investment in specific sectors, such as minerals. Such resource-seeking FDI contributes to export concentration as multinational firms produce large quantities of specific goods (CCSK, 2011b).
Figure 2 presents the correlations between the explanatory variables and the concentration index – the Relative Theil index, used in BPP (2017) and Parteka and Tamberi (2013). Upon visual inspection, one easily notices that the curves describe inverse relationships to those observed in Figure 1. This stems from the fact that an increase in export concentration is equivalent to a decrease in export diversification, and vice versa. Since both measures convey the same qualitative information, there is no need for further analysis of the correlations in figure 2.
More interestingly, the R2 reported give an idea of the explanatory power of each variable on measures of export concentration/ diversification. What is striking is that the message from both figures is the same: regardless of the dependent variable used, the variable ln(fixed telephones) has the highest R2. This observation sheds light on the very important role of infrastructure in promoting export diversification. The next important variable in terms of explanatory power is the size of the economy [ln(population)] and the industrial base (Manufacture/GDP). With an R2 smaller than 1 percent, mineral rents, openness and FDI appear to be the least contributors to export diversification. While the graphical analysis is useful, it is important to bear in mind that the results are indicative and do not imply causality. There is the need to control for other factors in order to capture the relative importance of a variable on export concentration/ diversification. This is done in the regression analysis that follows. Based on the graphical analysis above, one may have the following expectation about the regression analysis: any variable that displays a positive effect in the model explaining the number of export products (“diversification model”) should have the opposite effect in the models using concentration indices (“concentration model”, hereafter) and vice versa.

10 UNCTAD Research Paper No. 3 _____________________________________________________________________________________
_____________________________________________________________________________________
Note: “blue x” for Least Developed Countries (LDC), “grey o” for non-LDCs
Figure 2. lnRelTheil and each of the explanatory variables, 2003-2015

11 UNCTAD Research Paper No. 3 _____________________________________________________________________________________
_____________________________________________________________________________________
3. Empirical methodology and analyses
3.1 Empirical approach
Based on the economic literature and observations from the above graphical analysis, we formulate the following hypotheses:
H1. Variables measuring the industrial base, infrastructure, the financial system, the size of the economy and openness to trade have a positive (negative) effect on export diversification (concentration).
H2. Variables capturing the share of mineral rents in GDP and FDI have a negative (positive) impact on export diversification (concentration).
H3. Being a least developed country is associated with a lower level of export diversification.
To check the validity of these hypotheses, we look at the signs of coefficients throughout the econometric estimations presented below. H1 is verified if, on the one hand, coefficients in the “diversification model” are positive and, on the other hand, they are negative in the “concentration model”. H2 is valid if the reverse situation is true. To verify H3, a dummy variable for LDC is introduced, whose sign is supposed to be negative (positive) in the “diversification model” (“concentration model”). Besides CCSK (2011 a. & b.), most of the recent studies on the determinants of diversification take into account the possible problems of endogeneity between the dependent variable and some explanatory variables. In the context of this study, it is possible that there is reverse causation between concentration/diversification and the structure of production. In particular, exporting more goods can foster industrialization and transformation resulting in a larger share of manufacture value-added in GDP (Manufacture/GDP).11 More importantly, the Hausman’s test rejects the exogeneity of this variable. To deal with the simultaneity bias, we use instrumental variable (IV) techniques, where Manufacture/GDP is instrumented with its first and second lags.12 Regressions are obtained with the IV- two-stage least-squares (IV-2SLS) estimation technique and with the IV-2Step GMM with time fixed effects. Interestingly, both IV methods produce similar results. Some authors such as AABO (2012) and Mau (2016) use the system GMM with balanced panel data to control for the endogeneity of some of the explanatory variables. We did not adopt this approach given the fact that our data is unbalanced, which can induce bias in estimates (Moral-Benito and Allison, 2017).
For the regression analysis, we first estimate and present the results of the “diversification model”, where the natural logarithm of the number of export lines is the dependent variable. All variables are either expressed in percentage or in logarithm so that the coefficients can be interpreted as elasticities. Following Mau (2016), a threshold of at least $10, 000 is chosen for an HS6 export good to be counted. This prevents overestimating export diversification.13 Second, we estimate and present the results of the “concentration model”, where the logarithm of the relative Theil index (lnRelTheil) is the dependent variable. As with the diversification model estimations, we use both IV methods described above. Finally, following CCSK (2011 a.) we also use a count model for the number of export lines. In fact, we use the IV Poisson technique to model export concentration/ diversification.14 As usual, in this case the dependent variables are expressed in levels rather than logarithms. Therefore, for this set of estimations we use number of export products and RelTheil as the dependent variables.
11 This phenomenon is also known is the literature as the “simultaneity bias”. 12 When the first lag is used alone, the Hansen J test statistic indicates that the instrument is correlated with the errors in
all the estimations. 13 Mau (2016) notes that if trade flows are reported, although they are exported at small amounts relative to most other
flows, this could provide a misleading estimate of actual diversification. 14 We do not include time fixed effects (TFE) because the model would not be identified; their inclusion yields more
parameters (19) than instruments (18).

12 UNCTAD Research Paper No. 3 _____________________________________________________________________________________
_____________________________________________________________________________________
3.2 Results with the export diversification variable
In this section, we discuss the results of the estimations of the “diversification model.” Table 2 presents results of the IV-2SLS regressions. The share of manufacturing value-added in GDP (Manufacture/GDP) has a positive sign and is the explanatory variable with the highest coefficient. It is also significant across all the estimations. This result echoes the finding in Figure 1 that Manufacture/GDP is a key predictor of export diversification. By contrast, the share of mineral rents in GDP (Mineral rents/GDP) does not seem to have any significant effect on export diversification in the estimations of the diversification model. This result is consistent with the findings based on graphical analysis that Mineral rents/GDP is marginally correlated with both measures of export structure.
As expected, the proxies for infrastructure have a positive effect on export diversification indicating that the availability of good infrastructure could help countries to diversify their exports. That said, there are slight differences in the results across the two measures of infrastructure. For example, the variable ln(fixed telephones) has a positive impact of export diversification – as expected and is strongly statistically significant in the different estimations. The second measure of infrastructure, ln(energy use), also has the expected positive sign, but is only significant in 4 out of 6 regressions.
The estimation results also suggest that market size, proxied by ln(population), contributes to a country’s performance in terms of numbers of export lines. This probably stems from the fact that large markets are more likely to host a wide diversity of businesses that sell on international markets. Financial development seems also to play a positive role in promoting export diversification, though the variable Credit/GDP is significant only in 3 out of 6 specifications. With regard to openness to trade, the results suggest that the more a country is open to trade, the greater the number of its export products. These results contrast with AABO (2012) who find that Credit/GDP is not a significant determinant of diversification. Their study also shows that openness to trade results in trade concentration. These differences may stem from the fact that the present paper focuses on developing countries, a significant fraction of which have embryonic financial systems. In such a context, an improvement in credit is likely to have a significant effect on export diversification.
Interestingly, the FDI to GDP ratio appears to be insignificant in all our estimations, though it enters with the expected sign in 2 out of 4 regressions. Finally, the dummy variable for LDCs behaves as predicted and is strongly statistically significant in all the estimations. The results indicate that LDCs have a lower level of export diversification than other developing countries, reflecting the fact that they also have relatively low levels of productive capacities.
Table 3 presents the IV-2step GMM estimations. In many respects, the results are similar to those presented above. The main difference between the results in tables 2 and 3 is that in the latter the FDI/GDP variable becomes significant with a positive sign in one regression.

13 UNCTAD Research Paper No. 3 _____________________________________________________________________________________
_____________________________________________________________________________________
Dependent variable Ln (number of export products) Ln (number of export products >10k)
(1) (2) (3) (1) (2) (3)
Manufacture/GDP 1.177** 1.155** 0.810* 1.434** 1.472*** 1.045**
(0.470) (0.449) (0.435) (0.569) (0.548) (0.524)
Mineral rents/GDP 0.309 0.0247 0.219 0.212 -0.161 0.0781
(0.646) (0.610) (0.592) (0.734) (0.702) (0.682)
ln(energy use) 0.0342 0.111*** 0.0819*** 0.0341 0.128*** 0.0913***
(0.0292) (0.0300) (0.0295) (0.0342) (0.0345) (0.0340)
ln(fixed telephones) 0.253*** 0.116*** 0.143*** 0.323*** 0.161*** 0.194***
(0.0170) (0.0229) (0.0231) (0.0201) (0.0281) (0.0280)
Credit/GDP 0.118 0.251** -0.00365 0.209** 0.346*** 0.0323
(0.0880) (0.101) (0.118) (0.104) (0.119) (0.139)
ln(population) 0.165*** 0.167*** 0.198*** 0.199***
(0.0270) (0.0262) (0.0319) (0.0309)
Openness 0.284*** 0.350***
(0.0591) (0.0680)
FDI/GDP inflows 0.506 -0.575 0.816 -0.520
(0.499) (0.528) (0.573) (0.588)
LDC dummy -0.145* -0.343*** -0.331*** -0.152 -0.386***
-0.372***
(0.0878) (0.0752) (0.0740) (0.101) (0.0854) (0.0831)
Constant 3.596*** 2.234*** 2.008*** 2.193*** 0.526 0.255 (0.337) (0.436) (0.417) (0.394) (0.496) (0.466) Year FE Yes Yes Yes Yes Yes Yes
Observations 708 708 703 708 708 703
R-squared 0.708 0.743 0.762 0.743 0.776 0.795 Hansen p-value 0.1197 0.0498 0.1192 0.1443 0.0648 0.1514
Notes: Standard errors in parentheses are robust to heteroskedasticity and autocorrelation *** p<0.01, ** p<0.05, * p<0.1.
Table 2. Determinants of export diversification in a panel of developing countries, 2003-2015: IV-2SLS estimation

14 UNCTAD Research Paper No. 3 _____________________________________________________________________________________
_____________________________________________________________________________________
Dependent variable ln(number of export products) ln(number of export products >10k)
(1) (2) (3) (1) (2) (3)
Manufacture/GDP 1.231*** 1.224*** 0.842* 1.475*** 1.519*** 1.058**
(0.469) (0.447) (0.434) (0.568) (0.547) (0.524)
Mineral rents/GDP 0.476 0.227 0.356 0.367 0.0256 0.192
(0.637) (0.601) (0.586) (0.726) (0.695) (0.677)
ln(energy use) 0.0358 0.115*** 0.0806*** 0.0351 0.131*** 0.0893***
(0.0292) (0.0300) (0.0295) (0.0342) (0.0344) (0.0340)
ln(fixed telephones) 0.250*** 0.117*** 0.144*** 0.320*** 0.162*** 0.195***
(0.0168) (0.0229) (0.0231) (0.0201) (0.0281) (0.0280)
Credit/GDP 0.116 0.228** -0.0216 0.208** 0.325*** 0.0170
(0.0880) (0.100) (0.118) (0.104) (0.118) (0.138)
ln(population) 0.163*** 0.164*** 0.196*** 0.197***
(0.0270) (0.0262) (0.0319) (0.0308)
Openness 0.290*** 0.355***
(0.0590) (0.0679)
FDI/GDP inflows 0.685 -0.568 0.998* -0.518
(0.490) (0.527) (0.565) (0.588)
LDC dummy -0.165* -0.360*** -0.347*** -0.176* -0.409*** -0.391***
(0.0869) (0.0747) (0.0733) (0.100) (0.0845) (0.0821)
Constant 3.622*** 2.232*** 2.034*** 2.222*** 0.523 0.283
(0.337) (0.436) (0.417) (0.393) (0.496) (0.466)
Year FE Yes Yes Yes Yes Yes Yes
Observations 708 708 703 708 708 703
R-squared 0.708 0.742 0.762 0.743 0.775 0.795
Hansen p-value 0.1197 0.0498 0.1192 0.1443 0.0648 0.1514
Notes: Standard errors in parentheses are robust to heteroskedasticity and autocorrelation. *** p<0.01, ** p<0.05, * p<0.1.
Table 3. Determinants of export diversification in a panel of developing countries, 2003-2015: IV-2Step GMM estimation
15 UNCTAD Research Paper No. 3 _____________________________________________________________________________________
_____________________________________________________________________________________
3.3 Results with the export concentration index
This section describes the results of the export concentration model, using various specifications. Table 4 presents the IV-2SLS estimation results. The results suggest that the ratio of manufacturing value added to GDP (Manufacture/GDP) has the expected negative sign but is statistically significant at conventional levels only in 2 out of 5 estimations. In other words, there is some evidence that the larger the industrial base, the smaller the degree of export concentration in a country. In contrast to the diversification model, the variable capturing natural resource endowments (Mineral rents/GDP) enters with the expected sign (positive) and is strongly statistically significant at conventional levels. It also has the highest coefficient in absolute terms throughout all the specifications. In addition, that coefficient is larger than the sum of the coefficients of other variables (in absolute terms). This means that a strong dependence on natural resources can lead to higher export concentration and that this effect can outweigh the impact of factors reducing export concentration.
With regard to infrastructure, energy consumption has a very strong statistically significant impact on export concentration. In particular, the results suggest that an increase in energy consumption will lead to a reduction in export concentration and this result is robust to various specifications of the model. The second measure of infrastructure (ln(fixed telephones)) also has the expected sign and is significant in 2 out of 5 specifications of the model. These results provide evidence that infrastructure has an important role to play in reducing export concentration or fostering export diversification in developing countries. Consistent with other studies (CCSK, 2011 b.; Parteka and Tamberi, 2013), the results suggest that market size, openness to trade and FDI inflows also reduce export concentration.15,16 In addition, the results indicate that LDCs have higher levels of export concentration than other developing countries.
15 Contrary to the present study, AABO (2012) find that trade openness has concentrating impact on exports. Note that
they use the Theil’s entropy index described in CCSK (2011 a.). 16 In contrast, CCSK (2011 b.) get the opposite result, with the Theil’s entropy index (CCSK (2011 a.).

16 UNCTAD Research Paper No. 3 _____________________________________________________________________________________
_____________________________________________________________________________________
Dependent lnRelTheil Variable (1) (2) (3) (4) (5) Manufacture/GDP -0.705* -0.557 -0.438 -0.648** -0.342
(0.369) (0.345) (0.306) (0.313) (0.293)
Mineral rents/GDP 1.498*** 1.420*** 1.666*** 1.773*** 1.655***
(0.370) (0.375) (0.391) (0.420) (0.360)
ln(energy use) -0.138*** -0.122*** -0.183*** -0.188*** -0.168***
(0.0210) (0.0209) (0.0184) (0.0188) (0.0192)
ln(fixed telephones) -0.136*** -0.135*** -0.00964 -0.0162 -0.0364
(0.0125) (0.0125) (0.0267) (0.0255) (0.0240)
Credit/GDP -0.112* -0.269*** -0.196*** -0.0120
(0.0604) (0.0611) (0.0713) (0.0791)
ln(population) -0.144*** -0.142*** -0.144***
(0.0222) (0.0216) (0.0202)
Openness -0.207***
(0.0362)
FDI/GDP inflows -0.689** 0.112
(0.345) (0.328)
LDC dummy 0.0172 0.0176 0.202** 0.189** 0.170**
(0.0669) (0.0682) (0.0815) (0.0776) (0.0716) Constant 3.741*** 3.628*** 4.696*** 4.832*** 5.014*** (0.266) (0.266) (0.190) (0.211) (0.200) Year FE Yes Yes Yes Yes Yes Observations 735 708 708 708 703 R-squared 0.613 0.632 0.698 0.703 0.734 Hansen p-value 0.6803 0.7455 0.3432 0.3903 0.6158
Notes: Standard errors in parentheses are robust to heteroskedasticity and autocorrelation. *** p<0.01, ** p<0.05, * p<0.1.
Table 5 presents the results obtained with the IV-2Step GMM estimations. They are qualitatively similar to those in table 4. Comparing the concentration model with the diversification one, there is a major difference in the relative importance of the explanatory variables, particularly those capturing economic structure and natural resource endowments. In the diversification model, the share of manufacturing value added in GDP is the most important explanatory variable from a quantitative point of view. However, in the concentration model, it is the natural resource endowment measure that is quantitatively the most important.
These facts suggest that the choice of indicator or measure of diversification used is important because it has implications for the results of the regression analysis. Unfortunately, the economic literature does not provide good guidance on which measure is more appropriate. However, many studies use concentration indices, largely because they take into account both the number and value of exports and so may give a better image of a country's export structure. As a further robustness check, the regressions were also run using a count method of estimation, namely the Poisson technique. The results are presented in Table 6 for both the export
Table 4. Determinants of export concentration in a panel of developing countries, 2003-2015: IV-2SLS estimation

17 UNCTAD Research Paper No. 3 _____________________________________________________________________________________
_____________________________________________________________________________________
diversification and the concentration models. It is evident that the results lead to the same qualitative conclusions as in the previous estimations.
Dependent lnRelTheil Variable (1) (2) (3) (4) (5) Manufacture/GDP -0.689* -0.546 -0.420 -0.625** -0.328
(0.367) (0.343) (0.306) (0.312) (0.292)
Mineral rents/GDP 1.504*** 1.428*** 1.677*** 1.790*** 1.659***
(0.370) (0.374) (0.390) (0.419) (0.360)
ln(energy use) -0.138*** -0.123*** -0.185*** -0.189*** -0.168***
(0.0210) (0.0208) (0.0184) (0.0187) (0.0192)
ln(fixed telephones) -0.136*** -0.135*** -0.0140 -0.0198 -0.0379
(0.0125) (0.0125) (0.0263) (0.0252) (0.0238)
Credit/GDP -0.108* -0.256*** -0.185*** -0.00630
(0.0594) (0.0596) (0.0700) (0.0783)
ln(population) -0.140*** -0.140*** -0.143***
(0.0219) (0.0214) (0.0201)
Openness -0.209***
(0.0360)
FDI/GDP inflows -0.700** 0.122
(0.344) (0.327)
LDC dummy 0.0172 0.0176 0.187** 0.176** 0.165**
(0.0669) (0.0682) (0.0799) (0.0761) (0.0707) Constant 3.741*** 3.630*** 4.699*** 4.841*** 5.019*** (0.266) (0.266) (0.190) (0.211) (0.199) Year FE Yes Yes Yes Yes Yes Observations 735 708 708 708 703 R-squared 0.613 0.632 0.697 0.703 0.734 Hansen p-value 0.603 0.7455 0.3432 0.3903 0.6158
Notes: Standard errors in parentheses are robust to heteroskedasticity and autocorrelation. *** p<0.01, ** p<0.05, * p<0.1
Table 5. Determinants of export concentration in a panel of developing countries, 2003-2015: IV-2Step GMM estimation

18 UNCTAD Research Paper No. 3 _____________________________________________________________________________________
_____________________________________________________________________________________
IV-Poisson GMM estimation Dependent Variable Number of export
products) Number of export
products >10k RelTheil
(1) (2) (1) (2) (1) (2) Manufacture/GDP 0.422** 0.359* 0.401 0.445* -0.447** -0.00858
(0.208) (0.196) (0.258) (0.238) (0.227) (0.205)
Mineral rents/GDP -0.0557 0.156 -0.259 0.119 0.985*** 1.323***
(0.308) (0.319) (0.355) (0.380) (0.203) (0.200)
ln(energy use) 0.00259 0.0305** 0.00391 0.0367** -0.115*** -0.148***
(0.0137) (0.0143) (0.0168) (0.0168) (0.0154) (0.0138)
ln(fixed
telephones)
0.183*** 0.128*** 0.225*** 0.168*** -0.127*** -0.0413***
(0.00787) (0.0127) (0.00989)
(0.0154) (0.00842) (0.0138)
Credit/GDP 0.208*** 0.0337 0.296*** 0.0411 -0.0178 0.0153
(0.0326) (0.0433) (0.0382) (0.0493) (0.0456) (0.0587)
ln(population) 0.0956*** 0.110*** -0.130***
(0.0137) (0.0158) (0.0116)
Openness 0.218*** 0.277*** -0.238***
(0.0254) (0.0285) (0.0307)
FDI/GDP inflows -0.564* -0.599* 0.198
(0.291) (0.328) (0.223)
LDC dummy -0.312*** -0.394*** -0.406***
-0.484***
0.0276 0.159***
(0.0459) (0.0434) (0.0510) (0.0482) (0.0409) (0.0396) Constant 5.106*** 4.032*** 4.241*** 2.895*** 3.472*** 4.727*** (0.152) (0.195) (0.180) (0.222) (0.181) (0.145) Observations 708 703 708 703 708 703 Hansen p-value 0.0709 0.0843 0.0842 0.1110 0.5435 0.5440
Notes: Standard errors in parentheses are robust to heteroskedasticity. *** p<0.01, ** p<0.05, * p<0.1
Table 6. Determinants of export concentration in a panel of developing countries, 2003-2015: IV-Poisson GMM estimation

19 UNCTAD Research Paper No. 3 _____________________________________________________________________________________
_____________________________________________________________________________________
4. Conclusion and policy implications This paper examines the determinants of export diversification/concentration in developing countries, with a focus on the role of production structure, natural resource endowments and infrastructure, particularly in LDCs. It uses both the number of export lines and the Relative Theil index as indicators of export diversification and concentration. The results of the regression analyses suggest that the production structure of an economy is an important determinant of export diversification in developing countries. In particular, a large share of manufacturing value added in GDP is positively associated with export diversification. This factor is by far the most important factor driving changes in the export structure. In contrast, natural resource endowments have a negative effect on export diversification. A higher ratio of mineral rents in GDP induces more concentration in export products. These findings are particularly important for African countries and LDCs, which generally exhibit a higher export concentration. Thus, the results underscore the need for African countries and LDCs to build productive capacities and transform the structure of their economies to foster export diversification, as set out in the SDGs, the Istanbul Program of Action for LDCs and Agenda 2063 of the African Union.
The results also suggest that infrastructure is an important driver of export diversification. Both energy consumption and telephone lines – a proxy for Information and Communication Technology (ICT) – have a positive impact on export diversification. This underscores the crucial role of physical and ICT infrastructure in reducing export concentration or diversifying exports. In fact, both the Istanbul Programme of Action for LDCs and the SDGs identified lack of infrastructure and energy deficiency as serious obstacles to sustainable development in developing countries. In this regard, there is the need for African countries and LDCs to strengthen efforts to develop and improve the state of infrastructure in their economies.
The paper also examines the role of financial development market size, openness to trade and FDI in fostering export diversification or reducing export concentration. The paper finds some evidence that financial depth helps to diversify exports. This lends support to the call in the Istanbul Programme of Action to strengthen the capacity of domestic financial institutions in LDCs (in fact, the share of domestic credit in GDP in LDCs represents less than 3 percent in our sample). The results also show that the bigger the domestic market size, the wider is the export diversity. In addition, more open countries tend to have more diversified exports. With regard to FDI, the results are mixed. In some estimation the results suggest there is a positive relationship between FDI inflows and export diversity while in others they suggest that the relationship is negative. This could happen when external resources are channelled mostly to specific industries (for example, the minerals sector).
In sum, the evidence presented in this paper has significant implications for export diversification in developing countries. It shows that diversifying the domestic production structure of developing countries is crucial for reducing their dependency on a few export goods. This implies that developing countries should transform their economies to produce high value-added and dynamic goods, such as manufacturing, for which there is viable and growing demand. But this transformation cannot happen without adequate infrastructure, particularly energy infrastructure and services. By linking the promotion of export diversification to domestic production structure, natural resource endowments and infrastructure, this paper captures the fact that the development goals set out in the Istanbul Programme of Action for LDCs, the SDGs and the African Union's Agenda 2063 are inextricably intertwined. In other words, fostering export diversification or concentration requires addressing the challenges posed by the domestic production structure and lack of quality infrastructure.

20 UNCTAD Research Paper No. 3 _____________________________________________________________________________________
_____________________________________________________________________________________
Country name
iso2 code
Country name
iso2 code
Country name
iso2 code
Country name
iso2 code
Afghanistan AF El Salvador SV Maldives MV Sierra Leone SL
Algeria DZ Equatorial Guinea GQ Mali ML India IN
American Samoa AS Ethiopia ET Mauritania MR Singapore SG
Angola AO Eritrea ER Mauritius MU Vietnam VN
Antigua and Barbuda AG Fiji FJ Mexico MX Somalia SO
Argentina AR French Polynesia PF Mongolia MN South Africa ZA
Bahamas, The BS Djibouti DJ Morocco MA Zimbabwe ZW
Bahrain BH Gabon GA Mozambique MZ Suriname SR
Bangladesh BD Gambia, The GM Oman OM Syrian Arab Republic SY
Barbados BB West Bank and Gaza PS Nauru
Thailand TH
Bhutan BT Ghana GH Nepal NP Togo TG
Bolivia BO Kiribati KI Aruba AW Tonga TO
Brazil BR Grenada GD New Caledonia NC Trinidad and Tobago TT
Belize BZ Guam GU Vanuatu VU United Arab Emirates AE
Solomon Islands SB Guatemala GT Nicaragua NI Tunisia TN
British Virgin Islands
Guinea GN Niger NE Turkey TR
Brunei Darussalam BN Guyana GY Nigeria NG Turks and Caicos Islands
TC
Myanmar MM Haiti HT Northern Mariana Islands MP Tuvalu TV
Burundi BI Honduras HN Micronesia, Fed. Sts. FM Uganda UG
Cambodia KH Hong Kong SAR, China HK Marshall Islands MH Egypt, Arab Rep. EG
Cameroon CM Indonesia ID Palau PW Tanzania TZ
Cabo Verde CV Iran, Islamic Rep. IR Pakistan PK Burkina Faso BF
Cayman Islands KY Iraq IQ Panama PA Uruguay UY
Central African Republic
CF Cote d'Ivoire CI Papua New Guinea PG Venezuela, RB VE
Sri Lanka LK Jamaica JM Paraguay PY Samoa WS
Chad TD Jordan JO Peru PE Yemen, Rep. YE
Chile CL Kenya KE Philippines PH Zambia ZM
Table 7. List of developing countries

21 UNCTAD Research Paper No. 3 _____________________________________________________________________________________
_____________________________________________________________________________________
Country name
iso2 code
Country name
iso2 code
Country name
iso2 code
Country name
iso2 code
China CN Korea, Dem. People’s Rep.
KP Guinea-Bissau GW Curacao CW
Colombia CO Korea, Rep. KR Timor-Leste TL Sint Maarten (Dutch part)
SX
Comoros KM Kuwait KW Qatar QA South Sudan SS
Congo, Rep. CG Lao PDR LA Rwanda RW Sudan SD
Congo, Dem. Rep. CD Lebanon LB St. Kitts and Nevis KN
Costa Rica CR Liberia LR St. Lucia LC
Cuba CU Libya LY St. Vincent and the Grenadines
VC
Benin BJ Macao SAR, China MO Sao Tome and Principe ST
Dominica DM Madagascar MG Saudi Arabia SA
Dominican Republic DO Malawi MW Senegal SN
Ecuador EC Malaysia MY Seychelles SC

22 UNCTAD Research Paper No. 3 _____________________________________________________________________________________
_____________________________________________________________________________________
References AUC (2015), Agenda 2063, The Africa We Want, Final Edition, Popular version. African Union Commission:
Addis Ababa. Accessed on November 10, http://www.un.org/en/africa/osaa/pdf/au/agenda2063.pdf.
Agosin, M. R., Alvarez, R., and Bravo‐Ortega, C. (2012), ‘Determinants of export diversification around the world: 1962–2000’, The World Economy, 35, 3, 295-315.
Azevedo, J.P. (2011), wbopendata: Stata module to access World Bank databases, Statistical Software Components S457234, Boston College Department of Economics. http://ideas.repec.org /c/boc/bocode/s457234.html.
Basile R., Parteka A., Pittiglio R. (2017), ‘Export diversification and economic development: a dynamic spatial data analysis’, Review of International Economics, DOI:10.1111/roie.12316.
Bhattacharya, D., and Khan, T.I. (2014), ‘The Challenges of Structural Transformation and Progress towards the MDGs in LDCs’, Istanbul Programme of Action for the LDCs, 1.
Carrère, C., Cadot, O., and Strauss-Kahn, V. (2011a), ‘Export diversification: What's behind the hump?’, Review of Economics and Statistics, 93, 2, 590-605.
Carrère, C., Cadot, O., and Strauss-Kahn, V. (2011b), ‘Trade diversification: Drivers and impacts’. In Jansen, M., Peters, R., and Salazar-Xirinachs, J. M. (2011). Trade and employment: From myths to facts. International Labour Office.
Mau, K. (2016), ‘Export diversification and income differences reconsidered: The extensive product margin in theory and application’, Review of World Economics, 152, 2, 351–381
Moral-Benito, E. and Allison, P.D. and Williams, R.A. (2017), ‘Dynamic Panel Data Modelling Using Maximum Likelihood: An Alternative to Arellano-Bond’, Banco de Espana Working Paper No. 1703.
Osakwe, P. N. (2018), ‘Unlocking the potential of the power sector for industrialisation and poverty alleviation in Nigeria’ in E. Wamboye and P. Nyaronga (eds.) The Service Sector and Economic Development in Africa. Routledge: UK (forthcoming).
Parteka A. (2010), ‘Employment and export specialisation along the development path: some robust evidence’, Review of World Economics, 145, 4, 615-640.
Parteka, A. and Tamberi M. (2013a), ‘Product diversification, relative specialisation and economic development: import-export analysis’, Journal of Macroeconomics, 38, A, 121-135.
Parteka, A., and Tamberi, M. (2013b), ‘What determines export diversification in the development process? Empirical assessment’, The World Economy, 36, 6, 807-826.
Sachs, J. D., and Warner, A. M. (1995), ‘Natural resource abundance and economic growth’, NBER Working Paper No. 5398 (Cambridge, MA: National Bureau of Economic Research).
UNECA (2017), Promoting Infrastructure Development for Africa’s Industrialisation. Report prepared by the United Nations Economic Commission for Africa (UNECA). UNECA: Addis Ababa.
UNIDO (2015), Industrial Development Report 2016. The Role of Technology and Innovation in Inclusive and Sustainable Industrial Development. United Nations Industrial Development Organization: Vienna.
United Nations (2016), Making Trade Work for LDCs - A Handbook on Mainstreaming Trade. United Nations: Geneva and New York (2016).
United Nations (2015), Transforming our World: The 2030 Agenda for Sustainable Development, A/RES/70/, https://sustainabledevelopment.un.org/content/documents/21252030%20Agenda%20for%20 Sustainable %20Development%20web.pdf
23 UNCTAD Research Paper No. 3 _____________________________________________________________________________________
_____________________________________________________________________________________
United Nations (2011), Agenda item 8, Programme of Action for the Least Developed Countries for the Decade 2011-2020, Istanbul, Turkey, 9-13 May 2011, A/CONF.219/3/Rev.1, accessed on November 10, 2017, http://unohrlls.org/UserFiles/File/IPoA.pdf.
Weiss, J. (2017), ‘Lewis on industrialisation and industrial policy’, Journal of International Development, DOI: 10.1002/jid.3338.
Wood, A., and Berge, K. (1997), ‘Exporting manufactures: human resources, natural resources, and trade policy’, The Journal of Development Studies, 34, 1, 35-59.