export-import bank of india -...
TRANSCRIPT

1
EXPORT-IMPORT BANK OF INDIA
OCCASIONAL PAPER NO. 147
INDIAN ELECTRONIC INDUSTRY :PERSPECTIVES AND STRATEGIES
© Export-Import Bank of IndiaMarch 2011
EXIM Bank’s Occasional Paper Series is an attempt to disseminate the findings of research studies carried out in the Bank. The results of research studies can interest exporters, policy makers, industrialists, export promotion agencies as well as researchers. However, views expressed do not necessarily reflect those of the Bank. While reasonable care has been taken to ensure authenticity of information and data, EXIM Bank accepts no responsibility for authenticity, accuracy or completeness of such items.

2

3
CONTENTS
Page No. List of Tables 5List of Exhibits 7 List of Boxes 9Executive Summary 111. Introduction 472. Global Scenario 493. Indian Scenario 804. Challenges, Government Policies and Strategies 111Annexure1. Production of Electronic Products 1402. World Export of Telecommunications Equipment 1413. World Export of Computer and Related Equipment 1424. World Export of Electronic Components 1435. World Export of Audio and Video Equipment 1466. Export of Other ICT 148 (Information and Communication Technology) Goods7. Major players in the Telecommunications Equipment Industry 1518. Annual Plan of Department of Information Technology 2010-11 1529. India’s Exports and Imports of Telecommunications Equipment 15310. India’s Exports and Imports of Computer and Related Equipment 15411. India’s Exports and Imports of Electronic Components 15612. India’s Exports and Imports of Audio and Video Equipments 16013. India’s Exports and Imports of other ICT goods 163
Project Team:
Mr. S. Prahalathan, General Manager, Research and Planning GroupMs. Renuka Vijay, Manager, Research and Planning Group

4

5
Table No. Title Page No.
1 Market Segmentation of Select Sub-Sectors of Electronic 53 Industry in Asia Pacific Region (2009)
2 Improvement Trends for Integrated Circuits Enabled by 55 Feature Scaling
3 Exports of Select Electronic Goods in the World 56
4 Leading Exporters and Importers of Select Electronic Goods 57
5 Exports and Imports of Select Electronic Items from China 62
6 Exports and Imports of Select Electronic Items from Singapore 65
7 Exports and Imports of Select Electronic Items from Hong Kong 68
8 Exports of Electronics from Japan 73
9 Imports of Electronics by Japan 74
10 Electronics Production in India 82
11 Demand for Colour TVs 85
12 Overall Market Share of Key Players 87
13 Revenue of Telecom Equipment Industry 97
14 Top 10 players in Telecommunications Equipment Industry 98
15 India’s Major Export Destinations and Import Sources of 108 Electronic Products (2009-10)
16 Contribution of Different Items and Categories of Electronic Goods 110
17 R&D Expenditure in India by Sectors (2009-10) 114
18 Benefits Available for EHTP/STP/EOU and SEZ Units 120
LIST OF TABLES

6

7
Exhibit No. Title Page No.
1 Growth Cycle of World Electronics Industry 49
2 Segment-wise Production of World Electronic Industry 2008 50
3 Estimated Growth of Electronics Market in the World 51 (2013 vs 2008)
4 Estimated Growth in Production of Electronics in the 51 World (2013 vs 2008)
5 Region-wise Production of World Electronic Industry 2008 52
6 Exports of Electronic Goods in the World 56
7 Major suppliers of Office and Telecom Equipment to EU 27 (2009) 58
8 Major suppliers of Office and Telecom Equipment to USA (2009) 59
9 Major suppliers of Office and Telecom Equipment to China (2009) 59
10 Production of Electronics Products in China 61
11 China’s Consumption of Electronic Components in Manufacturing 62
12 Global Production by Japanese Electronics Industry 72
13 Domestic Production by Japanese Electronics Industry 72
14 Phases of Development 80
15 Production of Electronics Hardware in India 81
16 Percentage Share of Electronics Production in GDP 83
17 Growth of Consumer Electronics Market in India 84
18 Production of Consumer Electronics in India 85
19 Demand for Colour TV (Size-wise) 86
20 Trend in Demand for Colour TVs 86
21 Growth of Computer Hardware Market in India 89
LIST OF EXHIBITS

8
Exhibit No. Title Page No.
22 Production of Computers in India 90
23 Total PC Sales 90
24 Total Desktop Sales in Business and Households. 91
25 Production of Industrial Electronics in India 92
26 Growth of Subscriber Base in India 94
27 Wireless Services Segment: Service Provider Market 94 Share as on 30.12.2010
28 Wireline Service Segment: Service Provider Market 95 Share as on 30.12.2010
29 Telecom Equipment Production in India 100
30 Telecom Equipment Exports 100
31 Production of Strategic Electronics in India 102
32 Production of Components in India 104
33 India’s Exports and Imports of Electronic Goods 105
34 India’s Major Export Destinations (region-wise) 2009-10 107
35 India’s Major Source Countries (region-wise) 2009-10 107
36 Gross Domestic Expenditure on R&D as Percentage of GDP for Select Countries (2008 or latest available year) 114

9
Box No. Title Page No.
1 Automotive Electronics Council (AEC) 75
2 Information Technology Agreement 77
3 Next Generation Network (NGN) 99
4 Seminonductor Industry in India 106
5 Electronic Manufacturing Services (EMS) 109
6 Restriction of Hazardous Substances (RoHS) 117
7 Electronic Hardware Technology Park (EHTP) Scheme 119
8 EMC Certification Scheme 131
LIST OF BOXES

10

11
INTRODUCTION
Worldwide, the electronic industry is one of the most flourishing and extremely diversified sectors, growing at a rapid pace with the invention of innovative technologies and growing customer inclination towards electronic goods and services. The industry has been experiencing phenomenal and remarkable changes over the years, and is being distinguished with other industries by way of technological developments. The key segments of the electronic industry are electronic components industry, computer and office equipments, telecommunications, consumer electronics and industrial electronics.
GLOBAL SCENARIO
Production
World electronics production is estimated to be Euro 1.13 trillion in 2008. Telecom and data processing equipments are the two largest segments accounting for 25%, and 21%, respectively, of the total world electronics production in the year 2008. Industrial and medical
electronics accounted for 18% share, and audio-video equipments accounted for 15% share in world production of electronics. Automotive (8%), aerospace & defence (7%), and home appliances (6%) are other sub-sectors in electronic production.
Until 2013, the total word electronics production is expected to grow at a CAGR of 2.7%. The major difference among the growth in geographical areas will be their capacity to recover from the recent market downturn. In this respect, China is expected to outperform other regions.
China (growth of 7%) is expected to show the highest growth followed by other Asia Pacific countries (5.8%). Europe and North America are expected to show deceleration in their production owing to the recovery phase after the economic recession. Production is expected to grow by 3% in 2013 with the Asian countries likely to dominate the market space. Other Asia Pacific countries and China are expected to show the highest growth of 7.1% and 6.9%, respectively. Production in 2008 was estimated at Euro 778.4 billion, which is expected to grow to Euro 898.6 billion in 2013.
EXECUTIVE SUMMARY

12
Major Production Centres
Analysis of region-wise production of electronics reveals that Asian countries dominate the production scenario of electronics in the world, with China being the largest producer, with 26% share in total world production, followed by Europe (22%), North America (18%), and the rest of Asia Pacific countries with 16% of total production in 2008. Even though Asian countries have been dominating the production scenario, developed economies have not lost their significance in the electronics industrial landscape. Europe and North America still stand at 2nd and 3rd positions, respectively, in terms of electronics production in the world, together representing up to 40% of the world electronics production in 2008.
World Trade
The world exports of office and telecom equipments (which include EDP equipments & office equipments, telecommunications equipments and Integrated Circuits and electronic components), during 2009 were valued at US $ 1321.09 billion, of which telecommunications equipment had the largest share (38%). EDP equipment & office equipment, and Integrated Circuits and electronic components had a share of 35%, and 27%, respectively. The major countries / regions exporting most
of the electronic goods include: EU (27), China, Hong Kong, USA, Singapore and Korea Republic; and the major importing countries in the world include: EU (27), USA, China and Hong Kong. However, all the categories have shown a decline over the previous year owing to the economic slowdown that took place during 2008 and 2009.
CHINA’S ELECTRONIC INDUSTRY
Electronics Industry is the largest industry in China, and is growing at an average 20% per annum. China is one of the largest producers of TVs, recorders, VCD players, telephones, and holds a leading edge in semiconductor and computer industry. Growing indigenous demand, and a large number of overseas manufacturers aiming for economizing costs have boosted the electronic industry in China.
The production of electronic products has been rising in China, at a CAGR of around 20% over the last decade. One of the main reasons for this level of growth has been the increase in consumption of electronic components for manufacturing, which has led to an increase in demand. During 2009, exports and imports had declined due to the economic slowdown. China was the largest exporter of EDP equipment and office equipment in 2009 with a share of 33.9% in the total world exports. In the case of imports, China

13
was the largest importer of integrated circuits and electronic components in the year 2009, with a share of 32.8% in the total world imports.
It is reported that the digitization of electronics has also been largely favouring the development of Chinese electronics industry. Also, the convergence of electronic applications, technologies and products favour the development of wide range of portfolios by the Chinese electronic conglomerates. While sourcing critical components from abroad, Chinese electronic industry developed its manufacturing output through partnership with international players and outsourcing services, mainly through assembly work. The technology transfer has also been benefiting the Chinese electronics industry in achieving self-sufficiency, by developing home-grown standards for mass market digital products. Component manufacturing in China is also developing fast to provide a comprehensive supply chain, and support the growth in local production.
SINGAPORE’S ELECTRONIC INDUSTRY
Singapore’s electronics industry has been an important pillar of the country’s economy over the last 40 years. It is also a key demand driver for the chemicals, logistics and precision engineering industries, as
well as an important capability enabler for various sectors like avionics, medical technology and clean energy. The investment projects in 2009 are expected to contribute SGD 1.8 billion in variable account per annum to Singapore’s Gross Domestic Product (GDP) when they are fully implemented. This is generated by electronics investment commitments, of SGD 4.9 billion, in manufacturing FAI (Fixed Asset Investment) in 2009, or 41.5 per cent of total manufacturing FAI.
Singapore has become a world-class electronics manufacturing hub with end-to-end R&D capabilities. Presently, the industry is made up of various important strands. The biggest area is in semiconductors, which consists of integrated circuit (IC) design, wafer fabrication, and assembly and test activities. The sector employs around 3,500 R&D engineers working on IC design, process development, packaging and test engineering and embedded software development.
During 2009, exports and imports of electronic goods had declined due to the economic slowdown. Singapore was one of the major exporters as also importers of office and telecom equipment in the world. Singapore was the largest exporter of integrated circuits and electronic components in the year 2009, with a share of 62% in the total world exports.

14
EDB (Economic Development Board of Singapore, Government of Singapore) has identified four growth areas for this industry – green electronics, bioelectronics, plastic electronics and security products. Currently, these smart products contribute about 10% of the country’s electronics output, which is expected to increase to 30% by 2020. Green electronics refer to energy efficient solutions for applications such as lighting, automotive and computing. Another novel method of reducing reliance on traditional sources of energy is through energy harvesting. Such IC designs are able to capture and convert ambient energy into electricity. Improving healthcare remains a top priority, and developing bioelectronics will be beneficial for all. Singapore is ready to propel this new growth segment forward with its base of core electronics capabilities and existing strengths in material physics and biotechnology.
HONG KONG’S ELECTRONICS INDUSTRY
As of 2007, the Hong Kong’s electronic Industry comprises about 500 establishments engaging nearly 10,000 persons with a gross output of nearly HK$ 8 billion. Electronic industry in the year 2007 accounted for 4% of total establishments in the manufacturing sector; about 6% in the total employment in the manufacturing sector; about 5% in the value of gross
manufacturing output; and about 7% share in manufacturing value added.The electronics industry has been seen as a medium for developing globally competitive niches in newly developing markets; thus, Hong Kong Government has clearly outlined explicit objectives and industry policies to encourage research, design and manufacturing in electronics industry. There has been rapid increase in major investments by the Hong Kong Government on infrastructural development to support the emergence of new businesses. Institutions such as Hong Kong Industrial Technology Center (HKITC), Hong Kong’s Applied Research Council and other special research facilities have been set up to support the growth of electronics industry. Direct investment in manufacturing was left to the private sector.
Hong Kong’s electronic industry is one of the largest merchandise export earners, and is one of the largest exporters of calculators, radios, telephone sets, sound recording apparatus (including DVD/VCD recorders / players) in the world.
One-fourth of Hong Kong’s electronics exports comprise of finished goods, majority of them being durable products for domestic consumption. Audio-visual (AV) equipment, consisting of radios and optical discs players, hi-fi equipment, TV sets, video cassette recorders,

15
digital versatile disc (DVD) players/recorders, and MP3 players are some of the major finished products. Moreover, Hong Kong exports a variety of computer products too, such as desk-top/notebook computers and magnetic and optical disk drives, as well as telecommunications products like corded and cordless telephones. Other items with smaller export value include calculators, electronic dictionaries and translators, batteries and personal security/smoke alarms.
Electronic parts and components constitute about three-fourth of Hong Kong’s electronics exports. In particular, a large amount of semi-conductors are re-exported to China for further production. Hong Kong also produces and exports a variety of parts for telecommunications items, AV equipments, office machines and computers, as well as components like resistors, capacitors, inductors, crystals, resonators, speakers, switches, buzzers, liquid crystal displays (LCDs), printed circuit boards (PCBs) and transformers. Hong Kong also re-exports a large volume of semiconductors to China for outward processing production.
The success of Hong Kong’s electronics industry also lies in efficient management. Against the fast changing markets, Hong Kong companies emphasize quick response to ensure effective marketing services to their customers, and to monitor the
changing product trends. Moreover, due to the growing concern of quality conscious buyers, more and more companies have strengthened their quality assurance systems. This is evidenced by a growing number of Hong Kong companies accredited with ISO 9000 - an internationally recognized standard for quality management system, and ISO 14000 - a standard for environmental management system, amid the growing concerns for environmental protection.
Of late, most electronic manufacturers in Hong Kong have relocated the labor-intensive production processes to China, while, their Hong Kong offices are mainly responsible for product development, quality control, management, marketing and logistic support. Due to the relocation of production facilities, most companies have been re-classified as non-manufacturing establishments, despite the fact that they have manufacturing activities across the boundary. However, there are a number of companies still maintaining the high value-added and/or capital-intensive production in Hong Kong, e.g. IC packaging/testing, production of multi-layer PCBs, lead-frame bonding and PCB assembly by surface mount technology (SMT) for high-value products.
There are also a number of large Hong Kong companies marketing

16
electronic products under their own brand names, including Truly, V-Tech, Group Sense, Venturer, GP and SMC. Their sales network covers not only the advanced countries, but also emerging economies like Latin America and Eastern Europe.
As for parts and components, many manufacturers produce custom-made products for famous global companies, e.g. parts and accessories of computers, recorders, and radio receivers, as well as components/modules like PCBs and LCDs. Meanwhile, standard components are usually exported directly to distributors and manufacturers in overseas markets. Electronic parts and components from Japan, Taiwan, the US and South Korea are sometime assembled in Hong Kong and are then re-exported into the market. This can be seen in the rising number of multinational manufacturers setting up offices in Hong Kong.
JAPANESE ELECTRONIC INDUSTRY
Japan is the largest manufacturer of consumer electronics in the world. Japanese companies have a reputation for high quality and innovation, especially in audio and video segments.
Global production by Japanese electronics and IT companies is estimated to rise 11% in 2010, to
¥ 43.7 trillion. The trend of recovery is expected to continue in 2011, when production is forecast to increase 4%, to ¥ 45.5 trillion. Production by Japanese electronics and IT companies accounted for a significant share (21%) in the world production in 2010. Although Japanese companies are facing increasing competition worldwide, production is seen growing in line with the introduction of products taking advantage of environment-related and other technologies.
Domestic production by the Japanese electronics industry is estimated to increase 13% in 2010, to ¥ 15.3 trillion. Special demand was seen for flat-panel TVs and other products due to the Eco-Point System, and for automobiles due to Government support. This demand also contributed and increased the demand for electronic components and devices. Progress will continue towards the establishment of global production structures. In this environment, though domestic production is forecast to increase by 2%, to ¥ 15.7 trillion in 2011, this level is still 15% below that was achieved for the year 2008.
The exports of electronics from Japan increased by 17.8% during the period April-October 2010 compared to the corresponding period in the previous year. Electronics components and devices constituted a large share in the exports (77.7%) from Japan, followed by industrial electronics

17
equipment with 13.6% share, and consumer electronics equipment with 8.8% share in total exports from Japan. In the case of imports, during January – October 2010, imports increased by 27% to a value of ¥ 6.68 trillion. Constituting a share of 50.7%, electronic components and devices were the largest imported item, followed by industrial electronic equipments (37.8%) and consumer electronic equipments (11.5%).
SELECT GLOBAL TRENDS
Global electronic firms are increasingly using their core competency to expand their global consumer base. The firms are focusing on technology, product development and manufacturing capabilities through aggressive innovation. Innovation is also being used in development of new business models, business processes, and management of services. For example, Apple Inc. innovated a new business model from being a provider of innovative products to a provider of lifestyle product (Apple I-Pad). Introduction of this product changed the trends in delivery of contents.
Global electronic manufacturing firms are also moving their locations to take advantage of low-cost global talent, and manufacturing operations to increase operational efficiency.
Improvement in profitability is being undertaken through concentration on high-growth-low-competition areas, such as industrial / medical electronics and aerospace / defence electronics. Automotive electronics is another growth area which is having a small share in the electronic industry, and in order to revive the same, the Automotive Electronics Council has been commissioned by leading industry players.
Global firms are focusing on five major areas, viz.,
• Developing an understanding of both domestic and international customers for creating value propositions;
• Implementing new business models that help them in achieving the value propositions;
• Establishing the ability to shift the resources among diverse lines of business with exit and entry strategies;
• Making decisions efficiently and communicating to stakeholders; and,
• Attracting and retaining global talent at competitive price.
Electronic industry in many developed countries are facing challenges associated with human resources, as the

18
workforce is expected to come down drastically in the medium term. In such a situation, many electronic firms are dependent on global labour market place for their requirements. This may, however, call for managing the workforce by standardizing human capital data and sharing of knowledge. Such trends may pose challenges of globalizing and unifying the mindsets of employees. Systems and processes need to be established to deploy human resources based on global priorities. Firms are helping their employees to understand the need for customer focus and cultural integration.
Over the past few years, the electronics manufacturing services (EMS) industry has quickly diversified its list of value-added services for OEM (Original Equipment Manufacturers) customers. As a result, EMS firms are beefing up their logistics offerings as well, providing a variety of outbound shipping services to OEMs that do not build up inventory, and are aiming to transport high-tech products to customers, as fast as possible, by establishing organizations devoted to marketing and managing outbound, customer-facing functions.
New applications, or improvement in existing applications based on energy saving (home, transport, industry), good living/wellbeing (living place, para-medic and medical applications) and protection (personal security, tracking), are likely to be in demand in the years to come.
The analog-to-digital conversion has introduced many new standards in audio and video, which greatly improves the quality and affordability of the multimedia digital experience. Further, with the proliferation of broadband, accessing the media has become easy and rewarding for consumers.
The impact of recession on electronics goods industry was significant resulting in project cancellations, postponement, market opportunity review, or combining with other projects. The design, resources of people, capital and tools were reduced in many cases, and then kept in a frozen state. However, from around middle of 2009, situation has started improving and this has been enabled, first by low inventories, and next by robustness of select market segments. Still, the industry is holding a very cautious view of this recovery and deliberated if there could be further turbulence

19
ahead. Thus, the resource constraints on new product designs have continued to remain a challenge even though forward looking sales plans are turning more and more optimistic. The recovery in electronics industry is expected to fully bloom in 2 or 3 years, i.e. by 2012 or 2013. This presents a huge market potential which cannot be served with only the existing products, and there will be a glut of new designs. Thus, it is reasonable to expect that companies will place major emphasis on new product designs, starting from 2010, as the demand is projected to grow strongly.
The nature of new product demand in a post-recessionary phase is somewhat different from the demand that would be prevalent in a continuous growth period. While the latter is broad based, the former is likely to be very selective, as resource availability for investments, and R&D would be gradual and companies would like to make safer bets. In addition to being selective, companies would also like to look for product opportunities with shorter timeframes for return on investment, which would lead to new designs that are somewhat incremental in nature.
After being battered by the economic downturn, the electronics distribution industry is emerging with a more positive outlook and a new strategy. The industry is optimistic about the long-term outlook. Most of the manufacturers and distributors are planning to take a more customer-focused approach and are expected to furnish more services. Acquiring more customers, including OEMs and EMS firms, has become a major priority, as well as strengthening relationships with current ones. Additionally, distributors are expected to offer more supply chain management solutions and value-added services even to smaller customers, as they seek to establish themselves as the most capable product and service providers.
INDIAN SCENARIO
The start of Indian electronics industry could be traced to the sixties, when the Government took the initiatives of manufacturing space and defence electronic products. This was followed by developments in consumer electronics, mainly the manufacturing of transistor radios, black and white TVs, calculators and other audio products; later in 1980s, manufacture of colour televisions also started. Late 1980s, saw the advent of computers and telecom products.

20
Production
Indian electronics hardware production increased from ` 50,500 crore in 2004-05 to ` 97,260 crore in 2008-09, with a cumulative annual growth rate of 17.3%. The production of electronics hardware in the country is estimated to have grown from ̀ 97,260 crore in 2008-09 to ` 109,940 crore in 2009-10, a growth of 13%. The slower rate of growth of production during 2009-10 is attributed to the global economic slowdown.
Communication and broadcasting equipment took the largest share (29%) in India’s electronics production in the year 2009-10, followed by consumer electronics (27.4%), computers (13.1%), industrial electronics (12.4%), components (12.2%) and strategic electronics (6.3%).
The share of electronics production in India’s GDP has been growing over the years, with increasing importance of this sector. From a share of 1.6% in India’s GDP in 2001-02, the share has increased to 1.95% in 2009-10.
The demand for electronics hardware is being fuelled by the relatively high growth rate of the Indian economy, aspirations of the younger generation, and the large middle class population in India, with increasing disposable income. Thus, there is significant opportunity for stepping up production
of electronics hardware in the country. India has the potential to develop and manufacture electronic hardware for the global markets and gain higher global share besides meeting the country’s future requirement in the converging areas of information, communication and entertainment.
Consumer Electronics
Consumer electronics include electronic equipments meant for everyday use and are most often used in entertainment, communications, and to enhance office productivity. Some of the major products under consumer electronics include personal computers, telephones, MP3 players, audio equipments, televisions, calculators, GPS automated navigation systems, digital cameras and playback and recording of video media such as DVDs, VHSs or camcorders.
Indian consumer electronic market witnessed consistent increase in its market value over the years, from US $ 2.9 billion in 2004 to US $ 4.2 billion in 2008, witnessing a CAGR of 9.7%. Growth rate was the highest in 2006 (of 12.5%), and comparatively during 2008, the industry witnessed a slower growth of 7.7%. Datamonitor has projected that the Indian consumer electronics market is expected to witness a CAGR of 6.1% during the period 2009-2013.

21
Indian electronics industry has been picking up again after the slowdown in the world economy. Rebounding consumer sentiments, strong demand for consumer durables, and stimulus package, have played a significant role in reversing the slowdown that set in more than a year ago. During 2009-10, the production of consumer electronics sector is estimated to be ` 30,150 crore, as against the production level of ` 25,550 crore in 2008-09, registering a growth of about 18%. Within this sector, the colour television segment is the largest contributor.
Computers
The computer hardware market consists of the computers, storage, and other devices segments. The computers segment comprises: desktops and laptops. Storage segment includes memory sticks, CD packs, hard disks and other data storage devices. The other devices segment include: computer peripherals, PDAs, organizers, calculators and satellite navigation systems.
The growth of computer hardware market in India during 2008 was 15.6% over the year 2007. Indian computer hardware market witnessed impressive growth rates in its market value over the years, from US $ 2 billion in 2004 to US $ 3.7 billion in 2008, witnessing an impressive CAGR
of 16.6%. Growth rates witnessed an increasing trend from 15% in 2005 over 2004, to 18.5% in 2007 over 2006, and a moderate decline in 2008, of 15.6%, over 2007.
According to Datamonitor, the computer hardware market is projected to grow at a CAGR of 17% during the period 2009-2013. The market value of India’s computer hardware market is thus expected to be US $ 8.1 billion in 2013.
The overall production of the computer segment of the Indian electronics industry in 2009-10 is estimated to be valued at ` 14,430 crore, a growth rate of 7% over the previous year. The year 2003-04 witnessed the highest growth of 60% over the previous year, owing to increased demand for computers in India. However, during the year 2008-09, the production of computers witnessed a decline of (-) 15%, owing to the global slowdown that had engulfed the countries world over.
The total PC (Personal Computer) sales during 2009-10 was 8.03 million units, including desktop computers and notebooks (including netbooks); the value of sales is expected to have registered a growth of about 18.2% in 2009-10 over the year 2008-09. Out of the total PC sales, the total sale of desktops was 5.52 million units, and that of notebooks & netbooks at 2.51 million units. During 2010-11 the

22
total PC sales is estimated to be 9.76 million units, of which 6.20 million units included the desktop sales and the rest 3.56 million units included notebooks and netbooks sales. While desktop sales is expected to increase by 12.3% in 2010-11 over the previous year, that of notebooks & netbooks is expected to increase by (-) 41.8% over 2009-10. The overall consumption in the PC market was led by telecom, banking and financial service sectors, education and households segments.
The overall consumption in the computer market was led by businesses and households. Businesses included telecom, banking and financial services sectors and education. Over the years, the business sector has been dominating the computer industry sales. However, lately the share of households has also started increasing. From a share of 22% in 2003-04, in total PC sales, the households segment has increased its position with a share of 42% in 2009-10. Going forward, with signs of revival in the domestic economy, the industry is expected to show positive growth for PC and other IT products for the year 2010-11.
Industrial Electronics
The industrial electronics segment includes critical hardware technologies and systems with built-in software. It is a very challenging area
which is multidisciplinary in nature requiring high level of technical skill in designing systems for applications in a variety of industrial sectors of the economy. Even though India has been having significant expertise in conceptualizing such systems and its erection and commissioning, the sector is very largely dependent on import of critical hardware and associated software. Large projects are implemented with total import of C&I (commercial and industrial) packages from abroad without any knowledge of its design. In most cases, this leads to higher initial cost and a much higher maintenance cost in the long run.
Industrial electronics is a very high technology oriented area needing very high R&D investments. Therefore, there are limited numbers of global players as far as R&D is concerned. The leading suppliers of the industrial electronics and controls, operating in India include Siemens, Rockwell Automation (Allen-Bradley), Asea Brown Bovery, Schneider, L&T, Honeywell, Mitshubishi, Emerson etc. A number of small-scale units have also come up in the recent past owned by technocrats having expertise in integrated solutions for automation and control instrumentation and software.
During the year 2009-10, the production of industrial electronics is estimated to be ` 13,630 crore, as
23
against ` 12,740 crore in the fiscal year 2008- 09, registering a growth of about 7%. During 2008-09 also, this segment witnessed a growth of 7% in its production. However, it was much lesser than the growth witnessed in 2007-08 (of 14.5%) over 2006-07. The main reason for deceleration in production growth could be the overall slowdown in the world economy.
The Department of Information Technology, Government of India, through its Industrial Applications Programme is endeavouring to support this sector, particularly the SMEs, by providing proven indigenous technologies wherever possible. Several technologies developed through national collaborative programme have been applied for field demonstration. This includes energy related equipment for improvement of electric power quality, controllers in the area of automation systems, equipment for railway traction, etc. A large collaborative programme on Intelligent Transportation System, which includes various technology modules for application in the road transportation sector has also been launched by the Department of Information Technology.
This sub-sector continues to play a very important role towards the manufacturing value added and economic growth. State-of-art industrial electronics equipment and systems, automation technologies,
networking systems and various other stand-alone instrumentations are increasingly applied in manufacturing processes like steel, textiles, cement, power, chemical and refineries. Transportation sector, particularly the Indian Railways, are increasingly adopting latest electronic equipments for their locomotive and signaling systems.
Communication and Broadcasting Sector
Telecommunications is one of the few sectors in India, which has witnessed the most fundamental, structural and institutional reforms since 1991. In recent times, India has emerged as one of the fastest growing telecom markets in the world. The communication technology has taken a big leap forward and received the national recognition as the key driver for development and growth.
The telecom services have been recognized the world-over as an important tool for socioeconomic development of a nation. Telecommunication is one of the prime support services needed for rapid growth and modernization of various sectors of the economy. It has become especially important in recent years because of enormous growth of information technology and its significant potential for the impact on the rest of the economy. The telecom sector, which has the multiplier effect

24
on the economy, has a vital role to play, by way of contributing to the growth in efficiency.
The overall telephone connections stood at 621.28 million at the end of the financial year 2009-10. Out of this, the share of wireless subscribers stood at 584.32 million as compared to 391.76 million in 2008-09, witnessing a growth of 192.56 million connections or a share of 49.15%. The rural subscribers reached 190.88 million, as compared to the level of 111.63 million in the 2008-09, excluding CDMA, which works out to a growth of about 71% over 2008-09. It was reported that 32.67% of total wireless subscribers are now in rural areas. The total number of wireline connections was 36.96 million, while in the rural areas it stood at 9.93 million.
The gross telephone subscribers in the country crossed 764.76 million at the end of November 2010 (of which wireless telephone subscribers are about 729.57 million). The overall tele-density reached 64.34% in November 2010. With such subscriber base, India is now second largest telecom market in Asia (next to China), having second largest mobile subscriber base in the world. At the end of November 2010, total broadband connections in the country have reached 10.71 million. In the broadcasting sector, apart from All India Radio, there are around 250 FM Radio stations in operation.
India has currently achieved a distinction of having the world’s lowest call rates (1-2 US cents), the fastest sales of mobile phones, production of world’s cheapest mobile handset, and the fastest growth in number of wireless phone subscribers (about 14 million per month).
The data collated by the Department of Telecom, Government of India shows that production of telecom equipment in India during 2009-10 stood at ` 510 billion, witnessing a growth of 4.5% over 2008-09.During 2010-11, telecom equipment production is estimated to grow by 5% to reach ` 535 billion.
India exported equipment worth ` 135 billion in 2009-10 as against ` 19 billion in 2006-07, a growth of 600%, underlining the growth potential of the sector. The pace of growth in manufacturing would accelerate over next 3 years considering the growth of subscribers. According to Department of Information Technology, telecom equipments worth ` 3500 billion to ` 5000 billion would be required in India by 2015.
Indian telecommunication sector has a lot of growth potential; however, India needs to focus on upgrading technology and services, which requires R&D investments. R&D is very important in telecom sector because it has the potential of bringing immense value to the

25
country. In India, R&D spending in telecom sector is expected to grow due to 3G, 4G/WiMax, LTE deployments all over the world, which would boost equipment and telecom devices demand. According to telecom regulatory authority of India, it is estimated that for 3G alone the investment would be of the order of US $ 15 billion, and demand for network elements would translate into requirement for components, test and auxiliary equipments. The overall investment requirement is expected to be of the order of US $ 100 billion. Major objective and focus should be on undertaking advance research, developing world class human resources, and establishing effective academia-industry interface. Apart from this, Indian telecom sector should also focus on promoting international cooperation with leading institutions, organizations and countries in the world.
Strategic Electronics
Strategic electronics has become one of the important areas in the electronic industry due to the criticality of the technology development targeting two aspects, viz., a) the technology applicable to the strategic sector, like defence purposes; and b) the emerging state-of-the-art technology in the civilian applications. The strategic electronic sector envelops satellite based communication, navigation and surveillance systems,
radars, navigational aids, sonars, underwater electronic system, infra-red based detection and ranging system, disaster management system, internal security system, etc. The Indian strategic electronic industry has been able to meet the bulk of the requirements of India’s defence and paramilitary forces.
There has been consistent growth in production of strategic electronics. In the year 2008-09, production of strategic electronics in India was valued at ` 6,840 crore, a growth of 20% over the previous year. The production data for the year 2009-10 is estimated to be ` 6,980 crore, registering a marginal growth of about 2%. However, this is much lower than the growth rate witnessed in 2008-09 over 2007-08. This was mainly because of reduced military spending in some sectors and the troubled global economy. At the national level, various research institutions are developing strategic systems, and the public sector undertakings and some of the private agencies are mainly contributing to the growth in production.
It is expected that military and aerospace semiconductors are expected to witness growth in the coming years, as suppliers are likely to be looking forward for the end-product growth coming to the market over the next few years. This growth is due to technological advances

26
which are driving the demand due to changes in national military policies, and as a result of the substantial backlog of undelivered orders in aerospace. Prior to the era of computers and consumer electronics, military electronics consumed almost all of the world’s semiconductors. Although the market share of military electronics in the consumption of semiconductors has been reduced, semiconductors nonetheless perform critical roles in the military electronics segment.
In the overall industrial market, which includes military and aerospace applications, more designs are being used in digital signal processing, sensors, analog circuitry for automation, measurement, security, and other growing areas. While volumes of shipment in the end-equipments are lower and growth is limited, the increasing electronics content, requiring semiconductors, is driving an average growth of 5% per year for military / aero chips. The forecast for military and aerospace semiconductors shows that the year 2010 would be a growth year for this market, with revenue likely to approach US $ 2.6 billion.
Components
The growth in production of components industry has been driven mainly by growth in consumer electronics and mobile sector. This
sector faced serious challenges, with regard to growth and competitiveness, due to historical reasons, as well as the business environment prevailed in the year 2009. Historically, Indian electronics components sector had not kept pace with the rest of the world, and was saddled with out-dated technology, low volumes and high costs, making it globally uncompe-titive. However, the technological gap has been narrowing down.
The total production of electronic components was valued at ` 13,360 crore in the year 2009-10, a growth of 11% over the previous year. Electronic components with major share in production include: CD-R, Colour Picture Tubes (CPT), PCBs, DVD-R, connectors, semiconductor devices, ferrites, and resistors. It is estimated that the serviceable market for professional grade components such as PCBs, semiconductor devices, connectors, wound components, antennas, are likely to go up due to indigenous manufacture of electronic products, such as mobile phones, set top boxes, DVD players. Most of the top global semiconductor companies have set up their chip design centres in India. There is a major shift in 21 inch CTVs – from conventional CPTs (Colour Picture Tube) to Flat Screens. With decline in global demand for CRT (Cathode Ray Tube) TVs, India will be the largest user of this CRT (Cathode Ray Tube) technology in the next few years with demand spreading to rural

27
areas. India is also likely to become the global hub for manufacture of CRT (Cathode Ray Tube) TVs.
After the ITA- 1 (Information Technology Agreement) was implemented, most of the components are placed at zero customs duty, and the remaining will be converging soon to zero duty structure under the FTAs. Convergence of technologies have further resulted in functional changes - the functions that were performed by consumer electronics equipments till now, are being performed by telecom and IT products, eliminating the little difference that remained between components used in these different segments of equipments. Thus, practically all components today can be imported at zero customs duty.
An interesting phenomenon about Indian electronic component industry is that while it is relatively competitive in global markets, its competitive position is relatively weak in the domestic market, when compared to imports, especially from China and other Asian countries. Such imports are largely by assemblers in unorganized sector, who flood their products in the grey market, hurting the revenues of organized sector.
India has been relatively a strong player in the picture tube segment with large manufacturing facilities and new technologies. Other products / segments in which India is considered
to be relatively strong include: PCBs, connectors, passive components and other electromechanical components, such as relays, switches, contactors, fuses, etc. Manufacturers of these products range from large MNCs, who are focused on local as well as global markets, and medium as well as small scale Indian companies. Investments in these products, though widespread, are smaller compared to semiconductor manufacturing, and thus India has some strong players who have expertise and have been in business for long.
Exports and Imports
India has been largely an importer of electronic goods rather than an exporter of the same. Electronic goods were one of the most important items of imports in India. However, India’s export of electronic goods has been growing over the years. The growth trend has been positive even in the year 2008-09, in which most of the sectors have witnessed slowdown in exports. During the year 2008-09, the exports of electronic goods were valued at US $ 6.8 billion, which constituted 3.7% of the total exports from India. The share of electronic goods exports from India in the total exports to the world, have more or less remained around 2% to 4% over the years. During 2009-10, India’s electronics exports were valued at US $ 5.48 billion, with a share of 3.1% in India’s total exports. During

28
this period, electronic exports have witnessed a negative growth of -19%, over the previous year. During April – September 2010-11, the exports of electronic goods were US $ 3469.95 million, witnessing a growth of 10% over the corresponding period in the previous year. Imports during the same period amounted to US $ 10,110.58 million, a decline of -5.4% over the corresponding period in the previous year.
In the year 2009-10, the imports of electronic goods were valued at US $ 20.96 billion, a negative growth of (-) 9.2% over the previous year. During April-September 2010-11 the imports of electronic goods were valued at US $ 10.11 billion, a decline of 5.4% over the corresponding period in the previous year. Major export destinations for Indian electronic goods include USA (14.8%), Singapore (8.2%), UAE (8.2%), Germany (6.7%), Hong Kong (5.8%), and Netherlands (4.9%). In the case of imports too, Asian countries (74%) were the largest import sources for India, in the year 2009-10, followed by European Union (13%), America (8%) and Middle East (2%).
CHALLENGES AND STRATEGIES
CHALLENGES
Small Size / Scale of Operations
The size and scale of operation of majority of electronic manufacturing
units in India are small compared to global standards. This leads to non-operation of economies of scale in terms of cost disadvantage in production (low capacity translates into higher per unit cost), as well as catering limited ability to adhere to supply commitments. Non-operation of economies of scale offset the overall advantage of low-cost labour imanufacturing. The skewed tax structure in favour of small scale units had encouraged establishment of more small scale units in various locations across the country.
Low Level of Component Base
The Indian electronics components industry is restricted to passive components. Even here, relatively larger presence is only in few sectors. The low domestic volumes and import / customs procedures and regulations do not encourage stock and trade of components. In the case of mechanical parts, suppliers do exist with technical capability. However, the industry has not positioned itself to cater to the needs of high-volume customers and would need substantial up-gradation of management skills. Also, to cater to the emerging needs of semi-conductors industry, in all areas of manufacturing, including the Government sectors such as defence, space etc., it is essential that this area be given a major thrust under government policies.

29
Challenges Associated with Supply Chain and Logistics Management
While inadequate (roads, ports) and high cost of infrastructure (power) hinders the competitiveness of the Indian electronic industry in international market, the challenges of supply chain management and logistics solutions, which are essential for timely delivery of electronic products, are also affecting the competitive landscape of Indian electronics industry. While significant progress has been made in improving the Turn-Around-Time (TAT) for delivering products via road, it is yet to be streamlined to the international levels of 15-20 minutes as compared to a day or two in India.
Challenge of Shorter Product Life Cycle
New technologies, changing standards and shorter product life cycles constantly challenge the manufacturers of electronic goods. This challenge is also extended upto the vendors of capital equipment and machinery that are used in producing electronic goods. The vendors have to match short product cycles through quick response to changing technologies by producing equipments that will cater to production of new generation products. For example, communication equipments manufacturers are scrambling to bring to the market with products
embracing new technologies such as wireless Internet. Consequently, they bring to the market initial versions of products while revised versions are still under design. Test equipments vendors following this market are also forced to provide test equipments that can be easily upgraded in the future to accommodate revisions in specifications. Sometimes, the equipments need to be designed to accommodate the addition of emerging technologies. All these call for a high level of open systems design, modularity and flexibility in hardware and software architecture.
Low Level of Technology Absorption
The low volume of production implies that any capital equipment with a given technology used by an Indian company is not optimally utilized; while its physical life lasts for a longer time, technologically they become obsolete in a short span of time, calling for modernization and upgradation. Yet, most of the Indian companies prefer not to go for new technology / capital equipments as they are costly proposition in view of sub-optimal utilization of capital equipments.
Limited Facilities for Standards and Testing
In electronic hardware segment, technology is changing rapidly. Most of the countries in the world have laid

30
down standards for new products to ensure that low quality products are not dumped into the country. India has limited standard and testing facilities in the country and also have limited number of well-equipped labs (such as Electronic Regional Test Laboratories, and Society for Applied Microwave Electronics Engineering and Research). Electronic equipments need to perform properly at all times, and especially under adverse conditions, emergencies, or disasters. Achieving compliance to certification requirements will turn out to be difficult without adequate number of testing and standards facilities. Setting up of modern testing labs will help electronic product designers and manufacturers in achieving their compliance requirements as quickly and efficiently as possible.
Grey Market
Unlike black market goods, grey-market goods are not usually illegal. Instead, they are sold outside normal distribution channels by companies which may have no relationship with the producer of the goods. Frequently this form of parallel market occurs when the price of an item is significantly higher in one country than another. This situation is commonly prevalent with consumer electronic items. Traders buy the products where they are available at low cost, often at retail, but sometimes at wholesale, and sell at a price high
enough to provide a profit but below the normal market price. Because of the nature of grey markets, it is difficult to track the precise volume of grey-market sales. Grey-market goods are often new, but some grey market goods are used goods. A market in used goods is sometimes nicknamed a Green Market. According to industry estimates, the worst affected segments are premium watches, gaming consoles and digital cameras. As per some estimates, the grey market for premium watches is almost 50% of the total sales. While the grey market accounts for 30% of the gaming console market in India, it is 25% in the digital camera market.
Managing E-waste
As the demand for electronic goods is increasing, so is the challenge of managing the E-waste. E-waste means electronic goods that are no longer in use or may not be re-usable, including computers, home appliances, clocks and watches, electronic toys, medical devices and industrial equipments. According to some estimates, Mumbai tops the list of cities with around 12,000 tonnes of E-wastes, followed by Delhi (around 10,000 tonnes), Bangalore, Chennai, Kolkata and Ahmedabad (around 4,000 tonnes each). Though the challenge of managing E-waste in India is at a nascent stage, this may turn out to be a serious challenge at a later stage.

31
Low R&D Intensity
India is heavily dependent on imports of electronic goods, from countries like the U.S. and China, to meet its domestic demand. Lesser spending on research and development by electronics industry has increased India’s dependence on electronics imports which has been growing over the years. India has very low share in the total expenditure on R&D compared to other countries. While India’s share on R&D expenditure was 0.88% of GDP, China held a share of 1.44%. Israel was the country with the largest share in R&D expenditure with a share of 4.86%. The R&D intensity of electronic industry was 0.73% during 2009-10.
Low Penetration of Distribution Network
Due to the inadequate world-class infrastructure facilities in India, distribution of electronic goods across the country poses a great challenge. High cost of moving goods and inefficient storage adds to the problem. Not so well-developed distribution networks make the distribution challenging to penetrate the fastest growing rural areas economically. In addition, regular power cuts and poor road linkages make systematic production, assembly and delivery a challenging proposition. India also has limited availability of proper
storage and warehousing facilities in the rural parts of the country.
Shortage of Skilled Labour
The Indian electronics industry is undergoing a lot of changes with the advent of new technologies, new product standards and new emission norms. India has shortage in skilled labour in the electronics industry. Not enough industry-ready trained personnel are available. The talent pool is also concentrated in a few metros, and attracting such talent to Tier II cities and small towns is a difficult task. High attrition rate, due to the small pool of talent available, is another challenge faced by the industry. As the industry readies for a major growth in the future, it is imperative for the players, as also the policy makers to look at developing skills to meet the increasing demand.
Low Value Addition
Indian electronic industry faces the challenge of low value addition. Usage of electronics is pervasive in many other sectors as well, like automobile, aviation, etc. As the domestic electronic industry is not having a strong manufacturing base, most equipments are imported with hardly any value addition being done in India. R&D plays a very important role for value addition in the country. However in India R&D intensity is very low.

32
Complying with Environmental and Social Standards
Most Indian electronics goods are considered as relatively inferior in global markets. Limited awareness about environmental and social standards and the cost involved in obtaining the globally recognized certifications are the major reasons for limited number of manufacturers adhering to such standards.
STRATEGIES
Rapid Customer Response
To keep a step ahead of the competition, companies know that they must satisfy their customers’ changing demands - whether their customers are end-users or other industry suppliers. This means maintaining a customer-focused, forward-looking business strategy and keeping abreast of new standards and new technology developments. The solutions should address the complete range of requirements for organizations that are focused on ensuring quality of service (QoS)-starting from research and development (R&D) organizations to manufacturing, engineering, operations, information technology, and sales and marketing fields.
Adherence to Quality
Quality is a driving factor in the electronics goods industry - starting from end-user service providers all the way back to the development laboratories of the equipment manufacturers. Enterprises can gain competitive advantage only through offering unique products and services. Efforts should be made to concentrate not only on research and development but also in the adaptation of already existing technology to build distinctive technical competence and develop superior products and services.
Effective E-waste management
According to a Report by Centre for Environmental Studies, the best option for dealing with E-wastes is to reduce the volume of E-waste. Designers should ensure that the product is built for re-use, repair and/or upgradeability. Stress should be laid on use of less toxic, easily recoverable and recyclable materials, which can be taken back for refurbishment, remanufacturing, disassembly and reuse. Recycling and reuse of material are the next level of potential options to reduce E-waste. Recovery of metals, plastic, glass and other materials reduce the magnitude of E-waste. These options have a potential to conserve the energy, and keep the environment free of toxic material that would otherwise have been released.

33
Also suggestions were given on salvaging and combining usable parts which could be salvaged with other used equipment to create a working unit. It is labor-intensive to remove, inspect and test components and then reassemble them into complete working machines. Institutional infrastructures, including E-waste collection, transportation, treatment, storage, recovery and disposal, need to be established, at national and/or regional levels for the environmentally sound management of E-wastes. These facilities should be approved by the regulatory authorities, and if required, to be provided with appropriate incentives. Establishment of E-waste collection, exchange and recycling centers should be encouraged in partnership with governments, NGOs and manufacturers.
Ministry of Environment and Forests, Government of India has announced E-waste (Management and Handling) Rules 2010 for handling of E-waste by defining the responsibilities of stakeholders such as producers, dealers and recyclers among others. According to the E-waste (Management and Handling) Rules 2010, the producer of electronic goods, including household appliances, computers, toys and medical equipments shall be liable for collecting any E-waste generated while manufacturing, and will have to channelize it for recycling. In fact,
the producers’ responsibility will go beyond the boundaries of the manufacturing unit. They will set up collection centres for E-waste generated from `end of life’ of their products in line with the principle of `extended producer responsibility’ and ensure that such E-waste is channelized to a registered refurbisher. They shall also finance and organize a system to meet the costs involved in handling the E-waste. The rules moot a unique serial number or individual identification code for product tracking in the E-waste management system. Dealers have to make provision for collecting used appliances. Besides registering themselves with the respective State Pollution Control Boards, they will have to submit details of the collected waste annually. Even the consumers are expected to do their bit by ensuring that the electronic equipment, not fit for use, is deposited with the dealer or authorized collection centre.
Emphasizing the reduction in use of hazardous substances (RoHS) in the manufacture of electrical and electronic equipment over a three-year period, the Rules state that producers are expected to adhere to the prescribed minimum threshold limits to using such substances. Further, the import of used electrical and electronic equipment for charity shall not be allowed in the country, the Rules state. Further, the stakeholders shall be liable for any damage caused

34
to the environment or human health including third parties due to improper handling and disposal of E-waste. They shall inform the authorities of such damage and undertake to reinstate or restore the damage at their cost, failing which they shall be liable to pay the entire cost of remediation or restoration of the environment. Even the consumers shall be liable to deposit the E-waste with an authorised dealer or collection centre, failing which they shall be liable to pay a fine as specified for violation of the provision.
It may be mentioned that EU has already issued two directives, in 2006, one on Restriction of Hazardous Substances (ROHS), and the other one on Waste Electronics and Electrical Equipment (WEEE). The WEEE aims at management of electronics waste, especially the reuse, recycling and other forms of recovery of such wastes so as to reduce the disposal of waste. The Directive also seeks to improve the environmental performance of all operators involved in the life-cycle of electrical and electronic equipments, including the operators directly involved in treatment of electronics waste.
Establishing ‘National Electronics Mission’
A high-level Task Force for the Information Technology (IT) industry has recommended constitution of
‘National Electronic Mission’, a nodal agency for the electronics industry under the Department of Information Technology, Government of India, with direct interface to the Prime Minister’s Office (PMO). The Task Force has said that this nodal agency would help in the synchronized functioning of the industry through effective coordination across various ministries and Government departments. The main functions of the nodal agency would be to attract investments into India, promotion of Brand India, facilitating business in India, managing R&D fund and manufacturing of value added products. Some of the other recommendations which were given by the Task Force include: building of adequate basic, business and social infrastructure; favourable business policy and regulatory environment; fostering a sustainable ecosystem for innovation, R&D and manufacturing; and maintaining globally competitive tax regime.
Research & Development
India is heavily dependent on imports of electronic goods from countries like the U.S. and China to meet its domestic demand. Lesser spending on research and development by electronics industry has increased India’s dependence on electronics imports, which have been growing over the years. Hence, it is important to strengthen and develop the Research and Development programmes in the electronics industry. This will help in

35
improving the domestic electronic industry and will also promote the ‘Brand India’ products. Also through regressive research, India would be able to reduce its import dependency of electronic goods from other countries.
India has very low share in the total expenditure on R&D compared to other countries. While India’s share on R&D expenditure was 0.88% of GDP, China held a share of 1.44%. Israel was the country with the largest share of R&D in national GDP at 4.86%. The R&D intensity of electronic industry was 0.73% during 2009-10.
According to the Task Force on information technology industry, India should also focus on new and emerging areas that are likely to grow in importance over the next few decades. Some of the opportunities analyzed by the Task Force are in the areas such as: climate change and energy efficiency solutions, mobile software applications, and end to end clinical research applications.
Department of Information Technology, Government of India, has constituted a specialized group - R&D in Electronics - to conduct sponsored R&D activities across India at various academic institutions of higher learning and R&D laboratories, in the areas assigned to it through a variety of Plan programmes. The sophisticated projects assigned to the groups cover
key technological areas, such as developments in Nanotechnology, Medical Electronics, Microelectronics and Industrial Electronics. The major R&D initiatives of the Group has been in the development of Linac tubes, Automation and Intelligent Transportation Systems (ITS) technology, setting up of Nanoelectronics centers and Generic Nanometrology facilities. The industry should also focus on more R&D related activities.
Thrust to Semi-conductor Industry
India has an edge in semiconductor design, embedded systems and has the potential of becoming an engineering design house for the world. Combining with its software strength, Indian embedded technology is globally acclaimed and accredited. With increasing demand for domestic electronic goods and the availability of a pool of talented engineers, India is fast creating a footprint on the semiconductor roadmap. The Indian semiconductor industry is currently dominated by players engaged in chip designing activities.
As the semiconductor industry is going through the transition phase to newer technologies, semiconductor manufacturing and IC (integrated circuit) design are becoming increasingly interdependent as neither activity can be carried out without in-depth knowledge of the other. Coupled

36
with this is the fact that embedded software forms a significant part in the design of today’s System-on-Chips, where India is already seen as a leader.
India has to complement design and R&D expertise with local manufacturing, which would help in increasing the value addition. Global demand for semiconductors is growing, and therefore, if India can integrate its chip design services with fabrication facilities, it can result in growth of competitive manufacture of electronic products and thereby help achieve success in the domestic as well as global markets.
Developing and Improving ICT Interface in India
According to Telecom Regulatory Authority of India during 2009-10, the broadband subscriber base increased from 6.22 million to 8.77 million and the internet subscriber’s base increased from 13.54 million to 16.18 million over the previous year. The gross usage of Internet Telephony was 122.96 million minutes in 2009-10.
It may be mentioned that Information and Communication Technology (ICT) is changing the face of the contemporary world. The ICT has not only connected the world at one
single platform, but it is also helping the integration of various traditional societies into modern societies. Information and communication technology plays a very important role in the development of an economy especially because it addresses the problem of digital divide. More importantly, ICT enabled solutions can overcome the difficulties that hamper traditional solutions.
ICT enabled services are very important in all the major sectors of the economy such as manufacturing, education, healthcare, financial services and public services. ICT helps manufacturing sector because it has the potential to contribute towards income generation and poverty reduction. It enables countries to capture economic opportunities by increasing process efficiencies, promoting participation in expanded economic networks and generating opportunities for job creation. Development of ICT infrastructure and connectivity are one of the main indicators that investors look for as an indication of technological development in a country. Enhanced ICT interface helps the manufacturing companies fit seamlessly into value chain of multi-national corporations easier. Hence it is very essential to have ICT interface in the manufacturing sector. This would also enhance the demand for electronics products.

37
Brand Building Initiatives
More efforts should be taken by the manufacturers and sellers of electronic products in the country, to build ‘Made in India’ brand. Currently, in the global electronic industry, Indian products have limited level of competitive brand perception. Marketers see a brand as an implied promise with desired level of quality expected of from a product, which will enable them to continue with future purchases of the same product. This may increase sales by making a comparison with competing products more favorable.
Brand development is more important these days because customers have started becoming more conscious of the products they buy, and they are expecting products with good quality and standards. The advantage of branded products is the assurity that the quality will be good. Hence, Indian electronic firms should increase their focus on brand development and management, as it will help to create desirability in international markets for products manufactured in India. Further, the firms may strengthen the ‘Incredible India’ branding campaign and run it regularly through key international media.
Developing Market Sustenance
In order to be ahead of the competition, it is necessary for the Indian electronic
industry to aggressively handle the market and adopt measures for market sustainability. The Indian electronic firms should be able to identify the changing consumer needs and the industry standards so that they are in a better position competitively. They should also concentrate on taking care of the customers with sensitivity, speed and responsiveness by establishing effective channels of distribution and reaching out to them. This would help in building relationships for long-term sustenance in international market.
Also, Indian electronic industry should concentrate more on providing new generation products that maybe in demand in future. For example, Nanotechnology, which is widely regarded as the next technological revolution, has attracted the attention of scientists, researchers and technologists all over the world and is likely to have a profound effect on almost all industry sectors and application areas in the coming years. Department of Information Technology, Government of India, has taken measures for promoting emerging areas of technology like RFID (Radio Frequency Identification), smart cards, ubiquitous computing, perception engineering, scientific computing, nanotechnology, digital preservation and M-Commerce initiative.

38
Cluster Development
Micro, small and medium enterprises (MSME) sector has been recognized as an engine of growth all over the world. The sector is characterized by low investment requirement, operational flexibility, location wise mobility, and import substitution. Over the years, the small scale sector in the electronic industry in India has progressed from the production of simple consumer goods to the manufacture of many sophisticated and precision products like electronics control systems, micro wave components, electro medical equipments, etc. The process of economic liberalization and market reforms have further exposed these enterprises to increasing levels of domestic and global competition. The formidable challenges so generated for them have led to a novel approach of cluster development for the sector. As a result, private and public sector institutions, both at the Central and State levels are increasingly undertaking cluster development initiatives.
The major advantages of a cluster are the availability of common opportunities, which help them in creating a conducive ground for the development of inter-firm cooperation to promote collective production, collective innovation and collective learning. One of the major disadvantages in India is the technological and infrastructural
challenges. Cluster approach will help in meeting these challenges by creating an atmosphere of common infrastructure, technology and opportunities. Also, all companies may not have all the necessary skills to develop unique products and services by themselves; therefore cluster approach would serve this purpose and would also become the sources for increasing income, jobs and export growth. Clusters arise because they increase the productivity with which companies can compete. The development and upgrading of clusters is an important agenda for governments, companies, and other institutions. Cluster development initiatives are an important new direction in economic policy, building on earlier efforts in macroeconomic stabilization, privatization, market opening, and reducing the costs of doing business.
Clustering of technology companies in an area is very beneficial to developing new industries in a country. Taiwan is an illustrative success story. Taiwan’s Hsinchu Science Park, spread over 600 hectares has clusters of most of the semiconductor component manufactures, thus saving on time and cost for assembly. This Park includes independent wafer foundries, IC design companies, fabricators, as well as packaging and testing companies for the semiconductor industry, all at one place. The model is now being replicated by China and Malaysia as

39
well. In such clusters, one can find trained people more easily and form inter-relationships between suppliers and vendors that make development of products faster, cheaper, and even lead to better innovations. Most countries have typically evolved clusters naturally over a time period. India should also follow such models for the better development of the electronics industry.
Improved Standards and Testing Facilities
In electronic hardware segment, technology is changing rapidly. Most of the countries in the world have laid down standards for new products to ensure that low quality products are not dumped into the country. In Taiwan the Industrial Technology Research Institute (ITRI) helps the electronics industry to expedite the development and upgrading of new industrial technology.
Also, in the growing electronic industry, there is a strong need to evolve/adopt EMC (Electromagnetic Compliance) standards that are acceptable worldwide in order to avoid trade barriers. Limited awareness of such standards and compliances led to sub-standard and spurious products being dumped into the market. Many countries are using standards as non tariff barriers in order to restrict the imports of products from non-complying firms / countries. Dumping
is also creating grey market and thus the local manufacturing industry would get affected. Therefore, there is an urgent need to have Indian standards matching with international standards for all Electronics / IT products, which should be mandated to be followed for manufacture, imports and exports. For global trading of Indian products, it is essential that these products not only meet international EMC (Electromagnetic Compliance) standards but are also complying with other such standards.
India should also follow Taiwan’s example and develop similar standards and testing facilities, so that Indian products have global acceptance. This would help the industry grow and would enhance the acceptability of Indian products not only in advanced countries but also in the fast emerging markets of third world countries. Efforts may also be required to enhance the awareness of EMI/EMC (Electromagnetic Interference/ Electromagnetic Compliance) aspects for both users as well as manufacturers. If EMC (Electromagnetic Compliance) implementation is taken care of at an early stage of design, the increase in cost will be marginal. Apart from this, there is also a strong need to evolve and harmonize occupational stand-ards against EM (Electromagnetic) radiation to ensure against the health hazards of the end users of electrical and electronic goods. In India, EMC

40
compliance certification scheme, is followed to ensure standards to the products that are manufactured, exported and imported.
Technology Development and Sourcing
Indian electronics industry needs support from the Government including through financial, fiscal and infrastructural resources for strengthening manufacturing ability and R&D. Indian firms must focus on acquiring technology through mergers and acquisitions and acquire manufacturing plants of established companies from other countries. This has been followed by many emerging Asian economies as it is very cost effective, which also ensures continuous technology flow. Countries like Taiwan have integrated their public and private sector to establish highly efficient electronics manufacturing environment. Hence, Indian electronic industry should also bridge the challenges of financial, technological and infrastructural resources through public and private partnerships.
Skill and Human Resource Development
In order to achieve the plans of raising production, mastering the sophisticated technology, and for achieving market leadership, it is necessary to have adequate human
resources with skills, knowledge and resources. It may be mentioned that competent manpower would ultimately give the players the competitive edge. This competence, defined in terms of ability to achieve predetermined goals, must be supplemented with a conducive environment for work and systems that enable employees to perform better, and processes that help them to ensure maximum productivity at work place. It is necessary to develop skills in the human resources matching with the latest technological innovations. Hence, steps should be taken to impart training in human resources that lead to skill development based on evolving consumer demand.
Capturing the Rural Market
India’s rural market provides a huge demand base, with more than 720 million consumers spread across 627,000 villages. Furthermore, their per-capita income has been rising at a consistent growth rate of more than 4 percent, which has resulted in increasing disposable incomes. The penetration of various electronic products is still very low in rural areas, proving huge growth potential. This is corroborated by the fact that penetration levels in India for consumer electronics products such as refrigerators, VCD/DVD players and set top boxes (STBs) are at 19%, 7% and 2.5% respectively, most of which is contributed by urban areas.

41
Hence, the focus on rural areas has become even more important.
Electronics companies operating in India have started developing plans to tap the rural market. They are undertaking initiatives to strengthen dealerships and distribution channels in these areas to increase the penetration of their products. Furthermore, they are aiming to provide affordable and customized products to suit the needs of rural people. Some manufacturers have announced plans to make significant inroads into rural markets through channel expansions, establishing a services network, and rolling out a slew of entry-level products. With rural and suburban markets gaining importance, such innovative strategies would help electronic product companies to tap the potential offered by these markets.
More Support to Telecom Equipment Sector
Globally, Governments have created a supportive policy framework to encourage their telecom equipment manufacturing and R&D. China has been actively supporting its telecom industry and has been providing significant support in the form of incentives and lines of credit, and thereby stimulating their exports. This has helped the Chinese electronics companies to expand their domestic business and has enabled them to
use their home market as a base to achieve competitiveness globally. The Chinese Government has also been proactively pushing for telecom exports as a part of their bilateral trade and use telecom exports as a key area for bilateral trade growth.
Israel, with just about 200,000 technology professionals, has been able to create R&D driven companies, exporting telecom equipments globally. Israel has set up funding for R&D expenses of Israeli companies to the extent of 50% of their expenses to help them to become global technology leaders. The grants are provided as conditional loans subject to royalties of about 3%-5% of sales payable only in the case of technology and commercial success.
Brazil applies state taxes and charges for importing electronic products that can double the actual cost of importing products into Brazil. Brazil only allows the import of such products if they are not produced domestically. The Government of Brazil offers a variety of tax, tariffs and financing incentives to encourage production for export and the use of Brazilian made inputs in domestic production. Brazilian National Bank for Economy and Social Development (BNDES) provides long term financing to Brazilian industry through different programmes. Regulations allow a Brazilian state enterprise to subcontract services to a

42
foreign firm only if domestic expertise is not available.
ICT in Canada is one of the most invested sectors, representing almost 40% of the total investment. The Canadian Government encourages R&D through generous R&D tax credits to help drive innovations and through direct support of research sectors.
Finland’s Public Policy, implemented in the course of last two decades, has played an important role in reinforcing the country’s innovative capacity, by creating adequate framework conditions for innovation. Important investment in R&D, together with the establishment of an effective network of public agencies, supporting public and private R&D, and a cluster based approach to innovation, have encouraged numerous interaction and knowledge and technology transfers amongst small and larger firms, service providers, research institutes and universities. Finnish trade and investment policies have enabled trade and investment liberalization in the last two decades and have also significantly contributed to fostering adequate framework conditions for innovations in Finland . India should also follow similar ways to encourage its telecom sector.
Based on the public-private partnership model, quite a few Centres of Excellence (CoEs) have
also been set up in India for the benefit of the industry. Funded by the Government, these CoEs aim to provide high-quality training, undertake advanced research, and develop globally competitive tools within a defined timeframe. The focus is on technology development and transfer, path-breaking scientific research, development of trained human resources, and economic outreach. CoEs have been set up in the areas of telecom, wireless technology, bioinformatics, lasers and optoelectronic devices and nano-electronics. India should focus on improving and developing these Centres of Excellence and thereby achieve product excellence.
Promotion of Intelligent Manufacturing
Significant engineering skills, with the combination of hardware, software and system integration skills are required in the evolution stage of advanced technology products. This niche area is called intelligent manufacturing. These are usually high tech products which provide high value addition but low volumes in highly quality conscious capital goods sector. India has a competitive advantage in this sector where a large proportion of value addition is through software and system integration. According to a Strategy Paper on ‘Doubling Exports in Next Three Years (2011-12 to 2013-14)’, prepared by the Ministry of Commerce and Industry, Government

43
of India, establishing joint ventures with Chinese companies which have manufacturing strengths and substantial market share in third world countries, would help in increasing high tech exports in the short term to developing countries in Africa and the Middle East.
Promoting Repair/Reconditioning/Refurbishment of Electronic Goods
According to the Strategy Paper on ‘Doubling Exports in Next Three Years (2011-12 to 2013-14)’ prepared by the Ministry of Commerce and Industry, Government of India, the American market for repair/reconditioning/refurbishing of electronic goods is estimated to be US $ 10 billion annually. The EU market size is of the same order. The major countries servicing the American market are China, Vietnam, Philippines and Thailand. India has a few large emerging companies which are beginning to provide these services but the combined turnover is of the order of only US $ 5 million. India should take refurbishing business as a big opportunity because Indian workers are recognized as having better diagnostic skills and would thus enjoy core competence in the area of repair and re-export. Additionally, India has very good brand equity in the US due to the excellence in the software sector. Accordingly, Ministry of Commerce has suggested in their
Strategy Paper on ‘Doubling Exports in Next Three Years (2011-12 to 2013-14)’ that an export volume of US $ 1 billion can be targeted in the US market over the next three years (creating 5 lakh jobs) by merely simplifying the procedures for one-to-one co-relation of units like laptops, mobile phones, mother boards, memory cards, etc. (having features such as unique identification numbers) at the time of import and re-export.
Simplification of customs procedures
After the signing of the ITA-1, the electronic hardware sector was the first sector to open up with zero duty on most items, as also reduction in overall duty rates. However, the customs procedures have undergone with limited simplification, according to the Strategy Paper on ‘Doubling Exports in Next Three Years (2011-12 to 2013-14)’, prepared by the Ministry of Commerce and Industry, Government of India. The Paper has suggested that all raw materials, components, intermediate products if imported by an excise-registered manufacturing unit should be allowed at zero duty based on self-declaration. The local excise range, with which these units are registered, can ensure that there is no misuse. In other words, the customs procedures should move from a refund regime to a self-declaratory regime as is the case with excise duties. This will go

44
a long way in reducing a major non-tariff barrier faced by the electronic goods exporting units.
Effective supply chain and logistics system
Firms in India need to create strong linkages with their logistics and supply chain partners to succeed and to pave the way for a better future. Adopting these initiatives first and foremost requires taking a long-term view and having an extensive focus on all the channels in the total transformation process to create a productive and reliable supply chain. Transportation and logistics are getting due attention and as a result some good third-party and fourth-party logistics service providers have emerged.
Government may consider improving the infrastructure for better functioning of various supply chains. Firms and their supply chains need to closely integrate themselves into a network, carefully manage the complexity that ensues, align their business strategy with logistics and supply chain operations, and leverage information and communication technology with process improvement, and pioneer operational innovation for superior performance. They also need to rigorously measure and monitor critical operational performance metrics such as customer service, responsiveness, supply chain costs, asset utilization, product quality and operational flexibility in order to
achieve overall business success. Adequate supply chain and logistics system will ensure timely delivery of electronic products and will provide a better competitive landscape of Indian electronics industry.
Grey Market
One of the ways of fighting grey market is to conduct awareness and educate customers against piracy and counterfeit products through interactive events, PR and advertising. Consumers need to be made aware of the perils of using counterfeit/pirated goods. Apart from this, development of solid strategies and formal policies for appropriate channel management is very essential. Higher taxes are considered as reasons for the flourishing grey market in India. Measures should be taken to combat this issue. Also, legal protections such as coding the products should be adopted to reduce the challenge of grey market.
Conclusion
Electronic industry is one of the most globalised industries in the world with the conclusion of ITA under WTO. The industry serves significantly in productivity and creativity in the manufacturing sector. Many countries, especially in Europe and ASEAN, have identified electronic industry as one of the thrust areas for national growth and development. India is also

45
a signatory to ITA, and India has also placed greater thrust on this industry for developmental growth.
The market for electronic products in India has witnessed significant growth in recent years due to several factors, such as manufacturing growth, ICT penetration, growing disposable income, retail boom and attractive finance schemes. Following the global slowdown, the demand for electronic products has come down, as also the production in the domestic market.
The total PC (Personal Computer) sales during 2009-10 was 8.03 million units, including desktop computers and notebooks (including netbooks); the sales is expected to have registered a growth of about 18.2% in 2009-10 over the year 2008-09. Out of the total PC sales, the total sale of desktops was 5.52 million units, and that of notebooks & netbooks at 2.51 million units. During 2010-11 the total PC sales is estimated to be 9.76 million units, of which 6.20 million units included the desktop sales and the rest 3.56 million units included notebooks and netbooks sales. While desktop sales is expected to increase by 12.3% in 2010-11 over the previous year, that of notebooks & netbooks is expected to decrease by (-) 41.8% over 2009-10. The overall consumption in the PC market was led by telecom, banking and financial service sectors, education and households segments.
In the consumer electronics segment, several products, which have low market penetration level, or at a nascent stage of product life cycle (such as DVD players, MP3 players, I-Pods, digital cameras), have tremendous growth potential. Availability of low-cost software for such products is one of the reasons for the growth in this segment of consumer electronic industry in India. The colour television industry, which is largest segment of consumer electronics industry, is witnessing a segmental shift from conventional colour TVs (CCTV) to Flat colour TVs (FCTV). Reduced focus on the CCTV segment, aggressive price reduction in the FCTV segment and declining price difference between the FCTV and CCTV segments are driving the shift. Various strategies are being adopted by colour television manufacturers to combat the financial crisis. The firms are increasingly focusing on expanding the market share and reach in rural markets, and launching of new versions / products, which is expected to push the volume of sales of high end TVs like LCD, Plasma and RPTV (rear projection TV). This segment has also started showing an increase in its demand over the years from 1.5% in 2006-07 to 6% in 2008-09.Within the high-end colour television industry space, the LCD television market continues to grow at a faster

46
pace. According to the Department of Information Technology, in 2009-10, the LCD TV market is expected to have expanded to 1.40 million units, an increase of 57% over the previous year. The price decline due to lower import duty on LCD panels and the introduction of smaller entry size models have widened the consumer base for LCD TVs. This upsurge in LCD TV growth is likely to result in 2.7 million to 3 million units in 2010. Supporting a strong projected LCD TV sales were IPL cricket, FIFA world cup and Cricket world cup. The surge in demand for LCD TVs is resulting in substantial increase in the value share of this segment of the colour TV portfolio of major companies.
In India, the market size of medical electronic instruments is expected to grow in the years to come with increase in number of people affected by lifestyle diseases. Also more and more new applications are innovated in the area of monitoring of healthcare, as also remote technologies, including telemedicine. Apart from these segments, new applications (technology controlled operations) in manufacturing sector would also
increase the demand for electronic products in India.
The market size of the electronic industry is projected to exceed US $ 150 billion by 2015. According to Ministry of Commerce and Industry, Government of India, the export performance of electronic goods is expected to be US $ 15 billion by 2013-14. In order to achieve this level of growth, India needs to concentrate and focus more on designing and manufacturing global products, and then reach out to the rural areas in the domestic market, and emerging export markets. Also, India should leverage its strengths in software to build high-complexity, but medium-volume products, for the global market. Further, the Indian industry should focus on inventing mass-products that matter to rural and bottom of the pyramid segments. The demand for appliances and energy efficient consumer electronics is huge and can be explored by the Indian electronic industry. Increasing R&D intensity should be a joint approach of both Government and industry. With such strategies, Indian electronics industry would excel both in domestic and international markets.

47
1. INTRODUCTION
Worldwide, the electronic industry is one of the most flourishing and extremely diversified sectors, growing at a rapid pace with the invention of innovative technologies and growing customer inclination towards electronic goods and services. The industry has been experiencing phenomenal and remarkable changes over the years, and is being distinguished with fast technological advances than other industries. Some of the major factors governing the growth of the global electronic industry are:
Continuous R&D in the industry, leading to increased productivity and higher value added electrical and electronic products;
Rising incomes and living standards that have resulted in growth in demand for electronics, especially consumer electronic products in the world;
Rapid pace of innovation in electronics technology that has resulted in a consistent demand for newer and faster products and applications;
Increasing applications in several end-user sectors such as medical, telecommunications, industrial and automotive sectors;
Increased investments, especially foreign direct investments and technology transfer that have resulted in accelerated growth in terms of electronic production and exports.
The key segments of the electronic industry are:
Electronic components industry: Comprising various establishments engaged in designing, manufacturing, marketing, supporting, selling and distributing of broad range of electronic components, such as semi conductors, integrated circuits, microprocessors, cables and wires, switches, sensors, keyboards, sockets, timing devices, laser modules, lighting, solar devices, test and inspection equipment, scientific and technical instruments etc.;

48
Computer and office equipment: Consisting various establishments engrossed in manufacturing and supplying of assorted range of computer hardware, peripherals, and office equipment;
Telecommunications: Can be divided into two main sub sectors i.e. communications equipment and communication services.
Consumer electronics: Constituting units involved in designing, manufacturing, marketing, and distributing of audio, video, and games
products. Some of the consumer electronics products are televisions, stereos, speakers, video recorders, CD players, radios, cameras, wireless devices, kitchen appliances etc.;
Industrial electronics: made up of various establishments committed to designing, developing, manufacturing and selling of broad range of electronic components and systems used in equipment and automated processes serving in an industrial environment.

49
2. GLOBAL SCENARIO
The worldwide electronic industry is experiencing phenomenal and a remarkable change through fast-growing technological advances. which have been contributing to the growth of the industry over the years. The growth cycle of global electronic industry may be categorized as given in Exhibit – 1. It may be noted that since 1990s, and especially from 2000 onwards, the growth in global electronics industry has been contributed by growth in internet, telecom penetration and newer applications in industrial segments.
Growth cycles and electronics pervasion are the roots of such a rapid development. Initially, driven by
Government applications in the 60s and 70s, then by private enterprises in the 80s, and later by growth of new applications since the 90s, the electronics industry is re-inventing itself due to massive R&D investment, which translates into permanent new product introduction.
Today, new societal needs in energy, security and even health are relying on electronic solutions that are still to be developed, providing long-term growth perspectives for the overall industry for the next decades. Although the electronics industry demonstrates more mature growth profiles, it is still a young industry with major growth perspectives ahead.
Exhibit – 1 : Growth Cycle of World Electronics Industry

50
PRODUCTION
World electronics production is estimated to be Euro 1.13 trillion in 2008. Telecom and data processing equipments are the two largest segments of world electronic production accounting for 25%, and 21%, respectively, of total production in the year 2008. Industrial & medical electronics accounted for 18% share and audio-video equipments accounted for 15% share in world production of electronics. Automotive (8%), aerospace & defence (7%), and home appliances (6%) are other sub-sectors in electronic production. (Exhibit: 2)
Exhibit: 3 shows the estimated growth
in production of electronics by 2013 in comparison with 2008. The analysis reveals that in 2013, the total world production is expected to grow at a CAGR of 2.7%. The major difference among the growth in geographical areas will be their capacity to recover from the recent market downturn. To this respect, China is expected to outperform other regions.
China (growth of 7%) is expected to show the highest growth followed by Other Asia Pacific countries (5.8%). Europe and North America is expected to show deceleration in their production owing to the recovery phase after the economic recession. The importance of North America in global electronics production is also
Source: Decision: Etudes Conseil
Exhibit – 2 : Segment-wise Production of World Electronic Industry 2008

51
Exhibit - 3 : Estimated Growth of Electronics Market in the World (2013 vs 2008)
Source: Decision: Etudes ConseilNote: North America includes USA, Canada and Mexico
Source: Decision: Etudes ConseilNote: North America includes USA, Canada and Mexico
Exhibit - 4 : Estimated Growth in Production of Electronics in the World(2013 vs 2008)

52
declining as Asian countries have started dominating the electronic industry scenario.
Production is expected to grow by 3% in 2013 with the Asian countries likely to dominate the market space. Other Asia pacific countries and China are expected to show the highest growth of 7.1% and 6.9%, respectively. Production in 2008 was estimated at Euro 778.4 billion, which is expected to grow to Euro 898.6 billion in 2013.
Major Production Centres
Region-wise production of electronics reveal that Asian countries dominate the production scenario of electronics in the world, with China being the
largest producer, with 26% share in total world production, followed by Europe (22%), North America (18%), and the rest of Asia and Pacific with 16% of total production in 2008. Even though Asian countries have been dominating the production scenario, developed economies have not disappeared from the electronics industrial landscape. Europe and North America still stand at 2nd and 3rd positions, respectively, in terms of electronics production in the world, together representing up to 40% of the world electronics production in 2008.
China has become one of the largest producers of electronic goods recently, and has also become one of the largest
Exhibit - 5: Region-wise production of World Electronic Industry 2008
Source: Decision: Etudes Conseil

53
exporters in the world. In the Asia Pacific region, Japan, China, Taiwan, India and Singapore are the principal manufacturing hubs for electrical and electronic products. Among the Asian countries, China is becoming the manufacturing hub of electronic products in the region. The key electronic manufacturing provinces in China include: Guangdong, South Jiangsu, Shanghai, and eastern part of Zhejiang. In USA, New York, Atlanta, Colorado, Detroit, Florida, New England, San Diego, San Francisco and Texas are the major hubs for electronic industry. Currently, the electronic manufacturing is
expanding in an unprecedented scale in the Asian region, reducing the importance of Americas and Europe in the electronic production.
In the Asia Pacific region, in most of the electronic sub-segments, China was the largest stakeholder followed by Japan, India and South Korea. India had market segmentation between 5% and 8%, whereas China had more than 40% market segmentation, in the year 2009, in most of the electronic sub-sectors. Table-1 gives the market segmentation of select sub-sectors of the electronic industry in the Asia pacific region.
Table – 1 : Market Segmentation of Select Sub-Sectors of Electronic Industry in Asia Pacific Region (2009)
Source: Datamonitor
Rank % Share
% Share
% Share
% Share
Computer Hardware
(2009)USD Bn
Consumer electronics(2009) USD
Bn
Semiconductors (2009) USD
Bn
Communica-tion equip-
ment (2009) USD Bn
1 China 49.9 China 43.8 China 44.0 China 49.5
2 Japan 25.0 Japan 34.7 India 24.8 Japan 31.3
3 Rest of 10.8 Rest of 8.1 South Korea 15.9 Rest of 6.7 Asia Pacific Asia pacific Asia Pacific
4 South Korea 9.0 South Korea 7.2 Japan 11.5 India 6.6
5 India 5.3 India 6.3 Rest of 3.8 South Korea 5.9 Asia pacific
Total Asia US $ 44.1 bn 100.0 US $ 64.2 bn 100.0 US $ 35.1 bn 100.0 US $ 114.3 bn 100.0 Pacific

54
OVERVIEW OF SELECT SECTORS
Consumer Electronics
Consumer electronics include electronic equipments meant for everyday use and are most often used in entertainment, communications and office productivity. Some of the major products under consumer electronics include personal computers, telephones, MP3 players, audio equipments, televisions, calculators, GPS automated navigation systems, digital cameras and playback and recording of video media such as DVDs, VHSs or camcorders. Currently the global consumer electronics market is dominated by Japanese and South Korean companies like Sony, LG, Samsung, Toshiba and Philips. According to Datamonitor, the market value of consumer electronics was estimated to be US $ 262.2 billion, in 2008, which is expected to cross over US $ 300 billion by 2013.
Computer Hardware
The computer hardware market consists of the computers, storage devices, and other devices segments. The computers segment comprises desktops and laptops; storage devices include memory sticks, CD packs, hard disks and other data storage devices. The other devices segment includes computer peripherals, PDAs, organizers, calculators and satellite navigation systems. The
global computer hardware market value during 2008 was US $ 196.1 billion. The market is expected to touch around US $ 240 billion, growing at a CAGR of 4%, according to Datamonitor.
Communications Equipment
The communications equipment market covers fixed-line and mobile telecommunications equipment. The fixed-line telecommunications equipment includes answering machines, fax machines and telephones. The mobile telecommunications equipment includes mobile phone handsets only, and not any service related charges borne by the consumer. The global communications equipment market generated total revenues of US $ 51.5 billion in 2008; the projected value for the global communications equipment market for the year 2013 is expected to be US $ 71.3 billion.
Semiconductor and Semi-conductor Equipment Industry
For more than four decades, the semiconductor industry has distinguished itself by the rapid pace of improvement in its products. Most of these trends have resulted principally from the industry’s ability to exponentially decrease the minimum feature sizes used to fabricate integrated circuits. The most frequently cited trend is in integration

55
level, which is usually expressed as Moore’s Law (that is, the number of components per chip doubles roughly every 24 months). The most significant trend is the decreasing cost-per-function, which has led to significant improvements in economic productivity and overall quality of life through proliferation of computers, communication, and other industrial and consumer electronics.
The semiconductor and semiconductor equipment industry group is valued as the combination of the semiconductor market and the semiconductor equipment market. The semiconductor market is valued as the revenue accrued from the manufacture and sale of semi-conductor devices, both integrated (IC) and discrete, and related products. The semiconductor equipment market includes the revenues accrued from the
manufacture and sale of equipment for the production of semiconductor devices, including both wafer fabrication and packaging and assembly.
According to Datamonitor, the global semiconductor and semiconductor equipment industry group generated total revenues of US $ 198.9 billion in 2009, representing a compound annual growth rate (CAGR) of 6.1% for the period spanning 2005-2009. Recovery is expected in the forecast period and the industry group is set to grow at a stronger rate towards 2014. In 2014, the global semiconductors & semiconductor equipment industry is forecast to have a value of US $ 326.7 billion, an increase of 10.4% since 2009, of which semiconductors is expected to grow at a CAGR of 8.3%, and semiconductor equipment is expected to grow at a CAGR of 27.6%.
Table - 2: Improvement Trends for Integrated Circuits Enabled by Feature Scaling
Trend Example
Integration level Components/chip, Moore’s Law
Cost Cost per function
Speed Microprocessor throughput
Power Laptop or cell phone battery life
Compactness Small and light weight products
Functionality Nonvolatile memory, imager
Source: The International Technology Roadmap for Semiconductors,2009
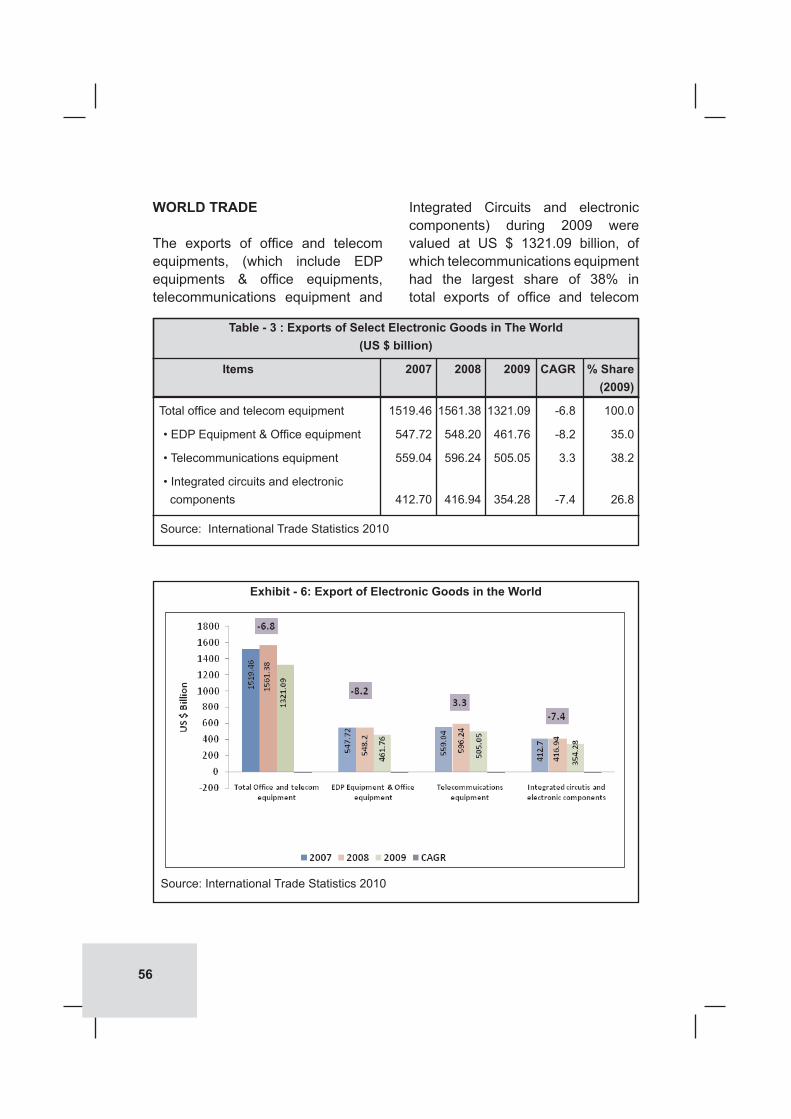
56
Table - 3 : Exports of Select Electronic Goods in The World(US $ billion)
Items 2007 2008 2009 CAGR % Share (2009)
Total office and telecom equipment 1519.46 1561.38 1321.09 -6.8 100.0
• EDP Equipment & Office equipment 547.72 548.20 461.76 -8.2 35.0
• Telecommunications equipment 559.04 596.24 505.05 3.3 38.2
• Integrated circuits and electronic components 412.70 416.94 354.28 -7.4 26.8
Source: International Trade Statistics 2010
Source: International Trade Statistics 2010
Exhibit - 6: Export of Electronic Goods in the World
WORLD TRADE
The exports of office and telecom equipments, (which include EDP equipments & office equipments, telecommunications equipment and
Integrated Circuits and electronic components) during 2009 were valued at US $ 1321.09 billion, of which telecommunications equipment had the largest share of 38% in total exports of office and telecom

57
equipment. EDP equipment & office equipment, and Integrated Circuits and electronic components had a share of 35%, and 27%, respectively (Table: 3). This has been diagrammatically shown in Exhibit: 6. However all the categories have shown a decline over the previous year owing to the
economic slowdown that took place during 2008 and 2009.
Table: 4 gives the top five exporters and importers of select electronic goods in the world, in the year 2009. It may be noted that the major countries / regions exporting most of
Table - 4: Leading Exporters And Importers of Select Electronic Goods(US $ million)
Items Exporters Value Importers Value
Total Office and telecom equipment China 346.0 EU 27 436.0
EU 27 328.0 USA 235.0
Hong Kong 138.0 China 214.0
USA 113.0 Hong Kong 142.0
Singapore 97.0 Singapore 67.0
World 1321.1 World 1416.4
• EDP Equipment & Office equipment China 157.0 EU 27 176.0
EU 27 130.0 USA 97.0
USA 40.0 China 43.0
Hong Kong 33.0 Hong Kong 33.0
Singapore 25.0 Japan 20.0
World 461.8 World 463.2
• Telecommunications equipment EU 27 150.0 EU 27 196.0
China 149.0 USA 117.0
Hong Kong 53.0 Hong Kong 47.0
Korea Republic 39.0 China 34.0
Mexico 38.0 Mexico 24.0
World 505.1 World 535.5
• Integrated circuits and electronic Singapore 62.0 China 137.0
components Hong Kong 52.0 EU 27 64.0
EU 27 48.0 Hong Kong 63.0
Taipei 44.0 Singapore 42.0
China 40.0 Taipei 27.0
World 354.3 World 417.7
Source: International Trade Statistics 2010

58
the electronic goods include: EU27, China, Hong Kong, USA, Singapore and Korea Republic; and the major importing countries in the world include: EU 27, USA, China and Hong Kong.
Although a large portion of the trade was intra-regional, EU 27, as a bloc was the largest source for electronics imports by EU, constituting a share of 54%, followed by China (20%), USA (4%), Japan (4%) and South Korea (3%). It may be mentioned that enlargement of the EU has also contributed to the growth in intra-regional trade.
In the case of USA, the largest source country was China with 43% of the total electronic imports in to USA,
followed by Mexico (16%), Malaysia (7%), South Korea (6%), and Japan (6%). China reports imports from China (re-imports). These imports consist of products which have been produced in China and thereafter temporarily exported1 The product structure of China’s imports from China indicates that in absolute terms office and telecom equipment is the largest category (US $ 47.5 billion which is 20.5% of the total imports of US $ 231.5 billion) in this particular trade flow. The share of re-imports is particularly large in the import of telecommunications equipment (US $ 13.7 billion, which is 37% of the total import of US $ 36.9 billion) and EDP and office equipment (US $ 15.6 billion, which is 34% of the total imports of US $ 46.5 billion).1
Source: International Trade Statistics 2010
Exhibit - 7 : Major Suppliers of Office & Telecom equipment to EU 27 (2009)
1Metadata, International Trade Statistics
Korea Republic3%
Japan4%
USA4%
China20%
Total importsUS $ 328 Billion
Others15%
EU 2754%

59
Exhibit - 8: Major Suppliers of Office & Telecom Equipment to USA (2009)
Source: International Trade Statistics 2010
Exhibit - 9: Major Suppliers of Office and Telecom equipment to China (2009)
Source: International Trade Statistics 2010
Others22%
Japan6%
Korea Republic6%
Malaysia7%
Mexico16%
China43%
Total importsUS $ 113.0 Billion
China23%
Others26%
Malaysia9%
KoreaRepublic
14%
China43%
Taipei16%
Total importsUS $ 346 Billion

60
According to WTO, the main reason for this rise of China’s imports from China has been the deep integration of the economy of Hong Kong with that of Mainland China, through FDI flows and reduced trade barriers, which increases not only the trade exchanges between the two economies, but makes the differences between foreign and domestic trade unclear in some cases, thus complicating the analysis of China’s trade. As per WTO statistics, overall, China has reported imports from China to the tune of US $ 86.4 billion, in the year 2009, which is 8.6% of total imports by China. The share of such imports has been growing, from a level of 3.2% in 2000, the share has increased to 8.6% in 2009. The sharp rise in recent years of this particular trade flow can be attributed to various factors, all of which are linked to these closer economic ties between Mainland China and Hong Kong. According to WTO, Hong Kong’s, conversion to a services economy was supported by its enhanced role as a distribution centre of globally operating multinationals with production plants in China. These firms produce goods in China, export them to an affiliated or unaffiliated global distributor located in Hong Kong, from which goods are then shipped to many destinations including shipments back to China. Another reason cited by WTO is the trade transactions between one
custom bonded area to another custom bonded area, within China. It has been observed that some goods produced in one bonded area in China have to be processed further, or used as inputs in a plant located in another bonded area in China. Often, according to WTO, the shipments between the two plants are not happening between themselves, but through Hong Kong. The reason for this form of triangular trade could also be attributed to higher administrative costs (tax collection and tax refund systems). In some cases, there is mild value addition happening in Hong Kong, before it is re-exported to Mainland China. Such triangular form of trade transaction has high incidence in electronic sector.
Apart from China, other major suppliers of Office and Telecom equipment for China include: Taipei (16%), Korea Republic (14%), Japan (12%) and Malaysia (9%)
CHINA’S ELECTRONIC INDUSTRY
Since the introduction of Open Door Policy, in 1979, Chinese economy has emerged as one of the fastest growing economies in the world. One of the contributors of manufacturing growth is the Chinese electronics industry. Electronics Industry is the largest industry in China, and is growing at an average 20% per annum. China is one of the largest

61
producers of TVs, recorders, VCD players, telephones, and holds a leading edge in semiconductor and computer industry. Growing indigenous industry and a large number of overseas manufacturers aiming for economizing costs, have boosted the electronic industry in China.
As could be seen in Exhibit - 10, the production of electronic products has been rising in China, at CAGR of around 20% over the last decade. One of the main reasons for this level of growth has been the increase in consumption of electronic components for manufacturing which has led to an increase in demand.
Table: 5 gives the export of electronic goods from China. During 2009, exports and imports had declined due to the economic slowdown, which slowed down trade across the world. China was one of the major exporters as also importers of office and telecom equipment in the world. China was the largest exporter of EDP equipment and office equipment in 2009 with a share of 33.9% in the total world exports. In the case of imports, China was the largest importer of integrated circuits and electronic components in the year 2009, with a share of 32.8% in the total world imports (Table: 4).
It is reported that the digitization of electronics has also been largely
Source: http://www.sinohub.com/investors.html
Exhibit - 10: Production of Electronic Products in China

62
Exhibit - 11: China’s Consumption of Electronic Components in Manufacturing
Source: http://www.sinohub.com/investors.html
Table - 5 : Exports and Imports of Select Electronic Items from China
Source: International Trade Statistics, 2009 & 2010

63
favouring the development of Chinese electronics industry. Also the convergence of electronic applications, technologies and products favour the development of wide range of portfolios by the Chinese electronic conglomerates. While sourcing critical components from abroad, Chinese electronic industry developed its manufacturing output through partnership with international players and outsourcing services, mainly through assembly work. The technology transfer has also been benefiting the Chinese electronics industry in achieving self-sufficiency, by developing home-grown standards for mass market digital products. Component manufacturing in China is also developing fast to provide a comprehensive supply chain, and support the growth in local production.
China has also learnt that an expanding electronics industry has environmental implications due to the heavy use of chemicals in the electronics sector. China has formulated legislation and guidelines to regulate the industry and it is clear that this vision is aiding the industry’s growth while regulating its harmful impacts. This has given China an edge over most other nations in the developing world.
SINGAPORE’S ELECTRONIC INDUSTRY
Singapore’s electronics industry has been an important pillar of the country’s economy over the last 40 years. It is also a key demand driver for the chemicals, logistics and precision engineering industries, as well as an important capability enabler for various sectors like avionics, medical technology and clean energy.
The investment projects in 2009 are expected to contribute SGD2 1.8 billion in variable account per annum to Singapore’s Gross Domestic Product (GDP) when they are fully implemented. This is generated by electronics investment commitments of SGD 4.9 billion in manufacturing FAI (Fixed Asset Investment) in 2009, or 41.5 per cent of total manufacturing FAI3.
The top electronic companies have chosen the city state as a base for their activities in manufacturing, supply chain management and regional headquarters responsibilities, which adds to the strength of the electronic industry. The country holds global leadership positions in several sectors like semiconductors and hard disk media, while it also hosts a range of R&D activities, such as component and product development.
2Singapore dollars3Source: EDB (Economic Development Board of Singapore, Government of Singapore)

64
Singapore has become a world-class electronics manufacturing hub with end-to-end R&D capabilities. Presently, the industry is made up of various important strands. The biggest area is in semiconductors, which consists of integrated circuit (IC) design, wafer fabrication and assembly and test activities. The sector employs around 3,500 R&D engineers working on IC design, process development, packaging and test engineering and embedded software development.
Another sector is electronics components, which is composed of six groups: advanced substrates; batteries and power electronics systems; display; passive components; storage; and peripherals. The electronics systems industry, responsible for network storage solutions, electronics manufacturing services (EMS) and consumer electronics and lighting, is another contributor to the success of Singapore’s electronics industry. The fourth pillar in this industry is infocomm product manufacturing, which includes computing hardware like PCs, servers, point-of-sales equipment, mobile phones and data networking equipment. The nation’s strong capabilities in this sector mean that it will continue to be the preferred location for companies to create and manage new markets, products, processes and applications.
Table: 6 Gives the export of electronic goods from Singapore. During 2009, exports and imports had declined due to the economic slowdown, which slowed down trade across the world. Singapore was one of the major exporters as also importers of office and telecom equipment in the world. Singapore was the largest exporter of integrated circuits and electronic components in the year 2009, with a share of 62% in the total world exports (Table: 4).
Looking ahead, EDB (Economic Development Board of Singapore, Government of Singapore) has identified four growth areas for the industry – green electronics, bioelectronics, plastic electronics and security products. Currently, these smart products contribute about 10% of the country’s electronics output, but that figure is now targeted to increase to 30% by 2020. Green electronics refer to energy efficient solutions for applications such as lighting, automotive and computing. Another novel method of reducing reliance on traditional sources of energy is through energy harvesting. Such IC designs are able to capture and convert ambient energy into electricity. Improving healthcare remains a top priority, and developing bioelectronics will be beneficial for all. Singapore is ready to propel this new growth segment forward with its base of core electronics capabilities and existing strengths in material physics and biotechnology.

65
HONG KONG’S ELECTRONICS INDUSTRY
The Hong Kong Housing Society classifies a product as an electronic product if it holds any one of the following features:
i. it is an electronic component;
ii. its essential function is driven by electronics;
iii. it is dedicated for use by an electronic device; and
iv. in a multi-function product, one
of its major functions is driven by electronics.“
As of 2007, the Hong Kong’s electronic Industry comprises about 500 establishments engaging nearly 10000 persons with a gross output of nearly HK$ 8 billion. Electronic industry in the year 2007 accounted for 4% of total establishments in the manufacturing sector; about 6% in the total employment in the manufacturing sector; about 5% in the value of gross manufacturing output; and about 7% share in manufacturing value added.4
Table - 6: Exports and Imports of Select Electronic Items from Singapore
Source: International Trade Statistics, 2009 & 2010
4Hong Kong Trade Development Council

66
Evolution of Electronics Industry in Hong Kong
In 1992/93, the Hong Kong Government’s Industry Department commissioned the Techno-Economic and Market Research Study of Hong Kong’s Electronic Industry (BCG 1994). The study benchmarked Hong Kong with other competitor countries namely USA, Japan, Singapore, Taiwan, China, and Malaysia, and identified strategies for electronics manufacturing in Hong Kong. It was found that Hong Kong firms had focused too heavily on “mature” products that provided relatively low value. The study also showed that the electronic industry was also providing a lower return on capital than textile and garment industries, food and beverages industries, or non-electronics light manufacturing industries.
Since the BCG study was undertaken before Hong Kong was declared as a Special Administrative Region under the jurisdiction of China, most of the recommendations pertaining to Hong Kong and China were positively influenced after the merger.
In order to increase Research and Development in the area, the Hong Kong Government set up new universities to support the development of home-bred scientists. Universities such as Polytechnic University (PU), Hong Kong University
of Science and Technology (HKUST), City University of Hong Kong (CUHK), and Chinese University of Hong Kong (Chinese-U) helped in producing a lot of engineers and researchers who developed new technology for efficient manufacturing. Also, the Hong Kong Productivity council was set up with an aim to support the invention of new technology.
The electronics industry has been seen as a medium for developing globally competitive niches in newly developing markets; thus Hong Kong Government has clearly outlined explicit objectives and industry policies to encourage research, design and manufacturing in electronics industry. There has been rapid increase in major investments by the Hong Kong Government on infrastructural development to support the emergence of new businesses. Institutions such as Hong Kong Industrial Technology Center (HKITC), Hong Kong’s Applied Research Council and other special research facilities have been set up to support the growth of electronics industry. Direct investment in manufacturing was left to the private sector.
Human resources development, education and training programs are being provided through the Hong Kong Productivity Council, Hong Kong Polytechnic Industrial Center, universities, and the Vocational Training Center, as well as other

67
commercial entities. Technological support is provided through the Hong Kong Productivity Council; Hong Kong Applied R&D Fund Co. Ltd.; Design Innovation (HK), Ltd., Hong Kong Industrial Technology Center Corporation; and the Technology Development Division of the Hong Kong Industry Department. Quality and productivity are supported through the Hong Kong Productivity Council; Hong Kong Quality Assurance Agency; and the Quality Service Division of the Hong Kong Industry Department, which provides ISO 9000 certification, standards and calibration, product standards, and laboratory accreditation.
Trade
Hong Kong’s electronic industry is one of the largest merchandise export earners, and is one of the largest exporters of calculators, radios, telephone sets, sound recording apparatus (including DVD/VCD recorders / players) in the world.
One-fourth of Hong Kong’s electronics exports comprise of finished goods, majority of them being durable products for domestic consumption. Audio-visual (AV) equipment, consisting of radios and optical discs players, hi-fi equipment, TV sets, video cassette recorders, digital versatile disc (DVD) players/
recorders, and MP3 players are some of the major finished products. Moreover, Hong Kong exports a variety of computer products too, such as desk-top/notebook computers and magnetic and optical disk drives, as well as telecommunications products like corded and cordless telephones. Other items with smaller export value include calculators, electronic dictionaries and translators, batteries and personal security/smoke alarms5.
Electronic parts and components constitute about three-fourth of Hong Kong’s electronics exports. In particular, a large amount of semi-conductors are re-exported to the Chinese Mainland for further production. Hong Kong also produces and export a variety of parts for telecommunications items, AV equipment, office machines and computers, as well as components like resistors, capacitors, inductors, crystals, resonators, speakers, switches, buzzers, liquid crystal displays (LCDs), printed circuit boards (PCBs) and transformers. Hong Kong also re-exports a large volume of semiconductors to China for outward processing production. Table – 7 gives data on export of electronic goods from Hong Kong. In the year 2009, exports and imports had declined due to the economic slowdown.
5Hong Kong Trade Development Council

68
Most manufacturers have relocated the labor-intensive production processes to the Chinese mainland, namely Socio-Economic Zones in Guangdong Province for cost reasons. Meanwhile, their Hong Kong offices are mainly responsible for product development, quality control, management, marketing and logistic support. Due to the relocation of production facilities, most companies have been re-classified as non-manufacturing establishments, despite the fact that they have manufacturing activities across the boundary.
There are a number of companies still maintaining the high value-added and/or capital-intensive production in
Hong Kong, e.g. IC packaging/testing, production of multi-layer PCBs, lead-frame bonding and PCB assembly by surface mount technology (SMT) for high-value products.
Hong Kong’s electronics industry is characterized by the heavy dependence on imported parts of key components, especially ICs and dices. Given its free port status and the advanced telecommunications infrastructure, Hong Kong allows companies to source freely worldwide. For other parts and components, such as PCBs, passive components, speakers, metal parts, plastics, connectors, gift-boxes and other packing materials, Hong Kong companies may source from other
Table - 7: Exports and Imports of Select Electronic Items for Hong Kong
Source: International Trade Statistics, 2009 and 2010

69
manufacturers here, or local Chinese enterprises on the mainland.
Hong Kong’s electronics industry is characterized by the heavy dependence on imported parts of key components, especially ICs and dices. Given its free port status and the advanced telecommunications infrastructure, Hong Kong allows companies to source freely worldwide. For other parts and components, such as PCBs, passive components, speakers, metal parts, plastics, connectors, gift-boxes and other packing materials, Hong Kong companies may source from other manufacturers here, or local Chinese enterprises on the mainland.
The success of Hong Kong’s electronics industry also lies in efficient management. Against the fast changing markets, Hong Kong companies emphasize quick response to ensure effective marketing services to their customers, and to monitor the changing product trends. Moreover, due to the growing concern of quality conscious buyers, more and more companies have strengthened their quality assurance systems. This is evidenced by a growing number of Hong Kong companies accredited with ISO 9000 - an internationally recognized standard for quality management system, and ISO 14000 - a standard for environmental management system, amid the growing concerns for environmental protection.
Of late, most electronic manufacturers in Hong Kong have relocated the labor-intensive production processes to the Chinese mainland, namely Socio-Economic Zones in Guangdong Province for cost reasons. Meanwhile, their Hong Kong offices are mainly responsible for product development, quality control, management, marketing and logistic support. Due to the relocation of production facilities, most companies have been re-classified as non-manufacturing establishments, despite the fact that they have manufacturing activities across the boundary. However, there are a number of companies still maintaining the high value-added and/or capital-intensive production in Hong Kong, e.g. IC packaging/testing, production of multi-layer PCBs, lead-frame bonding and PCB assembly by surface mount technology (SMT) for high-value products.
There are also a number of large Hong Kong companies marketing electronic products under their own brand names, including Truly, V-Tech, Group Sense, Venturer, GP and SMC. Their sales network covers not only the advanced countries, but also emerging economies like Latin America and Eastern Europe.
As for parts and components, many manufacturers produce custom-made products for famous global companies, e.g. parts and accessories of computers, recorders, and radio receivers, as well as components/

70
modules like PCBs and LCDs. Meanwhile, standard components are usually exported directly to distributors and manufacturers in overseas markets. Electronic parts and components from Japan, Taiwan, US and South Korea are sometimes assembled in Hong Kong and are then re-exported into the market. This can be seen in the rising number of multinational manufacturers setting up offices in Hong Kong.
JAPANESE ELECTRONIC INDUSTRY
After World War II, Japanese industry began to rapidly develop consumer electronics products using keiretsu methods. By the 1980s, a relatively small number of industries dominated Japan’s trade and investment interaction with the rest of the world.Sony was founded in 1946 and rapidly advanced in the electronics field. The invention of the first pocket transistor radio placed the company at the forefront of electronics development, both in Japan and worldwide. As other companies were formed to compete in this area, the industry producing consumer electronics became major exporters that invested overseas in the 1980s.
Due to its high concentration of electronics companies, dominant
global market share in electronics, and high quality of its products, Japan is the largest manufacturer of consumer electronics in the world. Japanese companies have a reputation for high quality and innovation, having introduced products in the audio and video segments.
Global production by Japanese electronics and IT companies is estimated to rise 11% in 2010, to ¥43.7 trillion. The trend of recovery is expected to continue in 2011, when production is forecast to increase 4%, to ¥45.5 trillion (Exhibit: 12). Production by Japanese electronics and IT companies accounted for a significant 21% of the global total in 2010. Although Japanese companies are facing increasing competition worldwide, production is seen growing in line with the introduction of products taking advantage of environment-related and other technologies.
Domestic production by the Japanese electronics industry is estimated to increase 13% in 2010, to ¥15.3 trillion. (Exhibit: 13). Special demand was seen for flat-panel TVs and other products due to the Eco-Point System6, and for automobiles due to subsidies implemented by the Japanese Government. This demand also contributed
6The Eco-point system allows consumers who buy government-designated refrigerators, television sets and air conditioners deemed good for the environment to apply for points that can be used to buy other goods and services. To get the points, applicants must fill out a form and send it together with their receipts and a photocopy of the product warranties to the secretariat of the subsidiary program. The forms will be available from electronics stores and post offices. The forms can also be filled out online but must be printed before sending by regular mail.

71
and increased the demand for electronic components and devices. Progress will continue towards the establishment of global production structures. In this environment, though domestic production is forecast to increase 2%, to ¥15.7 trillion in 2011, this amount is still 15% below the result for 2008.
The exports of electronics from Japan increased by 17.8% during the period April-October 2010 compared to the corresponding period in the previous year. Electronics components and devices constituted a large share in the exports constituting 77.7% of the total exports from Japan followed by industrial electronics equipment with 13.6% share and consumer electronics equipment with 8.8% share in total exports from Japan (Table: 8)
In the case of imports, during January – October 2010, imports increased by 27% to a value of ¥ 6.68 trillion. Constituting a share of 50.7%, electronic components and devices were the products which were the largest imported item, followed by industrial electronic equipments (37.8%), and consumer electronic equipments (11.5%).
The outlook for the Japanese electronic industries is positive with
new product innovation likely to entail using new intelligence and embedded software to create devices that can collect, analyze and present information that helps end users better. This will require that electronics companies de-emphasize their traditional focus on hardware and focus instead on software development, including rigorous requirements management. A well-structured discipline in industries such as aerospace, defense and automotive, requirements management7 will become a critical competency for electronics companies.
SELECT GLOBAL TRENDS
Global electronic firms are increasingly using their core competency to expand their global consumer base. The firms are focusing on technology, product development and manufacturing capabilities through aggressive innovation. Innovation is also being used in development of new business models, business processes, and management of services. For example, Apple Inc. innovated a new business model from being a provider of innovative products to a provider of lifestyle product (Apple I-Pad). Introduction of such products
7Requirements management is the process of documenting, analysing, tracing, prioritizing and agreeing on requirements and then controlling change and communicating to relevant stakeholders. It is a continuous process throughout a project. A requirement is a capability to which a project out come (product or service) should conform.

72
Note: * Estimated, ** ForecastedSource: JEITA (Japan Electronics and Information Technology Industries)
Exhibit - 12 : Global Production by Japanese Electronics Industry
Note: * Estimated, ** ForecastedSource: JEITA (Japan Electronics and Information Technology Industries)
Exhibit -13: Domestic Production by Japanese Electronics Industry

73
changed the trends in delivery of contents.
Global electronic manufacturing firms are also moving their locations to take advantage of low-cost global talent, both for R & D and manufacturing operations to increase operational efficiency. Improvement in profitability is being undertaken through concentrating on high-growth-low-competition areas, such as industrial / medical electronics and aerospace / defence electronics.
Automotive electronics is another growth area which is having a small share in the electronic industry, and in order to revive the same, the Automotive Electronics Council has been commissioned by leading industry players in the world..
Global firms are focusing on five major areas, viz.,
• Developing an understanding of both domestic and international customers for
Table - 8: Exports of Electronics from JapanMillion yen
Source: JEITA (Japan Electronics and Information Technology Industries)

74
creating value propositions;
• Implementing new business models that help them in achieving the value propositions;
• Establishing the ability to shift the resources among diverse lines of business with exit and entry strategies;
• Making decisions efficiently and communicating to stakeholders; and
• Attracting and retaining global talent at competitive price.
Firms are increasingly establishing processes and systems that are capable of capturing and applying consumer insights. Various strategies are being adopted to understand the needs and preferences of end-users, and to offer customer-centric solutions that differentiate their products as compared to the competitors.
Table - 9: Imports of Electronics by JapanMillion yen
Source: JEITA (Japan Electronics and Information Technology Industries)

75
Electronic industry in many developed countries are facing challenges associated with human resources, as the workforce is expected to come down drastically in the medium term. In such a situation, many electronic firms are dependent on global labour market place for their requirements. This may, however, call for managing the workforce by standardizing human capital data and sharing of knowledge. Such trends may pose challenges of globalizing and unifying the mindsets of employees. Systems and processes need to be established to deploy human resources based on global priorities. Firms are helping their
employees to understand the need for customer focus and cultural integration
Over the past few years, the electronics manufacturing services (EMS) industry has quickly diversified its list of value-added services for OEM (Original Equipment Manufacturers) customers. As a result, EMS firms are beefing up their logistics offerings as well, providing a variety of outbound shipping services to OEMs that do not build up inventory, and are aiming to transport high-tech product to customers, as fast as possible, by establishing organizations devoted to marketing and
Box: 1
Automotive Electronics Council (AEC)
The Automotive Electronics Council (AEC) was originally established by Chrysler, Ford, and GM (General Motors) for the purpose of establishing common part-qualification and quality-system standards. From its inception, the AEC has consisted of two Committees: the Quality Systems Committee and the Component Technical Committee. The Committees are composed of representatives from the Sustaining Members (currently Autoliv, Continental Corporation, Delphi Corporation, Johnson Controls, TRW Automotive, and Visteon Corporation) and other Technical Associate, and Guest Members.
The AEC Component Technical Committee is the standardization body for establishing standards for reliable, high quality electronic components. Components meeting these specifications are suitable for use in the harsh automotive environment without additional component-level qualification testing.
Source: Automotive Electronics Council (AEC)

76
managing outbound, customer-facing functions.
New applications, or improvement in existing applications, are likely to be in demand in the years to come. These can be broadly classified as:
• Energy saving: Home, transport, industry;
• Good-living / Well-being: Living place, para-medic and medical applications;
• Protection: Personal security,
tracking, and infrastructure.
The analog-to-digital conversion has introduced many new standards in audio and video, which greatly improves the quality and affordability of the multimedia digital experience. Further, with the proliferation of broadband, accessing the media has become easy and rewarding for consumers. With easy access and the rich quality, enabled by the digital revolution, the following consumer electronic trends may also be emerging8:
• In-Home Entertainment—with prices of flat-panel TVs (LCD, Plasma, and DLP) falling, large screen HDTVs
are being purchased in many homes. With homes equipped with HDTVs, and high-definition (HD) content available through broadband, terrestrial, cable, and satellite, consumers now enjoy the complete theater experience with the convenience of staying in their homes. HDTVs will become more mainstream with the imminent availability of HD content and DVD players.
• Staying Connected—within a home and while traveling, consumers want to stay connected. Historically, they used their laptops for accessing email and the Internet. However, with terrestrial and mobile broadcast services for handheld devices becoming common, and broadband wireless connectivity (WiFi and WiMAX) becoming ubiquitous, mobile devices such as cell phones, PDAs, and portable media players are being used to access audio, video, and data. Providers of these mobile devices are constantly updating their technology features to keep up with consumer demand.
• Media and Data
Convergence—traditionally,
8http://www.altera.com/end-markets/consumer/industry/csm-industry.html

77
there were data-centric devices such as PCs and PDAs and media-centric devices such as TVs and portable media players. However, the demarcating-line between them is getting blurred because consumers are demanding products that can handle both. The new generation of consumer gadgets must handle both
media and data on the same platform. Such convergence is driving many traditional data-centric companies such as Microsoft and Cisco to enter the consumer market, creating fierce competition for traditional consumer brands.
The impact of recession on electronics goods industry was significant resulting in project
Box – 2
Information Technology Agreement
The Information Technology Agreement (ITA), a plurilateral agreement within the WTO, aims to expand world trade in information technology products, considering the key role played by this sector in development of information based industries, and in the dynamic expansion of the world economy. ITA also desires to achieve maximum freedom of trade in information technology products and to encourage continued technological development of the information technology industry on worldwide basis.
The objective of the Agreement is to bring down tariffs on IT items in stages to zero level by a specified year. The concessions evolving out of the negotiations would be in addition to those already agreed upon under the GATT. India joined the ITA on 25th March 1997; the basic customs duty of all 217-product lines identified for India has been eliminated by March 2005.
Keeping in view the importance of information technology in international trade, some of the members submitted proposals on expansion of trade in IT products (referred to as ITA-II). These proposals were discussed extensively in various meetings of the WTO. The updated list of products, proposed to be covered under ITA-II, includes a few consumer electronic items and certain security related products, which is one of the main reasons why it has not been possible for the members of ITA to come to a consensus yet.
Source: Ministry of Commerce and Industry, GOI

78
cancellations, postponement, market opportunity review, or combining with other projects. The design, resources of people, capital and tools were reduced in many cases, and then kept in a frozen state. However, from around middle of 2009, situation has started improving and this has been enabled first by low inventories and next by robustness of select market segments. Still, the industry is holding a very cautious view of this recovery and deliberated if there could be further turbulence ahead. Thus, the resource constraints on new product designs have continued to remain a challenge even though forward looking sales plans are turning more and more optimistic. The recovery in electronics industry is expected to fully bloom in 2 or 3 years, i.e. by 2012 or 2013. This presents a huge market potential which cannot be served with only the existing products, and there will be a glut of new designs. Thus, it is reasonable to expect that companies will place major emphasis on new product designs starting from 2010 as the demand is projected to grow strongly.
The nature of new product demand in a post-recessionary phase is somewhat different from the demand that would be prevalent
in a continuous growth period. While the latter is broad based, the former is likely to be very selective, as resource availability for investments and R&D would be minimal and companies would like to make safer bets. In addition to being selective, companies would also like to look for product opportunities with shorter timeframes for return on investment, which would lead to new designs that are somewhat incremental in nature.
After being battered by the economic downturn, the electronics distribution industry is emerging with a more positive outlook and a new strategy. The industry is optimistic about the long-term outlook. Most of the manufacturers and distributors are planning to take a more customer-focused approach and are expected to furnish more services. Acquiring more customers, including OEMs and EMS firms, has become a major priority, as well as strengthening relationships with current ones. Additionally, distributors are expected to offer more supply chain management solutions and value-added services even to smaller customers as they seek to establish themselves as the most capable product and service providers.

79
These trends indicate that the consumer electronics market is in a rapid evolution phase and the manufacturers are under tremendous competitive pressure to be the first-to-market, with unique and differentiated products. However, a successful product in the consumer market
quickly attracts copycat products from the competition, leading to rapid price erosion. To stay ahead of the competition, consumer manufacturers are forced to constantly enhance their products or support emerging technologies.

80
3. INDIAN SCENARIO
The start of Indian electronics industry could be traced to the sixties, when the Government took the initiatives of manufacturing space and defence electronic products. This was followed by developments in consumer electronics, mainly the manufacturing of transistor radios, black and white TVs, calculators and other audio
products; later in 1980s, manufacture of colour televisions also started. Late 1980s, saw the advent of computers and telecom products.
The period starting 1980s may be considered as the golden period for electronics in India; since then the industry witnessed continuous and
Exhibit - 14: Phases of Development
Source: Exim Research

81
rapid growth. Following the software boom, since the middle of 1990s, India’s focus shifted to software related electronic products. Further, the steep fall in import tariffs in the country made the hardware sector open to international competition. In 1997, India became the signatory of the International Technology Agreement (ITA); since then India stood with its commitment and eliminated tariffs in 217 product lines. Some of the Indian companies, which have made significant achievements in global electronic market place include: Moser Baer, Samtel India, Celetronix etc.
PRODUCTION
The Information, Communication Technology and Electronics (ICTE) industry is the world’s largest and fastest growing industry. With its impact in raising productivity, increasing efficiency in delivery of services and improving lifestyle, it is considered as a key enabler in development, and is globally being accepted as a “Meta-resource”. The competitiveness of various industries is increasingly being determined by their ability to integrate ICTE in their business processes. The growing Indian market for electronic products
Exhibit - 15: Production of Electronics Hardware in India
Note: * EstimatedSource: Exim Research data derived from Annual Report of Department ofInformation Technology, Government of India; ELCINA Electronics Industry Association of India

82
is estimated to be over US $ 25 billion, and is growing at around 30% per annum.
Indian electronics hardware production increased from ` 50,500 crore in 2004-05 to ` 97,260 crore in 2008-09, with a cumulative annual growth rate of 17.3%. The production of electronics hardware in the country is estimated to have grown from ̀ 97,260 crore in 2008-09 to ` 109,940 crore in 2009-10, a growth of 13%. The slower rate of growth of production during 2009-10 is attributed to the global economic slowdown. (Exhibit: 15)
Communication and broadcasting equipment took the largest share (29%) in India’s electronics production
in the year 2009-10, followed by consumer electronics (27.4%), computers (13.1%), industrial electronics (12.4%), components (12.2%), and strategic electronics (6.3%).
The share of electronics production in India’s GDP has been growing over the years, with increasing importance of this sector. From a share of 1.6% in India’s GDP in 2001-02, the share has increased to 1.95% in 2009-10.
The demand for electronics hardware is being fuelled by the relatively high growth rate of the Indian economy, aspirations of the younger generation, and the large middle class in India with increasing disposable income.
Table - 10: Electronics Production in India
Note: * EstimatedSource: Exim Research data derived from Annual Report Department ofInformation Technology, Government of India
Consumerelectronics 12,700 13,800 15,200 16,800 18,000 20,000 22,600 25,550 30,150 13.1 18.0 27.4
Industrialelectronics 4,500 5,550 6,100 8,300 8,800 10,400 11,910 12,740 13,630 7.0 7.0 12.4
Computers 3,550 4,250 6,800 8,800 10,800 12,800 15,870 13,490 14,430 -15.0 7.0 13.1Communi-cation andbroadcastequipment 4,500 4,800 5,350 4,800 7,000 9,500 18,700 26,600 31,390 42.2 18.0 28.6
Strategicelectronics 1,800 2,500 2,750 3,000 3,200 4,500 5,700 6,840 6,980 20.0 2.0 6.3
Components 5,700 6,600 7,600 8,800 8,800 8,800 9,630 12,040 13,360 25.0 11.0 12.2TotalHardware 32,750 37,500 43,800 50,500 56,600 66,000 84,410 97,260 109,940 15.2 13.0 100.0
Item 2001-02
2002-03
2003-04
2004-05
2005-06
2006-07
2007-08
2008-09
2009-10
%change2008-09 vs2007-
08
%change2009-10 vs2008-
09
%share2009-
10

83
Thus, there is significant opportunity for stepping up the production of electronics hardware in the country. India has the potential to develop and manufacture electronic hardware for the global markets and gain higher global share besides meeting the country’s future requirement in the converging areas of information, communication and entertainment.
Consumer Electronics
Consumer electronics include electronic equipments meant for everyday use and are most often used in entertainment, communications, and to enhance office productivity. Some of the major products under
consumer electronics include personal computers, telephones, MP3 players, audio equipments, televisions, calculators, GPS automated navigation systems, digital cameras and playback and recording of video media, such as DVDs, VHSs or camcorders.
Indian consumer electronic market witnessed consistent increase in its market value over the years, from US $ 2.9 billion in 2004 to US $ 4.2 billion in 2008, witnessing a CAGR of 9.7%. Growth rate was the highest in 2006 (of 12.5%), and comparatively during 2008, the industry witnessed a slower growth of 7.7%. Datamonitor has projected that the Indian consumer
Exhibit - 16: Percentage Share of Electronics Production in GDP
Note:* Revised estimates, Source: Central Statistical Organisation (CSO)

84
Exhibit -17: Growth of Consumer Electronic Market in India
Note: * Projected, Source: Datamonitor
electronics market is expected to witness a CAGR of 6.1% during the period 2009-2013.
Indian electronics industry has been picking up again after the slowdown in the world economy. Rebounding consumer sentiments, strong demand for consumer durables, and stimulus package, have played a significant role in reversing the slowdown that set in more than a year ago. During 2009-10, the production of consumer electronics sector is estimated to be ` 30,150 crore, as against the production level of ` 25,550 crore in 2008-09, registering a growth of about 18% (Exhibit:18). Within this sector, the colour television segment is the largest contributor.
The Indian colour television market
size is estimated to be 15.15 million units in 2009-10 an increase of 25% over 2008-09.
Having a market share of more than 55%, size-wise, the 21 inch Colour TV (CTV) segment continues to have a dominant place (Exhibit: 19). In addition, there has been a spurt in demand for 14 inch CTV units, last year, mainly owing to the demand from Electronics Corporation of Tamil Nadu Limited (ELCOT), for free distribution to select households under a scheme announced by the Government of Tamil Nadu.
The colour TV industry is witnessing a segmental shift from conventional colour TVs to flat colour TVs. Reduced focus on the conventional colour TV (CCTV) segment, aggressive price reduction in the flat colour

85
Note: * EstimatedSource: Exim Research data derived from Annual Report Department of Information Technology, Government of India, ELCINA Electronics Industry Association of India
Exhibit - 18: Production of Consumer Electronics in India
Table - 11: Demand for Colour TVs(in Million Units)
Note: * EstimatedSource: Crisil Research, Annual Report 2009-10, of Department of Information Technology

86
Exhibit - 19: Demand for Colour TV (Size-wise)
Exhibit - 20: Trend in Demand for Colour TVs
Source: Crisil Research
Note: RPTV (Rear projection TV)Source: Crisil Research
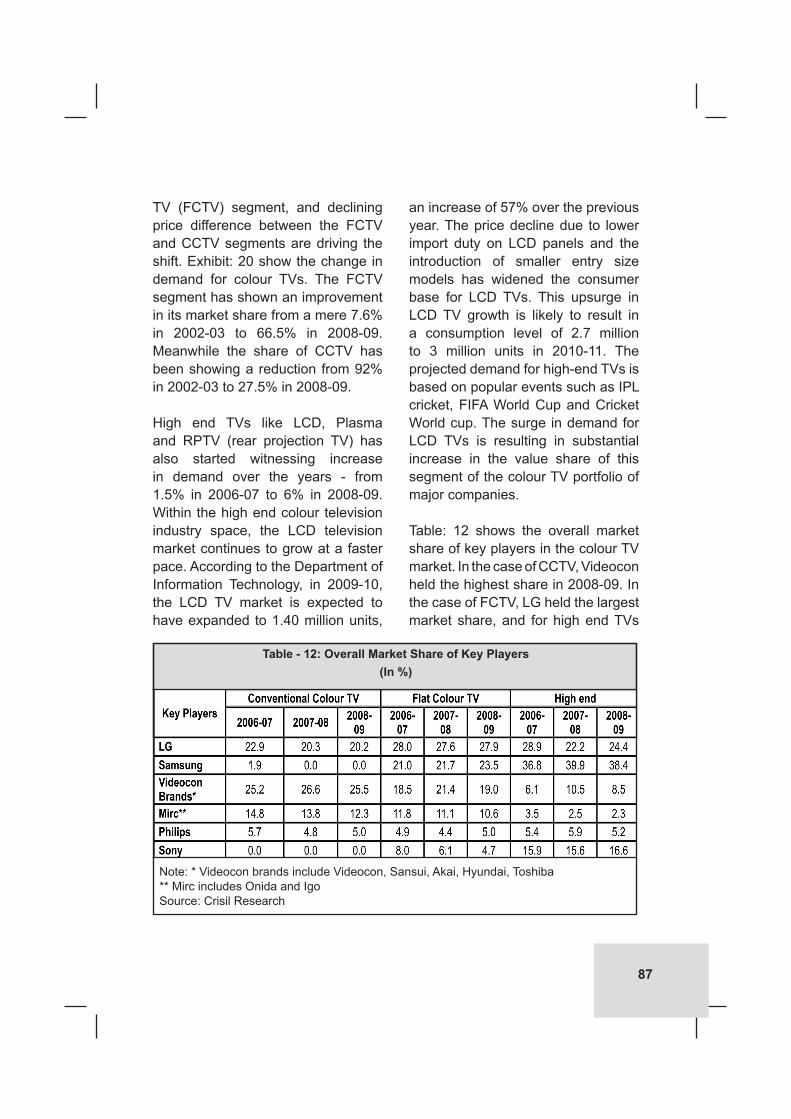
87
TV (FCTV) segment, and declining price difference between the FCTV and CCTV segments are driving the shift. Exhibit: 20 show the change in demand for colour TVs. The FCTV segment has shown an improvement in its market share from a mere 7.6% in 2002-03 to 66.5% in 2008-09. Meanwhile the share of CCTV has been showing a reduction from 92% in 2002-03 to 27.5% in 2008-09.
High end TVs like LCD, Plasma and RPTV (rear projection TV) has also started witnessing increase in demand over the years - from 1.5% in 2006-07 to 6% in 2008-09. Within the high end colour television industry space, the LCD television market continues to grow at a faster pace. According to the Department of Information Technology, in 2009-10, the LCD TV market is expected to have expanded to 1.40 million units,
an increase of 57% over the previous year. The price decline due to lower import duty on LCD panels and the introduction of smaller entry size models has widened the consumer base for LCD TVs. This upsurge in LCD TV growth is likely to result in a consumption level of 2.7 million to 3 million units in 2010-11. The projected demand for high-end TVs is based on popular events such as IPL cricket, FIFA World Cup and Cricket World cup. The surge in demand for LCD TVs is resulting in substantial increase in the value share of this segment of the colour TV portfolio of major companies.
Table: 12 shows the overall market share of key players in the colour TV market. In the case of CCTV, Videocon held the highest share in 2008-09. In the case of FCTV, LG held the largest market share, and for high end TVs
Table - 12: Overall Market Share of Key Players(In %)
Note: * Videocon brands include Videocon, Sansui, Akai, Hyundai, Toshiba** Mirc includes Onida and IgoSource: Crisil Research

88
like plasma and LCD TVs, Samsung held the largest share in 2008-09, with 38% of the total market.
Another major trend in the consumer electronics space has been the transition phase of DVD player market. The increasing popularity of DTH (Direct to home) is posing stiff competition to the DVD player market. With the availability of more than 100 entertainment and news channels and movies-on-demand, DTH services are gradually cutting into the DVD player market share, and it is felt that this trend shall continue in the times to come. Strong DTH growth has been another characteristic of 2009, and this is expected to sustain in 2010, and beyond as well. The main attraction of DTH service is the extensive geographical reach and ability to cater to both urban and rural viewers, moving away from cable operators’ space. Given the potential in our rural sector, the share of DTH segment is likely to grow further. Total market size of DVD players is estimated at 6.2 million units in 2009. The market has decreased by 11.5% from 7 million units in 2008. The organized segment comprises 80% of the market. The Home Theatre Segment has shown good growth in 2009-10. It is expected to grow to 200,000 units registering an increase of 30% over the previous year.9
Computers
The computer hardware market consists of the computers, storage, and other devices segments. The computers segment comprises: desktops and laptops. Storage segment includes memory sticks, CD packs, hard disks and other data storage devices. The other devices segment includes: computer peripherals, PDAs, organizers, calculators and satellite navigation systems.
The growth of computer hardware market in India during 2008 was 15.6% over the year 2007. Indian computer hardware market witnessed impressive growth rates in its market value over the years, from US $ 2 billion in 2004 to US $ 3.7 billion in 2008, showing an impressive CAGR of 16.6%. Growth rates witnessed an increasing trend from 15% in 2005 over 2004, to 18.5% in 2007 over 2006, and a slight decline in 2008, of 15.6%, over 2007. According to Datamonitor, the computer hardware market is projected to grow at a CAGR of 17% during the period 2009-2013.The market value of India’s computer hardware market is thus expected to be US $ 8.1 billion in 2013.
9Annual Report 2009-10, Department of Information Technology, Government of India

89
Exhibit - 21: Growth of Computer Hardware Market in India
Note: *Projected, Source: Datamonitor
% G
rowth
Market segmentation reveals that the Indian computer hardware market is dominated by computers, constituting 82% of the total market, followed by peripherals and devices (13%), and storage devices (5%).
The overall production data for the computer segment of the Indian electronics industry in 2009-10 is estimated to be valued at `14,430 crore, a growth rate of 7% over the previous year. The year 2003-04 witnessed the highest growth of 60% over the previous year, owing to increased demand for computers in India. However, during the year 2008-09, the production of computers witnessed a decline of (-) 15%, owing to the global slowdown that had engulfed the countries world over (Exhibit: 22).
The total PC (Personal Computer) sales during 2009-10 was 8.03 million units, with desktop computers and notebooks (including netbooks); the sales had registered a growth of about 18.2% in 2009-10 over the year 2008-09 (Exhibit: 23). Out of the total PC sales, the total sale of desktops was 5.52 million units, and that of notebooks & netbooks at 2.51 million units. During 2010-11 the total PC sales is estimated to be 9.76 million units of which 6.20 million units included the desktop sales and the rest 3.56 million units included notebooks and netbooks sales. While desktop sales is expected to increase by 12.3% in 2010-11 over the previous year, that of notebooks & netbooks is expected to increase by 41.8% over 2009-10. The overall consumption in the PC market was led by telecom, banking and financial

90
Exhibit - 22: Production of Computers in India
Note: * EstimatedSource: Exim Research data derived from Annual Report of Department of Information Technology, Government of India; ELCINA Electronics Industry Association of India
Exhibit - 23: Total PC sales
Note: EstimatedSource: Exim Research, Data sourced from MAIT (Manufacturers Association of Information Technology), ELCINA, Electronics Industry Association of India
2010-11
Mill
ion
units

91
service sectors, education and households segments.
The overall consumption in the computer market was led by businesses and households. Businesses included telecom, banking and financial services sectors and education. Exhibit: 24 show the percentage share of businesses and households in the total sales of computers. Over the years, the business sector has been dominating the computer industry sales. However, lately the share of households has also started increasing. From a share of 22% in 2003-04, in total PC sales, the households segment has increased its position with a share of 42% in 2009-10. Going forward, with signs of revival in the domestic
economy, the industry is expected to witness positive growth for PC and other IT products for the year 2010-11.
Industrial Electronics
The industrial electronics segment includes critical hardware technologies and systems with built-in software. It is a very challenging area which is multidisciplinary in nature requiring high level of technical skill in designing systems for applications in a variety of industrial sectors of the economy. Even though India has been having significant expertise in conceptualizing such systems and its erection and commissioning, the sector is very largely dependent on import of critical hardware and
Exhibit - 24: Total Desktop Sales in Business and Households
Source: Exim Research, Data sourced from MAIT (Manufacturers Association of Information Technology), ELCINA, Electronics Industry Association of India

92
associated software. Large projects are implemented with total import of C&I (commercial and industrial) packages from abroad without any knowledge of its design. In most cases, this leads to higher initial cost and a much higher maintenance cost in the long run. Industrial electronics is a very high technology area needing very high R&D investments. Therefore, there are limited numbers of global players with regard to R&D investments are concerned. The leading suppliers of the industrial electronics and controls, operating in India include Siemens, Rockwell Automation (Allen- Bradley), Asea Brown Bovery, Schneider, L&T, Honeywell, Mitshubishi, Emerson etc.
A number of small-scale units have also come up in the recent past, owned by technocrats having expertise in integrated solutions for automation and control instrumentation and software.
Automation systems such as PLC (programmable logic control) play a very important role in the industrial electronics segment. Automation is the use of control systems (such as numerical control, programmable logic control and other industrial control systems) in concert with other applications of information technology (such as computer aided technologies [CAD, CAM, CAx]), to control industrial machinery and processes, reducing the need for
Exhibit - 25: Production of Industrial Electronics in India
Note: * EstimatedSource: Exim Research; data derived from Annual Report of Department of Information Technology, Government of India; ELCINA Electronics Industry Association of India

93
human intervention. Manufacturing and infrastructure industries are keenly reviewing their strategies to employ more automation that reduces the basic cost of operations, which could help them survive better in future economic turmoil, and become more sustainable. Also, manufacturing and infrastructure industries will invest in automation to save energy, increase productivity, and upgrade existing facilities. Hence, the market for industrial electronics is expected to grow in the long run.
During the year 2009-10, the production of industrial electronics is estimated to be `13,630 crore, as against `12,740 crore in the year 2008-09, registering a growth of about 7% (Exhibit: 25). During 2008-09 also, this segment witnessed a growth of 7% in its production. However, it was much lesser than the growth witnessed in 2007-08 (of 14.5%) over 2006-07. The main reason for deceleration in production growth could be the overall slowdown in the world economy.
The Department of Information Technology, Government of India, through its Industrial Applications Programme is endeavouring to support this sector, particularly the SMEs, by providing proven indigenous technologies wherever possible. Several technologies developed through national collaborative programme have been applied for field
demonstration. This includes energy related equipment for improvement of electric power quality, controllers in the area of automation systems, equipment for railway traction, etc. A large collaborative programme on Intelligent Transportation System, which includes various technology modules for application in the road transportation sector has also been launched by the Department of Information Technology.
This sub-sector continues to play a very important role towards the manufacturing value added and economic growth. State-of-art industrial electronics equipment and systems, automation technologies, networking systems and various other stand-alone instrumentations are increasingly applied in manufacturing processes like steel, textiles, cement, power, chemical and refineries. Transportation sector, particularly the Indian Railways, are increasingly adopting latest electronic equipments for their locomotive and signaling systems.
Communication and Broadcasting Sector
Telecommunications is one of the few sectors in India, which has witnessed the most fundamental, structural and institutional reforms since 1991. In recent times, India has emerged as one of the fastest growing telecom markets in the world. The

94
Exhibit - 26: Growth of Subscriber base in India
Source: Annual Report 2009-10, Telecom Regulatory Authority of India (TRAI)
Exhibit - 27: Wireless Service Segment :Service Provider-wise Market Share as on 30.12.2010
Source: Telecom Regulatory Authority of India (TRAI)
Wireless subscriber Base:752.19 million
In m
illio
n

95
communication technology has taken a big leap forward and received the national recognition as the key driver for development and growth.
The telecom services have been recognized the world-over as an important tool for socioeconomic development of a nation. Telecommunication is one of the prime support services needed for rapid growth and modernization of various sectors of the economy. It has become especially important in recent years because of enormous growth of information technology and its significant potential for the impact on the rest of the economy. The telecom sector, which has the multiplier effect on the economy, has a vital role to
play, by way of contributing to the increased efficiency.
The overall telephone connections stood at 621.28 million at the end of the financial year 2009-10. Out of this, the share of wireless subscribers stood at 584.32 million as compared to 391.76 million in 2008-09 showing a growth of 192.56 million connections or 49.15%. The rural market reached the 190.88 million mark as against 111.63 million in the year 2008-09, excluding CDMA which works out to a growth of about 71% over 2008-09. It was reported that 32.67% of total wireless subscribers are now in rural areas. The total number of wireline connections was 36.96 million while in the rural areas it stood at 9.93 million.
Exhibit - 28: Wireline Service Segment :Service Provider Market share as on 30.12.2010
Source: Telecom Regulatory Authority of India (TRAI)
Total Wireline subscriber Base: 35.19 million

96
The gross telephone subscribers in the country crossed 787.28 million at the end of December 2010 (of which wireless telephone subscribers are about 752.19 million). The overall tele-density reached 66.16% in December, 2010. With such subscriber base, India is now second largest telecom market in Asia (next to China), having second largest mobile subscriber base in the world. At the end of December 2010, total broadband connections in the country have reached 10.92 million. In the broadcasting sector, apart from All India Radio, there are around 250 FM Radio stations in operation. Major players in the wireless (GSM, CDMA and FWP) and wirelines segments are given in Exhibits 27 and 28. BSNL/MTNL, two PSU operators hold 83% of the Wireline market share.
India has currently achieved a distinction of having the world’s lowest call rates (1-2 US cents), the fastest sales of mobile phones, production of world’s cheapest mobile handset, and the fastest growth in number of wireless phone subscribers (about 14 million per month).
Defying all odds posed by the global slowdown, telecommunications equipment industry continued to show an accelerated growth in 2008-09. According to the survey by Voice and Data, the overall growth of the telecommunications equipment industry was 20% (Table: 13). The telecommunications equipment industry can broadly be categorized
into three segments, viz., enterprise equipment, carrier equipment and phones.
Of these, carrier equipment put up the best show and witnessed a growth of 27% in 2008-09. Under the carrier equipment, segments like WiMax showed very high growth rates, with the revenue in absolute terms growing from ̀ 94.5 crore in 2007-08 to Rs 320 crore in 2008-09. The other segments under the carrier equipment industry which showed high growth rates were transmission (60.9%), broadband infrastructure (47.1%), and telecom turnkey (45.7%).
During 2008-09, the enterprise equipment segment was impacted by the global economic crisis and grew at a modest rate of 15.4%. The network security services clocked a revenue of ` 739.1 crore, a growth of 62.1%. Other major contributors to the growth of enterprise equipment segment include audio video conferencing (62%), WLAN (28.6%), network storage (25.1%) and voice solution (18.9%).
The fixed phone market has been shrinking, losing its share to the growing mobile market. During 2008-09, the value of fixed phones market declined to ` 760 crore, from ` 1,200 crore valued in the previous year. This is mainly because of the frantic growth in the wireless space. Also, new technologies like 3G and WiMax have been fuelling the growth of mobile in the country. Availability

97
Table - 13: Revenue of Telecom Equipment Industry
Note: * include NICs, hubs, radios, RAS and network management software** include: wireline switch, submarine and othersSource: Cybermedia research, Voice and data research

98
of feature-rich mid-range handsets in the market has added to the explosive growth in the mobile industry.
Among the top 10 players during 2008-09, the first four major players stuck to same rank as in 2007-08. The Finnish handsets manufacturer, Nokia, was at the top slot with overall revenue of ` 16,567 crore, registering a 10.4% growth. Ericsson was at the second place with a revenue of ` 10,310 crore, and a growth rate of 28.9%. Ericsson has done extremely well on the wireless infrastructure front and is a market leader in this space, and some of the big deals in the
wireless segment have been crucial for their growth. The new contender Huawei from China witnessed the highest growth rate of 131% in 2008-09, with its revenue growing from ` 2700 crores to ` 6240 crores.
According to Gartner, India ranks fourth in telecom equipment manufacturing in the Asia-Pacific (APAC) region. The country had a 5.7% share of the region’s total telecom equipment production revenue of US $ 180 billion in 2009. India is expected to move to the third spot (after China and South Korea) with a share of 8.5% of the total
Table - 14: Top 10 Players in Telecommunications Equipment Industry
Source: Cybermedia Research, Voice and data research

99
Box: 3
Next Generation Network (NGN)
Next Generation Network (NGN) is a powerful platform to provide different services like voice, video and data. In other words, NGN provides a single multi-service network which encompasses all the elements of existing telecommunication networks. It brings together best of both the worlds, i.e. efficiency, flexibility and innovativeness of IP and QOS (Quality of Service), reliability and security of proven TDM (Time Division Multiplexing) networks. It enables the operators to provide all type of services like voice, data, video, broadcast, mobility, VAS (Value Added Service) through making use of common single network thereby enabling the concept of “One network-All services”. The increasing competition in telecom network and subscriber’s desire to have new application-based services has generated considerable interest amongst service providers to migrate to NGN environment. The NGN platform will enable the telecom providers to provide a new range of services. NGN will help to create opportunities for revenue enhancement. Hence, identifying impediments and creating conducive environment will be necessary for smooth migration to NGN.
NGN is a platform, which can evolve in a step-by-step manner to create, deploy, and manage innovative services. NGN enhances the service delivery capabilities of networks. It brings together the information, broadcasting and telecom worlds. It represents a shift away from centralized intelligence in the central switch of the network to intelligence in the various layers of the network like access, service, transport and control layers representing a quantum leap in the network intelligence and capabilities. India has also seen appreciable activity with many projects underway and the carriers in India will be deploying the class 4 NGN first.
Source: Report of Next Generation Network Expert Committee (NGN eCO)
(estimated) APAC telecom equipment production revenue of US $ 277 billion by 2014.
The Department of Telecom data shows that the value of production
of telecom equipment in India during 2009-10 stood at ̀ 510 billion showing a growth of 4.5% over 2008-09.During 2010-11, telecom equipment production is estimated to grow by 5% to reach a value of ` 535 billion.

100
Exhibit - 29 : Telecom Equipment Production in India
Note: * estimateSource: Consultation Paper on Encouraging Telecom Equipment Manufacturing in India, TRAI
Note: * estimateSource: Consultation Paper on Encouraging Telecom Equipment Manufacturing in India, TRAI
Exhibit - 30: Telecom Equipment Exports
` bi
llion
` bi
llion

101
India exported equipment worth `135 billion in 2009-10 as against `19 billion in 2006-07, underlining the growth potential of the sector. The pace of growth of manufacturing will accelerate over next 3 years considering the growth of subscribers. According to Department of Information Technology, telecom equipment worth ` 3500 to ` 5000 billion will be required by 2015.
Lot of changes have been happening in the telecom sector since liberalization, and technologically, the sector has witnessed lot of changes with regard to new devices and services. This has resulted in the need to develop new technology equipment, update the processes of production, creating partnerships, transmission of goods and services produced, and in general altering the manufacturing value chain to bring more value into the country.
Indian telecommunication sector has a lot of growth potential and for this purpose India needs to focus on upgrading technology and services. Research and development is very important in telecom sector because it has the potential of bringing immense value to the country. In India Telecom R&D spend is expected to grow due to 3G, 4G/WiMax, LTE deployments all over the world, which would boost equipment and telecom devices demand. According to Telecom Regulatory Authority of
India, it is estimated that for 3G alone the investment would be of the order of US $ 15 billion, and demand for network elements would translate into requirement for components, test and auxiliary equipments. The overall requirement is expected to be of the order of US $ 100 billion. Major objective and focus should be on undertaking advance research, developing world class human resource, and establishing effective academia-industry interface. Apart from this Indian telecom sector should also focus on promoting international cooperation with leading institutions, organizations and countries in the world.
Strategic Electronics
Strategic electronics has become one of the important areas in the electronic industry due to the criticality of the technology development targeting two aspects, viz., a) the technology applicable to the strategic sector, like defence purposes; and b) the emerging state-of-the-art technology in the civilian applications. The strategic electronic sector envelops satellite based communication, navigation and surveillance systems, radars, navigational aids, sonars, underwater electronic system, infra-red based detection and ranging system, disaster management system, internal security system, etc. The Indian strategic electronic industry has been able to meet the bulk of the requirements of India’s defence and paramilitary forces.

102
There has been consistent growth in production of strategic electronics. In the year 2008-09, production of strategic electronics in India was valued at ` 6,840 crore, a growth of 20% over the previous year. The production data for the year 2009-10 is estimated to be ` 6,980 crore, registering a marginal growth of about 2%. However, this is much lower than the growth rate witnessed in 2008-09 over 2007-08. This was mainly because of reduced military spending in some sectors and the troubled global economy. At the national level, various research institutions are developing strategic systems, and the public sector undertakings and some of the private agencies are
mainly contributing to the growth in production.
It is projected that military and aerospace semiconductors are expected to witness growth in the coming years, as suppliers are likely to be looking forward for the end-product growth coming to the market over the next few years. This growth is due to technological advances which are driving the demand, because of changes in national military policies, and as a result of the substantial backlog of undelivered orders in aerospace. Prior to the era of computers and consumer electronics, military electronics consumed almost all of the world’s semiconductors.
Exhibit - 31: Production of Strategic Electronics in India
Note: * EstimatedSource: Exim Research; data derived from Annual Report of Department of Information Technology, Government of India; ELCINA Electronics Industry Association of India

103
Although the market share of military electronics in the consumption of semiconductors has been reduced, semiconductors nonetheless perform critical roles in the military electronics segment.
In the overall industrial market, which includes military and aerospace applications, more designs are being used in digital signal processing, sensors, analog circuitry for automation, measurement, security, and other growing areas in the industrial market. While volumes of shipment in the end-equipments are lower and growth is limited, the increasing electronics content, requiring semiconductors, is driving an average growth of 5% per year for military / aero chips. The forecast for military and aerospace semiconductors shows that the year 2010 to be a growth year for this market, with revenue likely to have crossed US $ 2.6 billion.
Components
The growth in production of components industry has been driven mainly by growth in consumer electronics and mobile sector. This sector faced serious challenges, with regard to growth and competitiveness, due to historical reasons, as well as the business environment prevailed in the year 2009. Historically, Indian electronics components sector had
not kept pace with the rest of the world, and was saddled with out-dated technology, low volumes and high costs, making it globally uncompetitive. However, the technological gap has been narrowing down.
The total production of electronic components was valued at ` 13,360 crore in the year 2009-10, a growth of 11% over the previous year. Electronic components with major share in production include: CD-R, Colour Picture Tubes (CPT), PCBs, DVD-R, connectors, semiconductor devices, ferrites, and resistors. It is estimated that the serviceable market for professional grade components, such as PCBs, semiconductor devices, connectors, wound components, antennas, are likely to go up due to indigenous manufacture of electronic products, such as mobile phones, set top boxes, DVD players. Most of the top global semiconductor companies have set up their chip design centres in India. There is a major shift in 21 inch CTVs – from conventional CPTs (Colour Picture Tube) to Flat Screens. Though there will be a decline in global demand for CRT (Cathode Ray Tube) TVs, India will be the largest user of this CRT (Cathode Ray Tube) technology in coming few years with demand spreading to rural areas. India is also likely to become the global hub for manufacture of CRT (Cathode Ray Tube) TVs.10
10Annual Report, Department of Information Technology, 2009-10

104
After the ITA-1 (Information Technology Agreement) was implemented, most of the components are at zero customs duty, and the remaining will be converging soon to zero duty structure under the FTAs. Convergence of technologies have further resulted in functional changes - the functions that were performed by consumer electronics equipments till now, are being performed by telecom and IT products, eliminating the little difference that remained between components used in these different segments of equipments. Thus, practically all components today can be imported at zero customs duty. An interesting phenomenon about Indian electronic component industry is that while it is relatively competitive
in global markets, its competitive position is relatively weak in the domestic market, when compared to imports, especially from China and other Asian countries. Such imports are largely by assemblers in unorganized sector, which flood their products in the grey market, hurting the revenues of organized sector.
India has been relatively a strong player in the picture tube segment with large manufacturing facilities and new technologies. Other products / segments in which India is relatively considered as a strong player include: PCBs, connectors, passive components and other electromechanical components, such as relays, switches, contactors, fuses, etc. Manufacturers of these
Exhibit - 32: Production of Components in India
Source: Exim Research; data derived from Annual Report of Department of Information Technology, Government of India; ELCINA Electronics Industry Association of India

105
products range from large MNCs, who are focused on local as well as global markets, and medium as well as small scale Indian companies. Investments in these products, though widespread, are smaller compared to semiconductor manufacturing, and thus India has some strong players who have expertise and have been in business for long.
Exports and Imports
India has been largely an importer of electronic goods rather than an exporter of the same. Electronic goods were one of the most important items of imports in India. However, India’s export of electronic goods has been growing over the years. The growth trend has been positive
even in the year 2008-09, in which most of the sectors have witnessed slowdown in exports. During the year 2008-09, the exports of electronic goods were valued at US $ 6.8 billion, which constituted 3.7% of the total exports from India. The share of electronic goods exports from India in the total exports to the world, have more or less remained around 2% to 4% over the years. During 2009-10, India’s electronics exports were valued at US $ 5.48 billion, with a share of 3.1% in India’s total exports. During this period, electronic exports have shown negative growth of -19%, over the corresponding period of the previous year. During April – September 2010-11, the exports of electronic goods were valued at US $ 3469.95 million and showed a growth
Exhibit – 33: India’s Exports and Imports of Electronic Goods
Source: Directorate General of Commercial Intelligence and Statistics (DGCIS)
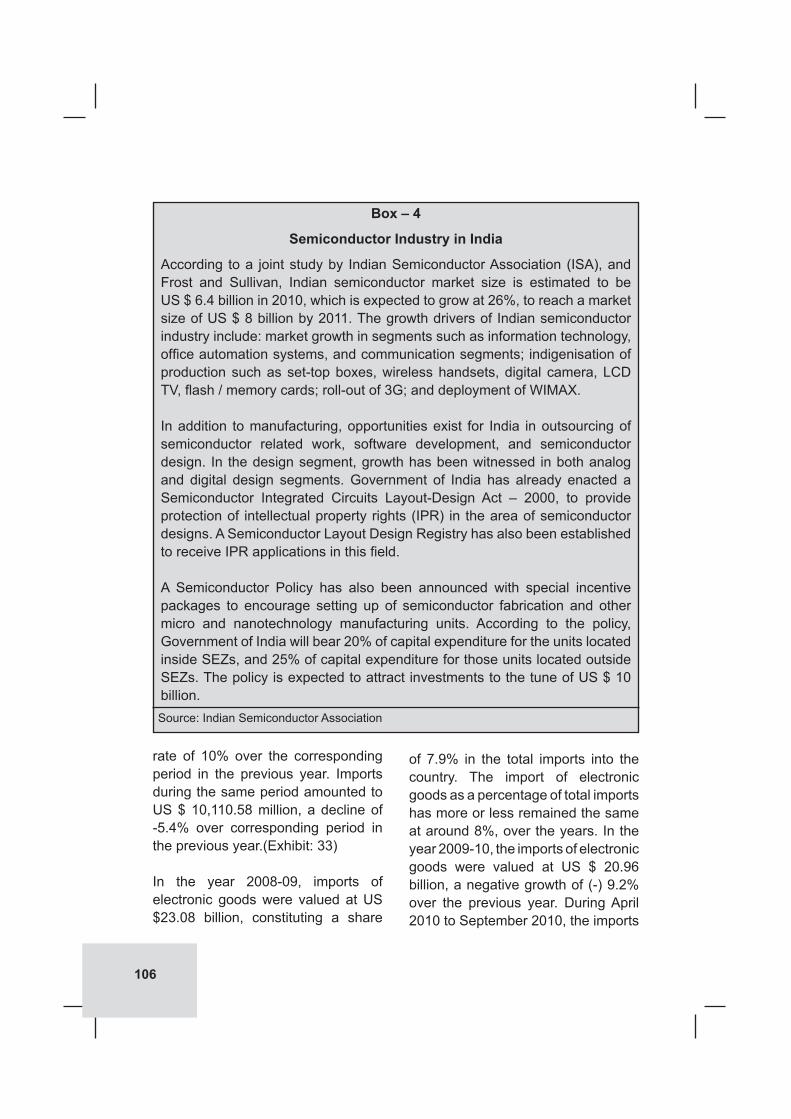
106
rate of 10% over the corresponding period in the previous year. Imports during the same period amounted to US $ 10,110.58 million, a decline of -5.4% over corresponding period in the previous year.(Exhibit: 33)
In the year 2008-09, imports of electronic goods were valued at US $23.08 billion, constituting a share
of 7.9% in the total imports into the country. The import of electronic goods as a percentage of total imports has more or less remained the same at around 8%, over the years. In the year 2009-10, the imports of electronic goods were valued at US $ 20.96 billion, a negative growth of (-) 9.2% over the previous year. During April 2010 to September 2010, the imports
Box – 4
Semiconductor Industry in India
According to a joint study by Indian Semiconductor Association (ISA), and Frost and Sullivan, Indian semiconductor market size is estimated to be US $ 6.4 billion in 2010, which is expected to grow at 26%, to reach a market size of US $ 8 billion by 2011. The growth drivers of Indian semiconductor industry include: market growth in segments such as information technology, office automation systems, and communication segments; indigenisation of production such as set-top boxes, wireless handsets, digital camera, LCD TV, flash / memory cards; roll-out of 3G; and deployment of WIMAX.
In addition to manufacturing, opportunities exist for India in outsourcing of semiconductor related work, software development, and semiconductor design. In the design segment, growth has been witnessed in both analog and digital design segments. Government of India has already enacted a Semiconductor Integrated Circuits Layout-Design Act – 2000, to provide protection of intellectual property rights (IPR) in the area of semiconductor designs. A Semiconductor Layout Design Registry has also been established to receive IPR applications in this field.
A Semiconductor Policy has also been announced with special incentive packages to encourage setting up of semiconductor fabrication and other micro and nanotechnology manufacturing units. According to the policy, Government of India will bear 20% of capital expenditure for the units located inside SEZs, and 25% of capital expenditure for those units located outside SEZs. The policy is expected to attract investments to the tune of US $ 10 billion. Source: Indian Semiconductor Association

107
Exhibit – 34 : India’s Major Export Destinations (region-wise) 2009-10
Source: Directorate General of Commercial Intelligence and Statistics (DGCIS)
Exhibit - 35: India’s Major Sources Countries (region-wise) 2009-10
Source: Directorate General of Commercial Intelligence and Statistics (DGCIS)
TotalUS $ 5.5 billion
TotalUS $ 20.9 billion

108
Table - 15: India’s Major Export Destinations andImport Sources of Electronic Products (2009-10)
Source: DGCIS
India’s major US $ Million % Share India’s major US $ Million % ShareExport destinations Import sources
World 5483.46 100.0 World 20963.14 100.0
USA 809.69 14.8 China 9494.95 45.3
Singapore 452.33 8.2 USA 1340.12 6.4
UAE 450.05 8.2 Singapore 1325.50 6.3
Germany 369.58 6.7 Korea Republic 1113.24 5.3
Hong Kong 317.82 5.8 Germany 994.50 4.7
Netherlands 270.79 4.9 Malaysia 821.84 3.9
China 256.19 4.7 Japan 716.95 3.4
Indonesia 189.42 3.5 Hong Kong 681.07 3.2
Nigeria 157.23 2.9 Taiwan (Taipei) 522.05 2.5
Romania 154.47 2.8 Sweden 469.01 2.2
of electronic goods were valued US$ 10.11 billion, a decline of 5.4% over the corresponding period in the previous year.
Major destinations for electronic exports from India during 2009-10 include Asia (excluding middle east) (31%) followed by European Union (20%), America (17%), Middle East (15%), and Africa (11%). (Exhibit: 34)
In the case of imports too, Asian countries (excluding Middle East) (74%) were the largest import sources for India, in the year 2009-10, followed by European Union (13%), America (8%) and Middle East (2%). (Exhibit: 35)
Table: 15 gives major export
destinations and import sources of electronic products for the year 2009-10. In the year 2009-10, the total exports were valued at US $ 5.48 billion and the major destinations for Indian electronic goods were USA (14.8%), Singapore (8.2%), UAE (8.2%), Germany (6.7%), Hong Kong (5.8%), and Netherlands (4.9%).
During the year 2009-10, total imports of electronic goods by India were valued at US $ 20.96 billion, and the major import source countries include China (45.3%), USA (6.4%), Singapore (6.3%) and Korea (5.3%).
Select categories of electronic exports from India are given in Annexures 9 to 13.

109
Source: Industry Sources
Box – 5
Electronic Manufacturing Services (EMS)
Electronic Manufacturing Services (EMS) is a term used for services offered by the companies that design, test, manufacture, distribute, and provide return/repair services for electronic components and assemblies for Original Equipment Manufacturers (OEMs). The business model for the EMS is to specialize in large economies of scale in manufacturing, raw materials procurement, and pooling together resources, industrial design expertise, as well as providing value-added services, such as warranty and repairs. This frees up the users of EMS from manufacture and stock huge inventories of components / products in order to provide efficient services, and help them in focussing on core production, and thereby catering to the sudden spikes in demand more quickly and efficiently. The major growth drivers for the EMS industry are, robust and consistent growth in electronic hardware market and the growing demand for telecom services, particularly cell phones, internet subscribers, growth in demand for IT products with increasing penetration of computers, falling prices, and Government support to encourage rapid use of IT in all sectors.
Global EMS market, which was estimated to be over US $ 125 billion in 2007, is forecasted to double, to reach a market size of US $ 250 billion by 2012. Asia Pacific region is the largest, as also the fastest growing EMS market in the world, with China and India expected to play a lead role in the market growth. According to Isuppli Research, revenue generated by EMS providers and Original Design Manufacturers (ODMs) in India is estimated to be over US $ 2 billion in 2009. The growth of the EMS/ODM industry in India will contribute to India’s overall electronics industry growth.
With ever-increasing demand in non-traditional end-use markets such as medical, industrial, aerospace, and defense electronics, that are swiftly embracing outsourcing strategy, lucrative opportunities are available for Indian EMS providers. The advantages of India in the EMS segment include availability of skilled workforce, low cost operations, and large and growing market for electronic products. However, logistics and supply chain conditions in India are posing challenges to this segment.

110
Increasing Exports of Electronics goods
Increasing exports of high value added items, embedding products with IPRs and diversifying India’s export basket would help in increasing India’s exports of electronic hardware. The strengths of Indian electronics industry in design, system integration and diagnostic skills needs to be leveraged for catering to niche markets. According to a Strategy Paper on ‘Doubling Exports in Next Three Years (2011-12 to 2013-14)’, prepared by the Ministry of Commerce, Government of India, the export target of electronic goods are expected to be US $ 15 billion by 2013-14 and the contribution of different items and categories
of electronic goods are given in Table-16.
The target of exceeding US$ 15 billion of electronic goods exports by 2013-14, and substantial import substitution as a by-product, would require addressing some of the challenges related to infrastructure, labour productivity, costs and common facilities. Adopting strategies such as setting up clusters, diversification of export goods, simplification of custom procedures, support for R&D for generating IPRs and development of high technology products, nurturing skill development and improvement of infrastructure would help the electronic goods industry in increasing their exports.
Table - 16: Contribution of Different Items and Categories of Electronic Goods(US $ million)
Sl no Category 2010-11 2011-12 2012-13 2013-14 1 Mobile Phones 1560 2100 2700 3600 2 Sub Assemblies 1070 1280 1550 1900 3 Electronic Components 1020 1310 1720 2300 4 Audio-Video Products 1000 1300 1500 1800 5 Computer Peripherals & Parts 450 590 770 1000 6 Power Equipments 420 530 700 850 7 Solar Energy Products 400 500 630 770 8 Medical Equipments 300 340 440 500 9 Telephone Sets 250 300 380 430 10 Industrial Equipments 200 220 270 300 11 Computers 80 100 140 160 12 Trans. Apparatus & Parts 40 50 70 80 13 Watches and Clocks 30 40 50 60 14 Others 680 840 1080 1250
Total 7500 9500 12000 15000
Source: Ministry of Commerce

111
4. CHALLENGES, GOVERNMENT POLICIES, AND STRATEGIES
CHALLENGES
Small Size / Scale of Operations
The size and scale of operation of majority of electronic manufacturing units in India are small compared to global standards. This leads to non-operation of economies of scale in terms of cost disadvantage in production (low capacity translates into higher per unit cost), as well as catering limited ability to adhere to supply commitments. Non-operation of economies of scale offset the overall advantage of low-cost labour in manufacturing. The skewed tax structure in favour of small scale units had encouraged establishment of more small scale units in various locations across the country.
Low Level of Component Base
The Indian electronics components industry is restricted to passive components. Even here, relatively larger presence is only in few sectors. The low domestic volumes and import / customs procedures and regulations do not encourage stock and trade of components. In the case of mechanical parts, suppliers do exist with technical capability. However,
the industry has not positioned itself to cater to the needs of high-volume customers and would need substantial up-gradation of management skills. Also, to cater to the emerging needs of semi-conductors industry, in all areas of manufacturing, including the Government sectors such as defence, space etc., it is essential that this area be given a major thrust under government policies.
Challenges Associated with Supply Chain and Logistics Management
While inadequate (roads, ports) and high cost of infrastructure (power) hinders the competitiveness of the Indian electronic industry in international market, the challenges of supply chain management and logistics solutions, which are essential for timely delivery of electronic products, are also affecting the competitive landscape of Indian electronics industry. While significant progress has been made in improving the Turn-Around-Time (TAT) for delivering a product via road, it is yet to be streamlined to the international levels of 15-20 minutes as compared to a day or two in India.

112
Challenge of Shorter Product Life Cycle
New technologies, changing standards and shorter product life cycles constantly challenge the manufacturers of electronic goods. This challenge is also extended upto the vendors of capital equipment and machinery that are used in producing electronic goods. The vendors have to match short product cycles by quick response to changing technologies through producing equipments that will cater to production of new generation products. For example, communication equipments manufacturers are scrambling to bring to the market with products embracing new technologies such as wireless internet. Consequently, they bring to the market initial versions of products while revised versions are still under design. Test equipments vendors following this market are also forced to provide test equipments that can be easily upgraded in the future to accommodate revisions in specifications. Sometimes, the equipments need to be designed to accommodate the addition of emerging technologies. All these call for a high level of open systems design, modularity and flexibility in hardware and software architecture.
Low Level of Technology Absorption
The low volume of production implies that any capital equipment with a
given technology used by an Indian company is not optimally utilized; while its physical life lasts for a longer time, technologically they become obsolete in a short span of time, calling for modernization and upgradation. Yet, most of the Indian companies prefer not to go for new technology / capital equipments as they are costly proposition in view of sub-optimal utilization of capital equipments.
Limited Facilities for Standards and Testing
In electronic hardware segment, technology is changing rapidly. Most of the countries in the world have laid down standards for new products to ensure that low quality products are not dumped into the country. India has limited standard and testing facilities in the country and also have limited number of well-equipped labs (such as Electronic Regional Test Laboratories, and Society for Applied Microwave Electronics Engineering and Research). Electronic equipments need to perform properly at all times, and especially under adverse conditions, emergencies, or disasters. Achieving compliance to certification requirements will turn out to be difficult without adequate number of testing and standards facilities. Setting up of modern testing labs will help electronic product designers and manufacturers in achieving their compliance requirements as quickly and efficiently as possible.

113
Grey Market
Unlike black market goods, grey-market goods are not usually illegal. Instead, they are sold outside normal distribution channels by companies which may have no relationship with the producer of the goods. Frequently this form of parallel market occurs when the price of an item is significantly higher in one country than another. This situation is commonly prevalent with consumer electronic items. Traders buy the products where they are available at low cost, often at retail, but sometimes at wholesale, and sell at a price high enough to provide a profit but below the normal market price. Because of the nature of grey markets, it is difficult to track the precise volume of grey-market sales. Grey-market goods are often new, but some grey market goods are used goods. A market in used goods is sometimes nicknamed a Green Market. According to industry estimates, the worst affected segments are premium watches, gaming consoles and digital cameras. As per some estimates, the grey market for premium watches is almost 50% of the total sales. While the grey market accounts for 30% of the gaming console market in India, it is 25% in the digital camera market.
Managing E-waste
As the demand for electronic goods is increasing, so is the challenge
of managing the E-waste. E-waste means electronic goods that are no longer in use or may not be re-usable, including computers, home appliances, clocks and watches, electronic toys, medical devices and industrial equipments. According to some estimates, Mumbai tops the list of cities with around 12,000 tonnes of E-wastes, followed by Delhi (around 10,000 tonnes), Bangalore, Chennai, Kolkata and Ahmedabad (around 4,000 tonnes each). Though the challenge of managing E-waste in India is at a nascent stage, this may turn out to be a serious challenge at a later stage.
Low R&D Intensity
India is heavily dependent on imports of electronic goods, from countries like the U.S. and China, to meet its domestic demand. Lesser spending on research and development by electronics industry has increased India’s dependence on electronics imports which has been growing over the years. Exhibit 36 gives the gross domestic expenditure on R&D as percentage of GDP for select countries. It may be noted that India has very low share in the total expenditure on R&D compared to other countries. While India’s share on R&D expenditure was 0.88% of GDP, China held a share of 1.44%. Israel was the country with the largest share in R&D expenditure with a share of 4.86%. The R&D intensity of

114
Exhibit - 36: Gross Domestic Expenditure on R&D as Percentage of GDPfor Select Countries
Source: OECD Factbook, 2010
Table - 17 : R&D Expenditure in India by Sectors (2009-10)
Key Industries R&D intensity
Pharmaceuticals 4.99
Non Electrical Machinery 1.63
Transport Equipment 1.45
Electronics 0.73
Plastics 0.25
Electrical Machinery 0.21
Agriculture 0.20
Chemicals 0.18
Leather 0.12
Mineral 0.11
Source: Prowess

115
electronic industry was 0.73% during 2009-10.
Low Penetration of Distribution Network
Due to the inadequate world-class infrastructure facilities in India, distribution of electronic goods across the country poses a great challenge. High cost of moving goods and inefficient storage adds to the problem. Not so well-developed distribution networks make the distribution challenging to penetrate the fastest growing rural areas economically. In addition, regular power cuts and poor road linkages make systematic production, assembly and delivery a challenging proposition. India also has limited availability of proper storage and warehousing facilities in the rural parts of the country.
Shortage of Skilled Labour
The Indian electronics industry is undergoing a lot of changes with the advent of new technologies, new product standards and new emission norms. India has shortage in skilled labour in the electronics industry. Not enough industry-ready trained personnel are available. The talent pool is also concentrated in a few metros, and attracting such talent to Tier II cities and small towns is a difficult task. High attrition rate, due
to the small pool of talent available, is another challenge faced by the industry. As the industry readies for a major growth in the future, it is imperative for the players, as also the policy makers to look at developing skills to meet the increasing demand.
Low Value Addition
Indian electronic industry faces the challenge of low value addition. Usage of electronics is pervasive in many other sectors as well, like automobile, aviation, etc. As the domestic electronic industry is not having a strong manufacturing base, most equipments are imported with hardly any value addition being done in India. R&D plays a very important role for value addition in the country. However in India R&D intensity is very low.
Complying with Environmental and Social Standards
Most Indian electronics goods are considered as relatively inferior in global markets. Limited awareness about environmental and social standards and the cost involved in obtaining the globally recognized certifications are the major reasons for limited number of manufacturers adhering to such standards.

116
GOVERNMENT MEASURES AND POLICIES
Special Incentive Package Scheme (SIPS)
In order to create a conducive environment for the high technology, capital intensive semiconductor industry, and other high tech electronic items, with the objective of attracting global investments, a Special Incentive Package Scheme (SIPS) has been announced by the Government of India. Under the Scheme, the Government of India will provide a package of incentives for investment in the manufacture of all semi-conductor (Fab units) products (threshold NPV of investment for availing incentives: ` 2500 crore and above), and eco-system units, namely, displays including Liquid Crystal Displays (LCD), Organic Light Emitting Diodes (OLED), Plasma Display Panels (PDP), any other emerging displays; storage devices; solar cells; Photovoltaic; other advanced micro and nano technology products; assembly and test of all of the above products (threshold NPV of Investment for availing incentives: ` 1000 crore and above).
Under the Scheme, Central Government or any of its agencies shall provide incentive of 20% of the capital expenditure during the first 10 years for the units located in SEZ (and 25% for non-SEZ units). The incentives, if any, offered by the State
Government or any of its agencies or local bodies shall be over and above this amount. Units in Non-SEZ locations shall be exempted from CVD.
Apart from this, SEZ/non-SEZ units may claim incentives from the Government in the form of capital subsidy or equity participation in any combination of the following:
• Equity in the project, not exceeding 26%.
• Capital subsidy in the form of investment grant and interest subsidy.
• The entire equity contribution will be taken towards the value of incentive package. There shall be an exit option, to be exercised by the Government, at a suitable point of time in the future, after the project goes on stream.
• Those investors who chose equity as part of their incentive package shall be given such equity after the financial closure for the project and equity shall be released on a proportionate basis, as and when the equity is brought in by the promoters.
• All other incentives will be released at the end of the financial year in which the NPV of the total investment exceeds the threshold value.
• Thereafter the incentives shall be provided on an annual basis on

117
Box: 6Restriction of Hazardous Substances (RoHS)
Restriction of (certain) Hazardous Substances (RoHS) is a result of the Waste Electronic and Electrical Equipment (WEEE) Directive, (in the EU) which addresses end of life issues on electrical components. The WEEE Directive is essentially concerned with the introduction of hazardous materials into the environment during recycling or disposal. The Restriction of Certain Hazardous Substances in Electrical and Electronic Equipment (RoHS) Regulations implement the requirements of the RoHS Directive into UK law. The environmental objectives of RoHS are to reduce the amount of hazardous substances being processed and refined and the amount of the substances being reprocessed at the end of life of electrical and electronic equipment. NMO (National Measurement Office) is the UK Enforcement Authority for the Restriction of the Use of Certain Hazardous Substances in Electrical and Electronic Equipment Regulations, 2008 (the “RoHS Regulations”). These Regulations implement the EU Directive 2002/95, which bans the placing on the EU market of new electrical and electronic equipment, containing more than agreed levels of lead, cadmium, mercury, hexavalent chromium, polybrominated biphenyl (PBB) and polybrominated diphenyl ether (PBDE) flame retardants.
The enforcement of RoHS in the UK has developed over the last three years, from an initial position where there was a significant level of non-compliance. As such, engagements were aimed at education and influencing the market. Now, the delivery of RoHS is at a more stable ongoing delivery, where most businesses are aware of the requirements and most electrical equipment tested is compliant. In this environment, NMO takes a more direct approach to engagements where infringements have been identified or organisations are less cooperative. However, the Authority still identifies some market sectors, where there is a lack of knowledge or inappropriate interpretations of scope may have generated a view of not being subject to the regulations. The Authority continues to engage with those areas where appropriate to educate first.
Over the period from 1 April 2009 to 31 March 2010 the Authority engaged with over 300 organisations. The majority of the engagements were in the form of targeted projects on specific market sectors. This is then supported by a number of additional engagements with specific organisations based on intelligence such as information provided by another Member State or through a verifiable complaint.
During the year the screening facility at NMO has tested 72 items. Where restricted substances were detected at significant levels then the reports were passed to the enforcement officers for assessment. A smaller number of items were also escalated to full analysis at third party facilities. This was mainly where NMO believed there was a higher risk of detected bromine being in a restricted form or where the Authority required further clarification as part of an ongoing investigation. Of the 72 items tested, 29 had levels detected that required follow up activity of which some resulted in direct intervention. However, several of the items tested, on investigation, were identified as entering being placed on the market before 1 July 2006. This was particularly true of low value and seasonal products.
Source: Exim Research, www.rohs.gov.uk

118
the value of investments made during the year and be restricted to the first ten years of the project life.
• There shall be a ceiling to the number of units – 2 to 3 fab units and 10 ecosystem units.
The scheme was valid till March 2010, but the Government is considering the extension of the Scheme. The Department of Information Technology (DIT) received 26 project proposals involving a total investment of Rs 2.29 trillion as on March 2010.
Infrastructure Support
Inadequate infrastructure has been identified as one of the constraining factors being faced by the electronics hardware manufacturing sector. In order to address the same, the Government has notified the Policy Resolution for setting up of Information Technology Investment Regions (ITIRs). These regions would be endowed with excellent infrastructure and would reap the benefits of co-siting, networking and greater efficiency through use of common infrastructure and support services.
Prioritizing Electronics Hardware Manufacturing
Electronics and IT Hardware manufacturing has been identified as a thrust sector for Special Focus
Initiatives in the Foreign Trade Policy. Under the Special Focus Initiative of the Foreign Trade Policy following measures have been taken:
• Expeditious clearance of approvals required from DGFT shall be ensured;
• Exporters/Associations would be entitled to utilize Market Access Initiative (MAI) & Market Development Assistance (MDA) Schemes of the Department of Commerce for promoting export of Electronics and IT Hardware.
Schemes available for setting up EOU/EHTP/STP/SEZ
Special schemes are available for setting up Export Oriented Units for the Electronics Hardware Sector. Various incentives and concessions are available under these schemes. The salient features of EOU, EHTP, STP and SEZ schemes are given in Table: 18.
Offset Policy for Defence Procurement – Opportunity for Electronics
The Defence Procurement Procedure (DPP) was first announced in 2006 to serve as a formal set of guidelines for major defence purchases. The DPP was revised to further streamline the procurement process and improve transparency in purchases. An

119
Box – 7
Electronic Hardware Technology Park (EHTP) Scheme
The EHTP Scheme is a 100% Export Oriented Scheme for undertaking manufacturing of electronic hardware equipment / components and other items in India. An EHTP unit is also allowed to manufacture items other than those specified in the approval letter, provided that such other items fall in the category of electronic hardware, the design and production facilities are common, and have similar manufacturing processes. Some of the additional features of EHTP scheme include: The Central Government, State Government, Public or Private sector
undertakings, or any combination thereof, may set up the Electronic Hardware Technology Park (EHTP);
A company may set up EHTP unit anywhere in India; Foreign equity permissible upto 100%, under the automatic route; projects
costing less than ` 100 million investment are cleared by local STPI Authorities;
Income Tax holiday as per IT Act of Ministry of Finance, Govt. of India applicable from time-to-time. EHTP units are exempted from tax payment of export income;
Capital invested by foreign entrepreneurs, know-how fees, royalty, dividend etc., can be freely repatriated after payment of income taxes due on them, if any;
EHTP unit is a duty free bonded area under section 65 of the Customs Act, 1962;
100% customs duty exemption on import of capital goods and inputs (raw materials, components, consumables, parts and packing materials); Import of second hand capital goods is also permitted. (except prohibited items);
100% excise duty exemption on indigenous items procured; Re-export of capital goods is permitted; Sales in the DTA (Domestic Tariff Area) permitted up to 50% of the foreign
exchange earned by the EHTP unit; Inter-unit transfer and sub-contracting between EOU/STP/EHTP/EPZ is
permitted; Simplified Net Foreign Exchange Earnings (NFEP) & Export Performance
(EP) norms, as applicable at the time of signing EHTP agreement; simplified depreciation norms on capital goods.
Source: Department of Industrial Policy and Promotion, Government of India

120
amendment was issued, effective November 2009, to include the following:11
• Introduction of new category for acquisition ‘Buy & Make (Indian)’;
• Sharing of information with Indian industry;
• Enhancing role of independent monitors;
• Removal of ambiguity regarding EMD (Earnest Money Deposit) in signing the Integrity Pact;
• Formulation of SQRs (Services Qualitative Requirements) including issue of Request for Information (RFI);
• Offsets requirement in ‘Option Clause’ cases and change of offset partner in exceptional cases.
According to the Department of Information Technology (DIT), Government of India, production of strategic electronics in India during 2008-09 was ` 6840 crores which showed a growth of 20% over the
Source: Department of Information Technology
11Source: Elcina Electronics Industry, Directory 2010
Table - 18: Benefits Available for EHTP/STP/EOU and SEZ Units

121
previous year. During 2009-10, the production is estimated to be ` 6980 crores, a marginal increase of 2% over the previous year. Also the outlay for defence has gone up from ` 1,41,703 crore in 2009-10 to ` 1,47,344 crores in 2010-11, including ` 60,000 crore for capital expenditure. This means that almost 40% of the total defence budget will be spent on capital acquisition. This offers immense growth opportunity for domestic electronics manufacturers serving the defence requirements.
Research and Development
A key focus in the electronics sector is R&D leading to innovative products. DIT has long acknowledged R&D as an integral part of electronics ecosystem and is supporting the entire value chain of R&D activities in the country, ranging from the basic components to sophisticated product development. As a roadmap for developing, strengthening and enhancing the competitiveness of the Indian electronics sector, DIT has constituted a specialized Group - R&D in Electronics - to conduct sponsored R&D activities across India at various academic institutions of higher learning, and R&D laboratories, in the areas assigned to it through a variety of Plan programmes. The sophisticated projects assigned to the groups cover a wide spectrum of key technological areas. These include
developments in Nanotechnology, Medical Electronics, Microelectronics, and Industrial Electronics.
The major R&D initiatives of the Group has been in the development of Linac tubes, Automation and Intelligent Transportation Systems (ITS) technology, setting up of Nanoelectronics centers and generic Nanometrology facilities. Tariff Structure
The salient features of the existing tariff structure/ policy applicable to electronics hardware industry are briefly outlined below:
Customs Duty
• As a measure of rationalization of duty structure, the rates of 2% and 3% are being unified with the median rate of 2.5%. Accordingly, basic customs duty on all goods currently attracting 2% has been increased to 2.5% and basic customs duty on those goods attracting 3% has been decreased to 2.5%.
• Full exemption from basic customs duty, additional duty of customs equivalent to excise duty presently available on parts, components and accessories of mobile handsets including cellular phones is being extended to parts,

122
components for manufacture of PC connectivity cable and subparts of parts and components of PC connectivity cable, battery chargers and hands-free headphones of mobile handsets including cellular phones.
• Full exemption from Special Additional Duty of customs on parts, components and accessories of mobile handsets including cell phones is now being extended to parts, sub-parts and components of battery chargers, PC connectivity cable and hands-free headphones of mobile handsets including cellular phones. Validity of this exemption is also being extended upto 31.3.2012. The list of specified raw materials for use in electronics/IT industry, eligible for custom duty exemption is being expanded to include some more items.
• LEDs used for manufacture of LED lights and light fixtures are being fully exempted from levy of special duty of customs leviable under Section 3(5) of the Customs Tariff Act, 1975.
• Full exemption from payment of Additional duty of Customs (CVD) is being granted on the portion of value representing the consideration paid or payable for the transfer of the right to use such goods to those packaged or
canned software, which do not require affixation of RSP under The Legal Metrology Act, 2009 or the rules made there under, subject to the importer being registered under the Service Tax.
• CVD / excise duty on the parts of optical disc drives viz. DVD Drives/ Writers, CD Drives and Combo Drives is being reduced to 5% and zero SAD subject to actual user condition.
• Excise duty/ CVD is being reduced to 5% and SAD to zero on parts of inkjet & laser jet printers imported by actual users for manufacture of printers.
Central Excise
• An Excise Duty @ 5% has been imposed on specified IT products viz microprocessor other than motherboards, floppy disc drives, CD-Rom drive etc when these items are meant for internal use in the CPU housing/laptop body. These items meant primarily for external use with a computer or laptop will also be liable for 5% excise duty/ CVD.
• Excise duty/ CVD has been reduced to 5% and SAD to NIL on parts of inkjet & laser-jet printers imported by actual users for manufacture of printers.

123
• Full exemption has been provided for parts/ components of PC connectivity cable imported for its manufacture.
• Full exemption are also being provided for sub parts of parts & components of battery charger, hands free headphones & PC connectivity cable imported for manufacture of these parts of mobile handsets including cellular phones.
• Duty on the parts of optical disc drives viz CD drives, DVD Drives/ Writers and Combo Drives is being reduced to 5% CVD / excise duty and zero SAD subject to actual user condition.
• Excise duty/CVD is being reduced from 10% to 5% and Special Additional Duty of customs leviable under Section 3(5) of the Customs Tariff Act, 1975 is being fully exempted on LEDs used for manufacture of LED lights and light fixtures with actual user condition.
STRATEGIES
Rapid Customer Response
To keep a step ahead of the competition, companies know that they must satisfy their customers’ changing demands - whether their
customers are end users or other industry suppliers. This means maintaining a customer-focused, forward-looking business strategy and keeping abreast of new standards and new technology developments. The solutions should address the complete range of requirements for organizations that are focused on ensuring quality of service (QoS) starting from research and development (R&D) organizations to manufacturing, engineering, operations, information technology, and sales and marketing fields.
Adherence to Quality
Quality is a driving factor in the electronics goods industry - starting from end-user service providers all the way back to the development laboratories of the equipment manufacturers. Enterprises can gain competitive advantage only through offering unique products and services. Efforts should be made to concentrate not only on research and development but also in the adaptation of already existing technology to build distinctive technical competence and develop superior products and services.
Effective E-waste Management
According to a Report by Centre for Environmental Studies, the best option for dealing with E-wastes is to reduce the volume of E-waste.

124
Designers should ensure that the product is built for re-use, repair and/or upgradeability. Stress should be laid on use of less toxic, easily recoverable and recyclable materials, which can be taken back for refurbishment, remanufacturing, disassembly and reuse. Recycling and reuse of material are the next level of potential options to reduce E-waste. Recovery of metals, plastic, glass and other materials reduces the magnitude of E-waste. These options have a potential to conserve the energy, and keep the environment free of toxic material that would otherwise have been released.
Also suggestions were given on salvaging and combining usable parts which could be salvaged with other used equipment to create a working unit. It is labor-intensive to remove, inspect and test components and then reassemble them into complete working machines. Institutional infrastructures, including E-waste collection, transportation, treatment, storage, recovery and disposal, need to be established, at national and/or regional levels for the environmentally sound management of E-wastes. These facilities should be approved by the regulatory authorities, and if required, to be provided with appropriate incentives. Establishment of E-waste collection, exchange and recycling centers should be encouraged in partnership
with governments, NGOs and manufacturers.
Ministry of Environment and Forests, Government of India has announced E-waste (Management and Handling) Rules 2010 for handling of E-waste by defining the responsibilities of stakeholders such as producers, dealers and recyclers among others. According to the E-waste (Management and Handling) Rules 2010, the producer of electronic goods, including household appliances, computers, toys and medical equipments shall be liable for collecting any E-waste generated while manufacturing, and will have to channelize it for recycling. In fact, the producers’ responsibility will go beyond the boundaries of the manufacturing unit. They will set up collection centres for E-waste generated from `end of life’ of their products in line with the principle of `extended producer responsibility’ and ensure that such E-waste is channelized to a registered refurbisher. They shall also finance and organize a system to meet the costs involved in handling the E-waste. The rules moot a unique serial number or individual identification code for product tracking in the E-waste management system. Dealers have to make provision for collecting used appliances. Besides registering themselves with the respective State Pollution Control Boards, they will have to

125
submit details of the collected waste annually. Even the consumers are expected to do their bit by ensuring that the electronic equipment, not fit for use, is deposited with the dealer or authorized collection centre.
Emphasizing the reduction in use of hazardous substances (RoHS) in the manufacture of electrical and electronic equipment over a three-year period, the Rules state that producers are expected to adhere to the prescribed minimum threshold limits to using such substances. Further, the import of used electrical and electronic equipment for charity shall not be allowed in the country, the Rules state. Further, the stakeholders shall be liable for any damage caused to the environment or human health including third parties due to improper handling and disposal of E-waste. They shall inform the authorities of such damage and undertake to reinstate or restore the damage at their cost, failing which they shall be liable to pay the entire cost of remediation or restoration of the environment. Even the consumers shall be liable to deposit the E-waste with an authorised dealer or collection centre, failing which they shall be liable to pay a fine as specified for violation of the provision.
It may be mentioned that EU has already issued two directives, in 2006, one on Restriction of
Hazardous Substances (ROHS), and the other one on Waste Electronics and Electrical Equipment (WEEE). The WEEE aims at management of electronics waste, especially the reuse, recycling and other forms of recovery of such wastes so as to reduce the disposal of waste. The Directive also seeks to improve the environmental performance of all operators involved in the life-cycle of electrical and electronic equipments, including the operators directly involved in treatment of electronics waste.
Establishing ‘National Electronics Mission’
A high-level Task Force for the Information Technology (IT) industry has recommended constitution of ‘National Electronic Mission’, a nodal agency for the electronics industry under the Department of Information Technology, Government of India, with direct interface to the Prime Minister’s Office (PMO). The Task Force has said that this nodal agency would help in the synchronized functioning of the industry through effective coordination across various ministries and Government departments. The main functions of the nodal agency would be to attract investments into India, promotion of Brand India, facilitating business in India, managing R&D fund and manufacturing of value added products. Some of the other

126
recommendations which were given by the Task Force include: building of adequate basic, business and social infrastructure; favourable business policy and regulatory environment; fostering a sustainable ecosystem for innovation, R&D and manufacturing; and maintaining globally competitive tax regime.
Research & Development
India is heavily dependent on imports of electronic goods from countries like the U.S. and China to meet its domestic demand. Lesser spending on research and development by electronics industry has increased India’s dependence on electronics imports, which have been growing over the years. Hence, it is important to strengthen and develop the Research and Development programmes in the electronics industry. This will help in improving the domestic electronic industry and will also promote the ‘Brand India’ products. Also through regressive research, India would be able to reduce its import dependency of electronic goods from other countries.
Exhibit 36 gives the gross domestic expenditure on R&D as percentage of GDP for select countries. It may be noted that India has very low share in the total expenditure on R&D compared to other countries. While India’s share on R&D expenditure was 0.88% of GDP, China held a share of 1.44%. Israel was the country with
the largest share of R&D in national GDP at 4.86%. The R&D intensity of electronic industry in India was 0.73% during 2009-10.
According to the Task Force on information technology industry, India should also focus on new and emerging areas that are likely to grow in importance over the next few decades. Some of the opportunities analyzed by the Task Force are in the areas such as: climate change and energy efficiency solutions, mobile software applications, and end to end clinical research applications.
The Department of Information Technology, Government of India, has constituted a specialized group - R&D in Electronics - to conduct sponsored R&D activities across India at various academic institutions of higher learning and R&D laboratories, in the areas assigned to it through a variety of Plan programmes. The sophisticated projects assigned to the groups cover key technological areas, such as developments in Nanotechnology, Medical Electronics, Microelectronics and Industrial Electronics. The major R&D initiatives of the Group has been in the development of Linac tubes, Automation and Intelligent Transportation Systems (ITS) technology, setting up of Nanoelectronics centers and Generic Nanometrology facilities. The industry should also focus on more R & D related activities.

127
Thrust to Semi-conductor Industry
India has an edge in semiconductor design, embedded systems and has the potential of becoming an engineering design house for the world. Combining with its software strength, Indian embedded technology is globally acclaimed and accredited. With increasing demand for domestic electronic goods and the availability of a pool of talented engineers, India is fast creating a footprint on the semiconductor roadmap. The Indian semiconductor industry is currently dominated by players engaged in chip designing activities.
As the semiconductor industry is going through the transition phase to newer technologies, semiconductor manufacturing and IC (integrated circuit) design are becoming increasingly interdependent as neither activity can be carried out without in-depth knowledge of the other. Coupled with this is the fact that embedded software forms a significant part in the design of today’s System-on-Chips, where India is already seen as a leader.
India has to complement design and R&D expertise with local manufacturing, which would help in increasing the value addition. Global demand for semiconductors is growing, and therefore, if India can integrate its chip design services with
fabrication facilities, it can result in growth of competitive manufacture of electronic products and success in the domestic as well as global markets.
Developing and Improving ICT Interface in India
According to Telecom Regulatory Authority of India during 2009-10, the broadband subscriber base increased from 6.22 million to 8.77 million and the internet subscribers base increased from 13.54 million to 16.18 million over the previous year. The gross usage of Internet Telephony was 122.96 million minutes in 2009-10.12
It may be mentioned that Information and Communication Technology (ICT) is changing the face of the contemporary world. The ICT has not only connected the world at one single platform, but it is also helping the integration of various traditional societies into modern societies. Information and communication technology plays a very important role in the development of an economy especially because it addresses the problem of digital divide. More importantly, ICT enabled solutions can overcome the difficulties that hamper traditional solutions.
ICT enabled services are very important in all the major sectors of the economy such as manufacturing,
12Telecom Regulatory Authority of India, TRAI

128
education, healthcare, financial services and public services. ICT helps manufacturing sector because it has the potential to contribute towards income generation and poverty reduction. It enables countries to capture economic opportunities by increasing process efficiencies, promoting participation in expanded economic networks and generating opportunities for job creation. Development of ICT infrastructure and connectivity are one of the main indicators that investors look for as an indication of technological development in a country. Enhanced ICT interface helps the manufacturing companies fit seamlessly into value chain of multi-national corporations easier. Hence it is very essential to have ICT interface in the manufacturing sector. This would also enhance the demand for electronics products. Brand Building Initiatives
More efforts should be taken by the manufacturers and sellers of electronic products in the country, to build ‘Made in India’ brand. Currently, in the global electronic industry, Indian products have limited level of competitive brand perception. Marketers see a brand as an implied promise with desired level of quality expected of from a product, which will enable them to continue with future purchases of the same product. This may increase sales by
making a comparison with competing products more favorable.
Brand development is more important these days because customers have started becoming more conscious of the products they buy, and they are expecting products with good quality and standards. The advantage of branded products is the assurity that the quality will be good. Hence, Indian electronic firms should increase their focus on brand development and management, as it will help to create desirability in international markets for products manufactured in India. Further, the firms may strengthen the ‘Incredible India’ branding campaign and run it regularly through key international media.
Developing Market Sustenance
In order to be ahead of the competition, it is necessary for the Indian electronic industry to aggressively handle the market and adopt measures for market sustainability. The Indian electronic firms should be able to identify the changing consumer needs and the industry standards so that they are in a better position competitively. They should also concentrate on taking care of the customers with sensitivity, speed and responsiveness by establishing effective channels of distribution and reaching out to them. This would help in building relationships for long-term sustenance in international market.

129
Also, Indian electronic industry should concentrate more on providing new generation products that maybe in demand in future. For example, Nanotechnology, which is widely regarded as the next technological revolution, has attracted the attention of scientists, researchers and technologists all over the world and is likely to have a profound effect on almost all industry sectors and application areas in the coming years. DIT (Department of Information Technology), Government of India has taken measures for promoting emerging areas of technology like RFID (Radio Frequency Identification), smart cards, ubiquitous computing, perception engineering, scientific computing, nanotechnology, digital preservation and M-Commerce initiative.
Cluster Development
Micro, small and medium enterprises (MSME) sector has been recognized as an engine of growth all over the world. The sector is characterized by low investment requirement, operational flexibility, location wise mobility, and import substitution. Over the years, the small scale sector in the electronic industry in India has progressed from the production of simple consumer goods to the manufacture of many sophisticated and precision products like electronics control systems, micro wave components, electro medical equipments, etc. The process of
economic liberalization and market reforms have further exposed these enterprises to increasing levels of domestic and global competition. The formidable challenges so generated for them have led to a novel approach of cluster development for the sector. As a result, private and public sector institutions, both at the Central and State levels are increasingly undertaking cluster development initiatives.
The major advantages of a cluster are the availability of common opportunities which help them in creating a conducive ground for the development of inter-firm cooperation to promote collective production, collective innovation and collective learning. One of the major disadvantages in India is the technological and infrastructural challenges. Cluster approach will help in meeting these challenges by creating an atmosphere of common infrastructure, technology and opportunities. Also, all companies may not have all the necessary skills to develop unique products and services by themselves; therefore cluster approach would serve this purpose and would also become the source for increasing income, jobs and export growth. Clusters arise because they increase the productivity with which companies can compete. The development and upgrading of clusters is an important agenda for

130
governments, companies, and other institutions. Cluster development initiatives are an important new direction in economic policy, building on earlier efforts in macroeconomic stabilization, privatization, market opening, and reducing the costs of doing business.
Clustering of technology companies in an area is very beneficial to developing new industries in a country. Taiwan is an illustrative success story. Taiwan’s Hsinchu Science Park, spread over 600 hectares has clusters of most of the semiconductor component manufactures, thus saving on time and cost for assembly13. This Park includes independent wafer foundries, IC design companies, fabricators, as well as packaging and testing companies for the semiconductor industry, all at one place. The model is now being replicated by China and Malaysia as well. In such clusters, one can find trained people more easily and form inter-relationships between suppliers and vendors that make development of products faster, cheaper and even lead to better innovations. Most countries have typically evolved clusters naturally over a time period. India should also follow such models for the better development of the electronics industry.
Improved Standards and Testing Facilities
In electronic hardware segment, technology is changing rapidly. Most of the countries in the world have laid down standards for new products to ensure that low quality products are not dumped into the country. In Taiwan the Industrial Technology Research Institute (ITRI) helps the electronics industry to expedite the development and upgrading of new industrial technology. ITRI founded the Centre for Measurement Standards (CMS) for this purpose. CMS is authorized by the previous National Bureau of Standards (now called as Bureau of Standards, Metrology & Inspection) of the Ministry of Economic Affairs. The R&D activities of CMS mainly focus on measurement standards and technology development, measurement standards and legal metrology development, instrumentation and sensing technology development, metrology verification and innovation application, medical device evaluation, and pioneering sensing technology. Thus, in the product cycle, quality is assured in every stage. In this way the products of good standards are assured.
13Consultation paper on Telecom equipment manufacturing in India, Telecom Regulatory Authority of India (TRAI)

131
Box: 8
EMC Certification Scheme
EMC compliance certification scheme is a third party certification scheme promoted by Standardisation, Testing and Quality Certification (STQC) Directorate, under the Department of Information Technology, Ministry of Communication and Information Technology. This scheme is intended to provide by means of system assessment, testing and subsequent surveillance, an adequate level of confidence that the product conforms to the specified requirements of appropriate EMC standard.
Objectives of EMC Certification Scheme.• To meet the needs of society and to provide adequate level of confidence
to purchasers that the product meets EMC requirement. • To enable manufacturers to get FCC (Federal Communications Commission)
certification, which is a mandatory requirement for export to USA. • To enable manufacturers to comply with the requirement of European Union’s
EMC Directive, and put CE Marking, which is mandatory requirements for export to Europe.
Features of EMC Certification Scheme• Third party Certification Scheme for products based on IEC (International
Electromechanical Commission), CISPR (Comité Internationale Spécial des Perturbations Radio electro technique International Special Committee on Radio Interference) standards.
• Quality system assessment through factory inspection based on ISO/IEC Guide 65 and CENELEC Certification Agreement (CCA) Documents by internationally qualified assessor.
• Testing of products at nationally approved laboratories (National Accreditation Board for Testing and Calibration Laboratories - NABL), and internationally approved FCC listed laboratories having state–of-art-test facilities.
• Qualified engineers trained at VDE, TUV Germany, Siemens Plessy Assessment Service UK, R&S Germany.
• Availability of test reports in internationally accepted formats. • Regular surveillance of quality system (factory inspection) and products to
ensure that approved manufacturers produce consistently quality products complying with applicable IEC, CISPR standards.
Source: Department of Information Technology, Government of India

132
Also, in the growing electronic industry, there is a strong need to evolve/adopt EMC (Electromagnetic Compliance) standards that are acceptable worldwide in order to avoid trade barriers. Limited awareness of such standards and compliances led to sub-standard and spurious products being dumped in the market. Many countries are using standards as non tariff barriers in order to restrict the imports of products from non-complying firms / countries. Dumping is also creating grey market and thus the local manufacturing industry would get affected. Therefore, there is an urgent need to have Indian standards matching with international standards, for all Electronics / IT products, which should be mandated to be followed for manufacture, imports and exports. For global trading of Indian products, it is essential that these products not only meet international EMC (Electromagnetic Compliance) standards but are also complying with other such standards.
India should also follow Taiwan’s example and develop similar standards and testing facilities, so that Indian products have global acceptance. This would help the industry grow and would enhance the acceptability of Indian products not only in advanced countries but also in the fast emerging markets of third world countries. Efforts may also be required to enhance the awareness of EMI/EMC (Electromagnetic
Interference/ Electromagnetic Compliance) aspects for both users as well as manufacturers. If EMC (Electromagnetic Compliance) implementation is taken care of at an early stage of design, the increase in cost will be marginal. Apart from this, there is also a strong need to evolve and harmonize occupational standards against EM (Electromagnetic) radiation to ensure against the health hazards of the end user of electrical and electronic goods. In India, EMC compliance certification scheme, is followed to ensure standards to the products that are manufactured, exported and imported.
Technology Development and Sourcing
Indian electronics industry needs support from the Government including through financial, fiscal and infrastructural resources for strengthening manufacturing ability and R&D efforts. Indian firms must focus on acquiring technology through mergers and acquisitions and aquire manufacturing plants of established companies from other countries. This has been followed by many emerging Asian economies as it is very cost effective, which also ensures continuous technology flow. Countries like Taiwan have integrated their public and private sector to establish highly efficient electronics manufacturing environment. Hence, Indian electronic industry should also

133
bridge the challenges of financial, technological and infrastructural resources through public and private partnerships.
Skill and Human Resource Development
In order to achieve the plans of raising production, mastering the sophisticated technology, and for achieving market leadership, it is necessary to have adequate human resources with skills, knowledge and resources. It may be mentioned that competent manpower would ultimately give the players the competitive edge. This competence, defined in terms of ability to achieve predetermined goals, must be supplemented with a conducive environment for work and systems that enable employees to perform better, and processes that help them to ensure maximum productivity at work place. It is necessary to develop skills in the human resources matching with the latest technological innovations. Hence, steps should be taken to impart training in human resources that lead to skill development based on evolving consumer demand.
Capturing the Rural Market
India’s rural market provides a huge demand base, with more than 720 million consumers spread across 627,000 villages. Furthermore,
their per-capita income has been rising at a consistent growth rate of more than 4 percent, which has resulted in increasing disposable incomes. The penetration of various electronic products is still very low in rural areas, proving huge growth potential. This is corroborated by the fact that penetration levels in India for consumer electronics products such as refrigerators, VDC/DVD players and set top boxes (STBs) are at 19%, 7% and 2.5% respectively, most of which is contributed by urban areas. Hence, the focus on rural areas has become even more important.
Electronics companies operating in India have started developing plans to tap the rural market. They are undertaking initiatives to strengthen dealerships and distribution channels in these areas to increase the penetration of their products. Furthermore, they are aiming to provide affordable and customized products to suit the needs of rural people. Some manufacturers have announced plans to make significant inroads into rural markets through channel expansions, establishing a services network, and rolling out a slew of entry-level products. With rural and suburban markets gaining importance, such innovative strategies would help electronic product companies to tap the potential offered by these markets.

134
More Support to Telecom Equipment Sector
Globally, Governments have created a supportive policy framework to encourage their telecom equipment manufacturing and R&D. China has been actively supporting its telecom industry and has been providing significant support in the form of incentives and lines of credit and thereby stimulating their exports. This has helped the Chinese electronics companies to expand their domestic business and has enabled them to use their home market as a base to achieve competitiveness globally. The Chinese Government has also been proactively pushing for telecom exports as a part of their bilateral trade and use telecom exports as a key area for bilateral trade growth.
Israel, with just about 200,000 technology professionals, has been able to create R&D driven companies, exporting telecom equipment globally. Israel has set up funding for R&D expenses of Israeli companies to the extent of 50% of their expenses to help them to become global technology leaders. The grants are provided as conditional loans subject to royalties of about 3%-5% of sales payable only in the case of technology and commercial success.
Brazil applies state taxes and charges to import of electronic products that
can double the actual cost of importing products into Brazil. Brazil only allows the import of such products if they are not produced domestically. The Government of Brazil offers a variety of tax, tariffs and financing incentives to encourage production for export and the use of Brazilian made inputs in domestic production. Brazilian National Bank for Economy and Social Development (BNDES) provides long term financing to Brazilian industry through different programmes at lower interest than the market interest rates. Regulations allow a Brazilian state enterprise to subcontract services to a foreign firm only if domestic expertise is not available.
ICT in Canada is one of the most invested sectors, representing almost 40% of the total investment. The Canadian Government encourages R&D through generous R&D tax credits to help drive innovations and through direct support of research sectors.
Finland’s Public Policy, implemented in the course of last two decades, has played an important role in reinforcing the country’s innovative capacity, by creating adequate framework conditions for innovation. Important investment in R&D together with the establishment of an effective network of public agencies supporting public and private R&D, and a cluster

135
based approach to innovation, which encouraged numerous interaction and knowledge and technology transfers amongst small and larger firms, service providers, research institutes and universities. Finnish trade and investment policies have enabled trade and investment liberalization in the last two decades and have also significantly contributed to fostering adequate framework conditions for innovations in Finland14. India should also follow similar ways to encourage its telecom sector.
Based on the public-private partnership model, quite a few Centres of Excellence (CoEs) have been set up in India for the benefit of society. Funded by the Government, these CoEs aim to provide high-quality training, undertake advanced research and develop globally competitive tools within a defined timeframe. The focus is on technology development and transfer, path-breaking scientific research, development of trained human resources, and economic outreach. CoEs have been set up in the areas of telecom, wireless technology, bioinformatics, lasers and optoelectronic devices and nano-electronics. India should focus on improving and developing these Centres of Excellence, and thereby achieve product excellence.
Promotion of Intelligent Manufacturing
Significant engineering skills, with the combination of hardware, software and system integration skills are required in the evolution stage of advanced technology products. This niche area is called intelligent manufacturing. These are usually high tech products which provide high value addition but low volumes in highly quality conscious capital goods sector. India has a competitive advantage in this sector where a large proportion of value addition is through software and system integration. According to a Strategy Paper on ‘Doubling Exports in Next Three Years (2011-12 to 2013-14)’, prepared by the Ministry of Commerce, Government of India, establishing joint ventures with Chinese companies, which have manufacturing strengths and substantial market share in third world countries, would help in increasing high tech exports in the short term to developing countries in Africa and the Middle East.
Promoting Repair/Reconditioning/Refurbishment of Electronic Goods
According to the Strategy Paper on ‘Doubling Exports in Next Three Years (2011-12 to 2013-14)’ prepared by the Ministry of Commerce and Industry
14Source: Consultation paper on Encouraging Telecom Equipment Manufacturing in India, TRAI

136
Government of India, the American market for repair/reconditioning/refurbishing of electronic goods is estimated to be US $ 10 billion annually. The EU market size is of the same order. The major countries servicing the American market are China, Vietnam, Philippines and Thailand. India has a few large emerging companies which are beginning to provide these services but the combined turnover is of the order of only US $ 5 million. India should take refurbishing business as a big opportunity because Indian workers are recognized as having better diagnostic skills and would thus enjoy core competence in the area of repair and re-export. Additionally, India has very good brand equity in the US due to the excellence in the software sector. Accordingly Ministry of Commerce and Industry has suggested in their Strategy Paper on ‘Doubling Exports in Next Three Years (2011-12 to 2013-14)’ that an export volume of US $ 1 billion can be targeted in the US market over the next three years (creating 5 lakh jobs) by merely simplifying the procedure for one-to-one co-relation of units like laptops, mobile phones, mother boards, memory cards, etc. (having features such as unique identification numbers ) at the time of import and re-export.
Simplification of Customs Procedures
After the signing of the ITA-1, the electronic hardware sector was the
first sector to open up with zero duty on most items, as also reduction in overall duty rates. However, the customs procedures have undergone with limited simplification, according to the Strategy Paper on ‘Doubling Exports in Next Three Years (2011-12 to 2013-14)’, prepared by the Ministry of Commerce and Industry, Government of India. The Paper has suggested that all raw materials, components, intermediate products if imported by an excise-registered manufacturing unit should be allowed at zero duty based on self-declaration. The local excise range, with which these units are registered, can ensure that there is no misuse. In other words, the customs procedures should move from a refund regime to a self-declaratory regime as is the case with excise duties. This will go a long way in reducing a major non-tariff disability faced by the electronic goods exporting units.
Effective Supply Chain and Logistics System
Firms in India need to create strong linkages with their logistics and supply chain partners to succeed and to pave the way for a better future. Adopting these initiatives first and foremost requires taking a long-term view and having an extensive focus on all the channels in the total transformation process to create a productive and reliable supply chain. Transportation and logistics are getting due attention

137
and as a result some good third party and fourth party logistics service providers have emerged. Government may consider improving the infrastructure for better functioning of various supply chains. Firms and their supply chains need to closely integrate themselves into a network, carefully manage the complexity that ensues, align their business strategy with logistics and supply chain operations, and leverage information and communication technology with process improvement and pioneer operational innovation for superior performance. They also need to rigorously measure and monitor critical operational performance metrics such as customer service, responsiveness, supply chain costs, asset utilization, product quality and operational flexibility in order to achieve overall business success. Adequate supply chain and logistics system will ensure timely delivery of electronic products and will provide a better competitive landscape of Indian electronics industry.
Grey Market
One of the ways of fighting grey market is to conduct awareness and educate customers against piracy and counterfeit product through interactive events, PR and advertising. Consumers need to be made aware of the perils of using counterfeit/pirated goods. Apart from this development of solid strategies and formal policies
for appropriate channel management is very essential. Higher taxes are considered as reasons for the flourishing grey market in India. Measures should be taken to combat this issue. Also, legal protections such as coding the product should be adopted to reduce the challenges of grey market.
CONCLUSION
Electronic industry is one of the most globalised industries in the world with the conclusion of ITA under WTO. The industry serves significantly in productivity and creativity in the manufacturing sector. Many countries, especially in Europe and ASEAN, have identified electronic industry as one of the thrust areas for national growth and development. India is also a signatory to ITA, and India has also placed greater thrust on this industry for developmental growth.
The market for electronic products in India has witnessed significant growth in recent years due to several factors, such as manufacturing growth, ICT penetration, growing disposable income, retail boom and attractive finance schemes. Following the global slowdown, the demand for electronic products has come down, as also the production in the domestic market.
The total PC (Personal Computer) sales during 2009-10 was 8.03 million units, including desktop computers and notebooks (including netbooks);

138
the sales is expected to have registered a growth of about 18.2% in 2009-10 over the year 2008-09. Out of the total PC sales, the total sale of desktops was 5.52 million units, and that of notebooks & netbooks at 2.51 million units. During 2010-11 the total PC sales is estimated to be 9.76 million units, of which 6.20 million units included the desktop sales and the rest 3.56 million units included notebooks and netbooks sales. While desktop sales is expected to increase by 12.3% in 2010-11 over the previous year, that of notebooks & netbooks is expected to increase by (-) 41.8% over 2009-10. The overall consumption in the PC market was led by telecom, banking and financial service sectors, education and households segments.
In the consumer electronics segment, several products, which have low market penetration level, or at a nascent stage of product life cycle (such as DVD players, MP3 players, I-Pods, digital cameras), have tremendous growth potential. Availability of low-cost software for such products is one of the reasons for the growth in this segment of consumer electronic industry in India.
The colour television industry, which is largest segment of consumer electronics industry, is witnessing a segmental shift from conventional colour TVs (CCTV) to Flat colour TVs
(FCTV). Reduced focus on the CCTV segment, aggressive price reduction in the FCTV segment and declining price difference between the FCTV and CCTV segments are driving the shift. Various strategies are being adopted by colour television manufacturers to combat the financial crisis. The firms are increasingly focusing on expanding the market share and reach in rural markets, and launching of new versions / products, which is expected to push the volume of sales of high end TVs like LCD, Plasma and RPTV (rear projection TV). This segment has also started showing an increase in its demand over the years from 1.5% in 2006-07 to 6% in 2008-09.Within the high-end colour television industry space, the LCD television market continues to grow at a faster pace. According to the Department of Information Technology, in 2009-10, the LCD TV market is expected to have expanded to 1.40 million units, an increase of 57% over the previous year. The price decline due to lower import duty on LCD panels and the introduction of smaller entry size models have widened the consumer base for LCD TVs. This upsurge in LCD TV growth is likely to result in 2.7 million to 3 million units in 2010. Supporting a strong projected LCD TV sales were IPL cricket, FIFA world cup and Cricket World Cup. The surge in demand for LCD TVs is resulting in substantial increase in the value share of this

139
segment of the colour TV portfolio of major companies.
In India, the market size of medical electronic instruments is expected to grow in the years to come with increase in number of people affected by lifestyle diseases. Also more and more new applications are innovated in the area of monitoring of healthcare, as also remote technologies, including telemedicine.
Apart from these segments, new applications (technology controlled operations) in manufacturing sector would also increase the demand for electronic products in India.
The market size of the electronic industry is projected to exceed US $ 150 billion by 2015. According to Ministry of Commerce and Industry, Government of India, the export performance of electronic
goods are expected to be US $ 15 billion by 2013-14. In order to achieve this level of growth, India needs to concentrate and focus more on designing and manufacturing global products, and then reach out to the rural areas in the domestic market, and emerging export markets. Also, India should leverage its strengths in software to build high-complexity, but medium-volume products, for the global market. Further, the Indian industry should focus on inventing mass-products that matter to rural and bottom of the pyramid segments. The demand for appliances and energy efficient consumer electronics is huge and can be explored by the Indian electronic industry. Increased R&D intensity should be a joint approach of both Government and industry. With such strategies, Indian electronics industry would excel both in domestic and international markets.

140
ANNEXURE - 1 : PRODUCTION OF ELECTRONIC PRODUCTS
(Rs Million)
Category 2007 2008 % Change
CONSUMER ELECTRONICSAudio equipment 28,304.19 31,134.61 10.0Video equipment 128,847.85 146,886.55 14.0Audio visual equipment 306.78 343.59 12.0Consumer electronic items, others 51,025.34 56,893.26 11.5
CONTROL, INSTRUMENTATION & INDUSTRIAL ELECTRONICSTest and measuring instruments 8,552.30 9,749.62 14.0Medical electronic equipment 11,661.30 13,585.41 16.5Analytical instrument 1,111.76 1,250.73 12.5Special application instruments 2,231.17 2,543.54 14.0Industrial electronics and automation 26,006.34 28,737.01 10.5Process control equipment 27,785.33 30,980.64 11.5Power electronic equipment 26,596.01 32,239.39 21.2Office equipment 5,283.85 5,944.33 12.5Miscellaneous electronic equipment 8,562.94 9,761.75 14.0
DATA PROCESSING SYSTEMSComputer systems 120,427.99 151,365.94 25.7Microprocessor based systems 4,625.09 5,440.95 17.6Computer peripherals 21,232.80 24,343.40 14.6
COMMUNICATION AND BROADCAST EQUIPMENTSwitching systems 20,503.38 24,103.78 17.6Transmission equipment 37,118.34 49,931.59 34.5Terminal equipment 169,313.99 375,504.56 121.8Signaling equipment 1,388.86 1,555.52 12.0Allied communication equipment 5,038.51 5,038.51 0.0Broadcasting equipment 2,015.09 2,427.78 20.5
STRATEGIC ELECTRONICSRadar systems 7,734.70 9,874.12 27.7Navigational equipment 1,084.85 1,275.79 17.6Underwater and sonar systems 1,196.70 1,453.99 21.5Electronic warfare equipment 10.61 12.89 21.5Defence communication equipment 53,864.24 71,316.26 32.4Miscellaneous strategic equipment 70.41 86.96 23.5
ELECTRONIC COMPONENTSElectron tubes 19,439.06 20,799.79 7.0Semiconductor devices 3,605.09 3,912.24 8.5Passive components 21,639.92 25,210.51 16.5Electromechanical components 10,681.76 11,803.35 10.5Special components 70.63 75.59 7.0Other electronic components 391,51.57 42,871.17 9.5
Source: Directory 2010, Elcina Electronics Industry Association

141
ANNEXURE - 2 : WORLD EXPORT OF TELECOMMUNICATIONS EQUIPMENTS
US $ million
Commodity Commodity Name 2008 2009 % growthCode
852520 Transmission apparatus incorporating reception apparatus 144392.48 125091.70 -13.4
851780 Other telephonic apparatus 83820.89 75999.59 -9.3
851790 Parts of telephonic/telegraphic apparatus 76092.93 66651.60 -12.4
851750 Other apparatus for carrier current line systems or for digital line systems 9961.63 6679.33 -32.9
852910 Aerials and aerial reflectors of all kinds; parts suitable for use therewith 6604.16 4892.11 -25.9
854420 Co-axial cable and other co-axial electric conductors 7472.33 4063.70 -45.6
851719 Other telephone sets & videophone 5724.84 3729.56 -34.9
851711 Line telephone sets with cordless handsets 4655.90 3599.66 -22.7
852510 Transmission apparatus 5090.27 3593.70 -29.4
853110 Burglar or fire alarms and similar apparatus 3637.09 2992.52 -17.7
854470 Optical fibre cables 3740.77 2789.73 -25.4
852610 Radar apparatus 1597.85 1661.98 4.0
851722 Teleprinters 708.21 350.94 -50.4
851730 Telephonic/telegraphic switching apparatus 479.18 41.01 -91.4
852530 Television cameras 236.48 29.46 -87.5
852790 Other reception apparatus 118.06 24.30 -79.4
852020 Telephone answering machines 29.13 18.00 -38.2
851721 Facsimile machine (fax) 44.29 7.40 -83.3
Total 354406.48 302216.29 -14.7
Source: OECD List of ICT goods, PC-TAS

142
ANNEXURE - 3 : WORLD EXPORT OF COMPUTER AND RELATED EQUIPMENT
US $ million
Commodity Commodity Name 2008 2009 % growthCode
847330 Parts and accessories of the machines of heading 8471 146453.06 118200.46 -19.3
847130 Portable digital automatic data processing machines, weighing <10kg consisting a central processing unit, a central & a display. 98322.49 86334.83 -12.2
847170 Storage units 76960.52 67247.25 -12.6
847150 Digital processing units excl of sub headings 847141 & 847149,wh/not cont one/two types of unlike storage/input/output units 41380.47 34091.37 -17.6
847160 Input or output units, whether or not contain- ing storage units in the same housing 37791.56 26360.97 -30.2
847149 Other digital automatic data processing machine presented in the form of system 12824.43 13390.43 4.4
847180 Analogue/hybrid automatic data processing machines 17188.27 12879.90 -25.1
847141 Comprising in the same housing at least a central processing unit and an input and output unit, whether or not combined 7514.27 6026.51 -19.8
847190 Other : VGA monitor, CGA monitor, un-interrupted power supply and others 7066.41 5571.27 -21.2
847110 Analogue/hybrid automatic data processing machines 227.53 72.15 -68.3
Total 445729.02 370175.14 -17.0
Source: OECD List of ICT goods, PC-TAS

143
ANNEXURE - 4 : WORLD EXPORT OF ELECTRONIC COMPONENTS
US $ million
Commodity Commodity Name 2008 2009 % growthCode
854229 Monolithic integrated circuits - others 373354.98 355638.41 -4.7
852990 Other : Remote control (handset) apparatus for operating TV etc., Other parts for communication jamming, and radio communication equipment 74484.48 59403.68 -20.2
854140 Photosensitive semi-conductor devices, including photovoltaic cells whether or not assembled in modules or made up into 41877.18 37976.24 -9.3
853400 Printed circuits 39452.54 31813.22 -19.4
854290 Parts of electronic integrated circuits and micro assemblies 36194.59 25174.98 -30.4
854129 Other transistor, other than photosensitive transistors 11378.20 9017.93 -20.7
854110 Diodes, other than photosensitive or light emitting diodes 9903.26 7999.88 -19.2
850490 Parts of transformers and other electrical power machinery of heading 8504 9735.55 7954.52 -18.3
853224 Other fixed capacitors, ceramic dielectric, multilayer 8616.21 7641.75 -11.3
850450 Other inductors 7727.96 6347.18 -17.9
854190 Parts of items of heading 8541 6918.42 6179.53 -10.7
854160 Mounted piezo-electric crystals 6322.79 5576.26 -11.8
854121 Transistors, other than photosensitive transistors with a dissipation rate of less than 1 w 6443.98 5138.41 -20.3
854210 Cards incorporating electronic integrated circuits (‘smart cards’) 5031.07 4349.18 -13.6
850431 Having a power handling capacity not exceeding 1 kwa 5666.74 4245.87 -25.1

144
854221 Monolithic integrated circuits digital 15572.64 2494.66 -84.0
854150 Other semi-conductor devices 3369.50 2475.15 -26.5
853321 For a power handling capacity not exceeding 20 w 3174.73 2427.03 -23.6
853340 Other variable resistors, including rheostats and potentiometers 2902.91 2149.93 -25.9
853221 Other fixed capacitors, tantalum 2409.24 1947.55 -19.2
854130 Thyristors, diacs and triacs, other than photosensitive devices 1320.91 1132.22 -14.3
853329 Other : Electrical resistance wire, bare, nichrome, other than nichrome/installed nichrome installed excluding nichrome 1189.25 908.36 -23.6
854011 Colour : CTV picture tube video monitor cathode ray tubes and others 2046.48 881.78 -56.9
853310 Fixed carbon resistors, composition/film types 803.68 608.28 -24.3
852330 Cards incorporating a magnetic stripe 622.67 497.14 -20.2
853390 Parts of articles of heading 8533 643.91 491.79 -23.6
853230 Variable/adjustable (pre-set) capacitors 547.87 428.91 -21.7
854020 Television camera tubes; image converters and intensifiers; other photos-cathode tubes 346.52 353.41 2.0
854099 Other parts of the tubs & valves of heading 8540 239.67 240.79 0.5
854089 Other valves and tubes and radio transmitting tubes 419.68 235.16 -44.0
854079 Other microwave tubes (e.g. travelling wave tubes carcinother s)excl grid controlled tubes 279.93 227.38 -18.8
854071 Magnetrons 293.12 224.22 -23.5
854091 Parts of cathode-ray tubes 397.51 197.10 -50.4
853339 Other : Potentiometers, rheostats and others 206.29 172.02 -16.6
853331 For a power handling capacity not exceeding 20 w 158.79 114.28 -28.0
854081 Receiver/amplifier valves & tubes 111.41 80.42 -27.8
854060 Other cathode-ray tubes 83.71 69.85 -16.6
854040 Data/graphic display tubes, colour, with a phosphor dot screen pitch< 0.4 mm 157.17 55.12 -64.9
854270 Electronic micro assemblies 775.22 43.71 -94.4

145
854072 Klystrons 44.00 41.68 -5.3
854260 Hybrid integrated circuits 6014.15 37.57 -99.4
854050 Data/graphic display tubes, black and white or other monochrome 19.23 18.60 -3.3
854012 Cathode-ray tv picture tubes, including video monitor cathode-ray tubes black & white/other monochrome 13.49 6.33 -53.1
852460 Cards incorporating a magnetic stripe 16.76 3.20 -80.9
Total 687288.35 593020.70 -13.7
Source: OECD List of ICT goods, PC-TAS

146
ANNEXURE - 5 : WORLD EXPORT OF AUDIO AND VIDEO EQUIPMENT
US $ million
852812 Reception parts for tv etc colour 78856.44 68975.29 -12.5
852540 Still image video camera & other video camera recorders 43508.32 37677.75 -13.4
852390 Other prepared unrecorded media 19453.97 20074.08 3.2
852190 Other : Video recording reproducing apparatus 15322.40 13780.93 -10.1
852821 Video monitor colour 15831.96 13186.80 -16.7
852290 Other parts & accessories of heading 8519-8521 12849.59 9062.63 -29.5
852320 Magnetic discs 8907.18 6556.57 -26.4
851999 Other sound reproducing apparatus 8393.19 6107.76 -27.2
852721 Radio broadcast receivers with radio telephony etc combined with sound recording/reproducing apparatus, used motor vehicles, cannot operate without external 7943.45 5503.90 -30.7
851830 Headphones earphones & combined microphone/ speaker sets 5944.23 5035.10 -15.3
852830 Video projectors 5026.73 4266.99 -15.1
851829 Other loud speakers w/n mounted in their enclosures 4774.67 3899.30 -18.3
852731 Other radio broadcast receivers with radio telephony/radio telegraphy etc combined with sound recording/reproducing apparatus 3839.28 2961.07 -22.9
851822 Multiple loud speakers; mounted in the same enclosure 3353.76 2797.28 -16.6
852713 Other apparatus combined with sound recording or reproducing apparatus 2768.00 2269.48 -18.0
851840 Audio-frequency electric amplifiers 2569.08 1954.22 -23.9
851890 Parts of heading 8518 2613.65 1910.48 -26.9
851821 Single loudspeakers, mounted in their enclosures 2262.62 1740.26 -23.1
851810 Microphones & stands there for 2168.48 1651.16 -23.9
852739 Other radio-broadcast receivers, including. apparatus capable of receiving radio-telephony/ radio-telegraphy 1441.27 1220.33 -15.3
851850 Electric sound amplifier sets 1157.92 840.64 -27.4
Commodity Code
Commodity Name 2008 2009 % growth

147
Source : OECD List of ICT goods, PC-TAS
852719 Other radio-broadcast receivers able to port without external source of power ,including apparatus able to receive radio-telephony/radio telegraphy 871.97 710.86 -18.5
852110 Magnetic tape-type : 955.09 647.80 -32.2
852732 Other radio broadcast receivers with radio telephony/radio telegraphy etc not combined with sound recording/reproducing apparatus but combined with a clock 580.63 524.63 -9.6
852729 Other radiobroadcast receivers not capable to port without external power, used in motor vehicles, including apparatus for receiving radio-telephony/ radio-telegraphy 796.83 503.73 -36.8
852813 Reception parts for tv etc b/w or other mono 260.82 134.98 -48.2
851939 Other turntables (record-decks) 168.28 128.86 -23.4
852712 Pocket-size radio cassette players 87.92 59.54 -32.3
852210 Pick-up cartridge 58.55 41.04 -29.9
852313 Magnetic tapes of a width exceeding 6.5 mm 35.42 8.62 -75.7
852312 Magnetic tapes of a width <=4mm but<6.5mm 8.62 5.75 -33.3
852090 Other sound recording apparatus w/n incorporating a sound reproducing device 21.03 5.63 -73.2
852032 Magnetic tape recorders digital audio-type 3.83 2.90 -24.4
852311 Magnetic tapes of a width not exceeding 4mm for recording sound/other phenomena 12.60 1.67 -86.8
851940 Transcribing machines 8.28 1.58 -81.0
852822 Video monitor B/W or other monochrome 37.80 0.73 -98.1
851993 Other sound reproducing apparatus cassette type 2.06 0.60 -70.9
852033 Other magnetic tape-recorder cassette type 11.44 0.42 -96.3
852039 Other magnetic tape recorders incorporating sound reproducing apparatus 3.28 0.17 -94.8
851921 Other record-players without loud speakers 3.55 0.14 -96.2
851992 Pocket size cassette players 0.97 0.11 -89.0
851929 Other record-players 13.21 0.09 -99.3
851910 Coin/disc-operated record players 1.00 0.08 -92.1
851931 Turntables (record-decks) with automatic record changing mechanism 2.48 0.05 -98.0
Total 252931.84 214251.96 -15.3

148
ANNEXURE - 6 : EXPORT OF OTHER ICT (INFORMATION AND COMMUNICATION TECHNOLOGY) GOODS
US $ million
Commodity Commodity Name 2008 2009 % growthCode
903289 Other : automatic regulating / controlling instruments of apparatus 19042.34 15356.30 -19.4
903180 Other measuring & checking instruments, appliances & machines 15892.33 11823.30 -25.6
852691 Radio navigational aid apparatus 13388.96 11597.66 -13.4
902780 Other instruments and apparatus 8834.53 7893.99 -10.6
901819 Other :electrical apparatus for medical purpose 7238.54 6687.22 -7.6
902750 Other instruments and apparatus using optical radiations (uv, visible, ir) 4962.46 4759.39 -4.1
903290 Parts and accessories of instruments of 9032 5954.68 4525.43 -24.0
903190 Parts and accessories of instruments of 9031 5999.14 4407.58 -26.5
902214 Other, for medical, surgical or veterinary uses 4663.12 4039.07 -13.4
902620 For measuring or checking pressure 5065.35 3980.95 -21.4
901812 Ultrasonic scanning apparatus 3998.81 3445.24 -13.8
901813 Magnetic resonance imaging apparatus 3524.08 3420.48 -2.9
901420 Instruments and appliances for aeronautic or space navigation(other than compasses) 3403.22 3222.78 -5.3
901580 Other instruments and appliances 3813.23 3217.63 -15.6
902212 Computed tomography apparatus 3137.02 2824.56 -10.0
903210 Thermostats 3322.73 2709.70 -18.4
903040 Other instruments & parts, specially designed for telecommunications (for example ,cross-talk meters, gain measuring instruments, distribution factor meters, etc) 3541.55 2677.60 -24.4
902730 Spectrometers, spectropichoto meters and spectrographs using optical radiations ( uv, visible, ir) 2884.14 2409.77 -16.4

149
902920 Speed indicators and tachometers; stroboscopes 3038.31 2259.67 -25.6
902710 Gas or smoke analysis apparatus 2583.02 2236.54 -13.4
847050 Cash registers 2561.31 2046.04 -20.1
903082 Instrument & apparatus for measuring or checking semi-conductor wafers or devices 3468.31 2008.81 -42.1
903083 Instruments & parts with a recording device 2053.81 1603.75 -21.9
902830 Electricity meters 1661.29 1531.14 -7.8
902890 Parts and accessories 1725.48 1500.12 -13.1
901490 Parts and accessories of compasses; other navigational instruments 1387.85 1393.38 0.4
902219 For other uses 1891.34 1349.41 -28.7
852692 Other radio remote control apparatus 1677.59 1342.47 -20.0
901480 Other instruments and appliances 1579.66 1330.52 -15.8
903141 Other optical instruments & appliances for inspecting semiconductor wafers/devices for inspecting photo mask/reticules used in mfg semiconductor dev 1991.95 1168.33 -41.3
903039 Other, with a recording device 1663.41 1147.57 -31.0
847350 Parts& accessories suitable for use with machines of two/more of headings nos 8469 to 8472 1354.84 1051.91 -22.4
847010 Electron calculators capable of operation excluding external source of electric power & pocket-sized data recording & displaying machines etc 1269.21 932.65 -26.5
902990 Parts & accessories of articles of heading 9029 1105.79 842.90 -23.8
903120 Test benches 1023.03 788.44 -22.9
902480 Other machines and appliances 1022.53 777.77 -23.9
903010 Instrument and apparatus for measuring or detecting ionizing radiation 755.93 737.53 -2.4
902910 Revolution counters, production counters, taximeters, milometer’s, pedometers and the like 812.88 692.46 -14.8
902820 Liquid meters 829.34 686.71 -17.2
903220 Manostats 833.87 568.96 -31.8
902213 Other apparatus for dental uses 617.41 555.66 -10.0

150
901811 Electro-cardiographs 640.37 534.16 -16.6
847310 Parts and accessories of the machines of heading 8469 714.16 533.79 -25.3
903020 Oscilloscopes and oscillographs 731.61 495.50 -32.3
902410 Machines & appliances for testing metals 649.32 488.61 -24.8
847321 Parts & accessories of electronic calculating machines of sub heading no.847010, 847021/847029 539.03 437.57 -18.8
902810 Gas meters 556.00 429.08 -22.8
901814 Scintigraphic apparatus 426.33 389.66 -8.6
903031 Multimeters 468.18 349.81 -25.3
903110 Machines for balancing mechanical parts 445.67 345.62 -22.4
901410 Direction finding compasses 338.64 325.74 -3.8
902490 Parts & accessories of machines of heading 9024 399.39 322.64 -19.2
847021 Electronic calculating machines incorporating printing device 200.15 127.45 -36.3
901540 Photograph material surveying instruments & appliances 118.16 93.13 -21.2
847029 Other electronic calculating machines 164.31 77.44 -52.9
846911 Word Processing Machines 6.47 28.73 344.0
903130 Profile Projectors 12.84 7.23 -43.7
902740 Exposure meters 2.04 0.71 -65.2
847040 Accounting machines 0.42 0.55 30.7
901049 Other apparatus for projection/drawing of circuit patterns on sensitized semi conductor materials 277.57 0.51 -99.8
901042 Step and repeat aligners 1262.05 0.00 -100.0
Total 163527.07 132539.30 -18.9
Source: OECD List of ICT goods, PC-TAS

151
Annexure - 8ANNEXURE - 7 : MAJOR PLAYERS IN THE TELECOMMUNICATIONS EQUIPMENT INDUSTRY
Source: Cybermedia research, Video and data research

152
Annexure - 8ANNEXURE - 8 : ANNUAL PLAN OF DEPARTMENT OF INFORMATION TECHNOLOGY 2010-11
SL.No Schemes Budgetary Support
I. R&D PROGRAMMES
1 SAMEER (Society for Applied Microwave Electronic Engineering and Research) 38.00 2 Microelectronics & Nanotechnology Development Programme 100.00 3 Technology Development Council (including. ITRA) 79.00 4 Convergence, Communications & Strategic Electronics 25.00 5 Components & Material Development Programme 25.00 6 C-DAC (Centre for Development of Advanced Computing) 180.00 7 Electronics in Health & Telemedicine 16.00 8 Technology Development for Indian Languages 35.00 9 IT for Masses ( Gender, SC/ST) 14.00 10 Media Lab Asia 10.00 R&D Sub-Total 522.00
II INFRASTRUCTURE DEVELOPMENT
11 STOC (Symposium on Theory of Computing) 85.00 12 STPI (Software technology Parks of India) & EHTP (Electronic Hardware Technology Park) 2.50 13 Electronic Governance 1030.00 14 Cyber Security (including CERT-In, IT Act) 40.00 15 Controller of Certifying Authorities (CCA) 9.00 16 ERNET (Education & Research Network) 10.00 17 Promotion of Electronics/IT Hardware Manufacturing 2.50 Infrastructure sub total 1179.00
III HUMAN RESOURCE DEVELOPMENT
18 DOEACC (Department of Electronics & Accredition of Computer Classes) 10.00 19 Manpower development (Including skill development in IT 113.00 20 Facilitation of setting up of integrated townships 1.00 HRD Sub total 124.00 21 Headquarter (secretariat & Bldg) 35.00 22 NIC 700.00 23 National Knowledge Network 100.00
GRAND TOTAL 2660.00
Source: Annual Report 2009-10, Department of Information Technology
(In Rs Crore)

153
Annexure - 8ANNEXURE - 9 : INDIA’S EXPORTS AND IMPORTS OF TELECOMMUNICATIONS EQUIPMENT
(US $ Million)
Commodity Commodity Name 2008- 2009- % April- April % Code 09 10 change May May change 2009-10 2010-11
Exports
851711 Line telephone sets with
cordless handsets 38.77 43.13 11.2 7.61 5.93 -22.1
85261000 Radar apparatus 12.31 16.92 37.4 2.76 2.77 0.4
852910 Aerials and aerial reflectors
of all kinds; parts suitable for
use therewith 288.54 110.09 -61.8 23.93 14.62 -38.9
853110 Burglar or fire alarms and
similar apparatus 18.6 16.8 -9.7 2.55 1.88 -26.3
854420 Co-axial cable and other
co-axial electric conductors 168.55 153.27 -9.1 21.28 13.56 -36.3
Total 526.77 340.21 -35.4 58.13 38.76 -33.3
Imports
851711 Line telephone sets with cordless
handsets 23.59 48.6 106.0 2.69 12.27 356.1
85261000 Radar apparatus 1.34 4.11 206.7 0.13 4.66 3484.6
852910 Aerials and aerial reflectors of
all kinds; parts suitable for use
therewith 42.62 19.87 -53.4 7.19 1.97 -72.6
853110 Burglar or fire alarms and similar
apparatus 6.43 5.19 -19.3 0.45 1.06 135.6
854420 Co-axial cable and other co-axial
electric conductors 24.17 15.26 -36.9 2.52 3.56 41.3
Total 98.15 93.03 -5.2 12.98 23.52 81.2
Source: DGCIS, Based on OECD classification of ICT goods

154
Commodity Commodity Name 2008- 2009- % April- April % Code 09 10 change May May change 2009-10 2010-11
847330 Parts and accessories of the machines of heading 8471 128.57 141.7 10.2 27.17 22.27 -18.0
847170 Storage units 119.18 132.7 11.3 14.65 18.18 24.1
847130 Portable digital automatic data processing machines, weighing <10kg consisting a central processing unit, a keyboard & a display. 24.77 39.81 60.7 9.81 5.14 -47.6
847190 Other : VGA monitor, CGA Monitor un - interrupted power supply & others 50.87 38.13 -25.0 8.14 4.02 -50.6
847141 Comprising in the same housing at least a central processing unit and an input and output unit, whether or not combined 18.16 19.19 5.7 4.08 7.65 87.5
84718000 Analogue/hybrid automatic data processing machines 6.23 8.66 39.0 1.45 2.47 70.3
847160 Input or output units, whether or not containing storage units in the same housing 6.73 7.1 5.5 1.06 0.95 -10.4
84714900 Other digital automatic data processing machine presented in the form of system 2.88 6.24 116.7 0.41 1.03 151.2
84715000 Digital processing units excl of sub headings 847141 & 847149, wh/not cont one/two types of uni, like storage/input/
output units 7.54 5.99 -20.6 2.18 0.57 -73.9
Total 364.93 399.52 9.5 68.95 62.28 -9.7
Annexure - 8ANNEXURE - 10 : INDIA’S EXPORTS AND IMPORTS OF COMPUTER AND RELATED EQUIPMENT
(US $ Million)

155
Imports
847330 Parts and accessories of the machines of heading 8471 1181.67 1228.56 4.0 179.44 172.81 -3.7
847130 Portable digital automatic data processing machines, weighing <10kg consisting a central processing unit, a keyboard & a display. 673.84 757.11 12.4 83.04 121 45.7
847170 Storage units 728.45 658.55 -9.6 94.33 97.92 3.8
84715000 Digital processing units excl of sub headings 847141 & 847149,wh/not cont one/two types of uni,like storage/input/ output units 412.55 381.09 -7.6 62.15 63.93 2.9
847160 Input or output units, whether or not containing storage units in the same housing 107.2 110.52 3.1 14.94 16.67 11.6
84718000 Analogue/hybrid automatic data processing machines 71.08 56.17 -21.0 8.48 8.44 -0.5
84714900 Other digital automatic data processing machine presented in the form of system 87.21 53.16 -39.0 4.67 9.01 92.9
847190 Other: VGA monitor, CGA Monitor un - interrupted power supply & others 73.53 50.21 -31.7 8.62 5.05 -41.4
847141 Comprising in the same housing at least a central processing unit and an input and output unit, whether or not combined 77.87 46.77 -39.9 6.9 6.94 0.6
Total 3413.4 3342.14 -2.1 462.57 501.77 8.5
Source: DGCIS, Based on OECD classification of ICT goods

156
ANNEXURE - 11 : INDIA’S EXPORTS AND IMPORTS OF ELECTRONIC COMPONENTS
(US $ Million)
Commodity Commodity Name 2008- 2009- % April- April- % Code 09 10 change May May change 2009-10 2010-11
Exports854140 Photosensitive semi-conductor devices, including photovoltaic cells whether or not assembled in modules or made up into parts 637.66 358.58 -43.8 60.3 74.63 23.8
850490 Parts of transformers and other electrical power machinery of heading 8504 136.30 98.29 -27.9 13.26 18.35 38.4
85340000 Printed circuits 102.94 94.17 -8.5 25.87 15.11 -41.6
852990 Other parts for communication jaming & radio communication equipment 125.86 86.67 -31.1 15.35 7.46 -51.4
85429000 Parts of electronic integrated circuits and micro assemblies 13.47 20.81 54.5 12.13 0.74 -93.9
850431 Having a power handling capacity not exceeding 1 kva 14.56 17.26 18.5 2.06 2.59 25.7
85415000 Other semi-conductor devices 18.50 16.62 -10.2 2.41 3.15 30.7
850450 Other inductors 10.07 10.42 3.5 0.73 1.97 169.9
853340 Other variable resistors, including rheostats and potentiometers 12.98 8.71 -32.9 1.09 1.72 57.8
85323000 Variable/adjustable (pre-set) capacitors 9.40 7.03 -25.2 0.52 0.48 -7.7
85416000 Mounted piezo-electric crystals 4.29 6.51 51.7 0.87 1.88 116.1
85331000 Fixed carbon resistors, composition/film types 11.64 6.09 -47.7 0.58 1.57 170.7
85419000 Parts of items of heading 8541 6.50 4.62 -28.9 1.37 0.83 -39.4
85412900 Other transistor, other than photosensitive transistors 3.42 4.48 31.0 1.11 0.82 -26.1
854130 Thyristors, diacs and triacs, other than photosensitive devices 4.58 2.71 -40.8 0.19 0.3 57.9
853329 Other electrical resistance wire, base nichrome/other than nichrome /installation excluding nichrome 2.51 2.34 -6.8 0.99 0.29 -70.7
854011 CTV picture tubes, video monitor cathode ray tubes & others 2.17 2.32 6.9 0.65 0.61 -6.2

157
85411000 Diodes, other than photosensitive or light emitting diodes 3.32 2.27 -31.6 1.05 0.48 -54.3
854089 Other valves and tubes & radio transmitting tubes 1.06 1.83 72.6 0.27 0.19 -29.6
85412100 Transistors, other than photosensitive transistors with a dissipation rate of less thn 1 w 1.71 1.27 -25.7 0.27 0.12 -55.6
853321 For a power handling capacity not exceeding 20 w 1.90 1.23 -35.3 0.24 0.31 29.2
854020 Television camera tubes; image converters and intensifiers; other photos-cathode tubes 0.18 1.23 583.3 0.12 0.08 -33.3
85409900 Other parts of the tubes & valves of heading 8540 0.87 0.73 -16.1 0.03 0.25 733.3
85409100 Parts of cathode-ray tubes 0.40 0.68 70.0 0.37 0.01 -97.3
853339 Other potentiometers, rheostats and others 0.16 0.59 268.8 0.03 0.07 133.3
85339000 Parts of articles of heading 8533 1.11 0.49 -55.9 0.05 0.21 320.0
853331 For a power handling capacity not exceeding 20 w 0.70 0.42 -40.0 0.05 0.08 60.0
85407900 Other microwave tubes (e.g. travelling wave tubes carcinotherons)excl grid controlled tubes 0.19 0.29 52.6 0.00 0.01 0.00
85407100 Magnetrons 0.03 0.22 633.3 - - -
85322100 Other fixed capacitors, tantalum 0.13 0.07 -46.2 0.01 0.01 -
85406000 Other cathode-ray tubes 0.11 0.05 -54.5 0.01 - -
85322400 Other fixed capacitors, ceramic dielectric, multilayer 0.14 0.04 -71.4 - - -
Total 1128.86 759.04 -32.8 141.98 134.32 -5.4
Imports
85408100 Receiver/amplifier valves & tubes 0.23 0.94 308.7 0.06 0.02 -66.7
85405000 Data/graphic display tubes, black and white or other monochrome 0.05 0.11 120.0 0.02 0.02 0.0
850490 Parts of transformers and other elecrtrical power machinery of heading 8504 184.50 296.48 60.7 82.24 30.22 -63.3
853340 Other variable resistors, including rheostats and potentiometers 38.36 49.38 28.7 5.89 5.46 -7.3
85406000 Other cathode-ray tubes 1.14 1.45 27.2 0.45 0.06 -86.7

158
854011 CTV picture tubes, video monitor
cathode ray tubes & others 140.24 165.85 18.3 19.04 42.9 125.3
85407100 Magnetrons 1.05 1.24 18.1 0.3 0.38 26.7
853331 For a power handling capacity
not exceeding 20 w 1.42 1.64 15.5 0.57 0.31 -45.6
85411000 Diodes, other than photosensitive
or light emitting diodes 110.30 127.26 15.4 20 15.54 -22.3
85415000 Other semi-conductor devices 15.51 16.56 6.8 2.28 2.62 14.9
85409100 Parts of cathode-ray tubes 17.54 18.70 6.6 3.81 4.91 28.9
853339 Other : Potentiometers,
Rheostats & others 6.18 6.56 6.1 0.63 0.71 12.7
854089 Other: Radio fransmitting tubes
& other values and tubes 2.63 2.63 0.0 0.56 0.13 -76.8
85331000 Fixed carbon resistors,
composition/film types 16.80 16.43 -2.2 3.04 1.7 -44.1
85323000 Variable/adjustable (pre-set)
capacitors 1.32 1.28 -3.0 0.14 0.58 314.3
85409900 Other parts of the tubs & valves
of heading 8540 11.83 11.26 -4.8 2.04 1.37 -32.8
852990 Other : Remote control (handset)
apparatus for operating etc.
Other parts for communication
jamming equipments & radio
communication equipment 761.40 690.78 -9.3 95.04 114.83 20.8
854130 Thyristors, diacs and triacs,
other than photosensitive devices 29.82 26.23 -12.0 4.07 4.52 11.1
850450 Other inductors 89.27 77.66 -13.0 12.51 9.98 -20.2
85322100 Other fixed capacitors, tantalum 3.80 3.07 -19.2 0.34 0.62 82.4
850431 Having a power handling capacity
not exceeding 1 kva 73.35 58.49 -20.3 8.08 9 11.4
85407900 Other microwave tubes
(e.g. travelling wave tubes
carcinotherons)excl grid controlled
tubes 3.03 2.35 -22.4 0.11 0.05 -54.5
85412900 Other transistor, other than
photosensitive transistors 160.35 113.74 -29.1 16.62 14.95 -10.0
854140 Photosensitive semi-conductor
devices, including photovoltaic
cells whether or not assembled
in modules or made up into
parts 482.90 332 -31.2 86.97 43.79 -49.6

159
853329 Other: Electrical Resistance wire, dare, nicrome/installed nichrome / installed excouding nichrome 25.15 17.13 -31.9 2.35 3.13 33.285339000 Parts of articles of heading 8533 8.90 5.38 -39.6 0.55 1.02 85.5
85407200 Klystrons 1.56 0.90 -42.3 0.65 0.15 -76.9
85340000 Printed circuits 293.09 157.83 -46.1 46.91 10.56 -77.5
854020 Television camera tubes; image converters and intensifiers; other photos- cathode tubes 19.77 10.62 -46.3 2.47 1.8 -27.1
85416000 Mounted piezo-electric crystals 52.05 23.32 -55.2 3.12 1.76 -43.6
85429000 Parts of electronic integrated circuits and micro assemblies 185.26 82.97 -55.2 28.91 7.09 -75.5
85419000 Parts of items of heading 8541 66.80 27.45 -58.9 11.47 1.18 -89.7
85322400 Other fixed capacitors, ceramic dielectric, multilayer 188.82 10.86 -94.2 2.16 1.2 -44.4
Total 3008.72 2376.09 -21.0 466.08 334.49 -28.2
Source: DGCIS, Based on OECD classification of ICT goods

160
Commodity Commodity Name 2008- 2009- % April- April- % Code 09 10 change May May change 2009-10 2010-11
85184000 Audio-frequency electric
amplifiers 14.49 14.39 -0.7 1.98 2.71 36.9
85182900 Other loud speakers, w/n
mounted in their enclosures 11.15 11.34 1.7 2.96 1.66 -43.9
85189000 Parts of heading 8518 10.61 11.12 4.8 1.68 2.2 31.0
852110 Magnetic tape-type 2.80 8.21 193.2 0.01 0.03 200.0
85185000 Electric sound amplifier sets 6.38 7.41 16.1 0.91 0.43 -52.7
85183000 Headphones earphones &
combined microphone/
speaker sets 0.60 4.43 638.3 4.15 0.01 -99.8
85229000 Other parts & accessories of
heading 8519-8521 0.64 2.25 251.6 1.56 0.84 -46.2
85181000 Microphones & stands there for 1.15 1.86 61.7 0.73 0.19 -74.0
85271900 Other radio-broadcast receivers
able to operate without external
source of power ,including
apparatus able to receive radio-
telephony/radio telegraphy 1.38 1.8 30.4 0.3 0.27 -10.0
852190 Other : Video recording/
reproducing apparatus 1.74 1.23 -29.3 0.23 0.05 -78.3
85272900 Other radio-broadcast receivers
not capable to operate without
external power, used in mother
vehicles, including apparatus for
receiving radio-telephony/radio-
telegraphy 0.96 0.52 -45.8 0.08 0.12 50.0
85182100 Single loudspeakers, mounted
in their enclosures 0.80 0.51 -36.3 0.21 0.15 -28.6
85182200 Multiple loud speakers;
mounted in the same enclosure 0.58 0.35 -39.7 0.18 0.05 -72.2
ANNEXURE - 12 : INDIA’S EXPORTS AND IMPORTS OF AUDIO AND VIDEOEQUIPMENTS
(US $ Million)

161
85271200 Pocket-size radio cassette
players 0.16 0.1 -37.5 0 0
85272100 Radio broadcast receivers
with radio telephony etccmbnd
with sound recording/reproducing
apparatus, used meter vehicles,
cannot operate without external 0.12 0.05 -58.3 0
85221000 Pick-up cartridge 0.06 0 -100.0 0
Total 53.62 65.57 22.3 14.98 8.71 -41.9
Imports
852190 Other : Video recording/
reproducing apparatus 100.56 108.93 8.3 11.34 17.52 54.5
85182900 Other loud speakers, w/n
mounted in their enclosures 118.71 94.53 -20.4 12.76 19.09 49.6
85229000 Other parts & accessories of
heading 8519-8521 111.95 93.12 -16.8 17.05 18.86 10.6
85183000 Headphones earphones &
combined microphone/speaker
sets 88.39 60.71 -31.3 11.29 5.95 -47.3
85182200 Multiple loud speakers;
mounted in the same enclosure 20.42 21.53 5.4 3.24 3.98 22.8
85181000 Microphones & stands there for 13.1 20.37 55.5 3.05 0.86 -71.8
85189000 Parts of heading 8518 27.22 19.59 -28.0 3.72 2.59 -30.4
85184000 Audio-frequency electric
amplifiers 9.25 11.28 21.9 1.22 2.71 122.1
852110 Magnetic tape-type 15.27 10.48 -31.4 1.46 1.32 -9.6
85272900 Other radio-broadcast
receivers not capable to
operate without external
power, used in mother vehicles,
including apparatus for receiving
radio-telephony/radio-telegraphy 4.53 5.77 27.4 0.07 2.19 3028.6
85182100 Single loudspeakers, mounted in
their enclosures 7.7 5.5 -28.6 0.96 0.45 -53.1
85271900 Other radio-broadcast receivers
able to operate without external
source of power ,including
apparatus able to receive radio-
telephony/radio telegraphy 2.23 5.43 143.5 0.09 1.36 1411.1
85185000 Electric sound amplifier sets 8.29 4.99 -39.8 0.68 1.02 50.0

162
85271300 Other apparatus combined
with sound recording or
reproducing apparatus 6.81 3.03 -55.5 0.46 0.53 15.2
85272100 Radio broadcast receivers
with radio telephony etc
combined with sound recording/
reproducing apparatus, used
meter vehicles, cannot operate
without external 12.53 2.32 -81.5 0.18 1.15 538.9
85271200 Pocket-size radio cassette players 0.99 1.11 12.1 0.4 0.05 -87.5
85221000 Pick-up cartridge 0.32 0.16 -50.0 0.06 -100.0
Total 548.27 468.85 -14.5 68.03 79.63 17.1
Source: DGCIS, Based on OECD classification of ICT goods

163
ANNEXURE - 13 : INDIA’S EXPORTS AND IMPORTS OF OTHER ICT GOODS
(US $ Million)
Commodity Commodity Name 2008- 2009- % April- April- % Code 09 10 change May May change 2009-10 2010-11
Exports
902214 Other, for medical, surgical or
veterinary uses 82.46 75.47 -8.5 9.03 11.71 29.7
901580 Other instruments and
appliances 45.17 50.24 11.2 3.52 1.81 -48.6
901819 Other electrodiagnostic
apparatus 49.50 39.84 -19.5 3.65 8.89 143.6
902830 Electricity meters 15.51 34.89 125.0 2.6 7.78 199.2
90318000 Other measuring and checking
instruments, appliances &
machines 40.89 34.24 -16.3 5.83 4.35 -25.4
903289 Other automatic regulating
controlling instruments/
apparatus 28.59 28.09 -1.7 5.57 3.32 -40.4
901812 Ultrasonic scanning apparatus 22.08 25.72 16.5 3.35 2.39 -28.7
90329000 Parts and accessories of
instruments of 9032 30.49 20.2 -33.7 1.43 3.5 144.8
902480 Other machines and appliances 12.68 11.97 -5.6 1.57 2.54 61.8
902620 For measuring or checking
pressure 12.22 11.29 -7.6 1.5 2.11 40.7
902890 Parts and accessories 8.76 10.75 22.7 1.15 2.46 113.9
902780 Other instruments and
apparatus 7.86 9.43 20.0 1.35 1.6 18.5
90181100 Electro-cardiographs 2.65 9.15 245.3 7.05 1.18 -83.3
90181300 Magnetic resonance imaging
apparatus 3.03 7.12 135.0 1.03 0.24 -76.7
90319000 Parts and accessories of
instruments of 9031 9.94 7.03 -29.3 0.95 3.39 256.8
902710 Gas or smoke analysis
apparatus 7.19 6.28 -12.7 1.67 0.28 -83.2

164
90301000 Instrument and apparatus for measuring or detecting ionising radiation 5.92 6.15 3.9 1.61 0.72 -55.3
902920 Speed indicators and tachometers; stroboscopes 10.93 5.11 -53.2 0.69 1.04 50.7
90304000 Other instruments & apparatus, specially designed for telecom- munications(for example, cross-talk meters, gain measuring instruments, distribution factor meters, etc) 6.23 4.96 -20.4 1.49 0.57 -61.7
903210 Thermostats 2.37 4.53 91.1 0.27 0.72 166.7
902730 Spectrometers, spectrophoto- meters and spectrographs using optical radiations ( uv, visible, ir) 4.51 4.48 -0.7 0.63 0.63 0.0
852691 Radio navigational aid apparatus 4.24 3.54 -16.5 0.04 0.26 550.0
903220 Manostats 3.09 3.17 2.6 0.52 0.01 -98.1
90249000 Parts & accessories of machines of heading 9024 2.88 2.82 -2.1 0.33 0.57 72.7
84735000 Parts& accessories suitable for use with machines of two/more of headings nos 8469 to 8472 4.84 2.78 -42.6 0.11 1.34 1118.2
90299000 Parts & accessories of articles of heading 9029 2.95 2.77 -6.1 0.12 0.41 241.7
847310 Parts and accessories of the machines of heading 8469 3.58 2.61 -27.1 0.26 0.34 30.8
90241000 Machines & appliances for testing metals 2.48 2.4 -3.2 0.97 0.36 -62.9
903020 Oscilloscopes and oscillographs 0.66 2.05 210.6 0.07 0.44 528.6
84701000 Electronic calculators capable of operation excl external source of electric power & pocket-size data recording & displaying machines etc 2.6 1.81 -30.4 0.02 0.01 -50.0
902750 Other instruments and apparatus using optical radiations (uv, visible, ir) 1.4 1.64 17.1 0.43 0.63 46.5
901480 Other instruments and appliances 0.69 1.28 85.5 0.2 0.03 -85.0
903039 Other, with a recording device 1.99 1.19 -40.2 0.01 0.25 2400.0
90181400 Scintigraphic apparatus 0.16 1.11 593.8 0.02 0.01 -50.0
90311000 Machines for balancing
mechanical parts 0.62 1.08 74.2 0.4 0.07 -82.5

165
90308200 Instrument & apparatus for
measuring or checking semi-
conductor wafers or devices 0.86 0.97 12.8 0.15 0.49 226.7
902910 Revolution counters, production
counters, taximeters, mileometers,
pedometers and the like 2.15 0.86 -60.0 0.18 0.11 -38.9
90142000 Instruments and appliances for
aeronautical or space navigation
(other than compasses) 0.93 0.73 -21.5 0.29 0.01 -96.6
90149000 Parts and accessories of
compasses; other navigational
instruments 0.44 0.66 50.0 0.2 0.02 -90.0
90303100 Multimeters 0.2 0.66 230.0 0.06 0.11 83.3
84702900 Other electronic calculating
machines 0.52 0.62 19.2 0.02 0.14 600.0
90221300 Other apparatus for dental uses 0.36 0.62 72.2 0.05 0.22 340.0
902219 For other uses 5.48 0.58 -89.4 0.09 0.04 -55.6
90312000 Test benches 2.62 0.57 -78.2 0.04 0.11 175.0
90221200 Computed tomography apparatus 0.97 0.27 -72.2 0.13 0.09 -30.8
90141000 Direction finding compasses 0.88 0.25 -71.6 0 0.05 -
85269200 Other radio remote control
apparatus 0.04 0.24 500.0 0.2 0.00 -
90154000 Photographic material surveying
instruments & appliances 0.18 0.14 -22.2 - - -
90314100 Other optical instruments &
appliances for inspecting
semiconductor wafers/devices
for inspecting photomsk/reticls
used in mfg semiconductor dev 0.16 0.12 -25.0 - - -
90281000 Gas meters 0.36 0.08 -77.8 - - -
90282000 Liquid meters 0.49 0.06 -87.8 0.0 0.11 -
84690010 Word processing machines 0.01 0.03 200.0 0.0 0.0 -
84732100 Parts & accessories of electronic
calculating machines of
subheading no.847010,
847021/847029 0.67 0.03 -95.5 0.01 0.0 -
847050 Cash registers 0.03 0.02 -33.3 0.0 0.0 0.0
84702100 Electronic calculating
machines incorporating
printing device 0.02 0.01 -50.0 0.0 0.0 0.0
Total 458.53 444.71 -3.0 60.86 67.46 10.8

166
Imports
90318000 Other measuring and
checking instruments,
appliances & machines 406.31 348.01 -14.3 47.29 70.13 48.3
903289 Other Automatic regulating/
controlling instruments &
apparatus 261.68 241.58 -7.7 40.28 37.23 -7.6
902780 Other instruments and
apparatus 151.41 145.65 -3.8 27.12 23.48 -13.4
90329000 Parts and accessories of
instruments of 9032 137.75 127.14 -7.7 20.07 18.1 -9.8
90319000 Parts and accessories of
instruments of 9031 137.36 104.05 -24.3 16.87 18.93 12.2
901819 Other Electro-diagnostic
apparatus 127.32 102.22 -19.7 12.97 17.44 34.5
902730 Spectrometers, spectro-
photometers and spectrographs
using optical radiations
( uv, visible, ir) 116.7 95.35 -18.3 17.44 14.61 -16.2
90181300 Magnetic resonance imaging
apparatus 68.95 79.64 15.5 9.36 8.97 -4.2
901580 Other instruments and
appliances 92.86 75.86 -18.3 32.89 16.91 -48.6
901812 Ultrasonic scanning
apparatus 73.57 71.46 -2.9 10.74 11.9 10.8
90304000 Other instruments & apparatus, specially designed for telecommuni- cations(for example, cross-talk meters, gain measuring instruments, distribution factor meters, etc) 44.93 60.06 33.7 28.11 4.59 -83.790221200 Computed tomography apparatus 54.5 53.93 -1.0 4.65 10.34 122.4902214 Other, for medical, surgical or veterinary uses 35.23 49.46 40.4 5.26 12.39 135.6902480 Other machines and appliances 54.14 42.01 -22.4 6.65 14.71 121.2902620 For measuring or checking pressure 32.38 36.5 12.7 4.69 5.97 27.3902750 Other instruments and apparatus using optical radiations (uv, visible, ir) 32.92 36.03 9.4 6.01 5.34 -11.1902710 Gas or smoke analysis apparatus 28.32 33.77 19.2 4.81 4.89 1.7

167
902219 For other uses 30.28 32.03 5.8 4.8 2.69 -44.0
902890 Parts and accessories 20.18 26.23 30.0 3.06 4.27 39.5
84735000 Parts& accessories suitable
for use with machines of two/
more of headings nos 8469
to 8472 21.79 22.55 3.5 8.75 1.56 -82.2
90312000 Test benches 50.95 20.78 -59.2 3.31 2.23 -32.6
852691 Radio navigational aid
apparatus 43.7 18.7 -57.2 4.51 3.26 -27.7
90241000 Machines & appliances for
testing metals 13.52 12.87 -4.8 3.93 0.8 -79.6
84701000 Electronic calculators capable
of operation excl external
source of electric power &
pocket-size data recording &
displaying machines etc 8.34 12.78 53.2 1.62 1.97 21.6
902920 Speed indicators and
tachometers; stroboscopes 9.31 12.76 37.1 2.28 1.98 -13.2
903039 Other, with a recording device 14.9 12.66 -15.0 1.72 1.39 -19.2
90299000 Parts & accessories of articles
of heading 9029 9.29 10.91 17.4 2.19 3.6 64.4
903020 Oscilloscopes and oscillographs 15.21 10.51 -30.9 1.33 1.98 48.9
902830 Electricity meters 18.63 10.28 -44.8 2.25 1.13 -49.8
903210 Thermostats 11.27 9.94 -11.8 2.04 2.31 13.2
90301000 Instrument and apparatus
for measuring or detecting
ionising radiation 5.21 8.63 65.6 0.73 0.82 12.3
901480 Other instruments and appliances 13.2 7.76 -41.2 1.05 6.16 486.7
90308200 Instrument & apparatus for
measuring or checking semi-
conductor wafers or devices 4.02 7.68 91.0 2.5 0.38 -84.8
90249000 Parts & accessories of
machines of heading 9024 12.04 7.62 -36.7 1.42 1.02 -28.2
90311000 Machines for balancing
mechanical parts 7.06 7.01 -0.7 0.74 0.66 -10.8
90281000 Gas meters 4.15 4.72 13.7 0.36 0.72 100.0
90149000 Parts and accessories of
compasses; other navigational
instruments 6.65 4.09 -38.5 1.19 1.08 -9.2
90303100 Multimeters 3.57 4.02 12.6 0.82 0.92 12.2

168
90181100 Electro-cardiographs 5.32 3.82 -28.2 0.47 0.36 -23.4
903220 Manostats 4.10 3.04 -25.9 0.56 0.93 66.1
90141000 Direction finding compasses 1.98 2.99 51.0 0.45 0.89 97.8
847050 Cash registers 2.68 2.69 0.4 0.67 0.04 -94.0
90282000 Liquid meters 2.45 2.14 -12.7 0.66 0.25 -62.1
902910 Revolution counters, production
counters, taximeters, mileometers,
pedometers and the like 2.42 2.12 -12.4 0.33 0.16 -51.5
847310 Parts and accessories of the
machines of heading 8469 3.47 1.92 -44.7 0.56 0.37 -33.9
90314100 Other optical instruments &
appliances for inspecting semi-
conductor wafers/devices for
inspecting photomsk/reticls
used in mfg semiconductor dev 1.99 1.91 -4.0 0.48 2.22 362.5
90142000 Instruments and appliances for
aeronautical or space navigation
(other than compasses) 2.55 1.75 -31.4 0.44 0.03 -93.2
84732100 Parts & accessories of electronic
calculating machines of
subheading no.847010,
847021/847029 2.88 0.95 -67.0 0.11 0.03 -72.7
90221300 Other apparatus for dental uses 1.34 0.87 -35.1 0.16 0.23 43.8
90154000 Photographic material surveying
instruments & appliances 0.17 0.47 176.5 - - -
85269200 Other radio remote control
apparatus 10.81 0.46 -95.7 0.04 0.07 75.0
84702900 Other electronic calculating
machines 0.41 0.43 4.9 0.12 0.02 -83.3
84690010 Word processing machines 0.13 - - - -
90181400 Scintigraphic apparatus 3.87 0.04 -99.0 0.01 0.0 -
84702100 Electronic calculating machines
incorporating printing device 0.05 0.03 -40.0 0.0 0.0 -
Total 2226.09 1993.01 -10.5 350.87 342.46 -2.4
Source: DGCIS, Based on OECD classification of ICT goods

169
78. Israel and India : A Study of Trade and Investment Potential79. Indian Handloom : A Sector Study80. Mumbai as an International Financial Centre - A Roadmap81. Indian Export and Economic Growth Performance in Asian Perspective82. The Architecture of the International Capital Markets : Theory and
Evidence83. International Technology Transfer and Stability of Joint Ventures in Developing
Economies : A Critical Analysis84. The People’s Republic of Bangladesh : A Study of India’s Trade and
Investment Potential 85. Australia and New Zealand: A Study of India’s Trade and Investment
Potential86. Machine Tools: A Sector Study87. Agro and Processed Foods: A Sector Study88. Currency Risk Premia and Unhedged, Foreign-Currency Borrowing in
Emerging Market89. Mercosur: A Gateway to Latin American Countries90. Indian Silk Industry: A Sector Study91. Select COMESA Countries: A Study of India’s Trade and Investment
Potential92. Sri Lanka: A Study of India’s Trade and Investment Potential93. Potential for Export of IT Enabled Services from North Eastern Region of
India94. Potential for Export of Horticulture Products from Bihar and Jharkhand95. Increasing Wage Inequality in Developed Countries: Role of Changing Trade,
Technology and Factor Endowments96. Essays on Trade in Goods and Factor Movements Under Increasing Returns
to Scales97. Export of Organic Products from India: Prospects and Challenges98. Export Potential of Indian Medicinal Plants and Products99. Select Southern African Countries: A Study of India’s Trade and Investment
Potential100. BIMST-EC Initiative: A Study of India’s Trade and Investment Potential with
Select Asian Countries101. Some Aspects of Productivity Growth and Trade in Indian Industry102. Intra-Industry Trade In India’s Manufacturing Sector103. Export Potential of Indian Plantation Sector: Prospects and Challenges104. Fresh Fruits, Vegetables and Dairy Products: India’s Potential For Exports
to Other Asian Countries105. Biotechnology: Emerging Opportunities for India106. ASEAN Countries: A Study of India’s Trade and Investment Potential107. Essays on Globalisation and Wages in Developing Countries
RECENT OCCASIONAL PAPERS
OP. No. Title

170
108. Select West African Countries: A Study of India’s Trade and Investment Potential
109. Indian Leather Industry: Perspective and Export Potential110. GCC Countries: A Study of India’s Trade and Export Potential111. Indian Petroleum Products Industry : Opportunities and Challenges112. Floriculture : A Sector Study113. Japanese & U.S. Foreign Direct Investments in Indian Manufacturing : An
Analysis114. Maghreb Region: A Study of India’s Trade and Investment Potential115. Strengthening R & D Capabilities in India116. CIS Region: A Study of India’s Trade and Investment Potential117. Indian Chemical Industry: A Sector Study118. Trade and Environment: A Theoretical and Empirical Analysis119. Indian Pharmaceutical Industry : Surging Globally120. Regional Trade Agreements: Gateway to Global Trade121. Knowledge Process Outsourcing: Emerging Opportunities for India122. Indian Mineral Sector and its Export Potential123. SAARC: An Emerging Trade Bloc124. Indian Capital Goods Industry - A Sector Study125. Financial Liberalization and Its Distributional Consequences126. ECOWAS: A Study of India’s Trade and Investment Potential127. Indian Textile and Clothing Industry in Global Context: Salient Features and
Issues128. Fair Trade : Fair Way of Enhancing Export Value129. Indian Automotive Industry: At The Crossroadss130. CARICOM : A Gateway to the America131. IBSA : Enhancing Economic Cooperation Across Continents132. MSMEs and Globalisation: Analysis of Institutional Support System in India
and In Select Countries133. International Trade, Finance and Money: Essays in Uneven Development134. Sikkim: Export Potential and Prospects135. Mizoram: Export Potential and Prospects136. Floriculture: A Sector Study137. Biotechnology Industry in India: Opportunities for Growth138. Indian Gems and Jewellery: A Sector Study139. SADC: A Study of India’s Trade and Investment Potential140. Innovation, Imitation and North South Trade: Economic Theory and
Policy141. COMESA (Common Market for Eastern and Southern Africa): A Study of India’s Trade and Investment Potential142. Indian Shipping Industry: A Catalyst for Growth143. New Renewable Energy in India: Harnessing the Potential144. Caribbean Community (CARICOM): A Study of India’s Trade and Investment Potential 145. West African Region: A Study of India’s Trade and Investment Potential 146. India’s Trade and Investment Relations with LDCs (Latest Development Countries): Harnessing Synergies

171
EXIM BANK’S MAJOR PROGRAMMES

172
AHMEDABADSakar II, Floor 1 ,Next to Ellisbridge Shopping Centre,Ellisbridge P. O., Ahmedabad 380 006.Phone : (079) 26576852/26576843 Fax : (079) 26577696E-mail : [email protected]
BANGALORERamanashree Arcade, Floor 4,18, M. G. Road, Bangalore 560 001.Phone : (080) 25585755/25589101-04 Fax : (080) 25589107E-mail : [email protected]
CHANDIGARHPHD House, Floor 1, Sector 31-A,Dakshin Marg, Chandigarh 160 031Phone : (0172) 2641910/12/39/49 Fax : (0172) 2641915E-mail : [email protected]
CHENNAI UTI House, Floor 1, 29,Rajaji Salai, Chennai 600 001.Phone : (044) 25224714/25224749 Fax : (044) 25224082E-mail : [email protected]
GUWAHATISanmati Plaza, Floor 4, Near Sentinel Building,G. S. Road, Guwahati 781 005.Phone : (0361) 2462951/2450618 Fax : (0361) 2462925E-mail : [email protected]
HYDERABADGolden Edifice, Floor 2,6-3-639/640, Raj Bhavan Road,Khairatabad Circle, Hyderabad 500 004.Phone : (040) 23307816-21 Fax : (91 40) 23317843E-mail : [email protected]
KOLKATAVanijya Bhawan, Floor 4, (International Trade Facilitation Centre), 1/1 Wood Street, Kolkata - 700 016.Phone : (033) 22833419/22833420 Fax : (033) 22891727E-mail : [email protected]
MUMBAIMaker Chambers IV, Floor 8,222, Nariman Point, Mumbai 400 021.Phone : (022) 22823320 / 92 / 94 Fax : (022) 22022132E-mail : [email protected]
NEW DELHIGround Floor, Statesman House, 148, Barakhamba Road, New Delhi 110 001.Phone : (011) 23326625/6254Fax : (011) 23322758/23321719E-mail : [email protected]
PUNE44, Shankarseth Road, Pune 411 037. Phone : (91 20) 26403000 Fax : (91 20) 26458846E-mail : [email protected]
EXPORT-IMPORT BANK OF INDIAHEADQUARTERS
Centre One Building, Floor 21, World Trade Centre Complex, Cuffe Parade, Mumbai 400 005. Phone : (91 22) 22172600 Fax : (91 22) 22182572 E-mail : [email protected] Website : www.eximbankindia.in
Indian Offices Overseas Offices
ADDIS ABABA
Bole Kifle KetemaKebele - 19, (03/05), House No. 015-BAddis Ababa, Ethiopia,Phone : 00-251-116-630079Fax : 00-251-116-610170E-mail : [email protected]
DAKAR
Floor 1, 7, rue Félix Faure,B.P. 50666, Dakar, Senegal Phone : (221 33) 8232849Fax : (221 33) 8232853E-mail : [email protected]
DUBAI
Level 5, Tenancy 1 B,Gate Precinct Building No. 3,Dubai International Financial Centre,PO Box No. 506541, Dubai, UAE.Phone : (97 14) 3637462Fax : (97 14) 3637461E-mail : [email protected]
JOHANNESBURG
Floor 2, Sandton City Twin Towers East,Sandhurst Ext. 3, Sandton 2196,Johannesburg, South Africa.Cell : (27) 716094473E-mail : [email protected]
LONDON
88/90, Temple Chambers,3-7, Temple Avenue,London EC4Y OHP,United Kingdom.Phone : (44) 20 73538830Fax : (44) 20 73538831E-mail : [email protected]
SINGAPORE20, Collyer Quay,# 10-02, Tung Centre,Singapore 049319.Phone : (65) 65326464Fax : (65) 65352131E-mail : [email protected]
WASHINGTON D.C.1750 Pennsylvania Avenue NW,Suite 1202, Washington D.C. 20006,United States of America.Phone : (1 202) 223 3238Fax : (1 202) 785 8487E-mail : [email protected]