export concentration matters - world trade organization
TRANSCRIPT
Income volatility in small and developing economies: export concentration matters
Marion Jansen, ERSD
World Trade Organization
Geneva, Switzerland

This paper is only available in English – Price CHF 20.-
To order, please contact:
WTO Publications Centre William Rappard 154 rue de Lausanne
CH-1211 Geneva Switzerland Tel: (41 22) 739 5208/5308
Fax (41 22) 739 5792 Website: www.wto.org E-mail: [email protected]
ISSN 1726-9466 ISBN 92-870- 1242-2
Printed by the WTO Secretariat II- 2004, 1 ,000
© World Trade Organization, 2004. Reproduction of material contained in this document may be made only with written permission of the WTO Publications Manager.
With written permission of the WTO Publications Manager, reproduction and use of the material contained in this document for non-commercial educational and training purposes is encouraged. WTO Discussion Papers are presented by the authors in a personal capacity and should not in any way be interpreted as reflecting the views of the World Trade Organization or its Members.

TABLE OF CONTENTS
I. INTRODUCTION .....................................................................................................................................1
II. OPENNESS, GROWTH AND INCOME VOLATILITY IN SMALL ECONOMIES .............................2
III. POSSIBLE DETERMINANTS OF INCOME VOLATILITY: TERMS OF TRADE VOLATILITY AND EXPORT CONCENTRATION...............................................................................6
IV. INCOME VOLATILITY REVISITED ...................................................................................................10
V. CONCLUSIONS .....................................................................................................................................14
VI. REFERENCES ........................................................................................................................................15
VII. APPENDIX TABLES..............................................................................................................................16
LIST OF TABLES, CHARTS AND BOXES
TABLE I: EXPORT CONCENTRATION, NUMBER OF PRODUCTS EXPORTED AND TERMS OF TRADE VOLATILITY ....................................................................................................................16 TABLE II: GDP VOLATILITY AND OPENNESS BY COUNTRY ...............................................................21 TABLE III: GDP PER CAPITA AND AVERAGE GROWTH RATE ............................................................26 TABLE III: GDP PER CAPITA AND AVERAGE GROWTH RATE ............................................................27 TABLE IV: CONCENTRATION OF EXPORT COMMODITIES AND SERVICES FOR WTO MEMBERS .........................................................................................................................................................31
CHART 1: SMALL ECONOMIES' RELIANCE ON TRADE, AVERAGES 1980-2000.................................2
CHART 2: INCOME VOLATILITY AND POPULATION SIZE, 1980-2000...................................................3
CHART 3: INCOME VOLATILITY FOR REGIONAL GROUPINGS, 1980-2000..........................................4
CHART 4: AVERAGE GROWTH RATE AND POPULATION, 1980-2000....................................................5
CHART 5: OPENNESS TO TRADE AND GROWTH IN LDCS AND MICROSTATES, AVERAGES 1980-2000 ..........................................................................................................................................5
CHART 6: AVERAGE EXPORT CONCENTRATION INDEX AND POPULATION, 1980-2000.................6
CHART 7: NUMBER OF PRODUCTS EXPORTED AND POPULATION, 1980-2000..................................6
CHART 8: TRANSPORT COSTS FOR WTO MEMBERS, 1990......................................................................7
CHART 9: AVERAGE CONCENTRATION INDEX PER REGION, 1980-2000.............................................8
CHART 10: TERMS OF TRADE VOLATILITY AND POPULATION, 1980-2000, AVERAGE VALUES ....8
CHART 11: TERMS OF TRADE VOLATILITY PER REGION, 1980-2000, AVERAGE VALUES................9
CHART 12: TERMS OF TRADE VOLATILITY EXPLAINED - THE EXAMPLE OF FOUR MICROSTATES....................................................................................................................................................12
CHART 13: INCOME VOLATILITY AND ITS DETERMINANTS - LDCS AND OECD COUNTRIES ......13
BOX 1: DETERMINANTS OF TERMS OF TRADE VOLATILITY - REGRESSION RESULTS...........11
BOX 2: DETERMINANTS OF INCOME VOLATILITY - REGRESSION RESULTS............................13
1
I. INTRODUCTION
The integration of small economies into the global trading system was one of the issues discussed during the Fourth Ministerial Conference at Doha in 2001. In particular, Members agreed on a WTO work programme, under the auspices of the General Council, to examine issues relating to the trade of small economies. Small country issues have been analysed in the economic literature for several decades now. The reason for the attention devoted to small states is to be found in the general belief that, due to some particular characteristics, small countries are particularly vulnerable and can be more easily hurt in the process of globalization. Yet there is no unanimity of opinion among researchers on this point. Some have argued that being small in a "macro" world is a drawback. Small states for instance cannot enjoy economies of scale both in production and in public administration. They tend to be particularly vulnerable to natural disasters and economic shocks. According to other studies, smallness is an asset in a changing and dynamic world. Small countries can respond quickly and easily to the adjustments required by a changing international economy. The decision-making process can be faster and more flexible when the country's population is less heterogeneous.
Although there seems to be no agreement on whether or not "small is beautiful", there is some agreement in the literature when it comes to common characteristics of small states. For many small states, social and educational indicators are relatively good. Moreover, GDP per capita and GDP growth do not seem to be systematically worse in smaller states than in larger states. In fact, some researchers would argue the opposite.
Smaller economies are more open to trade because they have to rely on imports to satisfy their domestic demand. Exports tend to be highly concentrated in a few sectors and small economies tend to be characterized by higher income volatility than their larger counterparts.
Existing literature (Easterly and Kraay, 2000) has argued that high income volatility in small economies is due to their openness and that export concentration plays a minor role. This paper instead argues that export concentration through its effect on terms of trade volatility has a major effect on income volatility. Openness itself has a direct and positive effect on income volatility. If small economies were able to diversify their exports, they could therefore reduce income volatility. This would in turn be likely to have a positive impact on growth, because income volatility has been shown in the economic literature to be bad for growth (e.g. Easterly and Kraay, 2000 and Ramey and Ramey, 1995).
The independent effects of concentration and openness on income volatility can also explain why small economies do not under-perform when it comes to growth (Easterly and Kraay, 2000). While both have an indirect and negative effect on growth through their effect on volatility, openness also has a direct and positive effect on growth. This paper shows that poor economies, in particular LDCs, are like small economies in that they are characterized by high concentration on the export side. Income volatility in LDCs is intriguingly similar to that in small economies. LDCs are on average, however, significantly less open than small economies. Although not directly tested in this paper, this may explain why the growth performance of LDCs is significantly smaller than that of small economies.

2
II. OPENNESS, GROWTH AND INCOME VOLATILITY IN SMALL ECONOMIES
The term "small economies" has been used in different contexts in the literature, and different measures have been used to define "smallness", including population size, land area and GDP. Population size can be considered to be the most popular measure. Population and land area can both be deemed to reflect the size of an economy's factor endowments. GDP is a frequently used measure for market size, as it reflects domestic demand. Throughout this paper the variable population will be used to measure economic size. The term "microstates" will be used to refer to economies with populations smaller than 1.5 million and the term "small states" to refer to economies with populations larger than 1.5 million but smaller than 5 million.1
1With respect to population size, the literature uses different thresholds when referring to "small economies". Some suggest using a population of 1.5 million as a threshold (Commonwealth Secretariat – World Bank Joint Task Force, 2000), others 5 million or even more (Streeten, 1993, Collier and Dollar, 1999, Brautigam and Woolcock, 2001), and still others something in between (Armstrong et al, 1998). By distinguishing these two groups, microstates and small states, two different definitions are allowed for, although these thresholds will turn out to play only a minor role for the analysis of this paper. Note that in the WTO Membership 30 of 143 Members would be microstates according to the definition used in this paper. Five of them are LDCs.
The three measures have in common that smaller values imply stronger limitations to diversify production for the relevant economy. The smaller an economy's factor endowments (labour, land), the more difficult it is to produce a large variety of products. The smaller a country's market (GDP), the lower the probability that it is profitable to produce goods subject to economies of scale. Smaller economies therefore have to rely more heavily on external trade and foreign investment to overcome their inherent scale and resource limitations. Chart 1 shows how openness decreases with economic size.
A high degree of openness brings real benefits that accrue from trade – consumers in small states are able to obtain a greater variety of goods at lower cost than if their choices were confined to domestically produced goods. Additionally, producers in small states can sell on world markets, provided they have effective market access, thus earning more than if they were confined to meeting limited domestic demand. Participation in the world market also helps to channel new ideas and information about opportunities to firms and consumers in small states. However, it has been argued that openness also implies that small
Twenty-seven WTO Members would fall in the group of small states, four of which are LDCs.
0
20
40
60
80
100
120
0-1.5 (46) 1.51-5 (44) 5.1-10 (30) 10.1-25 (32) 25.1+ (34)
Chart 1: Small economies' reliance on trade, averages 1980-2000
Note: numbers in brackets indicate the number of observations within each population group. See Appendix for raw data and sources.
Population (millions)
Rat
io o
f tra
de to
GD
P
3
economies are more vulnerable to shocks from outside, which would increase GDP volatility.
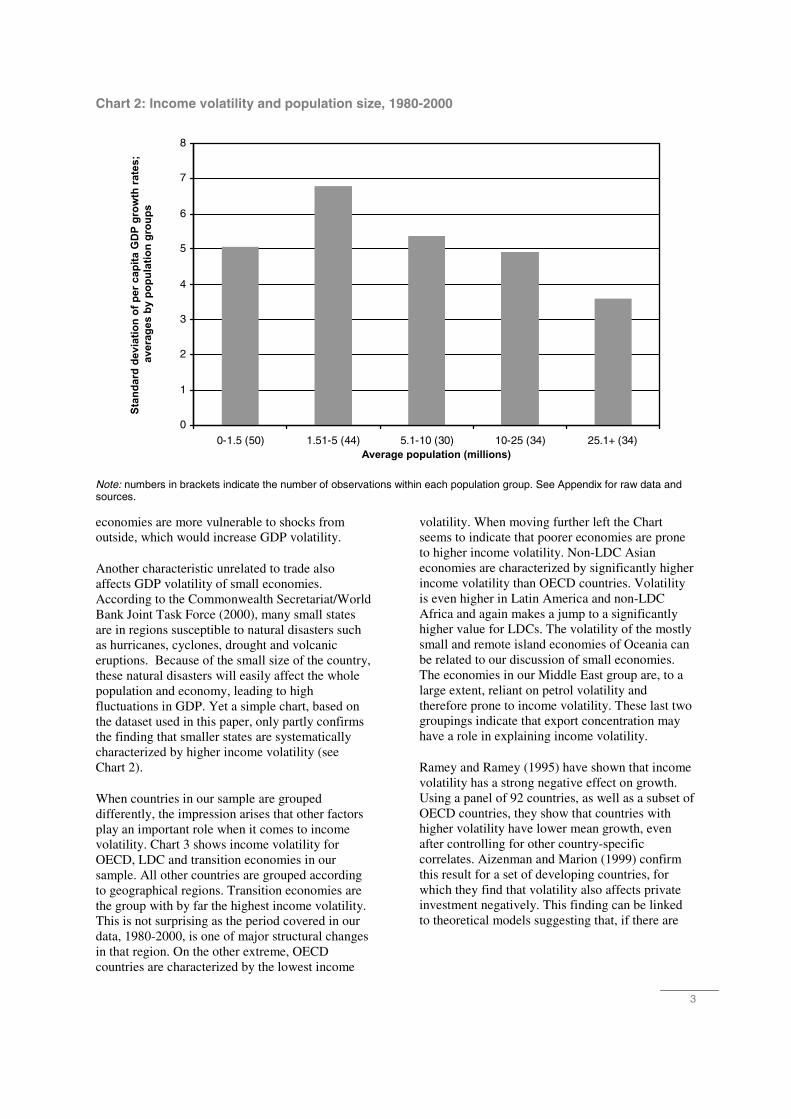
Another characteristic unrelated to trade also affects GDP volatility of small economies. According to the Commonwealth Secretariat/World Bank Joint Task Force (2000), many small states are in regions susceptible to natural disasters such as hurricanes, cyclones, drought and volcanic eruptions. Because of the small size of the country, these natural disasters will easily affect the whole population and economy, leading to high fluctuations in GDP. Yet a simple chart, based on the dataset used in this paper, only partly confirms the finding that smaller states are systematically characterized by higher income volatility (see Chart 2).
When countries in our sample are grouped differently, the impression arises that other factors play an important role when it comes to income volatility. Chart 3 shows income volatility for OECD, LDC and transition economies in our sample. All other countries are grouped according to geographical regions. Transition economies are the group with by far the highest income volatility. This is not surprising as the period covered in our data, 1980-2000, is one of major structural changes in that region. On the other extreme, OECD countries are characterized by the lowest income
volatility. When moving further left the Chart seems to indicate that poorer economies are prone to higher income volatility. Non-LDC Asian economies are characterized by significantly higher income volatility than OECD countries. Volatility is even higher in Latin America and non-LDC Africa and again makes a jump to a significantly higher value for LDCs. The volatility of the mostly small and remote island economies of Oceania can be related to our discussion of small economies. The economies in our Middle East group are, to a large extent, reliant on petrol volatility and therefore prone to income volatility. These last two groupings indicate that export concentration may have a role in explaining income volatility.
Ramey and Ramey (1995) have shown that income volatility has a strong negative effect on growth. Using a panel of 92 countries, as well as a subset of OECD countries, they show that countries with higher volatility have lower mean growth, even after controlling for other country-specific correlates. Aizenman and Marion (1999) confirm this result for a set of developing countries, for which they find that volatility also affects private investment negatively. This finding can be linked to theoretical models suggesting that, if there are
Chart 2: Income volatility and population size, 1980-2000
0
1
2
3
4
5
6
7
8
0-1.5 (50) 1.51-5 (44) 5.1-10 (30) 10-25 (34) 25.1+ (34)
Note: numbers in brackets indicate the number of observations within each population group. See Appendix for raw data and sources.
Average population (millions)
Stan
dard
dev
iatio
n of
per
cap
ita G
DP
gro
wth
rate
s;
aver
ages
by
popu
latio
n gr
oups

4
irreversibilities in investment, increased volatility can lead to lower investment.2
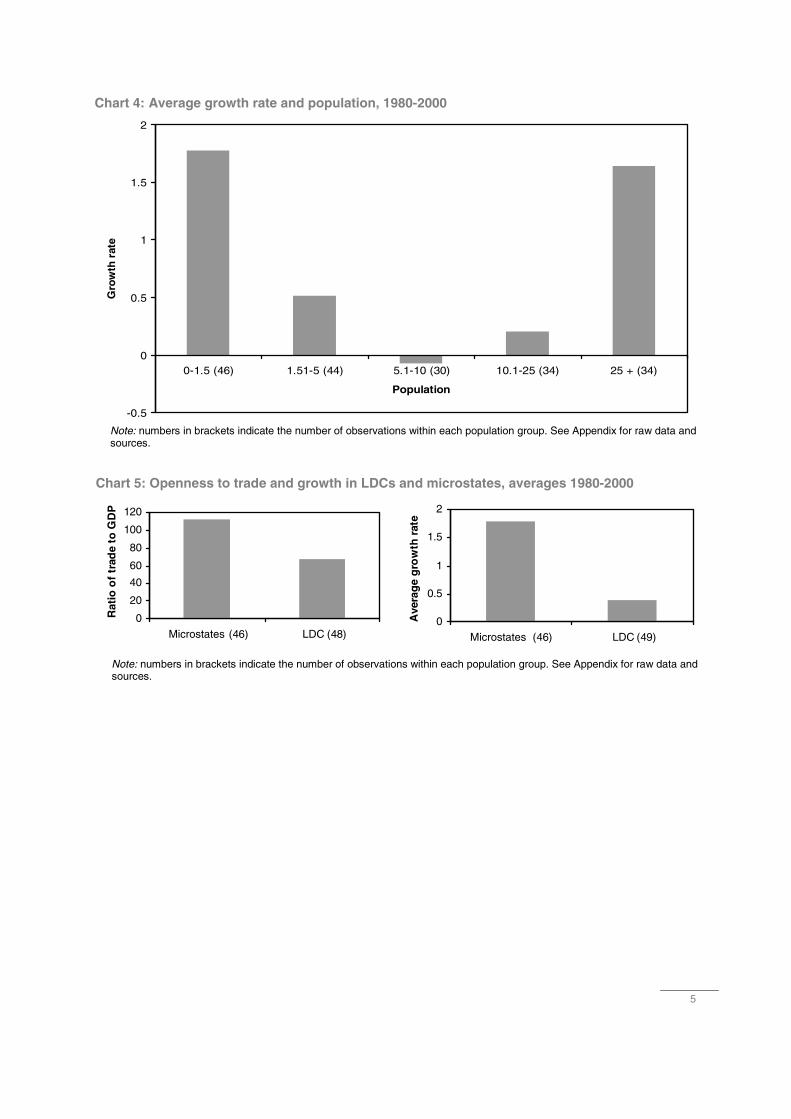
A simple look at our data (Chart 4) does not give the impression that smaller economies grow less. Easterly and Kraay (2000) give an explanation for this weak relationship between economic size and growth. Their analysis shows that openness to trade has a significantly positive effect on GDP growth. They also find that volatility in GDP is bad for GDP growth. Small economies tend to be particularly open and this openness stimulates economic activity and growth. At the same time, however, openness to trade is one of the main reasons for the GDP volatility that characterizes small economies and GDP volatility is bad for economic growth. Easterly and Kraay (2000) argue that the positive and negative effects from openness roughly offset each other in the case of small states.
2 See Ramey and Ramey (1993). Turnovsky and Chattopadhyay (2003) test for the effect of four volatility indicators on income growth in developing countries: GDP volatility, terms of trade volatility, fiscal volatility and monetary volatility. They find that terms of trade, fiscal and monetary volatility have a strongly negative impact on growth. The same is true for GDP volatility if the other measures of volatility are excluded. This finding can to a certain extent be explained by the approach taken in this paper that terms of trade volatility should be considered to be a determinant of income volatility. The two variables are indeed highly correlated.
This explains their finding that smallness has no significant effect on economic growth.
However, openness is unlikely to be the only reason for the high income volatility observed in small economies. Charts 2 and 3 show that LDCs and microstates (population smaller than 1.5 million) are characterized by similar levels of income volatility. Yet as a group LDCs are significantly less open to trade than microstates (See Chart 5). According to Easterly and Kraay's argument this would explain why LDCs grow less. Yet at the same time, this indicates that there is a need to have a closer look at the determinants of income volatility.
The present paper will argue that openness alone does not explain the income volatility observed in many small economies. As suggested previously, export concentration also is a part of the story. This is important, as it would not be desirable for small economies to reduce their trade with the outside world. The income volatility caused by openness can therefore not be reduced. But it may be possible to reduce the share of income volatility caused by export concentration through the use of policies of export diversification. This is also true for larger economies that are characterized by high concentration on the export side.
0
1
2
3
4
5
6
7
8
9
10
Transition(24)
Mideast(13)
Oceania (6) LDC (20) Africa (20) LatinAmerica
(34)
Asia (16) OECD (30)
Regions
Sta
nd
ard
dev
iati
on
of
per
cap
. GD
P g
row
th
rate
s, a
vg b
y re
gio
nal
gro
up
ing
s
Chart 3: Income volatility for regional groupings, 1980-2000
Note: numbers in brackets indicate the number of observations within each population group. See Appendix for raw data and sources.
5
-0.5
0
0.5
1
1.5
2
0-1.5 (46) 1.51-5 (44) 5.1-10 (30) 10.1-25 (34) 25 + (34)
Population
Gro
wth
rat
eChart 4: Average growth rate and population, 1980-2000
Note: numbers in brackets indicate the number of observations within each population group. See Appendix for raw data and sources.
0
20
40
60
80
100
120
Microstates (46) LDC (48)
Rat
io o
f tr
ade
to G
DP
0
0.5
1
1.5
2
Microstates (46) LDC (49)
Ave
rag
e g
row
th r
ate
Chart 5: Openness to trade and growth in LDCs and microstates, averages 1980-2000
Note: numbers in brackets indicate the number of observations within each population group. See Appendix for raw data and sources.
6
III. POSSIBLE DETERMINANTS OF INCOME VOLATILITY: TERMS OF TRADE VOLATILITY AND EXPORT CONCENTRATION
It has been mentioned before that smallness limits an economy's opportunities to diversify. Smaller economies therefore have to rely on imports in order to increase the choice of goods and services supplied to their population. At the same time their exports will tend to be less diversified than those of larger countries. It has been argued in the literature that a lack in export diversification is likely to make economies more vulnerable to changes in prices or demand for the few commodities or services they export. Given that trade represents a large share of the economic activity in small economies, fluctuations on the export side are likely to have a negative impact on the stability of the overall economy.
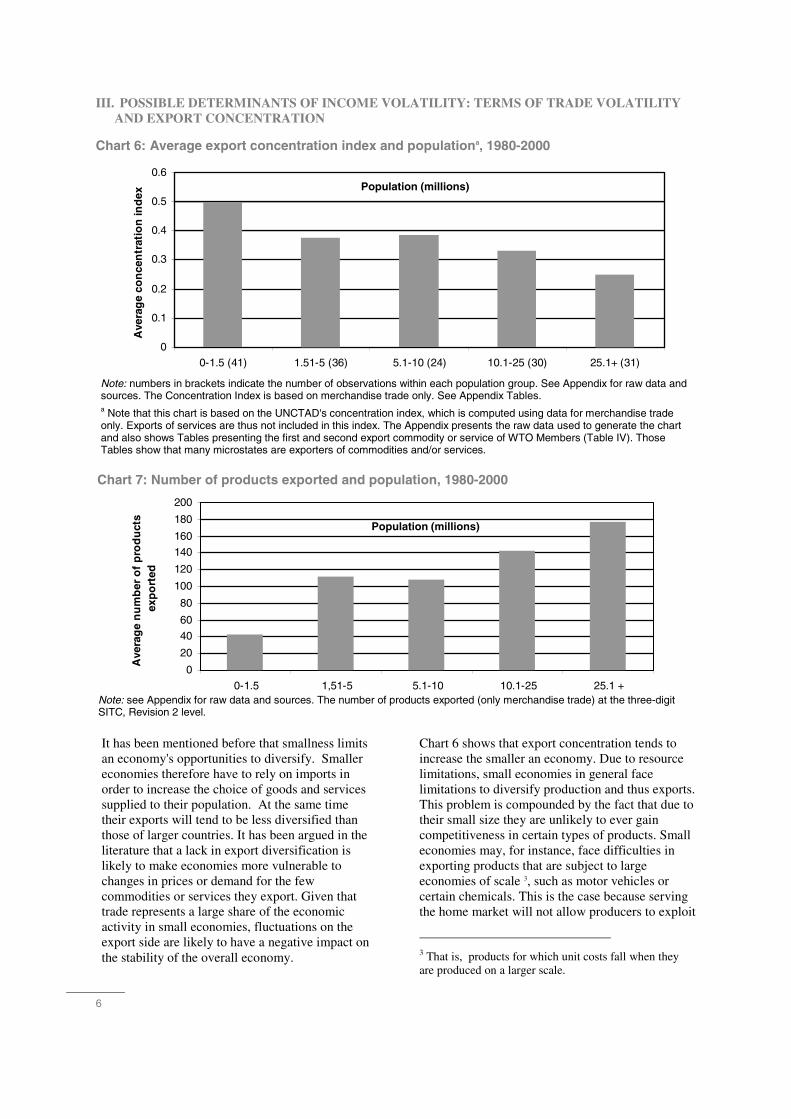
Chart 6 shows that export concentration tends to increase the smaller an economy. Due to resource limitations, small economies in general face limitations to diversify production and thus exports. This problem is compounded by the fact that due to their small size they are unlikely to ever gain competitiveness in certain types of products. Small economies may, for instance, face difficulties in exporting products that are subject to large economies of scale 3, such as motor vehicles or certain chemicals. This is the case because serving the home market will not allow producers to exploit
3 That is, products for which unit costs fall when they are produced on a larger scale.
0
0.1
0.2
0.3
0.4
0.5
0.6
0-1.5 (41) 1.51-5 (36) 5.1-10 (24) 10.1-25 (30) 25.1+ (31)
Population (millions)
Ave
rag
e co
nce
ntr
atio
n in
dex
Chart 6: Average export concentration index and populationa, 1980-2000
Note: numbers in brackets indicate the number of observations within each population group. See Appendix for raw data and sources. The Concentration Index is based on merchandise trade only. See Appendix Tables. a Note that this chart is based on the UNCTAD's concentration index, which is computed using data for merchandise trade only. Exports of services are thus not included in this index. The Appendix presents the raw data used to generate the chart and also shows Tables presenting the first and second export commodity or service of WTO Members (Table IV). Those Tables show that many microstates are exporters of commodities and/or services.
0
20
40
60
80
100
120
140
160
180
200
0-1.5 1,51-5 5.1-10 10.1-25 25.1 +
Population (millions)
Ave
rag
e n
um
ber
of
pro
du
cts
exp
ort
ed
Chart 7: Number of products exported and population, 1980-2000
Note: see Appendix for raw data and sources. The number of products exported (only merchandise trade) at the three-digit SITC, Revision 2 level.
7
0.173
0.139
0.103
0.00
0.02
0.04
0.06
0.08
0.10
0.12
0.14
0.16
0.18
0.20
Landlocked
CIF
/FO
B r
atio
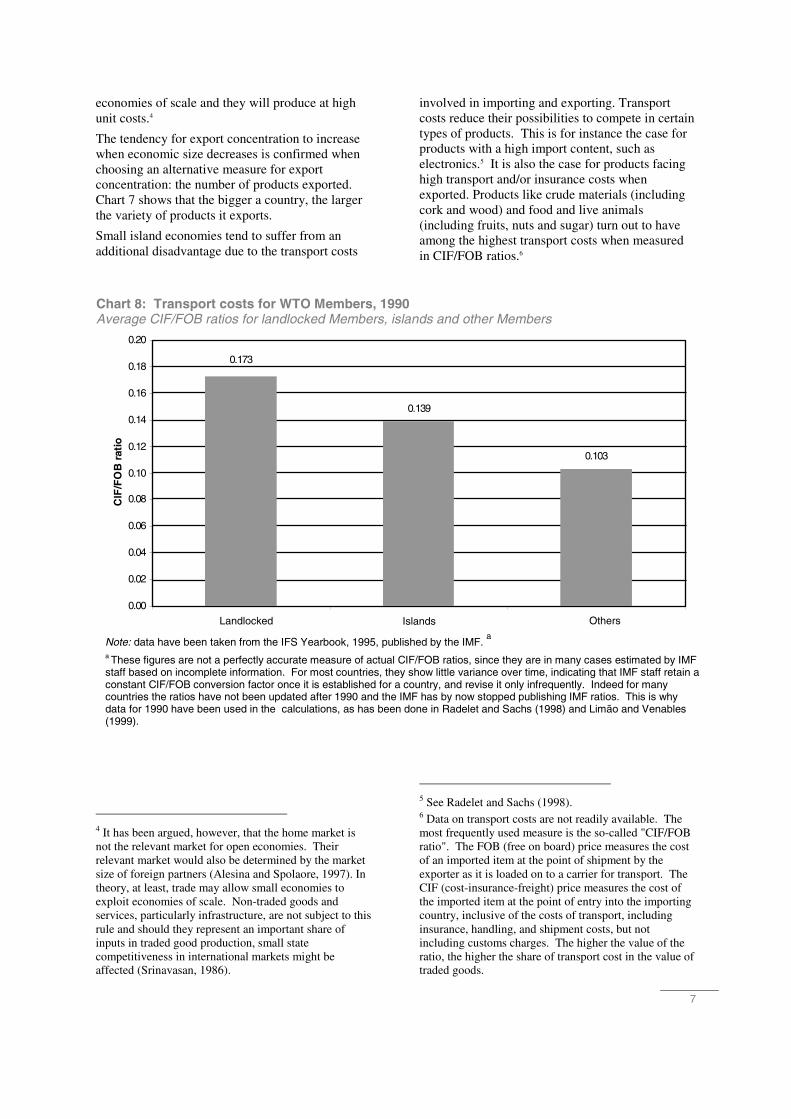
Chart 8: Transport costs for WTO Members, 1990Average CIF/FOB ratios for landlocked Members, islands and other Members
Note: data have been taken from the IFS Yearbook, 1995, published by the IMF. a
a These figures are not a perfectly accurate measure of actual CIF/FOB ratios, since they are in many cases estimated by IMF staff based on incomplete information. For most countries, they show little variance over time, indicating that IMF staff retain a constant CIF/FOB conversion factor once it is established for a country, and revise it only infrequently. Indeed for many countries the ratios have not been updated after 1990 and the IMF has by now stopped publishing IMF ratios. This is why data for 1990 have been used in the calculations, as has been done in Radelet and Sachs (1998) and Limão and Venables (1999).
economies of scale and they will produce at high unit costs.4
The tendency for export concentration to increase when economic size decreases is confirmed when choosing an alternative measure for export concentration: the number of products exported. Chart 7 shows that the bigger a country, the larger the variety of products it exports.
Small island economies tend to suffer from an additional disadvantage due to the transport costs
4 It has been argued, however, that the home market is not the relevant market for open economies. Their relevant market would also be determined by the market size of foreign partners (Alesina and Spolaore, 1997). In theory, at least, trade may allow small economies to exploit economies of scale. Non-traded goods and services, particularly infrastructure, are not subject to this rule and should they represent an important share of inputs in traded good production, small state competitiveness in international markets might be affected (Srinavasan, 1986).
involved in importing and exporting. Transport costs reduce their possibilities to compete in certain types of products. This is for instance the case for products with a high import content, such as electronics.5 It is also the case for products facing high transport and/or insurance costs when exported. Products like crude materials (including cork and wood) and food and live animals (including fruits, nuts and sugar) turn out to have among the highest transport costs when measured in CIF/FOB ratios.6
5 See Radelet and Sachs (1998). 6 Data on transport costs are not readily available. The most frequently used measure is the so-called "CIF/FOB ratio". The FOB (free on board) price measures the cost of an imported item at the point of shipment by the exporter as it is loaded on to a carrier for transport. The CIF (cost-insurance-freight) price measures the cost of the imported item at the point of entry into the importing country, inclusive of the costs of transport, including insurance, handling, and shipment costs, but not including customs charges. The higher the value of the ratio, the higher the share of transport cost in the value of traded goods.
Islands Others
8
0
0.1
0.2
0.3
0.4
0.5
0.6
LDC (38) Oceania (4) Mideast (10) Africa (17) LatinAmerica
(30)
Asia (14) Transition(17)
OECD (30)
RegionsA
vera
ge
con
cen
trat
ion
ind
ex
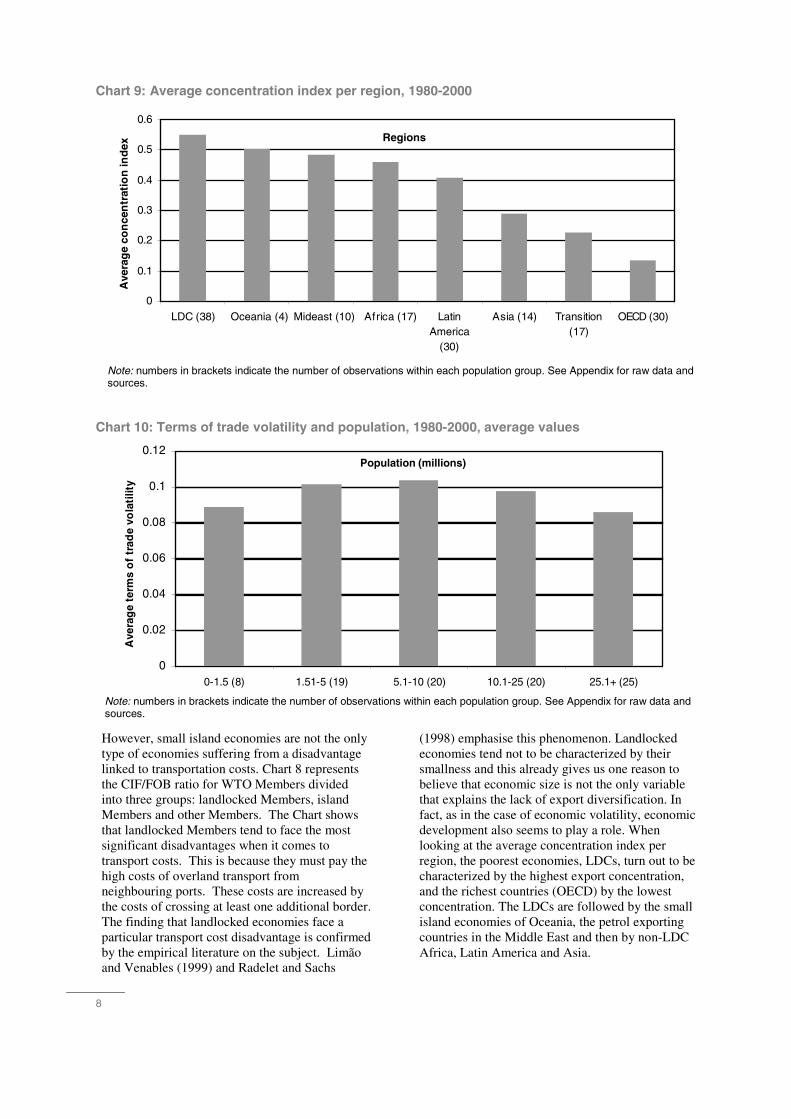
Chart 9: Average concentration index per region, 1980-2000
Note: numbers in brackets indicate the number of observations within each population group. See Appendix for raw data and sources.
However, small island economies are not the only type of economies suffering from a disadvantage linked to transportation costs. Chart 8 represents the CIF/FOB ratio for WTO Members divided into three groups: landlocked Members, island Members and other Members. The Chart shows that landlocked Members tend to face the most significant disadvantages when it comes to transport costs. This is because they must pay the high costs of overland transport from neighbouring ports. These costs are increased by the costs of crossing at least one additional border. The finding that landlocked economies face a particular transport cost disadvantage is confirmed by the empirical literature on the subject. Limão and Venables (1999) and Radelet and Sachs
(1998) emphasise this phenomenon. Landlocked economies tend not to be characterized by their smallness and this already gives us one reason to believe that economic size is not the only variable that explains the lack of export diversification. In fact, as in the case of economic volatility, economic development also seems to play a role. When looking at the average concentration index per region, the poorest economies, LDCs, turn out to be characterized by the highest export concentration, and the richest countries (OECD) by the lowest concentration. The LDCs are followed by the small island economies of Oceania, the petrol exporting countries in the Middle East and then by non-LDC Africa, Latin America and Asia.
0
0.02
0.04
0.06
0.08
0.1
0.12
0-1.5 (8) 1.51-5 (19) 5.1-10 (20) 10.1-25 (20) 25.1+ (25)
Population (millions)
Ave
rag
e te
rms
of
trad
e vo
lati
lity
Chart 10: Terms of trade volatility and population, 1980-2000, average values
Note: numbers in brackets indicate the number of observations within each population group. See Appendix for raw data and sources.
9
0
0.02
0.04
0.06
0.08
0.1
0.12
0.14
0.16
LDC (21) Mideast (4) Africa (14) Latin America(19)
Asia (9) OECD (26)
Regions
Ave
rag
e te
rms
of
trad
e vo
lati
lity
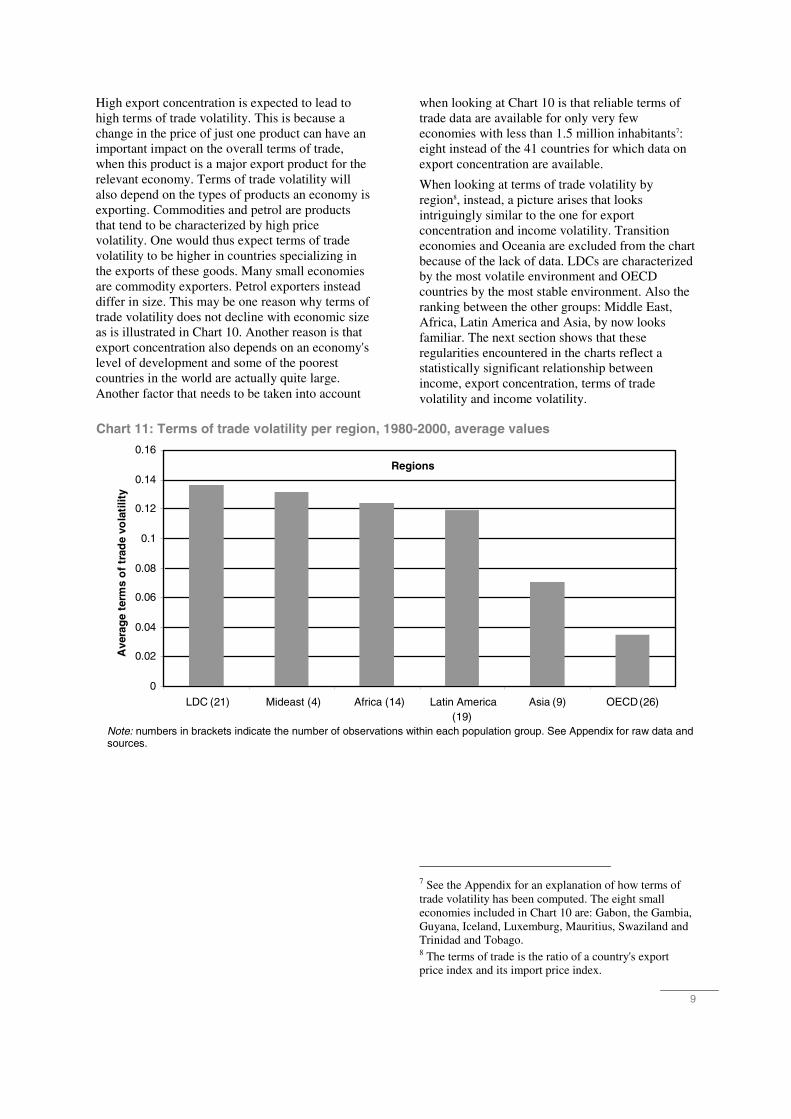
Chart 11: Terms of trade volatility per region, 1980-2000, average values
Note: numbers in brackets indicate the number of observations within each population group. See Appendix for raw data and sources.
High export concentration is expected to lead to high terms of trade volatility. This is because a change in the price of just one product can have an important impact on the overall terms of trade, when this product is a major export product for the relevant economy. Terms of trade volatility will also depend on the types of products an economy is exporting. Commodities and petrol are products that tend to be characterized by high price volatility. One would thus expect terms of trade volatility to be higher in countries specializing in the exports of these goods. Many small economies are commodity exporters. Petrol exporters instead differ in size. This may be one reason why terms of trade volatility does not decline with economic size as is illustrated in Chart 10. Another reason is that export concentration also depends on an economy's level of development and some of the poorest countries in the world are actually quite large. Another factor that needs to be taken into account
when looking at Chart 10 is that reliable terms of trade data are available for only very few economies with less than 1.5 million inhabitants7: eight instead of the 41 countries for which data on export concentration are available.
When looking at terms of trade volatility by region8, instead, a picture arises that looks intriguingly similar to the one for export concentration and income volatility. Transition economies and Oceania are excluded from the chart because of the lack of data. LDCs are characterized by the most volatile environment and OECD countries by the most stable environment. Also the ranking between the other groups: Middle East, Africa, Latin America and Asia, by now looks familiar. The next section shows that these regularities encountered in the charts reflect a statistically significant relationship between income, export concentration, terms of trade volatility and income volatility.
7 See the Appendix for an explanation of how terms of trade volatility has been computed. The eight small economies included in Chart 10 are: Gabon, the Gambia, Guyana, Iceland, Luxemburg, Mauritius, Swaziland and Trinidad and Tobago. 8 The terms of trade is the ratio of a country's export price index and its import price index.
10
IV. INCOME VOLATILITY REVISITED
The previous sections have shown that smaller economies tend to be characterized by both higher openness and higher export concentration. These findings are not surprising as smaller economies are limited in their possibilities to diversify production. Therefore they have to rely more on imports than their larger counterparts in order to satisfy domestic demand. They will also experience more difficulties in diversifying their export structure. Smaller economies are also characterized by larger income volatility. This raises therefore the question whether the three variables – income volatility, openness and export concentration are linked.
Charts as the ones shown in the previous sections only show correlations between two variables. They do not say whether the depicted relationships are based on pure coincidence or are statistically significant. They also do not show whether these correlations continue to exist if more than two variables are interacting. In order to analyse multiple linkages one needs to have recourse to econometric analysis. This is done by running regressions: statistical procedures used to estimate the value of a dependent variable based on the value of one or more independent variables. This section will test whether the dependent variable terms of trade volatility can be explained by independent variables measuring export concentration and taking into account whether countries are microstates and/or exporters of commodities or oil. This section also tries to explain income volatility and tests whether it is determined by terms of trade volatility, countries' openness and their GDP per capita.
Rodrik (1997) presents similar regressions, the results of which show that "exposure to external risk" affects GDP volatility positively. In his paper exposure to external risk is measured by terms of trade volatility weighted by the relevant country's openness. In other words, the more volatile terms of trade and the more open an economy, the higher its income volatility. Rodrik's regression takes into account that income volatility may be region specific. This is done by including so-called dummies for OECD countries, East Asia, Latin America and Sub-Saharan Africa. Only the first two are significant and they have a negative effect on GDP volatility. In other words, income volatility in OECD and East Asian economies is lower than in other economies with similar levels of exposure to external risk. This confirms the finding in previous sections of this paper that more developed countries suffer less from economic volatility.
Easterly and Kraay (2000) also show that weighted terms of trade volatility has a significant effect on income volatility. They include in their regressions dummies for commodity exporters and oil exporters, in order to take into account that they are more likely to suffer extreme fluctuations in their terms of trade, due to the higher price fluctuations in these products. Both dummies are indeed significant and have the expected positive sign. In addition, the regression includes a small state dummy for states with a population smaller than one million. This dummy is also significant and positive, indicating that even after controlling for terms of trade volatility, income volatility in small states is significantly higher than in non-small states.
Easterly and Kraay (2000) argue that this is due to the inherent openness of small states. To make this point, the authors perform two regressions. In the first one, they use the weighted terms of trade as the dependent variable, and in the second one the so-called "un-weighted" terms of trade. The difference between the two measures is that in the latter case, the difference between growth in export prices and growth in import prices is not weighted by the share of exports/imports in GDP. The "un-weighted" terms of trade variable thus fails to capture a country's openness to trade. The authors regress each dependent variable on dummies for commodity exporters, oil exporters and small states. The result is that it is only in the case of weighted terms of trade that the small state dummy is significant and has the expected positive sign. The authors interpret this result as casting "doubt on the notion that small states are especially vulnerable to external shocks because their international trade is more specialized". Instead they argue that this vulnerability is due to the inherent openness of small economies. But they also admit that their evidence on this issue cannot be considered to be conclusive.9
9 Love (1986) discusses the results of a number of cross country empirical studies that attempt to measure the impact of export concentration on export earnings. He acknowledges that there is indeed little evidence for concentration leading to higher export instability. He suggests using time series instead of cross country analysis and performing regressions for a number of developing countries. His results are, in general, satisfactory, in the sense that he finds in many cases a positive and statistically significant relationship between export concentration and export instability.
11
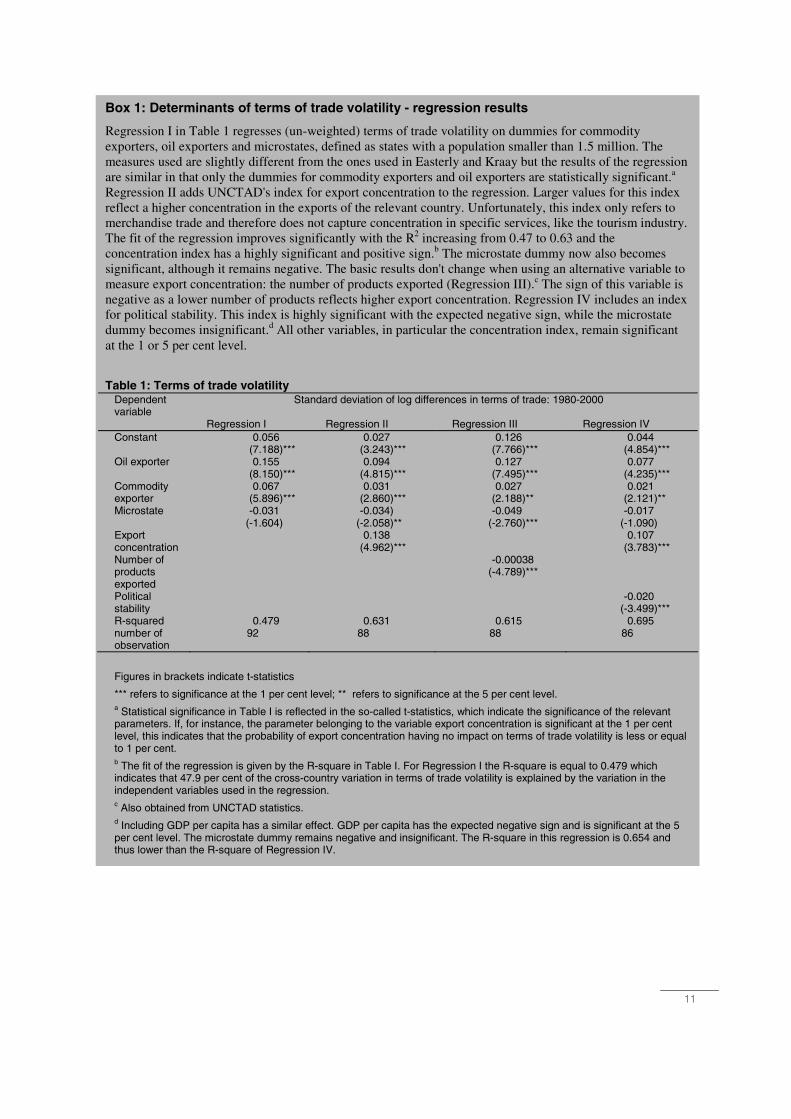
Box 1: Determinants of terms of trade volatility - regression results
Regression I in Table 1 regresses (un-weighted) terms of trade volatility on dummies for commodity exporters, oil exporters and microstates, defined as states with a population smaller than 1.5 million. The measures used are slightly different from the ones used in Easterly and Kraay but the results of the regression are similar in that only the dummies for commodity exporters and oil exporters are statistically significant.a Regression II adds UNCTAD's index for export concentration to the regression. Larger values for this index reflect a higher concentration in the exports of the relevant country. Unfortunately, this index only refers to merchandise trade and therefore does not capture concentration in specific services, like the tourism industry. The fit of the regression improves significantly with the R2 increasing from 0.47 to 0.63 and the concentration index has a highly significant and positive sign.b The microstate dummy now also becomes significant, although it remains negative. The basic results don't change when using an alternative variable to measure export concentration: the number of products exported (Regression III).c The sign of this variable is negative as a lower number of products reflects higher export concentration. Regression IV includes an index for political stability. This index is highly significant with the expected negative sign, while the microstate dummy becomes insignificant.d All other variables, in particular the concentration index, remain significant at the 1 or 5 per cent level.
Table 1: Terms of trade volatility Dependent variable
Standard deviation of log differences in terms of trade: 1980-2000
Regression I Regression II Regression III Regression IV Constant 0.056
(7.188)*** 0.027 (3.243)***
0.126 (7.766)***
0.044 (4.854)***
Oil exporter 0.155 (8.150)***
0.094 (4.815)***
0.127 (7.495)***
0.077 (4.235)***
Commodity exporter
0.067 (5.896)***
0.031 (2.860)***
0.027 (2.188)**
0.021 (2.121)**
Microstate -0.031 (-1.604)
-0.034) (-2.058)**
-0.049 (-2.760)***
-0.017 (-1.090)
Export concentration
0.138 (4.962)***
0.107 (3.783)***
Number of products exported
-0.00038 (-4.789)***
Political stability
-0.020 (-3.499)***
R-squared number of observation
0.479 92
0.631 88
0.615 88
0.695 86
Figures in brackets indicate t-statistics
*** refers to significance at the 1 per cent level; ** refers to significance at the 5 per cent level. a Statistical significance in Table I is reflected in the so-called t-statistics, which indicate the significance of the relevant parameters. If, for instance, the parameter belonging to the variable export concentration is significant at the 1 per cent level, this indicates that the probability of export concentration having no impact on terms of trade volatility is less or equal to 1 per cent. b The fit of the regression is given by the R-square in Table I. For Regression I the R-square is equal to 0.479 which indicates that 47.9 per cent of the cross-country variation in terms of trade volatility is explained by the variation in the independent variables used in the regression. c Also obtained from UNCTAD statistics. d Including GDP per capita has a similar effect. GDP per capita has the expected negative sign and is significant at the 5 per cent level. The microstate dummy remains negative and insignificant. The R-square in this regression is 0.654 and thus lower than the R-square of Regression IV.
12
When approaching the relationship between terms of trade volatility in a different way, it becomes clear that the conclusion in the Easterly and Kraay (2000) paper does indeed not seem to be justified. In order to show this a regression is run that is similar to the one in their paper (Regression I). The results of this regression are compared with those of a regression that includes a measure for export concentration as an independent variable (Regression II and III).
The results are reported in Box 1 and indicate that un-weighted terms of trade volatility is higher in countries characterized by higher export concentration.10 This relationship is stronger if exports are concentrated in products that suffer from high price volatility, like commodities and oil. Being a microstate has an attenuating effect on terms of trade instability, but only after having controlled for export concentration and the role of oil and commodities in exports. Given that many microstates have highly concentrated exports and that those exports are often concentrated in commodities, their concern about a lack of diversification is entirely justified.
Two other aspects should be taken into account when evaluating the result on microstates. First of all in Regression II only seven observations refer to states with a population smaller than 1.5 million. This is because reliable terms of trade data are available for very few microstates. The seven relevant observations include two OECD countries: Iceland and Luxembourg.11 This may be one of the reasons why the microstate variable turns
10 See Parris (2003) for similar results. 11 The other countries are: Gabon, the Gambia, Guyana, Mauritius and Trinidad and Tobago.
insignificant if other variables, like a measure for political stability, are included.
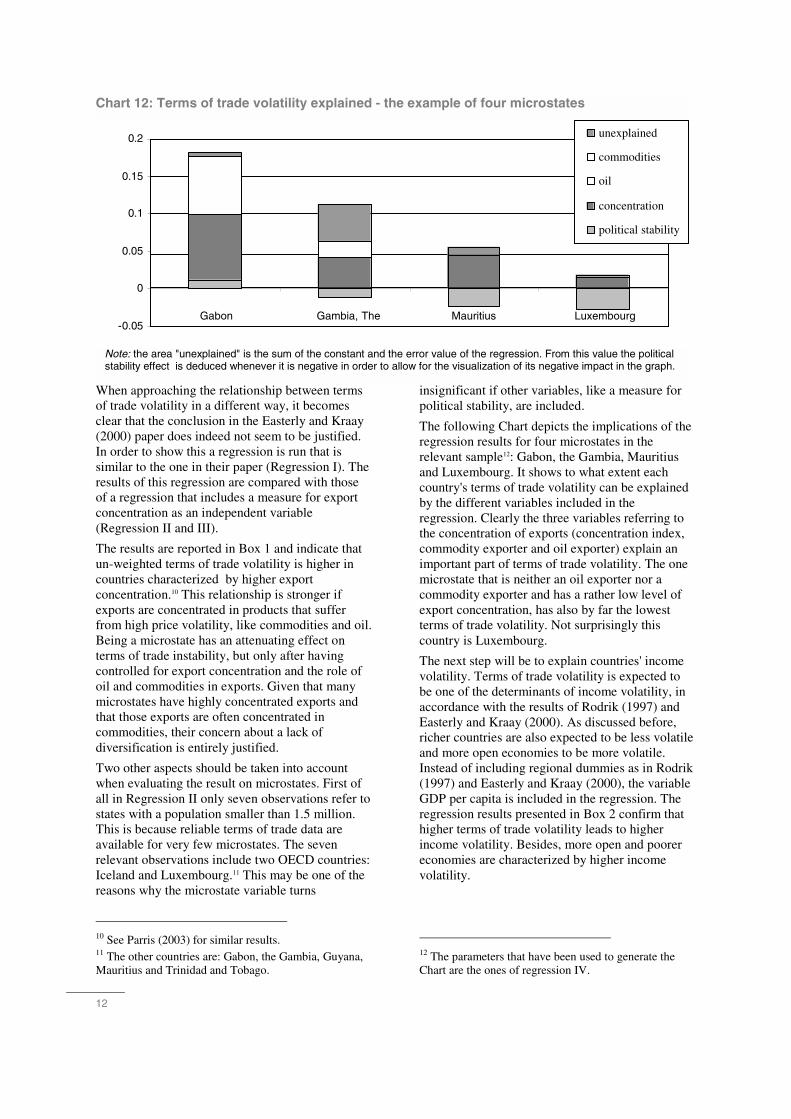
The following Chart depicts the implications of the regression results for four microstates in the relevant sample12: Gabon, the Gambia, Mauritius and Luxembourg. It shows to what extent each country's terms of trade volatility can be explained by the different variables included in the regression. Clearly the three variables referring to the concentration of exports (concentration index, commodity exporter and oil exporter) explain an important part of terms of trade volatility. The one microstate that is neither an oil exporter nor a commodity exporter and has a rather low level of export concentration, has also by far the lowest terms of trade volatility. Not surprisingly this country is Luxembourg.
The next step will be to explain countries' income volatility. Terms of trade volatility is expected to be one of the determinants of income volatility, in accordance with the results of Rodrik (1997) and Easterly and Kraay (2000). As discussed before, richer countries are also expected to be less volatile and more open economies to be more volatile. Instead of including regional dummies as in Rodrik (1997) and Easterly and Kraay (2000), the variable GDP per capita is included in the regression. The regression results presented in Box 2 confirm that higher terms of trade volatility leads to higher income volatility. Besides, more open and poorer economies are characterized by higher income volatility.
12 The parameters that have been used to generate the Chart are the ones of regression IV.
Note: the area "unexplained" is the sum of the constant and the error value of the regression. From this value the political stability effect is deduced whenever it is negative in order to allow for the visualization of its negative impact in the graph.
Chart 12: Terms of trade volatility explained - the example of four microstates
-0.05
0
0.05
0.1
0.15
0.2
Gabon Gambia, The Mauritius Luxembourg
unexplained
commodities
oil
concentration
political stability
13
Box 2: Determinants of income volatility - regression results
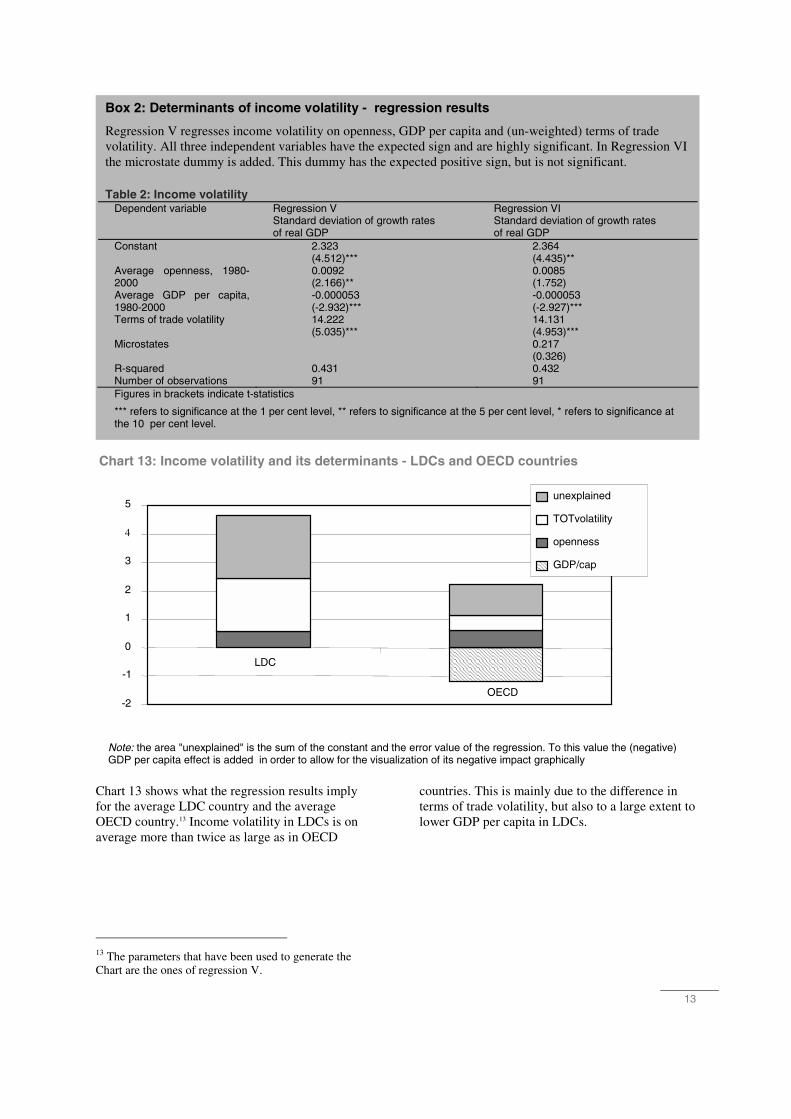
Regression V regresses income volatility on openness, GDP per capita and (un-weighted) terms of trade volatility. All three independent variables have the expected sign and are highly significant. In Regression VI the microstate dummy is added. This dummy has the expected positive sign, but is not significant.
Table 2: Income volatility Dependent variable Regression V
Standard deviation of growth rates of real GDP
Regression VI Standard deviation of growth rates of real GDP
Constant 2.323 (4.512)***
2.364 (4.435)**
Average openness, 1980-2000
0.0092 (2.166)**
0.0085 (1.752)
Average GDP per capita, 1980-2000
-0.000053 (-2.932)***
-0.000053 (-2.927)***
Terms of trade volatility 14.222 (5.035)***
14.131 (4.953)***
Microstates 0.217 (0.326)
R-squared 0.431 0.432 Number of observations 91 91 Figures in brackets indicate t-statistics
*** refers to significance at the 1 per cent level, ** refers to significance at the 5 per cent level, * refers to significance at the 10 per cent level.
Chart 13: Income volatility and its determinants - LDCs and OECD countries
-2
-1
0
1
2
3
4
5
LDC
OECD
unexplained
TOTvolatility
openness
GDP/cap
Note: the area "unexplained" is the sum of the constant and the error value of the regression. To this value the (negative) GDP per capita effect is added in order to allow for the visualization of its negative impact graphically
Chart 13 shows what the regression results imply for the average LDC country and the average OECD country.13 Income volatility in LDCs is on average more than twice as large as in OECD
13 The parameters that have been used to generate the Chart are the ones of regression V.
countries. This is mainly due to the difference in terms of trade volatility, but also to a large extent to lower GDP per capita in LDCs.
14
V. CONCLUSIONS
This paper has shown that smaller economies tend to be characterized by both higher openness and higher export concentration. These findings have previously been pointed out in the literature and reflect that smaller economies are limited in their possibilities to diversify production. Therefore they have to rely more on imports than their larger counterparts in order to satisfy domestic demand and they experience more difficulties in diversifying their export structure. Smaller economies are also characterized by larger income volatility. The paper has also shown that poor economies, in particular LDCs, are like small economies in that they are characterized by high concentration on the export side. Income volatility in LDCs is intriguingly similar to that in small economies. LDCs are on average, however, significantly less open than small economies. This raises the question whether and to which extent the three variables – income volatility, openness and export concentration are linked.
The econometric analysis presented in this paper has shown that export concentration has a positive and significant effect on terms of trade volatility.
This effect is increased if exports are concentrated in commodities, including oil, that are characterized by high price volatility. In other words, the more concentrated are the exports, the more volatile a country's terms of trade are likely to be, in particular if exports are concentrated in commodities.
Terms of trade volatility, in turn, affects income volatility positively and so does openness. High income volatility in small economies can thus be explained by their high level of openness and their lack of export diversification. GDP per capita has a significantly negative effect on income volatility. This may explain why particularly poor economies, like LDCs, are also characterized by high income volatility, even though they do not tend to be characterized by particularly high levels of openness. Empirical growth literature has shown that income volatility is bad for economic growth. Small economies and LDCs would therefore both benefit from further diversification of their exports. The latter may not be straightforward in certain microstates, where the possibilities to diversify production are limited by their smallness.
15
VI. REFERENCES
Alesina, A. and E. Spolaore (1997), "On the Number and Size of Nations." Quarterly Journal of Economics. November 1997.
Aizenmann, J. and N. Marion (1999), Volatility and Investment: Interpreting Evidence from Developing Countries, Economica 66: 157-181.
Armstrong, H.W., R.J. de Kervenoael, X. Li and R. Read (1998), "A Comparison of the Economic Performance of Different Micro-states, and Between Micro-states and Larger Countries", World Development, 26(4):639-56.
Brautigam, D. and M. Woolcock (2001), "Small States in a Global Economy", WIDER Discussion Paper 2001/37.
Collier, P. and D. Dollar (1999), "Aid, Risk and Special Concerns of Small States", paper presented at the Conference on Small States, Saint Lucia, 17-19 February.
Commonwealth Secretariat/World Bank Joint Task Force (2000), "Small States: Meeting Challenges in the Global Economy", report of the Commonwealth Secretariat, Commonwealth Secretariat/World Bank Joint Task Force.
Easterly, W. and A. Kraay (2000), "Small States, Small Problems? Income, Growth and Volatility in Small States", World Development 28,11:2013-2027.
Limão, N. and A. Venables (1999), "Infrastructure, Geographical Disadvantage and Transport Costs", World Bank Working Paper 2257, The World Bank, Washington D.C.
Love, J. (1986) 'Commodity Concentration and Export Earnings Instability: A Shift from Cross-section to Time Series Analysis', Journal of Development Economics 24:239-248.
Parris, Brett (2003), "Risky Development: Export Concentration, Foreign Investment and Policy Conditionality", World Vision Australia, Fox Milne: International Advocacy Office of World Vision International.
Radelet, S. and J. Sachs (1998), "Shipping Costs, Manufactured Exports and Economic Growth" mimeo, Harvard Institute for International Development.
Ramey, G. and V. Ramey (1995), "Cross-Country Evidence on the Link between Volatility and Growth", the American Economic Review 85,5:1138-1151.
Rodrik, D. (1997) Has Globalization Gone too Far?, Washington DC: Institute for International Economics.
Srinivasan T.N. (1986), "The Costs and Benefits of Being a Small, Remote, Island, Landlocked or Ministate Economy." World Bank Research Observer, 1(2), 205-218.
Streeten, P. (1993), "The Special Problems of Small Countries", World Development, 21(2):197-202.
Turnovsky, S.J. and P. Chattopadhyay (2003), "Volatility and Growth in Developing Economies: Some Numerical Results and Empirical Evidence", Journal of International Economics 59:267-295.
16
VII. APPENDIX TABLES
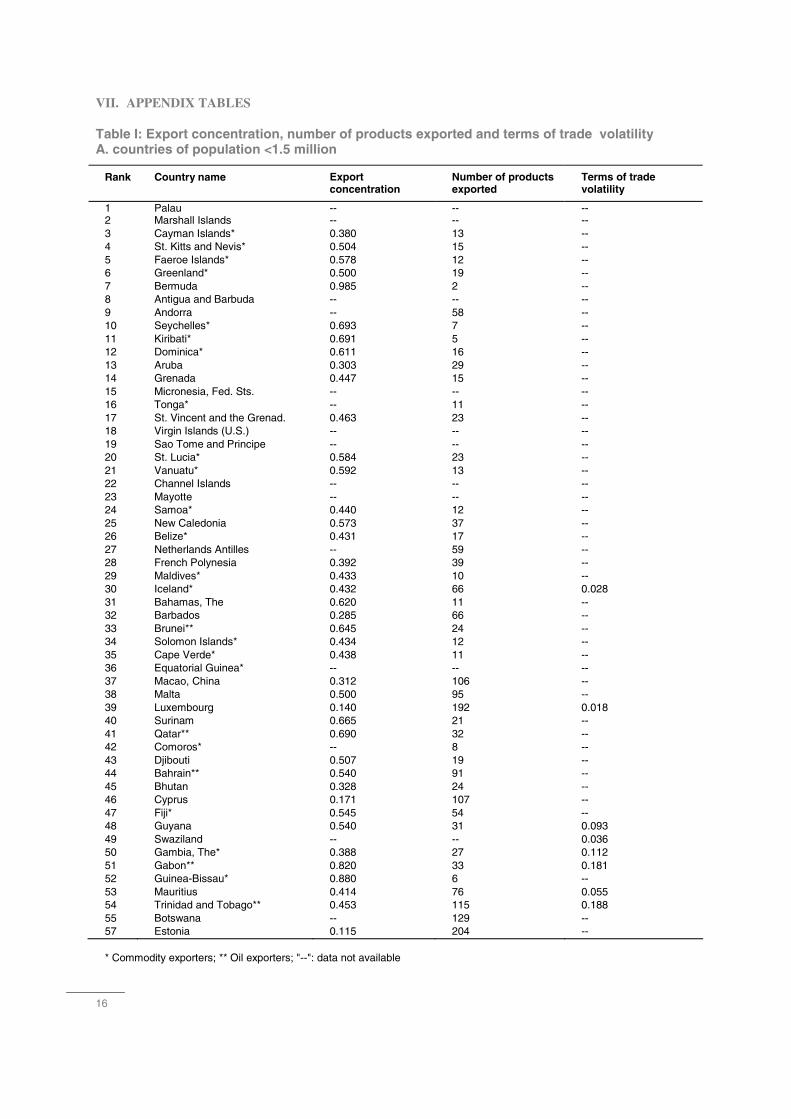
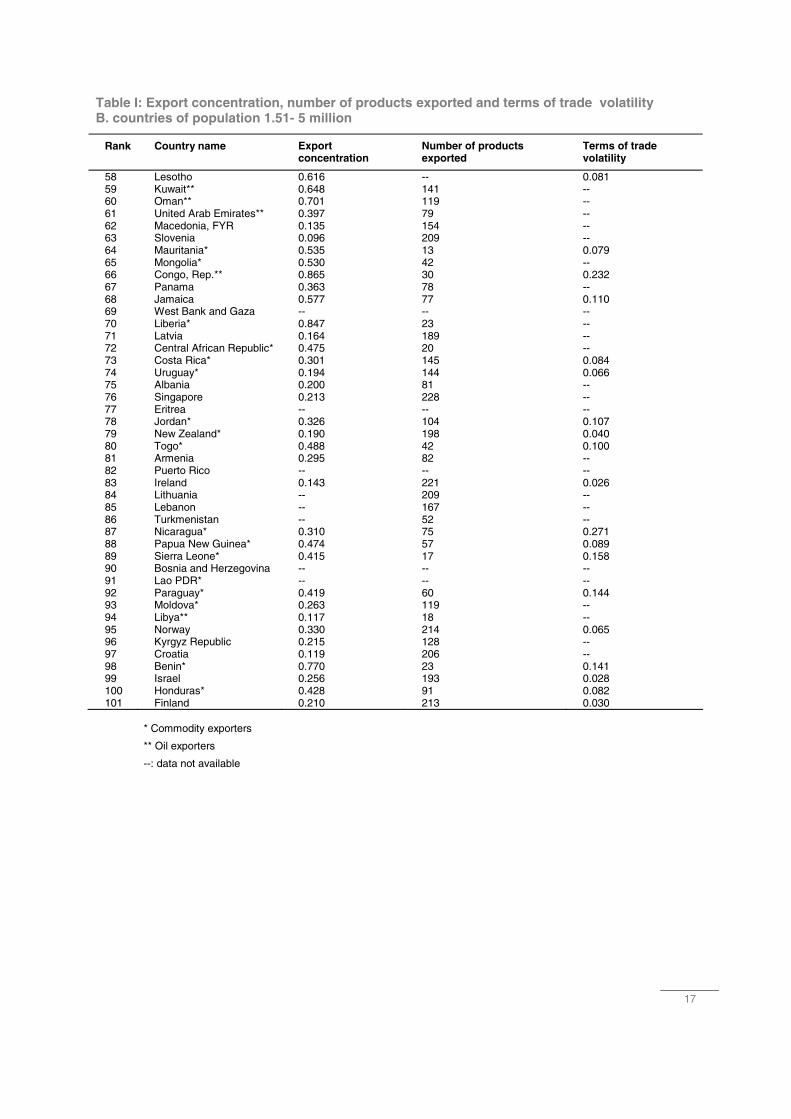
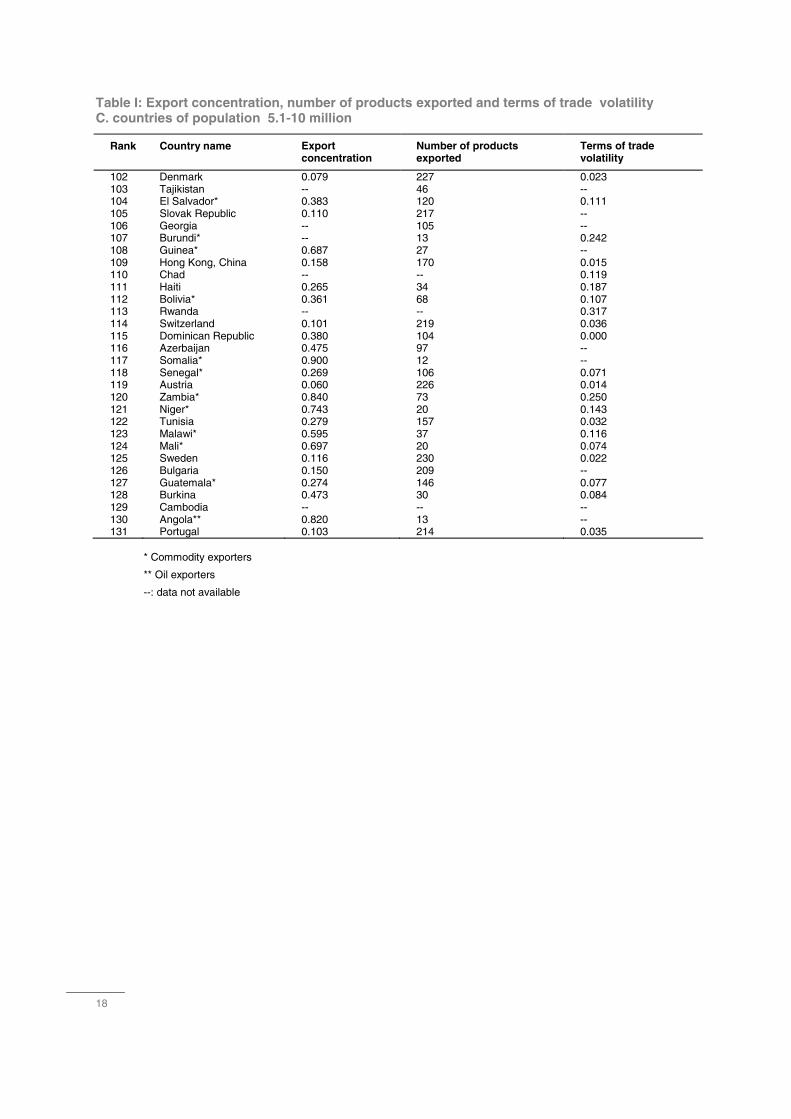
Table I: Export concentration, number of products exported and terms of trade volatility A. countries of population <1.5 million
Rank Country name Export concentration
Number of products exported
Terms of trade volatility
1 Palau -- -- -- 2 Marshall Islands -- -- -- 3 Cayman Islands* 0.380 13 -- 4 St. Kitts and Nevis* 0.504 15 -- 5 Faeroe Islands* 0.578 12 -- 6 Greenland* 0.500 19 -- 7 Bermuda 0.985 2 -- 8 Antigua and Barbuda -- -- -- 9 Andorra -- 58 -- 10 Seychelles* 0.693 7 -- 11 Kiribati* 0.691 5 -- 12 Dominica* 0.611 16 -- 13 Aruba 0.303 29 -- 14 Grenada 0.447 15 -- 15 Micronesia, Fed. Sts. -- -- -- 16 Tonga* -- 11 -- 17 St. Vincent and the Grenad. 0.463 23 -- 18 Virgin Islands (U.S.) -- -- -- 19 Sao Tome and Principe -- -- -- 20 St. Lucia* 0.584 23 -- 21 Vanuatu* 0.592 13 -- 22 Channel Islands -- -- -- 23 Mayotte -- -- -- 24 Samoa* 0.440 12 -- 25 New Caledonia 0.573 37 -- 26 Belize* 0.431 17 -- 27 Netherlands Antilles -- 59 -- 28 French Polynesia 0.392 39 -- 29 Maldives* 0.433 10 -- 30 Iceland* 0.432 66 0.028 31 Bahamas, The 0.620 11 -- 32 Barbados 0.285 66 -- 33 Brunei** 0.645 24 -- 34 Solomon Islands* 0.434 12 -- 35 Cape Verde* 0.438 11 -- 36 Equatorial Guinea* -- -- -- 37 Macao, China 0.312 106 -- 38 Malta 0.500 95 -- 39 Luxembourg 0.140 192 0.018 40 Surinam 0.665 21 -- 41 Qatar** 0.690 32 -- 42 Comoros* -- 8 -- 43 Djibouti 0.507 19 -- 44 Bahrain** 0.540 91 -- 45 Bhutan 0.328 24 -- 46 Cyprus 0.171 107 -- 47 Fiji* 0.545 54 -- 48 Guyana 0.540 31 0.093 49 Swaziland -- -- 0.036 50 Gambia, The* 0.388 27 0.112 51 Gabon** 0.820 33 0.181 52 Guinea-Bissau* 0.880 6 -- 53 Mauritius 0.414 76 0.055 54 Trinidad and Tobago** 0.453 115 0.188 55 Botswana -- 129 -- 57 Estonia 0.115 204 -- * Commodity exporters; ** Oil exporters; "--": data not available
17
Table I: Export concentration, number of products exported and terms of trade volatility B. countries of population 1.51- 5 million
Rank Country name Export concentration
Number of products exported
Terms of trade volatility
58 Lesotho 0.616 -- 0.081 59 Kuwait** 0.648 141 -- 60 Oman** 0.701 119 -- 61 United Arab Emirates** 0.397 79 -- 62 Macedonia, FYR 0.135 154 -- 63 Slovenia 0.096 209 -- 64 Mauritania* 0.535 13 0.079 65 Mongolia* 0.530 42 -- 66 Congo, Rep.** 0.865 30 0.232 67 Panama 0.363 78 -- 68 Jamaica 0.577 77 0.110 69 West Bank and Gaza -- -- -- 70 Liberia* 0.847 23 -- 71 Latvia 0.164 189 -- 72 Central African Republic* 0.475 20 -- 73 Costa Rica* 0.301 145 0.084 74 Uruguay* 0.194 144 0.066 75 Albania 0.200 81 -- 76 Singapore 0.213 228 -- 77 Eritrea -- -- -- 78 Jordan* 0.326 104 0.107 79 New Zealand* 0.190 198 0.040 80 Togo* 0.488 42 0.100 81 Armenia 0.295 82 -- 82 Puerto Rico -- -- -- 83 Ireland 0.143 221 0.026 84 Lithuania -- 209 -- 85 Lebanon -- 167 -- 86 Turkmenistan -- 52 -- 87 Nicaragua* 0.310 75 0.271 88 Papua New Guinea* 0.474 57 0.089 89 Sierra Leone* 0.415 17 0.158 90 Bosnia and Herzegovina -- -- -- 91 Lao PDR* -- -- -- 92 Paraguay* 0.419 60 0.144 93 Moldova* 0.263 119 -- 94 Libya** 0.117 18 -- 95 Norway 0.330 214 0.065 96 Kyrgyz Republic 0.215 128 -- 97 Croatia 0.119 206 -- 98 Benin* 0.770 23 0.141 99 Israel 0.256 193 0.028 100 Honduras* 0.428 91 0.082 101 Finland 0.210 213 0.030 * Commodity exporters
** Oil exporters
--: data not available
18
Table I: Export concentration, number of products exported and terms of trade volatility C. countries of population 5.1-10 million
Rank Country name Export concentration
Number of products exported
Terms of trade volatility
102 Denmark 0.079 227 0.023 103 Tajikistan -- 46 -- 104 El Salvador* 0.383 120 0.111 105 Slovak Republic 0.110 217 -- 106 Georgia -- 105 -- 107 Burundi* -- 13 0.242 108 Guinea* 0.687 27 -- 109 Hong Kong, China 0.158 170 0.015 110 Chad -- -- 0.119 111 Haiti 0.265 34 0.187 112 Bolivia* 0.361 68 0.107 113 Rwanda -- -- 0.317 114 Switzerland 0.101 219 0.036 115 Dominican Republic 0.380 104 0.000 116 Azerbaijan 0.475 97 -- 117 Somalia* 0.900 12 -- 118 Senegal* 0.269 106 0.071 119 Austria 0.060 226 0.014 120 Zambia* 0.840 73 0.250 121 Niger* 0.743 20 0.143 122 Tunisia 0.279 157 0.032 123 Malawi* 0.595 37 0.116 124 Mali* 0.697 20 0.074 125 Sweden 0.116 230 0.022 126 Bulgaria 0.150 209 -- 127 Guatemala* 0.274 146 0.077 128 Burkina 0.473 30 0.084 129 Cambodia -- -- -- 130 Angola** 0.820 13 -- 131 Portugal 0.103 214 0.035
* Commodity exporters
** Oil exporters
--: data not available

19
Table I: Export concentration, number of products exported and terms of trade volatility D. countries of population 10.1-25 million
Rank Country name Export concentration
Number of products exported
Terms of trade volatility
132 Belgium 0.100 234 0.018 133 Zimbabwe* 0.282 167 0.090 134 Belarus 0.105 207 135 Greece 0.120 202 0.030 136 Ecuador 0.471 98 0.126 137 Czech Republic 0.061 227 -- 138 Yugoslavia, Fed. Rep. 0.105 196 -- 139 Hungary 0.224 121 0.022 140 Cuba -- -- -- 141 Cameroon* 0.367 90 0.217 142 Madagascar* 0.346 60 0.078 143 Cote d'Ivoire* 0.378 144 0.150 144 Syrian Arab Republic** 0.508 87 0.149 145 Iraq -- -- -- 146 Yemen, Rep.** 0.797 31 -- 147 Chile* 0.333 179 0.083 148 Mozambique* 0.423 63 -- 149 Netherlands 0.087 233 0.010 150 Ghana 0.420 95 0.156 151 Saudi Arabia** 0.775 149 -- 152 Kazakhstan 0.266 178 -- 153 Uganda* 0.610 72 -- 154 Australia* 0.177 230 0.051 155 Sri Lanka 0.301 115 -- 156 Malaysia 0.220 219 0.052 157 Afghanistan -- -- -- 158 Nepal 0.395 38 0.002 159 Venezuela, RB** 0.595 166 0.230 160 Uzbekistan -- -- -- 161 Peru 0.253 157 0.113 162 Romania* 0.132 190 -- 163 Kenya* 0.312 136 0.096 164 Morocco 0.211 137 0.064 165 Algeria** 0.580 70 0.225
* Commodity exporters
** Oil exporters
--: data not available
20
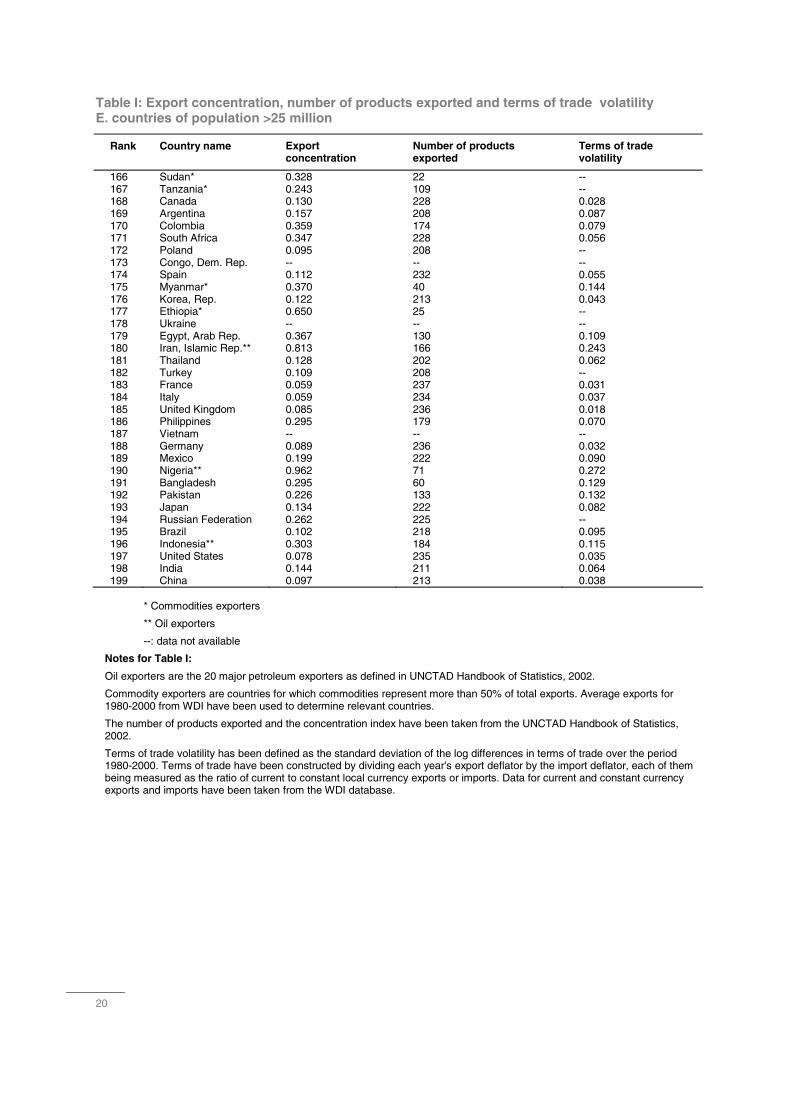
Table I: Export concentration, number of products exported and terms of trade volatility E. countries of population >25 million
Rank Country name Export concentration
Number of products exported
Terms of trade volatility
166 Sudan* 0.328 22 -- 167 Tanzania* 0.243 109 -- 168 Canada 0.130 228 0.028 169 Argentina 0.157 208 0.087 170 Colombia 0.359 174 0.079 171 South Africa 0.347 228 0.056 172 Poland 0.095 208 -- 173 Congo, Dem. Rep. -- -- -- 174 Spain 0.112 232 0.055 175 Myanmar* 0.370 40 0.144 176 Korea, Rep. 0.122 213 0.043 177 Ethiopia* 0.650 25 -- 178 Ukraine -- -- -- 179 Egypt, Arab Rep. 0.367 130 0.109 180 Iran, Islamic Rep.** 0.813 166 0.243 181 Thailand 0.128 202 0.062 182 Turkey 0.109 208 -- 183 France 0.059 237 0.031 184 Italy 0.059 234 0.037 185 United Kingdom 0.085 236 0.018 186 Philippines 0.295 179 0.070 187 Vietnam -- -- -- 188 Germany 0.089 236 0.032 189 Mexico 0.199 222 0.090 190 Nigeria** 0.962 71 0.272 191 Bangladesh 0.295 60 0.129 192 Pakistan 0.226 133 0.132 193 Japan 0.134 222 0.082 194 Russian Federation 0.262 225 -- 195 Brazil 0.102 218 0.095 196 Indonesia** 0.303 184 0.115 197 United States 0.078 235 0.035 198 India 0.144 211 0.064 199 China 0.097 213 0.038
* Commodities exporters
** Oil exporters
--: data not available
Notes for Table I:
Oil exporters are the 20 major petroleum exporters as defined in UNCTAD Handbook of Statistics, 2002.
Commodity exporters are countries for which commodities represent more than 50% of total exports. Average exports for 1980-2000 from WDI have been used to determine relevant countries.
The number of products exported and the concentration index have been taken from the UNCTAD Handbook of Statistics, 2002.
Terms of trade volatility has been defined as the standard deviation of the log differences in terms of trade over the period 1980-2000. Terms of trade have been constructed by dividing each year's export deflator by the import deflator, each of them being measured as the ratio of current to constant local currency exports or imports. Data for current and constant currency exports and imports have been taken from the WDI database.
21
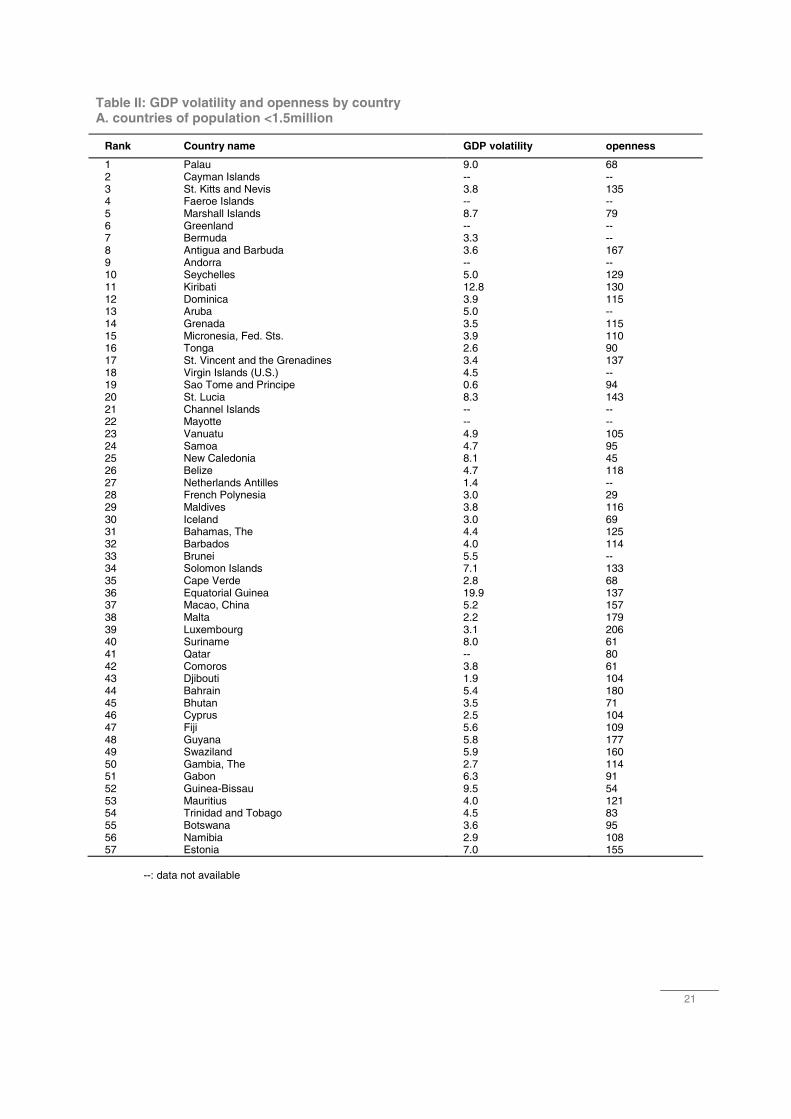
Table II: GDP volatility and openness by country A. countries of population <1.5million
Rank Country name GDP volatility openness
1 Palau 9.0 68 2 Cayman Islands -- -- 3 St. Kitts and Nevis 3.8 135 4 Faeroe Islands -- -- 5 Marshall Islands 8.7 79 6 Greenland -- -- 7 Bermuda 3.3 -- 8 Antigua and Barbuda 3.6 167 9 Andorra -- -- 10 Seychelles 5.0 129 11 Kiribati 12.8 130 12 Dominica 3.9 115 13 Aruba 5.0 -- 14 Grenada 3.5 115 15 Micronesia, Fed. Sts. 3.9 110 16 Tonga 2.6 90 17 St. Vincent and the Grenadines 3.4 137 18 Virgin Islands (U.S.) 4.5 -- 19 Sao Tome and Principe 0.6 94 20 St. Lucia 8.3 143 21 Channel Islands -- -- 22 Mayotte -- -- 23 Vanuatu 4.9 105 24 Samoa 4.7 95 25 New Caledonia 8.1 45 26 Belize 4.7 118 27 Netherlands Antilles 1.4 -- 28 French Polynesia 3.0 29 29 Maldives 3.8 116 30 Iceland 3.0 69 31 Bahamas, The 4.4 125 32 Barbados 4.0 114 33 Brunei 5.5 -- 34 Solomon Islands 7.1 133 35 Cape Verde 2.8 68 36 Equatorial Guinea 19.9 137 37 Macao, China 5.2 157 38 Malta 2.2 179 39 Luxembourg 3.1 206 40 Suriname 8.0 61 41 Qatar -- 80 42 Comoros 3.8 61 43 Djibouti 1.9 104 44 Bahrain 5.4 180 45 Bhutan 3.5 71 46 Cyprus 2.5 104 47 Fiji 5.6 109 48 Guyana 5.8 177 49 Swaziland 5.9 160 50 Gambia, The 2.7 114 51 Gabon 6.3 91 52 Guinea-Bissau 9.5 54 53 Mauritius 4.0 121 54 Trinidad and Tobago 4.5 83 55 Botswana 3.6 95 56 Namibia 2.9 108 57 Estonia 7.0 155 --: data not available
22
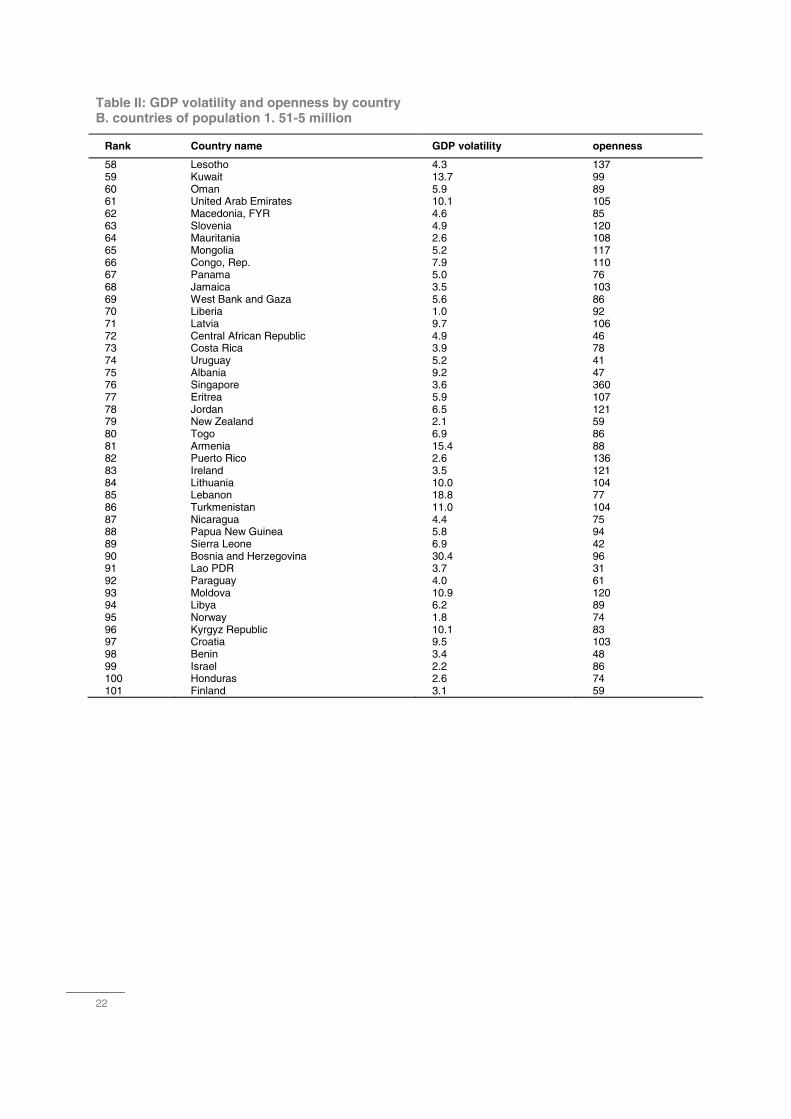
Table II: GDP volatility and openness by country B. countries of population 1. 51-5 million
Rank Country name GDP volatility openness
58 Lesotho 4.3 137 59 Kuwait 13.7 99 60 Oman 5.9 89 61 United Arab Emirates 10.1 105 62 Macedonia, FYR 4.6 85 63 Slovenia 4.9 120 64 Mauritania 2.6 108 65 Mongolia 5.2 117 66 Congo, Rep. 7.9 110 67 Panama 5.0 76 68 Jamaica 3.5 103 69 West Bank and Gaza 5.6 86 70 Liberia 1.0 92 71 Latvia 9.7 106 72 Central African Republic 4.9 46 73 Costa Rica 3.9 78 74 Uruguay 5.2 41 75 Albania 9.2 47 76 Singapore 3.6 360 77 Eritrea 5.9 107 78 Jordan 6.5 121 79 New Zealand 2.1 59 80 Togo 6.9 86 81 Armenia 15.4 88 82 Puerto Rico 2.6 136 83 Ireland 3.5 121 84 Lithuania 10.0 104 85 Lebanon 18.8 77 86 Turkmenistan 11.0 104 87 Nicaragua 4.4 75 88 Papua New Guinea 5.8 94 89 Sierra Leone 6.9 42 90 Bosnia and Herzegovina 30.4 96 91 Lao PDR 3.7 31 92 Paraguay 4.0 61 93 Moldova 10.9 120 94 Libya 6.2 89 95 Norway 1.8 74 96 Kyrgyz Republic 10.1 83 97 Croatia 9.5 103 98 Benin 3.4 48 99 Israel 2.2 86 100 Honduras 2.6 74 101 Finland 3.1 59

23
Table II: GDP volatility and openness by country C. countries of population 5.1-10 million
Rank Country name GDP volatility Openness
102 Denmark 1.8 68
103 Tajikistan 12.1 107
104 El Salvador 5.2 54
105 Slovak Republic 5.6 108
106 Georgia 16.6 84
107 Burundi 5.3 34
108 Guinea 1.5 51
109 Hong Kong, China 4.2 245
110 Chad 8.3 44
111 Haiti 4.4 39
112 Bolivia 3.1 48
113 Rwanda 14.9 31
114 Switzerland 1.7 71
115 Dominican Republic 3.6 62
116 Azerbaijan 12.9 95
117 Somalia 4.9 64
118 Senegal 4.2 68
119 Austria 1.2 77
120 Zambia 3.8 72
121 Niger 5.7 44
122 Tunisia 2.7 85
123 Malawi 5.8 59
124 Mali 4.6 53
125 Sweden 1.9 67
126 Bulgaria 5.9 89
127 Guatemala 2.5 39
128 Burkina Faso 3.7 41
129 Cambodia 3.1 52
130 Angola 7.4 106
131 Portugal 2.2 67
24
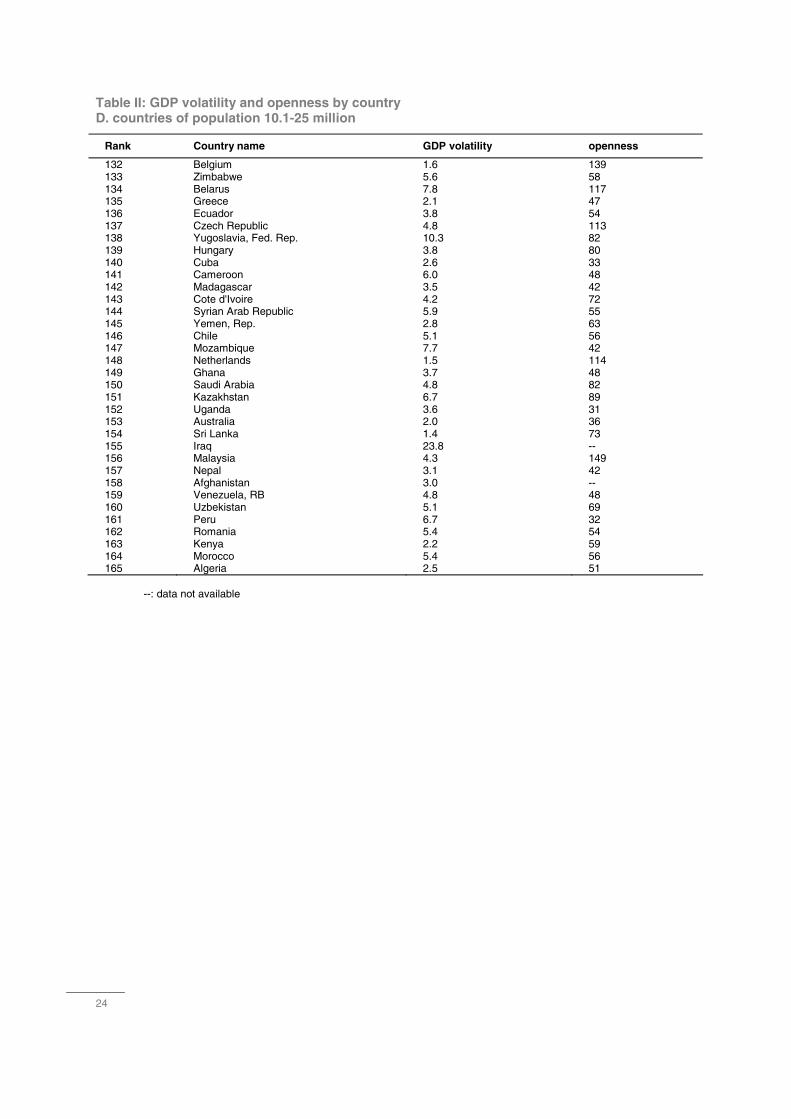
Table II: GDP volatility and openness by country D. countries of population 10.1-25 million
Rank Country name GDP volatility openness
132 Belgium 1.6 139 133 Zimbabwe 5.6 58 134 Belarus 7.8 117 135 Greece 2.1 47 136 Ecuador 3.8 54 137 Czech Republic 4.8 113 138 Yugoslavia, Fed. Rep. 10.3 82 139 Hungary 3.8 80 140 Cuba 2.6 33 141 Cameroon 6.0 48 142 Madagascar 3.5 42 143 Cote d'Ivoire 4.2 72 144 Syrian Arab Republic 5.9 55 145 Yemen, Rep. 2.8 63 146 Chile 5.1 56 147 Mozambique 7.7 42 148 Netherlands 1.5 114 149 Ghana 3.7 48 150 Saudi Arabia 4.8 82 151 Kazakhstan 6.7 89 152 Uganda 3.6 31 153 Australia 2.0 36 154 Sri Lanka 1.4 73 155 Iraq 23.8 -- 156 Malaysia 4.3 149 157 Nepal 3.1 42 158 Afghanistan 3.0 -- 159 Venezuela, RB 4.8 48 160 Uzbekistan 5.1 69 161 Peru 6.7 32 162 Romania 5.4 54 163 Kenya 2.2 59 164 Morocco 5.4 56 165 Algeria 2.5 51 --: data not available

25
Table II: GDP volatility and openness by country E. countries of population > 25 million
Rank Country name GDP volatility openness
166 Sudan 6.1 26 167 Tanzania 1.8 50 168 Canada 2.3 60 169 Argentina 6.0 17 170 Colombia 2.2 32 171 South Africa 3.5 48 172 Poland 4.0 52 173 Congo, Dem. Rep. 5.3 44 174 Spain 1.7 42 175 Myanmar 5.1 9 176 Korea, Rep. 4.3 68 177 Ethiopia 7.6 29 178 Ukraine 8.2 77 179 Egypt, Arab Rep. 2.2 54 180 Iran, Islamic Rep. 6.7 32 181 Thailand 5.1 73 182 Turkey 4.3 37 183 France 1.2 45 184 Italy 1.1 44 185 United Kingdom 2.0 53 186 Philippines 3.8 69 187 Vietnam 2.2 61 188 Germany 1.2 54 189 Mexico 4.0 40 190 Nigeria 5.3 62 191 Bangladesh 1.7 26 192 Pakistan 2.2 36 193 Japan 1.8 21 194 Russian Federation 6.0 56 195 Brazil 3.8 18 196 Indonesia 4.9 53 197 United States 2.0 21 198 India 2.0 20 199 China 3.1 31
Notes for Table II:
Volatility of GDP is computed as the standard deviation of per capita growth rates 1980-2000.
Openness is computed as the sum of imports and exports of goods and services divided by GDP.
The average of the years 1980-2000 is taken and constant 1995 US$ have been used.
All data have been taken from the WDI data base.
26
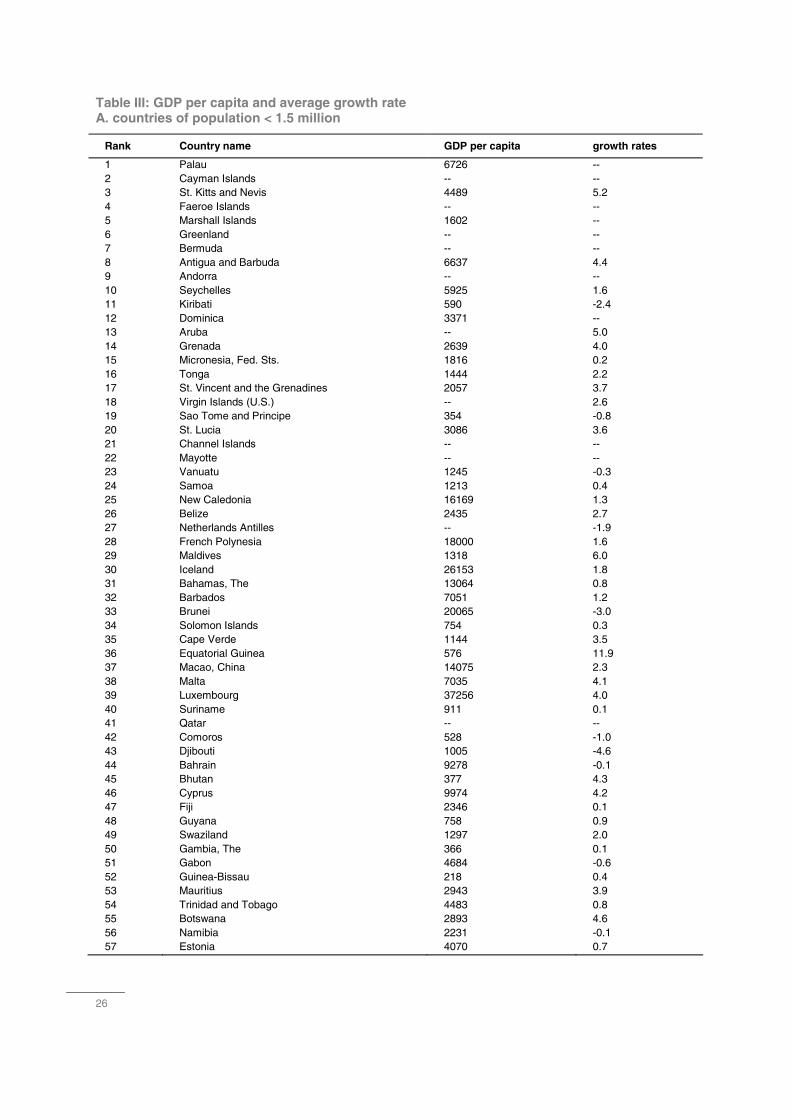
Table III: GDP per capita and average growth rate A. countries of population < 1.5 million
Rank Country name GDP per capita growth rates
1 Palau 6726 -- 2 Cayman Islands -- -- 3 St. Kitts and Nevis 4489 5.2 4 Faeroe Islands -- -- 5 Marshall Islands 1602 -- 6 Greenland -- -- 7 Bermuda -- -- 8 Antigua and Barbuda 6637 4.4 9 Andorra -- -- 10 Seychelles 5925 1.6 11 Kiribati 590 -2.4 12 Dominica 3371 -- 13 Aruba -- 5.0 14 Grenada 2639 4.0 15 Micronesia, Fed. Sts. 1816 0.2 16 Tonga 1444 2.2 17 St. Vincent and the Grenadines 2057 3.7 18 Virgin Islands (U.S.) -- 2.6 19 Sao Tome and Principe 354 -0.8 20 St. Lucia 3086 3.6 21 Channel Islands -- -- 22 Mayotte -- -- 23 Vanuatu 1245 -0.3 24 Samoa 1213 0.4 25 New Caledonia 16169 1.3 26 Belize 2435 2.7 27 Netherlands Antilles -- -1.9 28 French Polynesia 18000 1.6 29 Maldives 1318 6.0 30 Iceland 26153 1.8 31 Bahamas, The 13064 0.8 32 Barbados 7051 1.2 33 Brunei 20065 -3.0 34 Solomon Islands 754 0.3 35 Cape Verde 1144 3.5 36 Equatorial Guinea 576 11.9 37 Macao, China 14075 2.3 38 Malta 7035 4.1 39 Luxembourg 37256 4.0 40 Suriname 911 0.1 41 Qatar -- -- 42 Comoros 528 -1.0 43 Djibouti 1005 -4.6 44 Bahrain 9278 -0.1 45 Bhutan 377 4.3 46 Cyprus 9974 4.2 47 Fiji 2346 0.1 48 Guyana 758 0.9 49 Swaziland 1297 2.0 50 Gambia, The 366 0.1 51 Gabon 4684 -0.6 52 Guinea-Bissau 218 0.4 53 Mauritius 2943 3.9 54 Trinidad and Tobago 4483 0.8 55 Botswana 2893 4.6 56 Namibia 2231 -0.1 57 Estonia 4070 0.7
27
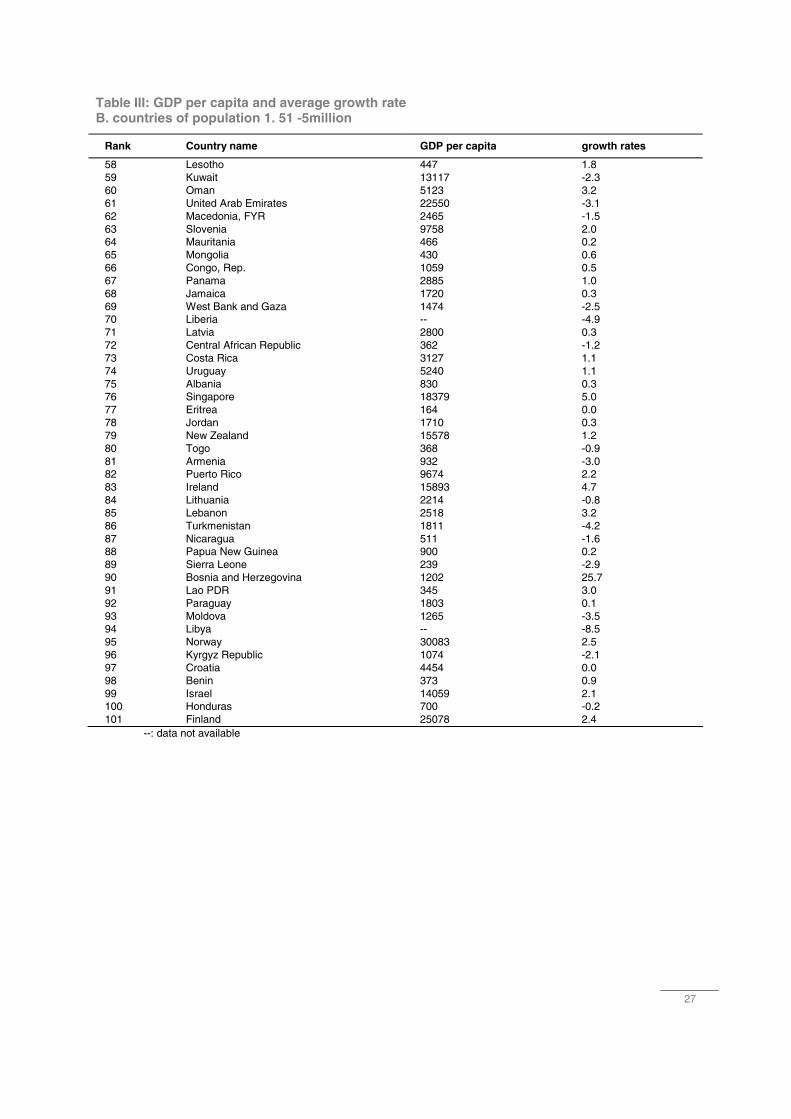
Table III: GDP per capita and average growth rate B. countries of population 1. 51 -5million
Rank Country name GDP per capita growth rates
58 Lesotho 447 1.8 59 Kuwait 13117 -2.3 60 Oman 5123 3.2 61 United Arab Emirates 22550 -3.1 62 Macedonia, FYR 2465 -1.5 63 Slovenia 9758 2.0 64 Mauritania 466 0.2 65 Mongolia 430 0.6 66 Congo, Rep. 1059 0.5 67 Panama 2885 1.0 68 Jamaica 1720 0.3 69 West Bank and Gaza 1474 -2.5 70 Liberia -- -4.9 71 Latvia 2800 0.3 72 Central African Republic 362 -1.2 73 Costa Rica 3127 1.1 74 Uruguay 5240 1.1 75 Albania 830 0.3 76 Singapore 18379 5.0 77 Eritrea 164 0.0 78 Jordan 1710 0.3 79 New Zealand 15578 1.2 80 Togo 368 -0.9 81 Armenia 932 -3.0 82 Puerto Rico 9674 2.2 83 Ireland 15893 4.7 84 Lithuania 2214 -0.8 85 Lebanon 2518 3.2 86 Turkmenistan 1811 -4.2 87 Nicaragua 511 -1.6 88 Papua New Guinea 900 0.2 89 Sierra Leone 239 -2.9 90 Bosnia and Herzegovina 1202 25.7 91 Lao PDR 345 3.0 92 Paraguay 1803 0.1 93 Moldova 1265 -3.5 94 Libya -- -8.5 95 Norway 30083 2.5 96 Kyrgyz Republic 1074 -2.1 97 Croatia 4454 0.0 98 Benin 373 0.9 99 Israel 14059 2.1 100 Honduras 700 -0.2 101 Finland 25078 2.4 --: data not available

28
Table III: GDP per capita and average growth rate C. countries of population 5.1 -10 million
Rank Country name GDP per capita growth rates
102 Denmark 32112 1.6 103 Tajikistan 783 -6.9 104 El Salvador 1492 -0.1 105 Slovak Republic 3767 0.8 106 Georgia 1555 -5.1 107 Burundi 182 -1.0 108 Guinea 550 1.3 109 Hong Kong, China 18307 4.2 110 Chad 216 0.9 111 Haiti 463 -2.0 112 Bolivia 887 -0.4 113 Rwanda 275 -0.3 114 Switzerland 43124 1.0 115 Dominican Republic 1507 2.3 116 Azerbaijan 750 -6.4 117 Somalia -- 0.1 118 Senegal 563 0.3 119 Austria 26938 2.0 120 Zambia 473 -1.8 121 Niger 241 -2.3 122 Tunisia 1910 2.2 123 Malawi 152 0.3 124 Mali 266 -0.5 125 Sweden 26213 1.6 126 Bulgaria 1529 0.8 127 Guatemala 1433 0.0 128 Burkina Faso 211 1.6 129 Cambodia 264 2.2 130 Angola 574 -1.3 131 Portugal 9603 2.9 --: data not available
29
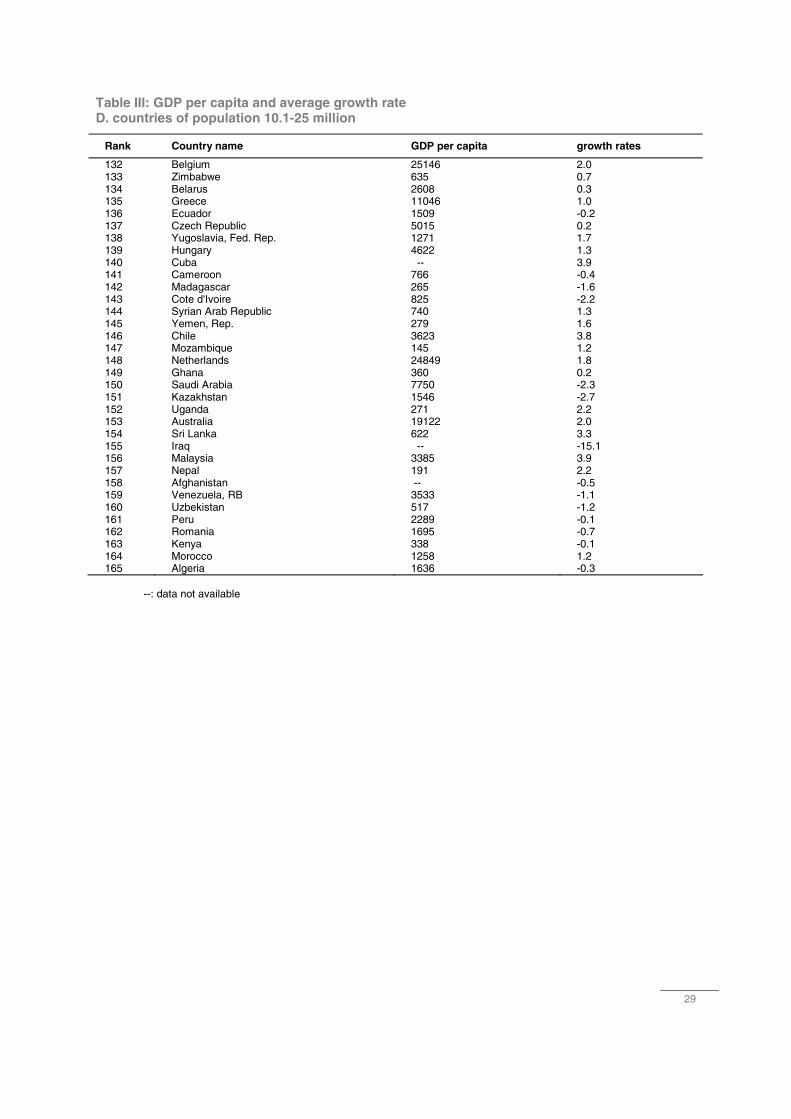
Table III: GDP per capita and average growth rate D. countries of population 10.1-25 million
Rank Country name GDP per capita growth rates
132 Belgium 25146 2.0 133 Zimbabwe 635 0.7 134 Belarus 2608 0.3 135 Greece 11046 1.0 136 Ecuador 1509 -0.2 137 Czech Republic 5015 0.2 138 Yugoslavia, Fed. Rep. 1271 1.7 139 Hungary 4622 1.3 140 Cuba -- 3.9 141 Cameroon 766 -0.4 142 Madagascar 265 -1.6 143 Cote d'Ivoire 825 -2.2 144 Syrian Arab Republic 740 1.3 145 Yemen, Rep. 279 1.6 146 Chile 3623 3.8 147 Mozambique 145 1.2 148 Netherlands 24849 1.8 149 Ghana 360 0.2 150 Saudi Arabia 7750 -2.3 151 Kazakhstan 1546 -2.7 152 Uganda 271 2.2 153 Australia 19122 2.0 154 Sri Lanka 622 3.3 155 Iraq -- -15.1 156 Malaysia 3385 3.9 157 Nepal 191 2.2 158 Afghanistan -- -0.5 159 Venezuela, RB 3533 -1.1 160 Uzbekistan 517 -1.2 161 Peru 2289 -0.1 162 Romania 1695 -0.7 163 Kenya 338 -0.1 164 Morocco 1258 1.2 165 Algeria 1636 -0.3 --: data not available
30
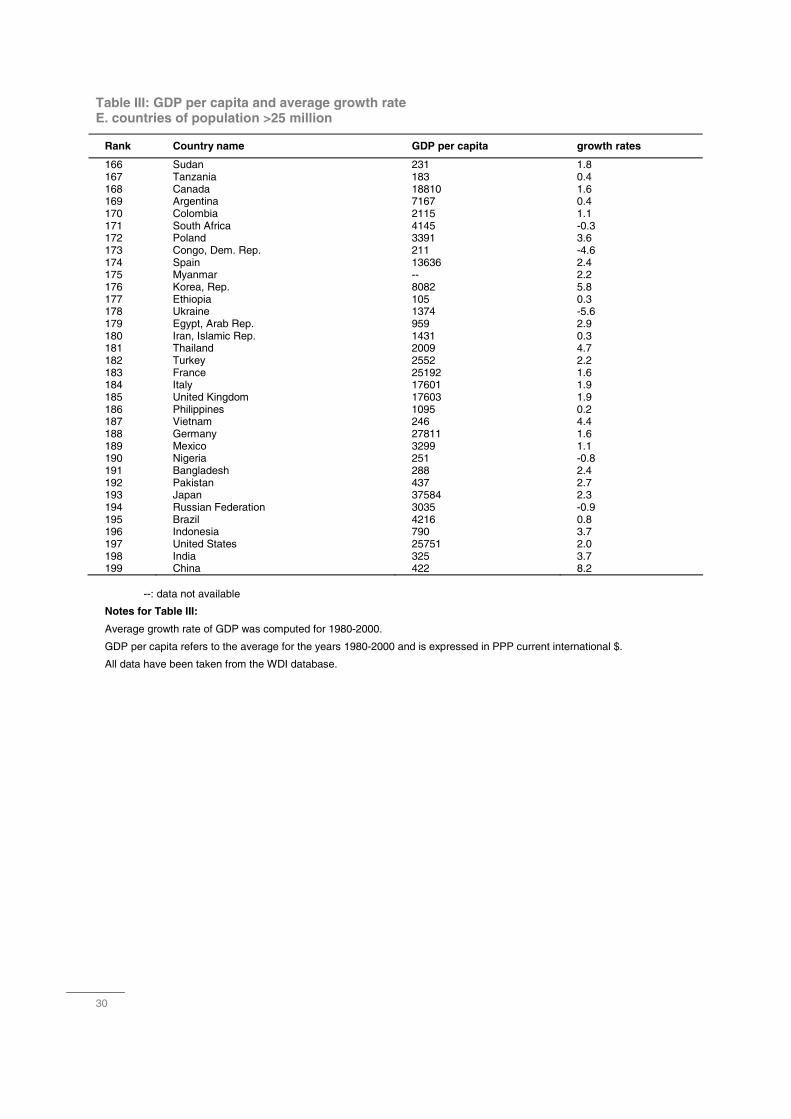
Table III: GDP per capita and average growth rate E. countries of population >25 million
Rank Country name GDP per capita growth rates
166 Sudan 231 1.8 167 Tanzania 183 0.4 168 Canada 18810 1.6 169 Argentina 7167 0.4 170 Colombia 2115 1.1 171 South Africa 4145 -0.3 172 Poland 3391 3.6 173 Congo, Dem. Rep. 211 -4.6 174 Spain 13636 2.4 175 Myanmar -- 2.2 176 Korea, Rep. 8082 5.8 177 Ethiopia 105 0.3 178 Ukraine 1374 -5.6 179 Egypt, Arab Rep. 959 2.9 180 Iran, Islamic Rep. 1431 0.3 181 Thailand 2009 4.7 182 Turkey 2552 2.2 183 France 25192 1.6 184 Italy 17601 1.9 185 United Kingdom 17603 1.9 186 Philippines 1095 0.2 187 Vietnam 246 4.4 188 Germany 27811 1.6 189 Mexico 3299 1.1 190 Nigeria 251 -0.8 191 Bangladesh 288 2.4 192 Pakistan 437 2.7 193 Japan 37584 2.3 194 Russian Federation 3035 -0.9 195 Brazil 4216 0.8 196 Indonesia 790 3.7 197 United States 25751 2.0 198 India 325 3.7 199 China 422 8.2 --: data not available
Notes for Table III:
Average growth rate of GDP was computed for 1980-2000.
GDP per capita refers to the average for the years 1980-2000 and is expressed in PPP current international $.
All data have been taken from the WDI database.
31
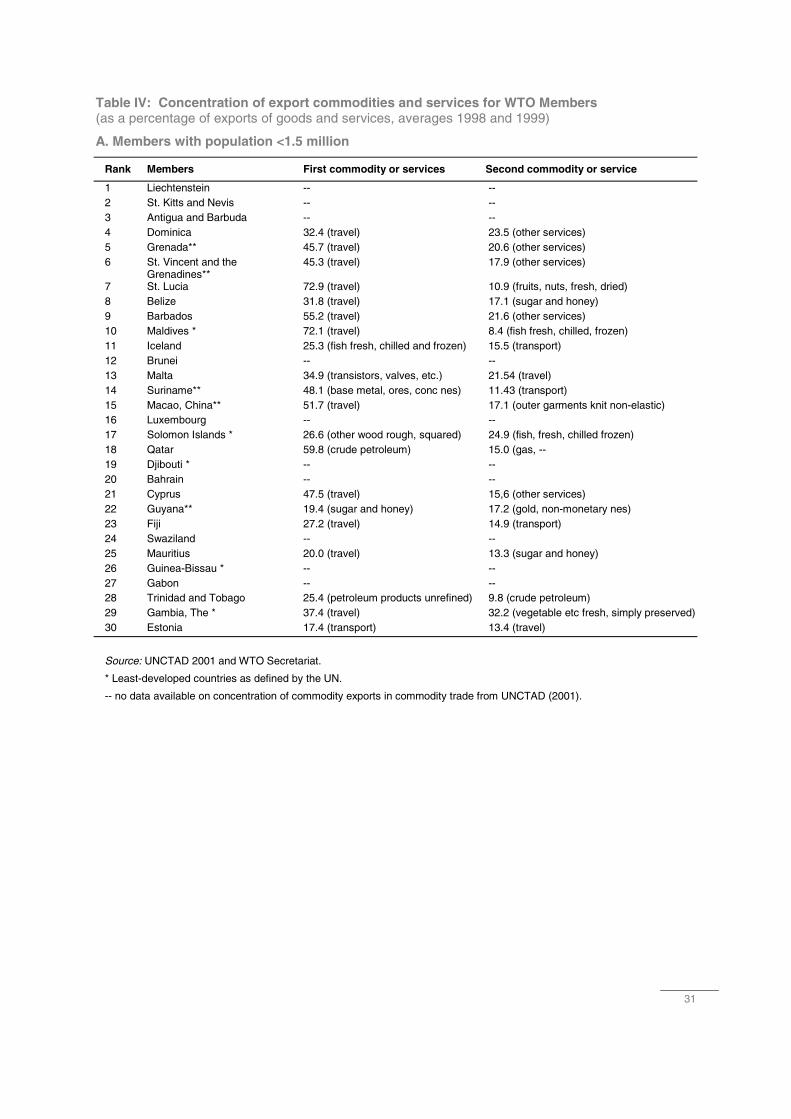
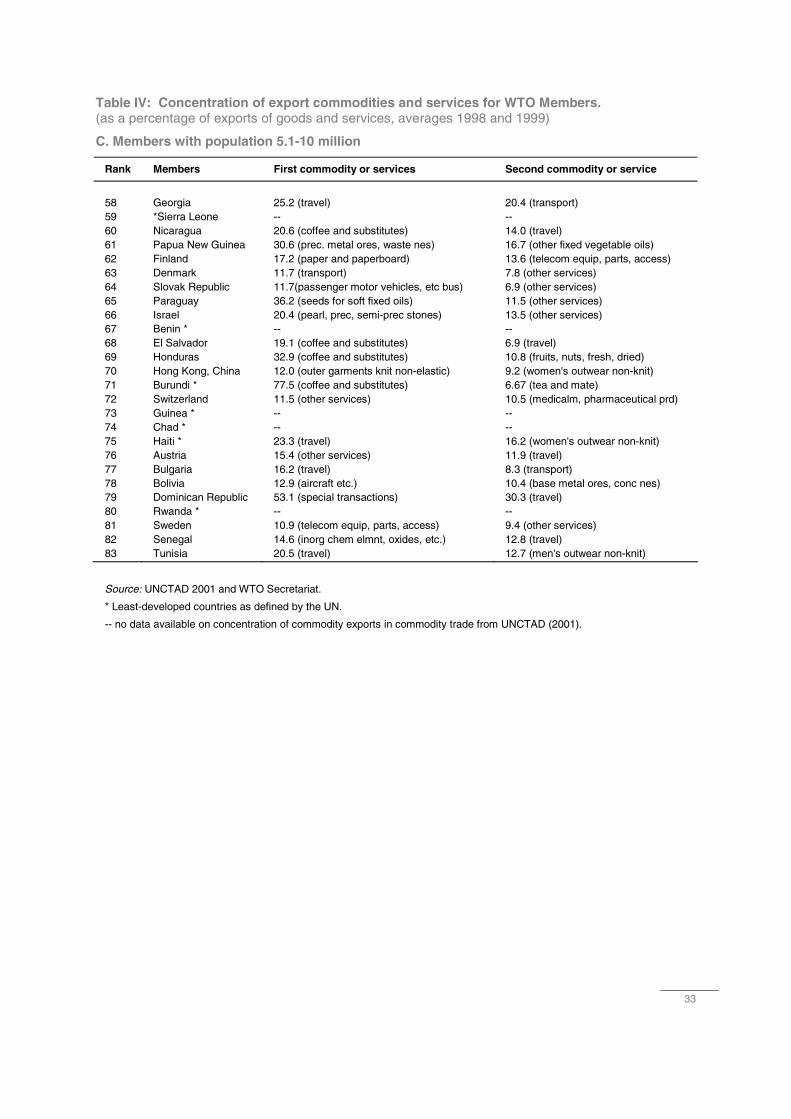
Table IV: Concentration of export commodities and services for WTO Members (as a percentage of exports of goods and services, averages 1998 and 1999)
A. Members with population <1.5 million
Rank Members First commodity or services Second commodity or service
1 Liechtenstein -- -- 2 St. Kitts and Nevis -- -- 3 Antigua and Barbuda -- -- 4 Dominica 32.4 (travel) 23.5 (other services) 5 Grenada** 45.7 (travel) 20.6 (other services) 6 St. Vincent and the
Grenadines** 45.3 (travel) 17.9 (other services)
7 St. Lucia 72.9 (travel) 10.9 (fruits, nuts, fresh, dried) 8 Belize 31.8 (travel) 17.1 (sugar and honey) 9 Barbados 55.2 (travel) 21.6 (other services) 10 Maldives * 72.1 (travel) 8.4 (fish fresh, chilled, frozen) 11 Iceland 25.3 (fish fresh, chilled and frozen) 15.5 (transport) 12 Brunei -- -- 13 Malta 34.9 (transistors, valves, etc.) 21.54 (travel) 14 Suriname** 48.1 (base metal, ores, conc nes) 11.43 (transport) 15 Macao, China** 51.7 (travel) 17.1 (outer garments knit non-elastic) 16 Luxembourg -- -- 17 Solomon Islands * 26.6 (other wood rough, squared) 24.9 (fish, fresh, chilled frozen) 18 Qatar 59.8 (crude petroleum) 15.0 (gas, -- 19 Djibouti * -- -- 20 Bahrain -- -- 21 Cyprus 47.5 (travel) 15,6 (other services) 22 Guyana** 19.4 (sugar and honey) 17.2 (gold, non-monetary nes) 23 Fiji 27.2 (travel) 14.9 (transport) 24 Swaziland -- -- 25 Mauritius 20.0 (travel) 13.3 (sugar and honey) 26 Guinea-Bissau * -- -- 27 Gabon -- -- 28 Trinidad and Tobago 25.4 (petroleum products unrefined) 9.8 (crude petroleum) 29 Gambia, The * 37.4 (travel) 32.2 (vegetable etc fresh, simply preserved) 30 Estonia 17.4 (transport) 13.4 (travel)
Source: UNCTAD 2001 and WTO Secretariat.
* Least-developed countries as defined by the UN.
-- no data available on concentration of commodity exports in commodity trade from UNCTAD (2001).
32
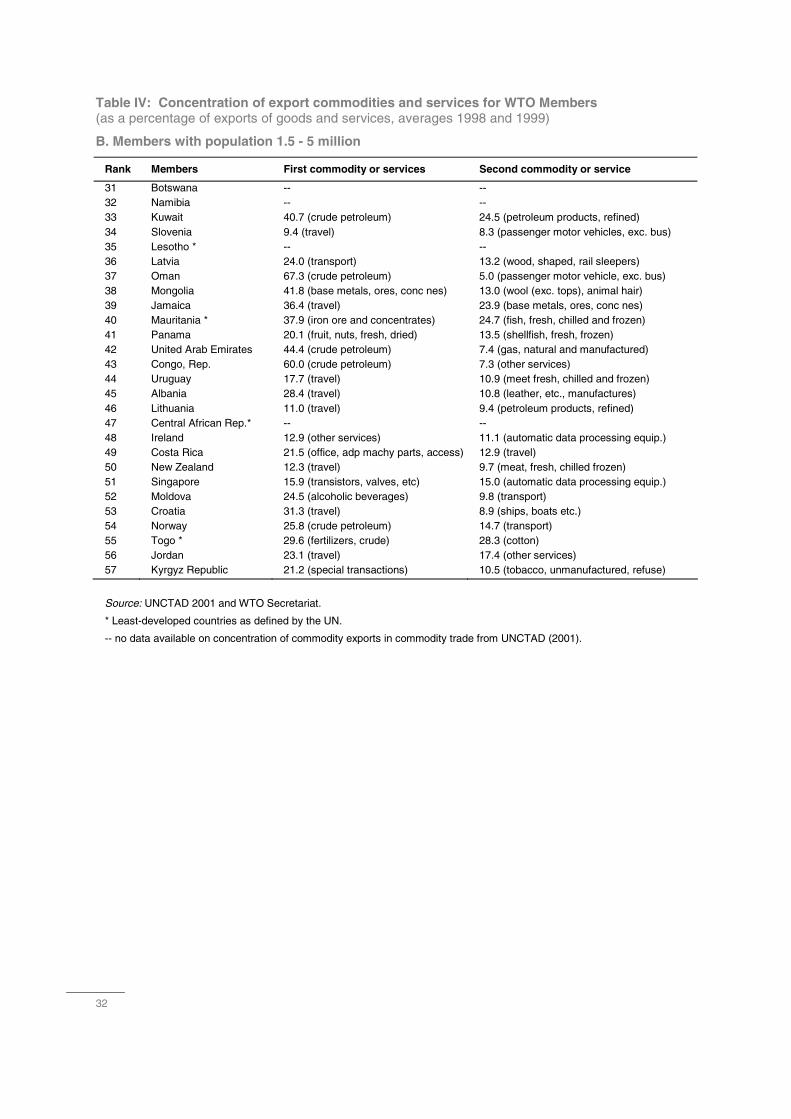
Table IV: Concentration of export commodities and services for WTO Members (as a percentage of exports of goods and services, averages 1998 and 1999)
B. Members with population 1.5 - 5 million
Rank Members First commodity or services Second commodity or service
31 Botswana -- -- 32 Namibia -- -- 33 Kuwait 40.7 (crude petroleum) 24.5 (petroleum products, refined) 34 Slovenia 9.4 (travel) 8.3 (passenger motor vehicles, exc. bus) 35 Lesotho * -- -- 36 Latvia 24.0 (transport) 13.2 (wood, shaped, rail sleepers) 37 Oman 67.3 (crude petroleum) 5.0 (passenger motor vehicle, exc. bus) 38 Mongolia 41.8 (base metals, ores, conc nes) 13.0 (wool (exc. tops), animal hair) 39 Jamaica 36.4 (travel) 23.9 (base metals, ores, conc nes) 40 Mauritania * 37.9 (iron ore and concentrates) 24.7 (fish, fresh, chilled and frozen) 41 Panama 20.1 (fruit, nuts, fresh, dried) 13.5 (shellfish, fresh, frozen) 42 United Arab Emirates 44.4 (crude petroleum) 7.4 (gas, natural and manufactured) 43 Congo, Rep. 60.0 (crude petroleum) 7.3 (other services) 44 Uruguay 17.7 (travel) 10.9 (meet fresh, chilled and frozen) 45 Albania 28.4 (travel) 10.8 (leather, etc., manufactures) 46 Lithuania 11.0 (travel) 9.4 (petroleum products, refined) 47 Central African Rep.* -- -- 48 Ireland 12.9 (other services) 11.1 (automatic data processing equip.) 49 Costa Rica 21.5 (office, adp machy parts, access) 12.9 (travel) 50 New Zealand 12.3 (travel) 9.7 (meat, fresh, chilled frozen) 51 Singapore 15.9 (transistors, valves, etc) 15.0 (automatic data processing equip.) 52 Moldova 24.5 (alcoholic beverages) 9.8 (transport) 53 Croatia 31.3 (travel) 8.9 (ships, boats etc.) 54 Norway 25.8 (crude petroleum) 14.7 (transport) 55 Togo * 29.6 (fertilizers, crude) 28.3 (cotton) 56 Jordan 23.1 (travel) 17.4 (other services) 57 Kyrgyz Republic 21.2 (special transactions) 10.5 (tobacco, unmanufactured, refuse)
Source: UNCTAD 2001 and WTO Secretariat.
* Least-developed countries as defined by the UN.
-- no data available on concentration of commodity exports in commodity trade from UNCTAD (2001).
33
Table IV: Concentration of export commodities and services for WTO Members. (as a percentage of exports of goods and services, averages 1998 and 1999)
C. Members with population 5.1-10 million
Rank Members First commodity or services Second commodity or service
58 Georgia 25.2 (travel) 20.4 (transport) 59 *Sierra Leone -- -- 60 Nicaragua 20.6 (coffee and substitutes) 14.0 (travel) 61 Papua New Guinea 30.6 (prec. metal ores, waste nes) 16.7 (other fixed vegetable oils) 62 Finland 17.2 (paper and paperboard) 13.6 (telecom equip, parts, access) 63 Denmark 11.7 (transport) 7.8 (other services) 64 Slovak Republic 11.7(passenger motor vehicles, etc bus) 6.9 (other services) 65 Paraguay 36.2 (seeds for soft fixed oils) 11.5 (other services) 66 Israel 20.4 (pearl, prec, semi-prec stones) 13.5 (other services) 67 Benin * -- -- 68 El Salvador 19.1 (coffee and substitutes) 6.9 (travel) 69 Honduras 32.9 (coffee and substitutes) 10.8 (fruits, nuts, fresh, dried) 70 Hong Kong, China 12.0 (outer garments knit non-elastic) 9.2 (women's outwear non-knit) 71 Burundi * 77.5 (coffee and substitutes) 6.67 (tea and mate) 72 Switzerland 11.5 (other services) 10.5 (medicalm, pharmaceutical prd) 73 Guinea * -- -- 74 Chad * -- -- 75 Haiti * 23.3 (travel) 16.2 (women's outwear non-knit) 76 Austria 15.4 (other services) 11.9 (travel) 77 Bulgaria 16.2 (travel) 8.3 (transport) 78 Bolivia 12.9 (aircraft etc.) 10.4 (base metal ores, conc nes) 79 Dominican Republic 53.1 (special transactions) 30.3 (travel) 80 Rwanda * -- -- 81 Sweden 10.9 (telecom equip, parts, access) 9.4 (other services) 82 Senegal 14.6 (inorg chem elmnt, oxides, etc.) 12.8 (travel) 83 Tunisia 20.5 (travel) 12.7 (men's outwear non-knit)
Source: UNCTAD 2001 and WTO Secretariat.
* Least-developed countries as defined by the UN.
-- no data available on concentration of commodity exports in commodity trade from UNCTAD (2001).

34
Table IV: Concentration of export commodities and services for WTO Members (as a percentage of exports of goods and services, averages 1998 and 1999)
D. Members with population 10.1-25 million
Rank Members First commodity or services Second commodity or service
84 Portugal 15.7 (travel) 7.8 (passenger motor vehicles exc. bus) 85 Hungary 12.8 (travel) 8.7 (intern combust piston engines) 86 Zambia * -- -- 87 Belgium -- -- 88 Czech Republic 10.2 (travel) 6.7 (other services) 89 Malawi * 58.6 (tobacco unmanufactured,
refuse) 8.6 (tea and mate)
90 Greece 30.9 (travel) 23.8 (other services) 91 Niger * 51.3 (uranium, thorium ores, conc) 11.2 (vegtb etc fresh, simply prsrvd) 92 Mali * 75.7 (cotton) 4.8 (gold, non-monetary nes) 93 Cuba -- -- 94 Burkina Faso * 51.8 (cotton) 9.1 (travel) 95 Guatemala 18.7 (coffee and substitutes) 9.8 (travel) 96 Zimbabwe 22.9 (tobacco unmanufactured,
refuse) 11.8 (travel)
97 Ecuador 21.3 (crude petroleum) 20.8 (fruit, nuts, fresh, dried) 98 Angola * -- -- 99 Cameroon 27.1 (crude petroleum) 9.8 (other wood rough squared) 100 Chile 22.0 (copper) 9.2 (base metal ores, conc nes) 101 Madagascar * 14.7 (other services) 11.5 (travel) 102 Netherlands 9.6 (other services) 8.5 (transport) 103 Cote d'Ivoire 33.3 (cocoa) 10.9 (petroleum products, refined) 104 Mozambique* -- -- 105 Australia 10.6 (travel) 8.5 (coal, lignite and peat) 106 Ghana 32.3 (cocoa) 11.8 (travel) 107 Sri Lanka 14.9 (women's outwear non-knit) 11.5 (tea and mate) 108 Uganda * 41.8 (coffee and substitutes) 21.4 (travel) 109 Taipei, Chinese -- -- 110 Romania 7.9 (women's outwear non-knit) 6.4 (men's outwear non-knit) 111 Malaysia 17.2 (transistors, valves etc) 9.3 (office, adp machy parts acces) 112 Venezuela, RB 60.8 (crude petroleum) 10.4 (petroleum products, refined)
Source: UNCTAD 2001 and WTO Secretariat.
* Least-developed countries as defined by the UN.
-- no data available on concentration of commodity exports in commodity trade from UNCTAD (2001).
35
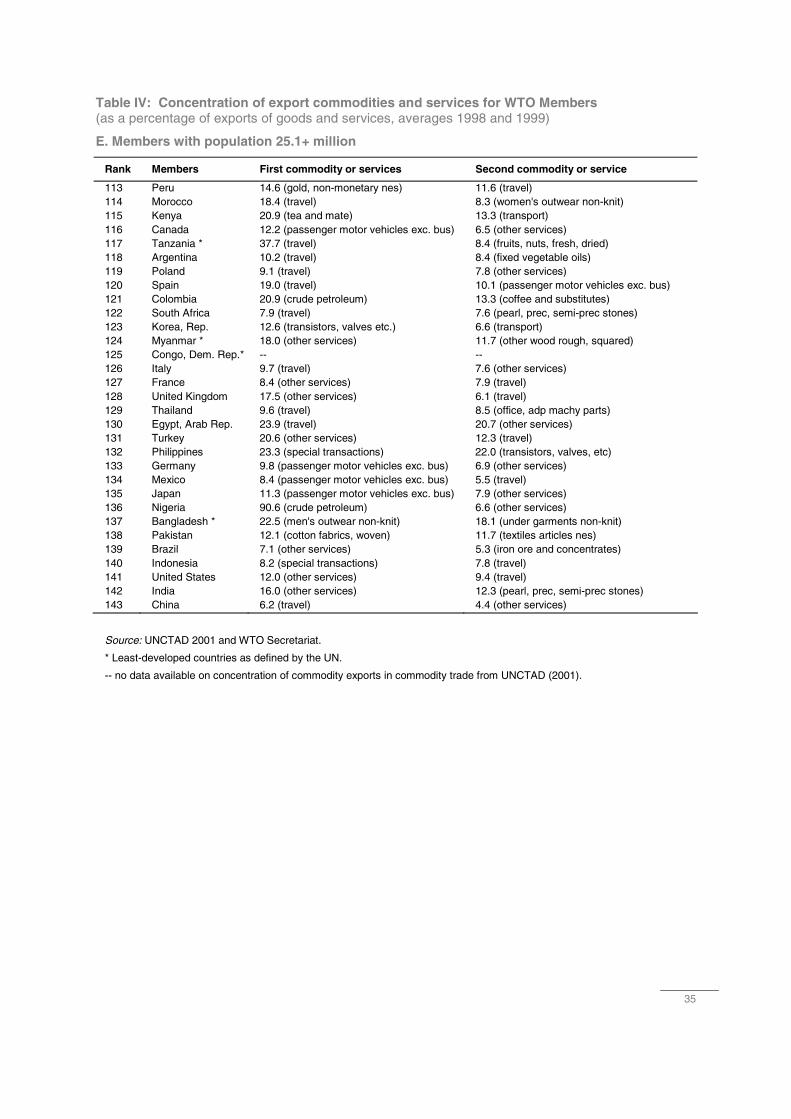
Table IV: Concentration of export commodities and services for WTO Members (as a percentage of exports of goods and services, averages 1998 and 1999)
E. Members with population 25.1+ million
Rank Members First commodity or services Second commodity or service
113 Peru 14.6 (gold, non-monetary nes) 11.6 (travel) 114 Morocco 18.4 (travel) 8.3 (women's outwear non-knit) 115 Kenya 20.9 (tea and mate) 13.3 (transport) 116 Canada 12.2 (passenger motor vehicles exc. bus) 6.5 (other services) 117 Tanzania * 37.7 (travel) 8.4 (fruits, nuts, fresh, dried) 118 Argentina 10.2 (travel) 8.4 (fixed vegetable oils) 119 Poland 9.1 (travel) 7.8 (other services) 120 Spain 19.0 (travel) 10.1 (passenger motor vehicles exc. bus) 121 Colombia 20.9 (crude petroleum) 13.3 (coffee and substitutes) 122 South Africa 7.9 (travel) 7.6 (pearl, prec, semi-prec stones) 123 Korea, Rep. 12.6 (transistors, valves etc.) 6.6 (transport) 124 Myanmar * 18.0 (other services) 11.7 (other wood rough, squared) 125 Congo, Dem. Rep.* -- -- 126 Italy 9.7 (travel) 7.6 (other services) 127 France 8.4 (other services) 7.9 (travel) 128 United Kingdom 17.5 (other services) 6.1 (travel) 129 Thailand 9.6 (travel) 8.5 (office, adp machy parts) 130 Egypt, Arab Rep. 23.9 (travel) 20.7 (other services) 131 Turkey 20.6 (other services) 12.3 (travel) 132 Philippines 23.3 (special transactions) 22.0 (transistors, valves, etc) 133 Germany 9.8 (passenger motor vehicles exc. bus) 6.9 (other services) 134 Mexico 8.4 (passenger motor vehicles exc. bus) 5.5 (travel) 135 Japan 11.3 (passenger motor vehicles exc. bus) 7.9 (other services) 136 Nigeria 90.6 (crude petroleum) 6.6 (other services) 137 Bangladesh * 22.5 (men's outwear non-knit) 18.1 (under garments non-knit) 138 Pakistan 12.1 (cotton fabrics, woven) 11.7 (textiles articles nes) 139 Brazil 7.1 (other services) 5.3 (iron ore and concentrates) 140 Indonesia 8.2 (special transactions) 7.8 (travel) 141 United States 12.0 (other services) 9.4 (travel) 142 India 16.0 (other services) 12.3 (pearl, prec, semi-prec stones) 143 China 6.2 (travel) 4.4 (other services)
Source: UNCTAD 2001 and WTO Secretariat.
* Least-developed countries as defined by the UN.
-- no data available on concentration of commodity exports in commodity trade from UNCTAD (2001).
AlbaniaAngolaAntigua and BarbudaArgentinaArmeniaAustraliaAustriaBahrain, Kingdom ofBangladeshBarbadosBelgiumBelizeBeninBoliviaBotswanaBrazilBrunei DarussalamBulgariaBurkina FasoBurundiCameroonCanadaCentral African RepublicChadChileChinaColombiaCongoCosta RicaCôte d’IvoireCroatiaCubaCyprusCzech RepublicDemocratic Rep. of the CongoDenmarkDjiboutiDominicaDominican RepublicEcuadorEgyptEl SalvadorEstoniaEuropean CommunitiesFijiFinlandFormer Yugoslav Republic of
Macedonia (FYROM)France
GabonThe GambiaGeorgiaGermanyGhanaGreeceGrenadaGuatemalaGuineaGuinea BissauGuyanaHaitiHondurasHong Kong, ChinaHungaryIcelandIndiaIndonesiaIrelandIsraelItalyJamaicaJapanJordanKenyaKorea, Republic ofKuwaitKyrgyz RepublicLatviaLesothoLiechtensteinLithuaniaLuxembourgMacao, ChinaMadagascarMalawiMalaysiaMaldivesMaliMaltaMauritaniaMauritiusMexicoMoldovaMongoliaMoroccoMozambiqueMyanmarNamibia
NetherlandsNew ZealandNicaraguaNigerNigeriaNorwayOmanPakistanPanamaPapua New GuineaParaguayPeruPhilippinesPolandPortugalQatarRomaniaRwandaSt. Kitts and NevisSt. LuciaSt. Vincent & the GrenadinesSenegalSierra LeoneSingaporeSlovak RepublicSloveniaSolomon IslandsSouth AfricaSpainSri LankaSurinameSwazilandSwedenSwitzerlandChinese TaipeiTanzaniaThailandTogoTrinidad and TobagoTunisiaTurkeyUgandaUnited Arab EmiratesUnited KingdomUnited States of AmericaUruguayVenezuelaZambiaZimbabwe
WTO Members(As of 31 August 2003)
This report is also available in French and Spanish (Price : CHF 50.00)
To order, please contact :WTO PublicationsWorld Trade Organization154, rue de LausanneCH-1211 Geneva 21Tel : (41 22) 739 52 08Fax : (41 22) 739 54 58Email : [email protected]
ISSN 1020-4997ISBN 92-870-1235-0Printed in FranceXII-2003-3,000
© World Trade Organization 2003
RECENT WTO PUBLICATIONS
Annual Report 2003
TO ORDER PLEASE CONTACT:WTO Publications, 154, rue de Lausanne, 1211 Geneva 21, SwitzerlandTel: (41 22) 739 52 08 Fax: (41 22) 739 57 92 Email : [email protected] through our On-line bookshop at www.wto.org
ANNUAL REPORT 2003
The Annual Report of the WTO focuses on the regular activities of the organizationand details of its current structure, staff and budget. The Annual Report ispublished in the first half of each year. This is a companion report to the WorldTrade Report and the International Trade Statistics.
June 2003ISBN 92-870-1223-4Price: CHF50
WORLD TRADE REPORT 2003
The focus of this new publication isspecifically on trade policy issues, withspecific chapters dealing with differentaspects of a central theme. It is meant tocomplement the Annual Report on WTOactivities and the annual compilation ofInternational Trade Statistics.
June 2003ISBN 92-870-1230-XPrice: CHF50