exponeringsstudie av eldfast tegel till...
TRANSCRIPT

EN1303
Examensarbete för Civilingenjörsexamen i energiteknik, 30 hp
Exponeringsstudie av eldfast tegel till biomassaförgasare
Exposure studies of refractory materials for biomass gasification
Markus Carlborg
2
Abstract
Gasification is a technology mostly used to convert fossil feedstock to syngas. Biomass could be used
as a feedstock instead but that puts different demands on, among other things, the materials in
these reactors.
In this work, two candidate materials for the inner lining in biomass gasifiers (63 and 85 weight
percent Al2O3) have been exposed to three synthetic ashes, K2CO3-CaCO3-SiO2, K2CO3-CaCO3 and
K2CO3 at 1050°C in CO2 atmosphere for 7 days in a muffle furnace to reproduce analogous chemical
attack that would occur in a real gasifier. Samples were investigated with SEM-EDX for morphological
and compositional effects and with XRD for crystalline phases at chosen distances from the exposed
surface.
A heterogeneous melt that prevented deep penetration of alkali was produced when Si was present
in the ash composition. In the absence of Si, it turned out that only K was affecting the materials. K
attacked the matrix and transported into the material and attacking grains. For the material
containing more alumina potassium was found in continuously decreasing amounts down to 7-8 mm
from the exposed surface. The other material showed a distinct border between affected and
pristine matrix about 5 mm from the exposed surface. The affected part seemed to have been filled
out and signs of expansion could be seen. The XRD analysis of the pristine and exposed refractories
revealed significant differences. In the exposed ceramics the new phases; Leucite, Kalsilite,
Kaliophilite, K(2-x)Al(2-x)SixO4 and Wollastonite were observed.
3
Sammanfattning
Förgasning är en teknik som vanligen används för att konvertera fossila bränslen till syntesgas.
Biomassa kan användas som råvara i stället, men det medför andra krav och förutsättningar på,
bland annat materialen i dessa anläggningar.
I detta arbete har två kandidatmaterial till infodringen i biomassaförgasare (63 och 85 viktprocent
Al2O3) exponerats för tre syntetiska askor, K2CO3-CaCO3-SiO2, K2CO3-CaCO3 och K2CO3 vid 1050°C
under CO2-atmosfär, 7 dagar i en muffelugn för att reproducera kemiska angrepp analogt till de som
skulle uppstå i en verklig förgasare. Proverna undersöktes med SEM-EDX för morfologiska och
sammansättningseffekter och med XRD för formade kristallina faser på utvalda avstånd från den
exponerade ytan.
En heterogen smälta som förhindrade djup penetration av alkali producerades när Si var närvarande i
asksammansättningen. I frånvaro av Si visade det sig att endast K påverkar materialen. K attackerade
matrisen och transporterades in i materialet och angriper korn. För materialet med mer Al2O3
hittades K i kontinuerligt minskande mängder ned till 7-8 mm från den exponerade ytan. Det andra
materialet visade en distinkt gräns mellan angripet och opåverkad matris ca 5 mm från den
exponerade ytan. Den angripna delen tycktes ha fyllts ut och tecken på expansion kunde ses. XRD
analys av oexponerade och exponderade prover avslöjade signifikanta skillnader. I de exponerade
proverna observerades nya faser; leucit, kalsilit, Kaliophilite, K (2-x) Al(2-x) SixO4 och wollastonit.
4
1. INTRODUCTION........................................................................................................................................ 6
1.1. BACKGROUND ............................................................................................................................................ 6
1.2. PURPOSE .................................................................................................................................................. 6
1.3. AIM ......................................................................................................................................................... 6
2. THEORY .................................................................................................................................................... 7
2.1. GIBBS ENERGY ............................................................................................................................................ 7
2.2. DIFFUSION ................................................................................................................................................ 8
2.3. VISCOSITY ................................................................................................................................................. 8
2.4. GASIFICATION ............................................................................................................................................ 9
2.4.1. Entrained down flow gasifiers..................................................................................................... 11
2.4.2. Reactor walls ............................................................................................................................... 11
2.5. CERAMICS ............................................................................................................................................... 12
2.5.1. Crystalline materials ................................................................................................................... 12
2.5.2. Glasses ........................................................................................................................................ 13
2.6. FIREPROOF MATERIALS............................................................................................................................... 13
2.6.1. Refractories ................................................................................................................................. 13
2.6.2. Failure and degradation of refractories ...................................................................................... 14
2.6.3. Some industrial processes where the right refractory material is of importance ....................... 14
2.7. METHODS FOR COMPOSITIONAL, MORPHOLOGICAL AND STRUCTURAL ANALYSIS .................................................... 15
2.7.1. Scanning Electron Microscopy & Energy Dispersive X-ray spectroscopy (SEM-EDX) .................. 15
2.7.2. X-ray diffraction (XRD) ................................................................................................................ 15
3. PREVIOUS WORK ................................................................................................................................... 16
4. EXPERIMENTAL ...................................................................................................................................... 18
4.1. MATERIAL ............................................................................................................................................... 18
4.2. EXPOSURE ............................................................................................................................................... 18
4.3. ANALYSIS OF CUT SAMPLES ......................................................................................................................... 18
4.4. ANALYSIS OF SLICED SAMPLES ...................................................................................................................... 19
5. RESULTS ................................................................................................................................................. 19
5.1. THE MATERIALS ........................................................................................................................................ 19
5.1.1. Vibron .......................................................................................................................................... 19
5.1.2. Victor ........................................................................................................................................... 20
5.2. SURFACE AND MATRIX ............................................................................................................................... 20
5.2.1. Exposure to K2CO3-CaCO3-SiO2 .................................................................................................... 20
5.2.2. Samples exposed to K2CO3-CaCO3 ............................................................................................... 22
5.2.3. Samples exposed to K2CO3 .......................................................................................................... 23
5.3. ATTACK ON GRAINS ................................................................................................................................... 24
5.3.1. Porous grains with more Si than Al ............................................................................................. 24
5.3.2. Grains with about equal amounts of Al and Si ............................................................................ 24
5.3.3. Grains with more Al than Si ........................................................................................................ 26
5.4. SLICED SAMPLES AND XRD RESULTS ............................................................................................................. 27
5.4.1. Vibron exposed to K2CO3-CaCO3-SiO2 (sample Vibron 2) ............................................................. 27
5.4.2. Victor exposed to K2CO3-CaCO3-SiO2 (sample Victor 1) ............................................................... 28
5.4.3. Vibron exposed to K2CO3 (sample Vibron 8) ................................................................................ 29
5.4.4. Victor exposed to K2CO3 (sample Victor 9)d ................................................................................ 29
5
6. DISCUSSION ........................................................................................................................................... 30
6.1. THE MATERIALS ........................................................................................................................................ 30
6.2. SURFACE AND MATRIX ATTACK .................................................................................................................... 30
6.2.1. Samples exposed to K2CO3-CaCO3-SiO2 ....................................................................................... 30
6.2.2. Samples exposed to K2CO3-CaCO3 ............................................................................................... 31
6.2.3. Samples exposed to K2CO3 .......................................................................................................... 32
6.3. ATTACK ON GRAINS ................................................................................................................................... 32
6.3.1. Porous grains with more Si than Al ............................................................................................. 32
6.3.2. Grains with about equal amounts of Al and Si (two layer) ......................................................... 33
6.3.3. Grains with more Al than Si ........................................................................................................ 33
6.4. SLICED SAMPLES ....................................................................................................................................... 33
6.4.1. Vibron exposed to K2CO3-CaCO3-SiO2 (sample Vibron 2) ............................................................. 34
6.4.2. Victor exposed to K2CO3-CaCO3-SiO2 (sample Victor 1) ............................................................... 35
6.4.3. Vibron exposed to K2CO3 (sample Vibron 8) ................................................................................ 35
6.4.4. Victor exposed to K2CO3 (sample Victor 9) .................................................................................. 35
6.5. SUGGESTIONS FOR IMPROVEMENT AND FUTURE USE OF METHOD ....................................................................... 35
7. CONCLUSIONS ........................................................................................................................................ 36
8. ACKNOWLEDGEMENTS .......................................................................................................................... 37
9. REFERENCES ........................................................................................................................................... 37
6
1. Introduction
1.1. Background We are today facing a challenge to change from non-renewable energy sources to more sustainable
ones. Biomass is a source that has high potential; it can for example, be converted into liquid
transportation fuels by a process called gasification. This process requires high temperatures1 and
together with the ash-forming elements in the biomass a very tough environment is created.
Therefore, the materials used to build these devices have to be chosen carefully. Failure of the inner
lining can lead to unplanned production stops and expensive reparation costs. In 2002 the U.S.
Department of Energy ranked improved refractory systems as the number one R&D issue to make
gasification more economically viable.2
Within the strategic energy platform Bio4Energy, at Umeå University, a subproject was started 2011
on the fundamental ash-related reactions, leading to chemical attack of refractory materials used as
the inside lining in pressurized entrained flow gasifiers, for biomass based fuels. The goal is to
develop new knowledge and provide future gasifier manufacturers with guidelines for material
selection for a variety of fuels and fuel mixtures. The work is both theoretical and experimental. In
this particular work, laboratory exposure tests are done with different lining materials in controlled
gas atmosphere and ash compositions. A new experimental method is developed, including surface
preparation followed by SEM-EDX and XRD analysis. The work is part of the research carried out at
the Bio4Energy thermochemical platform at ETPC. There will be possibilities to compare the present
laboratory results with results from ash probe tests at a pilot gasifier at ETC in Piteå3, done in another
B4E project.
In this project, two refractory materials (called Victor and Vibron) will be exposed to an environment
similar to that in an entrained flow gasifier, with respect to oxygen level and temperature. A
synthetic ash composed of elements found in biomass that is anticipated to have big impact on the
refractory materials will be exploited. This treatment of the refractories, are assumed to produce
analogous chemical attacks that would occur inside a real gasifier. Since this work is in an early stage
the focus will be more on to identify what phenomena this will lead to rather than their extent or
speed.
1.2. Purpose The purpose of this project is to develop an experimental method for investigation of chemical attack
on refractory materials.
1.3. Aim The aim of this project is to:
Detect and identify new phases formed from reactions between refractory material and
synthetic ashes in a gasifier environment.
Categorize and explain morphological and compositional changes in the refractory due to
ash-ceramic interactions.
Interpret these results to make statements on the materials service life.
7
2. Theory To better understand this work, some chemical and physical tools and ideas will be provided here.
2.1. Gibbs energy All systems are striving for equilibrium and a system will undergo change as long as it is not reached.
The rate of change may be fast or slow but a system is not said to be completely stable until it has
reached equilibrium.
Gibbs energy is a property that can be used as a tool to determine whether a system is stable or
unstable at certain conditions and in what direction spontaneous reactions will go. It can be shown
from the second law of thermodynamics (increasing entropy) that the direction of spontaneous
reaction is the one for which Gibbs energy is decreasing. Expressed in mathematical form as:
(1)
where G is Gibbs energy and defined as:
(2)
where H is the enthalpy, T is the absolute temperature and S is the entropy. In a system including
different components, the composition of the components becomes a third independent variable
and the differential can be written as:
∑ (
)
(3)
where, V is the volume, P is the pressure and Xi is the mole fraction of component i and the
term (
)
is the chemical potential for component i, µi.
Equilibrium described by Kingery et al4: For a system in equilibrium, all terms in eq. 3 are independent
of time and position. That means uniform temperature (thermal equilibrium), uniform pressure
(mechanical equilibrium) and uniform chemical potential of each component (chemical equilibrium).
Assume a system at constant pressure and temperature where components A and B interacts
as . If a small amount, dR, of A turns into B, then the change in amount of A,
dnA is –dR, and the change for B, dnB is +dR. R is called the extent of reaction.
The reaction Gibbs energy, , is defined as the derivative of Gibbs energy with respect to the
extent of reaction:
(
) (4)
And the corresponding change in Gibbs energy is:
( )
which can be rearranged to
(
) (5)
As seen in eq. 5, the reaction Gibbs energy is the difference in chemical potential between the
components of the system (reactant and product) and since these vary with concentration, so does
8
the reaction Gibbs energy. A system in chemical equilibrium has uniform chemical potential of each
component means that equals zero.5
The text above is describing thermodynamics, and that means that there is no perspective of time
included. Most processes however, have time as an important factor that has to be considered. Even
though a system is striving towards equilibrium, it rarely reaches it. Graphite for example, is the
stable form of coal in standard conditions. This means that diamonds are slowly converted to
graphite, but the rate is so slow it is neglected in everyday life.
2.2. Diffusion Diffusion is the transport of matter from areas of high concentration to areas of lower concentration
by random motion. This motion is caused by collisions between the particles. Transport mechanisms
in a perfect gas can be explained by the kinetic model, which states that in a region of high
concentration of molecules, these are more likely to collide with other molecules and change
direction. If there are fewer molecules to collide with in the new direction, the particle is more likely
to travel a longer distance in this new direction.5 This is leads to a reduction of concentration
gradients. The steady state flow of molecules passing through a unit area normal to the direction of
diffusion per unit time can be described by Fick’s first law of diffusion:
(6)
Where J is the flux, having the unit of mass or moles per square meter second. C is the concentration
per unit volume, x is the direction of diffusion and D is the diffusion coefficient having the unit square
meter per second.Error! Bookmark not defined.,5, For diffusion in solids, it is expressed by:
(7)
Where D0 is the diffusion constant at infinite temperature, Ea is the activation energy for diffusion, R
is the gas constant and T is the temperature.8 It is noted that increased temperature increases the
diffusion constant and thereby increasing the diffusion flux.
2.3. Viscosity Viscosity is the resistance against motions within a fluid i.e. a fluids resistance against flow. This is
caused by collisions and adhesion between molecules in the fluid. Dynamic viscosity, absolute
viscosity and viscosity is different names for the same property and it is measured in N·s/m2 = Pa·s or
Poise (1 Pa·s = 10 P). Sometimes the kinematic viscosity is used, that is the dynamic viscosity divided
by the fluids density and the used unit is m2/s or Stokes (1 m2/s = 10 000 St). The viscosity is sensitive
to temperature, for gases, it is increasing with temperature and for liquids it is decreasing. See Table
1 for examples of the viscosity for some fluids.6
Table 1. Example of viscosity for some fluids.
Species Temperature [°C]
Dynamic viscosity [Pa·s]
Kinematic viscosity [m2/s]
Air 15 1.79·10-5 1.46·10-5 Water 15.6 1.12·10-3 1.12·10-6 Molasses 5-10 Ketchup 50-100
9
2.4. Gasification Pyrolysis, gasification and combustion are closely related processes where carbonaceous feedstock is
broken down at high temperatures. For complete combustion, there are enough oxygen for all
carbon to form CO2 and all hydrogen to form H2O. All stored energy in the fuel is then released as
heat in this process. Pyrolysis is heating of carbonaceous feedstock in absence or low amounts of
oxygen (there are some different views on how it is defined). The feedstock is broken down and
energy is stored in the formed compounds. Gasification lies somewhere in between these processes,
so that the necessary heat is provided by the feedstock itself. The more oxygen that is present, the
more products of complete combustion can be formed and more heat can be released. The rest of
the fuel forms other compounds, storing energy instead of releasing it as heat. An equilibrium
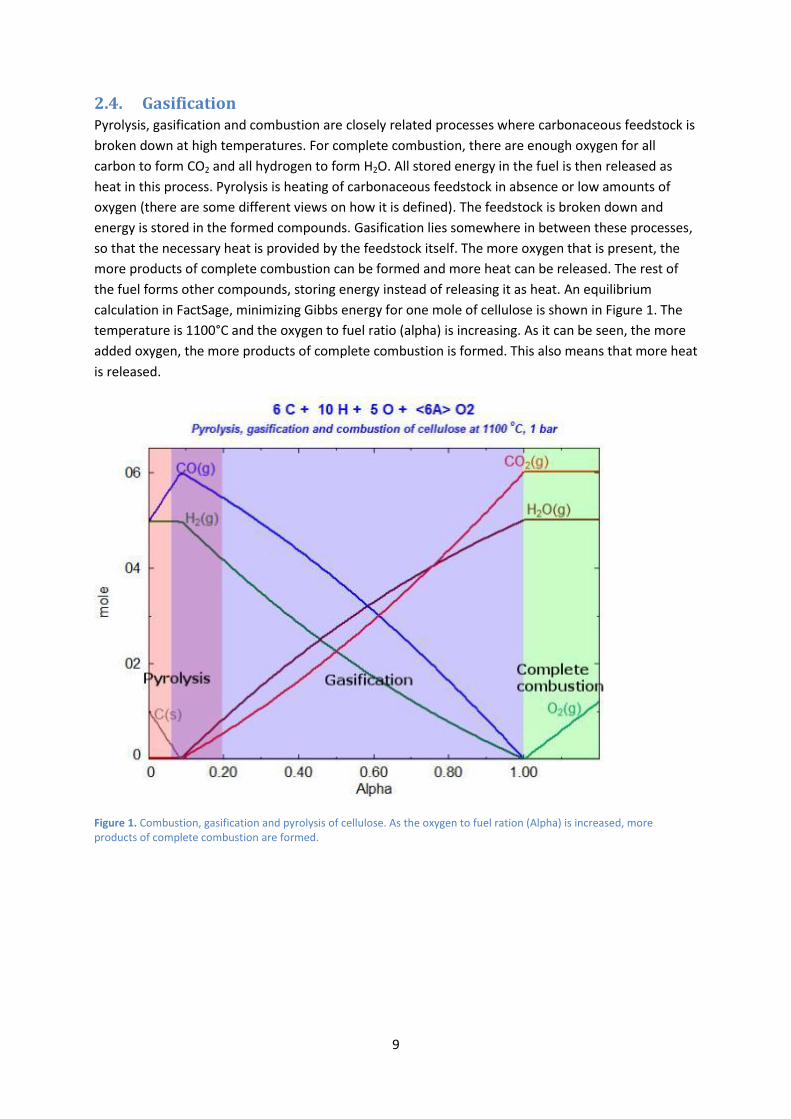
calculation in FactSage, minimizing Gibbs energy for one mole of cellulose is shown in Figure 1. The
temperature is 1100°C and the oxygen to fuel ratio (alpha) is increasing. As it can be seen, the more
added oxygen, the more products of complete combustion is formed. This also means that more heat
is released.
Figure 1. Combustion, gasification and pyrolysis of cellulose. As the oxygen to fuel ration (Alpha) is increased, more products of complete combustion are formed.
10
As it can be seen in Figure 1, the main products at
equilibrium with under-stoichiometric amount of
oxygen is CO and H2, which are the desired products
of gasification, called syngas. Oxygen is a constituent
of cellulose, so even if no oxygen is added to the
process, some will still be present. The stable form of
carbon is solid (graphite) when there is not enough
oxygen to form CO or CO2. There are several
reactions involved to produce syngas, some
producing heat and some consuming heat, see Table
2 for the gasification reactions.
Temperature
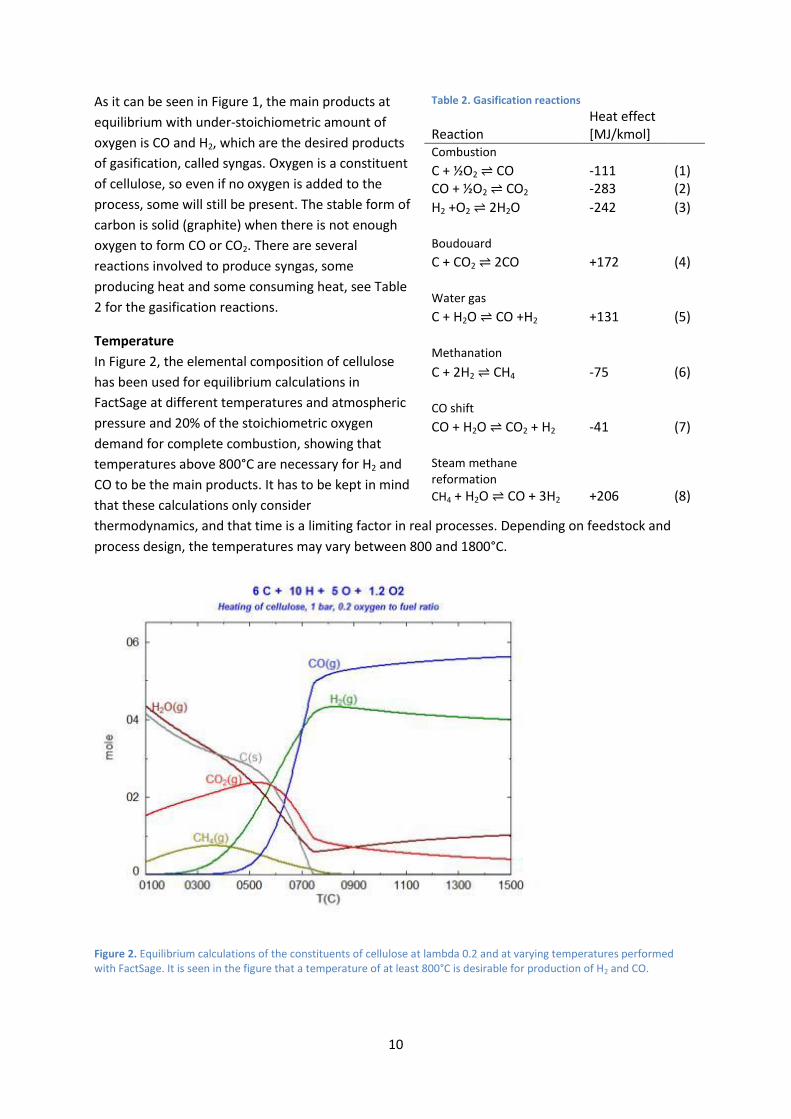
In Figure 2, the elemental composition of cellulose
has been used for equilibrium calculations in
FactSage at different temperatures and atmospheric
pressure and 20% of the stoichiometric oxygen
demand for complete combustion, showing that
temperatures above 800°C are necessary for H2 and
CO to be the main products. It has to be kept in mind
that these calculations only consider
thermodynamics, and that time is a limiting factor in real processes. Depending on feedstock and
process design, the temperatures may vary between 800 and 1800°C.
Figure 2. Equilibrium calculations of the constituents of cellulose at lambda 0.2 and at varying temperatures performed with FactSage. It is seen in the figure that a temperature of at least 800°C is desirable for production of H2 and CO.
Table 2. Gasification reactions
Reaction Heat effect [MJ/kmol]
Combustion C + ½O2 CO -111 (1) CO + ½O2 CO2 -283 (2)
H2 +O2 2H2O -242 (3) Boudouard C + CO2 2CO +172 (4) Water gas C + H2O CO +H2 +131 (5) Methanation
C + 2H2 CH4 -75 (6) CO shift CO + H2O CO2 + H2 -41 (7) Steam methane reformation
CH4 + H2O CO + 3H2 +206 (8)
11
Pressure
Most modern processes are operating at pressures of above 10 bar and up to 100 bar, even though
thermodynamics are suggesting lower pressures for a higher yield of syngas. There are several
practical reasons for this; kinetics, reduced equipment size and savings in compression work of the
produced syngas.
Direct gasification uses the feedstock as fuel to provide the necessary heat. A fraction of the
stoichiometric oxygen demand for complete combustion is added to the process in form of air or
pure oxygen.
At Indirect gasification the heat is provided from an external source.1
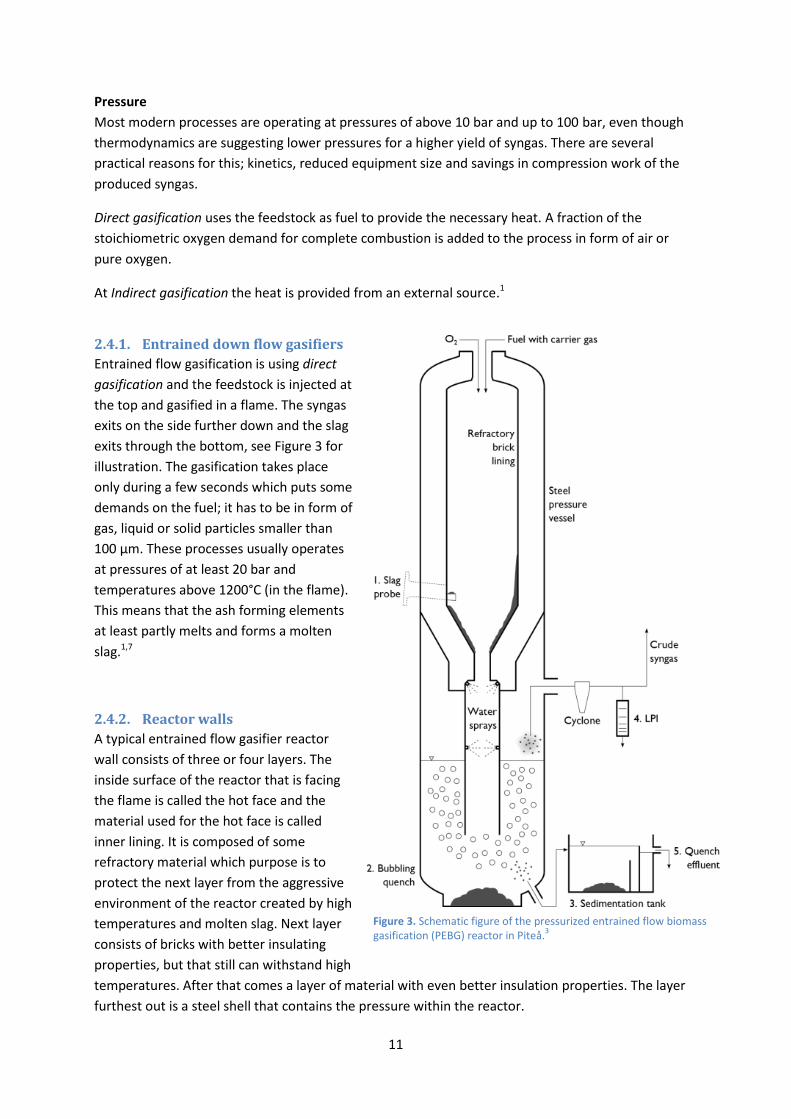
2.4.1. Entrained down flow gasifiers
Entrained flow gasification is using direct
gasification and the feedstock is injected at
the top and gasified in a flame. The syngas
exits on the side further down and the slag
exits through the bottom, see Figure 3 for
illustration. The gasification takes place
only during a few seconds which puts some
demands on the fuel; it has to be in form of
gas, liquid or solid particles smaller than
100 µm. These processes usually operates
at pressures of at least 20 bar and
temperatures above 1200°C (in the flame).
This means that the ash forming elements
at least partly melts and forms a molten
slag.1,7
2.4.2. Reactor walls
A typical entrained flow gasifier reactor
wall consists of three or four layers. The
inside surface of the reactor that is facing
the flame is called the hot face and the
material used for the hot face is called
inner lining. It is composed of some
refractory material which purpose is to
protect the next layer from the aggressive
environment of the reactor created by high
temperatures and molten slag. Next layer
consists of bricks with better insulating
properties, but that still can withstand high
temperatures. After that comes a layer of material with even better insulation properties. The layer
furthest out is a steel shell that contains the pressure within the reactor.
Figure 3. Schematic figure of the pressurized entrained flow biomass gasification (PEBG) reactor in Piteå.
3
12
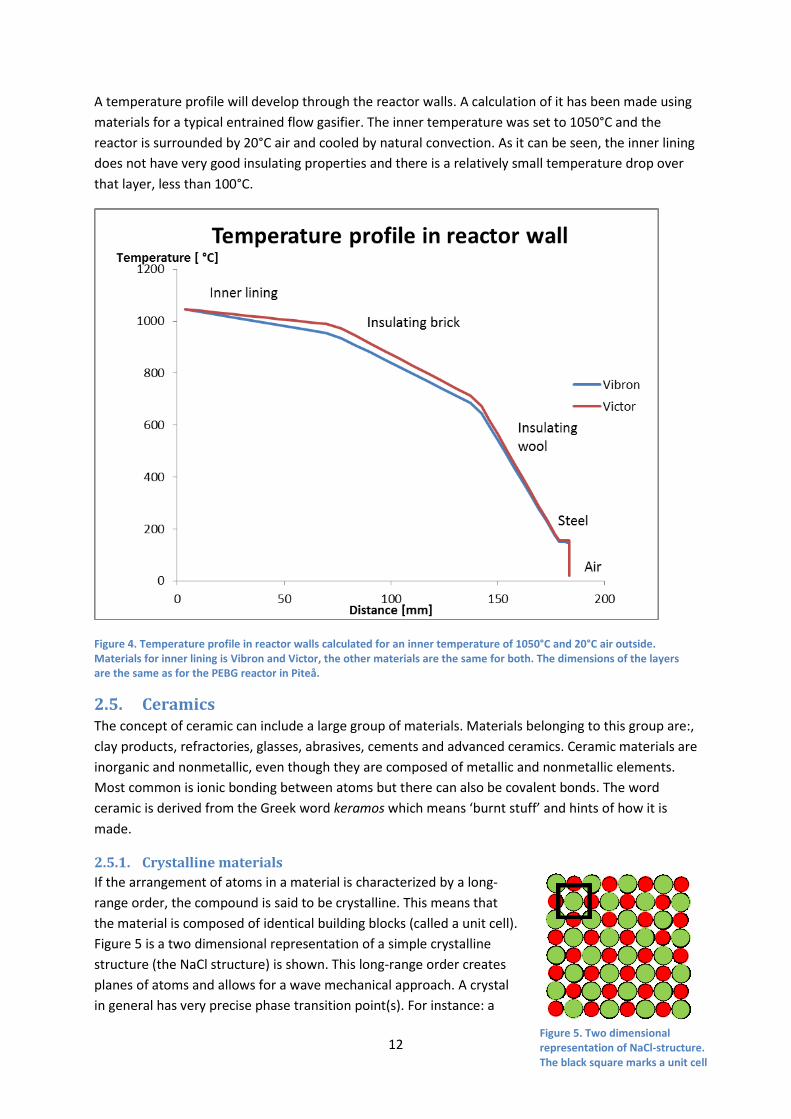
A temperature profile will develop through the reactor walls. A calculation of it has been made using
materials for a typical entrained flow gasifier. The inner temperature was set to 1050°C and the
reactor is surrounded by 20°C air and cooled by natural convection. As it can be seen, the inner lining
does not have very good insulating properties and there is a relatively small temperature drop over
that layer, less than 100°C.
Figure 4. Temperature profile in reactor walls calculated for an inner temperature of 1050°C and 20°C air outside. Materials for inner lining is Vibron and Victor, the other materials are the same for both. The dimensions of the layers are the same as for the PEBG reactor in Piteå.
2.5. Ceramics The concept of ceramic can include a large group of materials. Materials belonging to this group are:,
clay products, refractories, glasses, abrasives, cements and advanced ceramics. Ceramic materials are
inorganic and nonmetallic, even though they are composed of metallic and nonmetallic elements.
Most common is ionic bonding between atoms but there can also be covalent bonds. The word
ceramic is derived from the Greek word keramos which means ‘burnt stuff’ and hints of how it is
made.
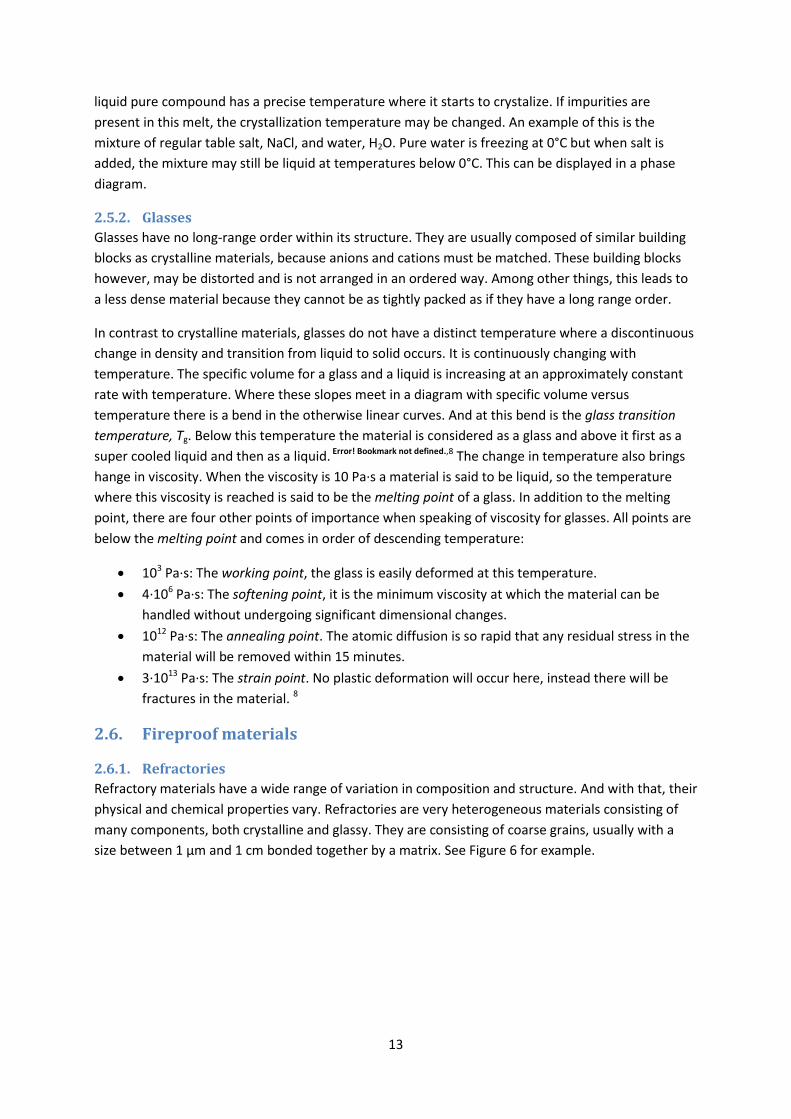
2.5.1. Crystalline materials
If the arrangement of atoms in a material is characterized by a long-
range order, the compound is said to be crystalline. This means that
the material is composed of identical building blocks (called a unit cell).
Figure 5 is a two dimensional representation of a simple crystalline
structure (the NaCl structure) is shown. This long-range order creates
planes of atoms and allows for a wave mechanical approach. A crystal
in general has very precise phase transition point(s). For instance: a
Figure 5. Two dimensional representation of NaCl-structure. The black square marks a unit cell
13
liquid pure compound has a precise temperature where it starts to crystalize. If impurities are
present in this melt, the crystallization temperature may be changed. An example of this is the
mixture of regular table salt, NaCl, and water, H2O. Pure water is freezing at 0°C but when salt is
added, the mixture may still be liquid at temperatures below 0°C. This can be displayed in a phase
diagram.
2.5.2. Glasses
Glasses have no long-range order within its structure. They are usually composed of similar building
blocks as crystalline materials, because anions and cations must be matched. These building blocks
however, may be distorted and is not arranged in an ordered way. Among other things, this leads to
a less dense material because they cannot be as tightly packed as if they have a long range order.
In contrast to crystalline materials, glasses do not have a distinct temperature where a discontinuous
change in density and transition from liquid to solid occurs. It is continuously changing with
temperature. The specific volume for a glass and a liquid is increasing at an approximately constant
rate with temperature. Where these slopes meet in a diagram with specific volume versus
temperature there is a bend in the otherwise linear curves. And at this bend is the glass transition
temperature, Tg. Below this temperature the material is considered as a glass and above it first as a
super cooled liquid and then as a liquid. Error! Bookmark not defined.,8 The change in temperature also brings
hange in viscosity. When the viscosity is 10 Pa·s a material is said to be liquid, so the temperature
where this viscosity is reached is said to be the melting point of a glass. In addition to the melting
point, there are four other points of importance when speaking of viscosity for glasses. All points are
below the melting point and comes in order of descending temperature:
103 Pa·s: The working point, the glass is easily deformed at this temperature.
4·106 Pa·s: The softening point, it is the minimum viscosity at which the material can be
handled without undergoing significant dimensional changes.
1012 Pa·s: The annealing point. The atomic diffusion is so rapid that any residual stress in the
material will be removed within 15 minutes.
3·1013 Pa·s: The strain point. No plastic deformation will occur here, instead there will be
fractures in the material. 8
2.6. Fireproof materials
2.6.1. Refractories
Refractory materials have a wide range of variation in composition and structure. And with that, their
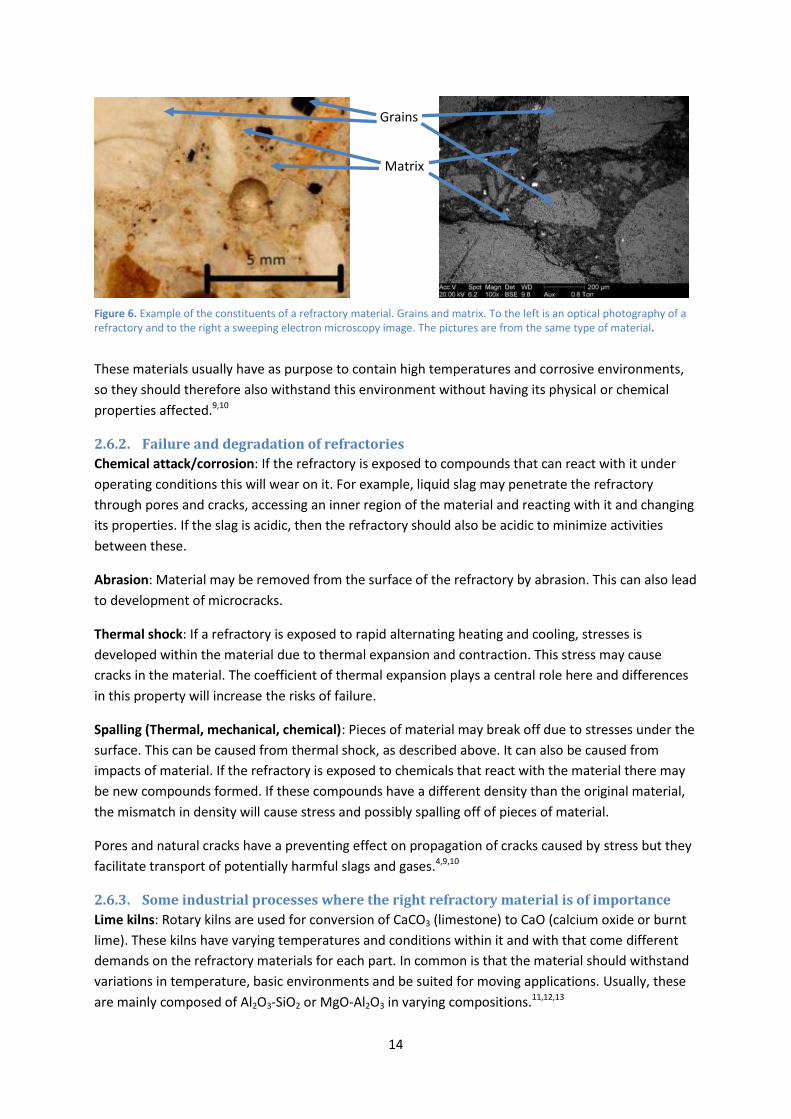
physical and chemical properties vary. Refractories are very heterogeneous materials consisting of
many components, both crystalline and glassy. They are consisting of coarse grains, usually with a
size between 1 µm and 1 cm bonded together by a matrix. See Figure 6 for example.
14
These materials usually have as purpose to contain high temperatures and corrosive environments,
so they should therefore also withstand this environment without having its physical or chemical
properties affected.9,10
2.6.2. Failure and degradation of refractories
Chemical attack/corrosion: If the refractory is exposed to compounds that can react with it under
operating conditions this will wear on it. For example, liquid slag may penetrate the refractory
through pores and cracks, accessing an inner region of the material and reacting with it and changing
its properties. If the slag is acidic, then the refractory should also be acidic to minimize activities
between these.
Abrasion: Material may be removed from the surface of the refractory by abrasion. This can also lead
to development of microcracks.
Thermal shock: If a refractory is exposed to rapid alternating heating and cooling, stresses is
developed within the material due to thermal expansion and contraction. This stress may cause
cracks in the material. The coefficient of thermal expansion plays a central role here and differences
in this property will increase the risks of failure.
Spalling (Thermal, mechanical, chemical): Pieces of material may break off due to stresses under the
surface. This can be caused from thermal shock, as described above. It can also be caused from
impacts of material. If the refractory is exposed to chemicals that react with the material there may
be new compounds formed. If these compounds have a different density than the original material,
the mismatch in density will cause stress and possibly spalling off of pieces of material.
Pores and natural cracks have a preventing effect on propagation of cracks caused by stress but they
facilitate transport of potentially harmful slags and gases.4,9,10
2.6.3. Some industrial processes where the right refractory material is of importance
Lime kilns: Rotary kilns are used for conversion of CaCO3 (limestone) to CaO (calcium oxide or burnt
lime). These kilns have varying temperatures and conditions within it and with that come different
demands on the refractory materials for each part. In common is that the material should withstand
variations in temperature, basic environments and be suited for moving applications. Usually, these
are mainly composed of Al2O3-SiO2 or MgO-Al2O3 in varying compositions.11,12,13
Grains
Matrix
Figure 6. Example of the constituents of a refractory material. Grains and matrix. To the left is an optical photography of a refractory and to the right a sweeping electron microscopy image. The pictures are from the same type of material.
15
Cement kilns: These are similar to rotary kilns used for lime production but are usually larger and
operate at higher temperatures. Instead of only limestone, other compounds containing Ca-, Si-, Al-
and Fe- oxides are mixed in. The higher temperatures create even more demands on the refractories
used. Usually these bricks are based on CaO, MgO and ZrO2. 10,14
Steelmaking: Before the Bessemer process, production of steel from pig iron was expensive and
ineffective. But a new process developed by Henry Bessemer (patented 1855) made this more cost
effective and possible in larger scale with his Bessemer converter. In this new process, temperatures
above 1600°C were reached and the environment was acidic. This led to problems with the lining of
the converter and he had to develop a new refractory material to withstand this environment. It was
composed of mainly SiO2.15
Nowdays this process is replaced by others, that operates under basic conditions and bricks based on
CaO and MgO are used.8
Glassmaking: In glass production slags rich in SiO2 are formed, these are acidic and therefore the
refractories have to withstand acids. Bricks made of SiO2 are therefore used. These are resistant to
acidic slags, but very sensitive to basic slags.
2.7. Methods for compositional, morphological and structural analysis A short and simplified description of how the instruments used for analyzing of compositional,
morphological and structural properties are working is presented below.
2.7.1. Scanning Electron Microscopy & Energy Dispersive X-ray spectroscopy (SEM-EDX)
A beam of electrons is focused on a sample, when the electrons hit the sample they collide and may
be scattered or force other electrons away from the atoms in the radiated spot. These electrons
leaving the radiated spot can be detected in various ways. Electrons scattered in the opposite
direction of incoming radiation is called back scattered electrons. These are detected with a back
scatter detector. With heavier elements the possibility of an electron to be back scattered is
increased. This means that heavier elements appear more bright on a back scattered image. The
beam is scanned over a surface of the sample, repeating this procedure and generating an image.
Sometimes the incoming electrons are ripping away electrons in the sample ionizing an atom. The
ionized atom is in an excited state and will immediately relax (de-excite) and emit a photon. When
this relaxation is taking place, the atom will emit a photon and depending on what atom it is, the
photon will have a characteristic energy that can be detected. The elemental composition surfaces or
spots can then be decided.16 EDX for quantification of elemental compositions has limitations and is
not always very accurate for lighter elements.
The used microscope was a Philips XL 30 ESEM equipped with an EDAX CDU LEAP detector.
2.7.2. X-ray diffraction (XRD)
When a wave is scattered by regularly spaced objects that have spacing between them comparable
to the wavelength, diffraction will occur. The scattered waves may enhance or cancel each other out
depending on if the scattered waves are in phase or not. This gives rise to a relationship between the
wavelength of the incoming wave, the angle of reflection and the spacing between the scattering
objects. Bragg’s law describes conditions for constructive interference:
16
(8)
Where, n is an integer, λ is the wavelength, d is the plane spacing and θ is the angle to the plane of
the incoming wave.
Since crystals are composed of a repeating pattern of identical units, they can create diffraction in
waves. The spacing between atoms in a crystal is in the order of a few Ångström and X-rays have a
wavelength of that order too. Different crystal structures composed of different elements gives
constructive interference for a certain wavelength at different angles. And with statistical tools and
chemical knowledge of the materials, the crystalline phases can be identified by at what angles there
is enhanced reflection.
While the SEM and EDX analysis only gives the information on what elements are present, X-ray
diffraction provides information on how they are combined.
This is usually performed on pulverized samples so that all possible crystallographic planes will be
contributing to the diffraction. The sample is exposed to monochromatic X-ray radiation from
different angles.
Rietveld refinement is a technique devised by Hugo Rietveld17 for use in the study of crystalline
materials. X-ray diffraction analysis of powder samples carried out with for instance an X-ray
diffractometer results in a pattern characterized by reflections (peaks with varying intensity) at
certain positions. The height, width and position of these reflections can be used to determine many
aspects of the materials structure.
The Rietveld method uses a least squares approach to refine a theoretical line profile until it matches
the measured pattern profile. This theoretical line profile is calculated from known crystal structure
data of all phases (compounds) in the powder sample. Thus, the occurring phases have to be
determined/identified prior to the Rietveld analysis. Once this is accomplished detailed crystal
structure data of all these phases have to be made available and used as input to the Rietveld
calculation of the theoretical diffraction pattern. The present use of the Rietveld technique is to
obtain semi-quantitative concentrations of all phases in the sample. In practice this is accomplished
by a least squares refinements of the amount of the individual phases to obtain a best fit of the
theoretical pattern to the experimental.
The crystal structures utilized for the Rietveld analysis in the present investigation are taken from
ICSD Database 18 except for Kaliophilite where the model developed by Okamoto19 was used and for
K(2-x)Al(2-x)SixO4 where a model from Burmakin et al was used20
3. Previous work Wearing of refractory materials has been an issue for processes dealing with high temperatures and
has a long history within some fields. Gasification of biomass in modern industrial scale however, has
a relatively short history compared to gasification of coal and other fossil feed stocks. The major
differences are water content, heating value and alkali content.
Gas turbines: for power generation are a field for which corrosion studies on ceramics has been
done. The turbine itself has to endure physical stress and corrosive elements at high temperatures.
17
Ueno et al reported that mullite was corroded by water vapor attack at temperatures of 1300-1500°C
and that this process was accelerated by presence of a small amount of Na.21
If pulverized coal instead of gas is used in an IGCC process for example, any solid particles has to be
filtered before they reach the turbines to prevent erosion. This requires filters with high demands on
durability at temperatures of 800-1000°C. Takahashi et al studied the corrosion of cordierite
ceramics by Na and K salts at high temperatures. They found out that K reacted with the cordierite
and formed several other phases at temperatures above 1000°C followed by cracks in the material.22
A similar study was made by the same authors on cordierite-mullite composites. This study showed
among other things that mullite is more resistant to attack from NaCl and NaSO4 than cordierite at
1000°C in air.23
Potassium vapor attack on Alumina-Silica refractories: Luis M. A. Scudeller24 studied the potassium
vapor attack of two mullite based refractories composed of a mixture of Al2O3 and SiO2 with 45
respectively 55 wt% Al2O3 at 1000°C for 0.5 to 32 h. He summarized the attack in following steps:
Potassium vapor attacks the glassy phase of the brick and forms potassium silicate. This
reacts with mullite at the mullite-matrix interface and is forming kaliophilite. That creates
two new interfaces: mullite-kaliophilite and kaliophilite-matrix
The concentration of kaliophilite increases with time and it will react with free SiO2 to form
the more stable mineral leucite.
In refractories that contain more tridymite (SiO2) and corundum (Al2O3) the K will react with
both these, resulting in the glassy phase for a short time. There will crystallize kaliophilite
from this glass that will react with free SiO2 and form leucite.
The formation of kaliophilite would cause a volume expansion of 55.5% and when kaliophilite
transforms to leucite it will cause a contraction of 0.14%. This expansion will not be relieved by the
porosity of the material because of the localization of the kaliophilite. Stress, and increased risk for
crack formation and propagation in the material is the result.
Steelmaking: this is another industry where extensive research has been done on deterioration
mechanisms of refractory materials at high temperatures.
Production of iron ore pellets (one step in the process of converting iron ore to iron) is often done
using a rotary kiln. Jesper Stjernberg wrote a doctoral thesis on the degradation mechanisms in
refractory lining materials for kilns like these. He found out that: A principal degradation mechanism
is that alkali metals migrate into the lining through capillary infiltration and reacts with parts of the
material. Mullite is dissolved and is forming other, brittle phases that increase stresses due to
thermal expansion. The amount of glassy phases also increased, which facilitates migration of oxide
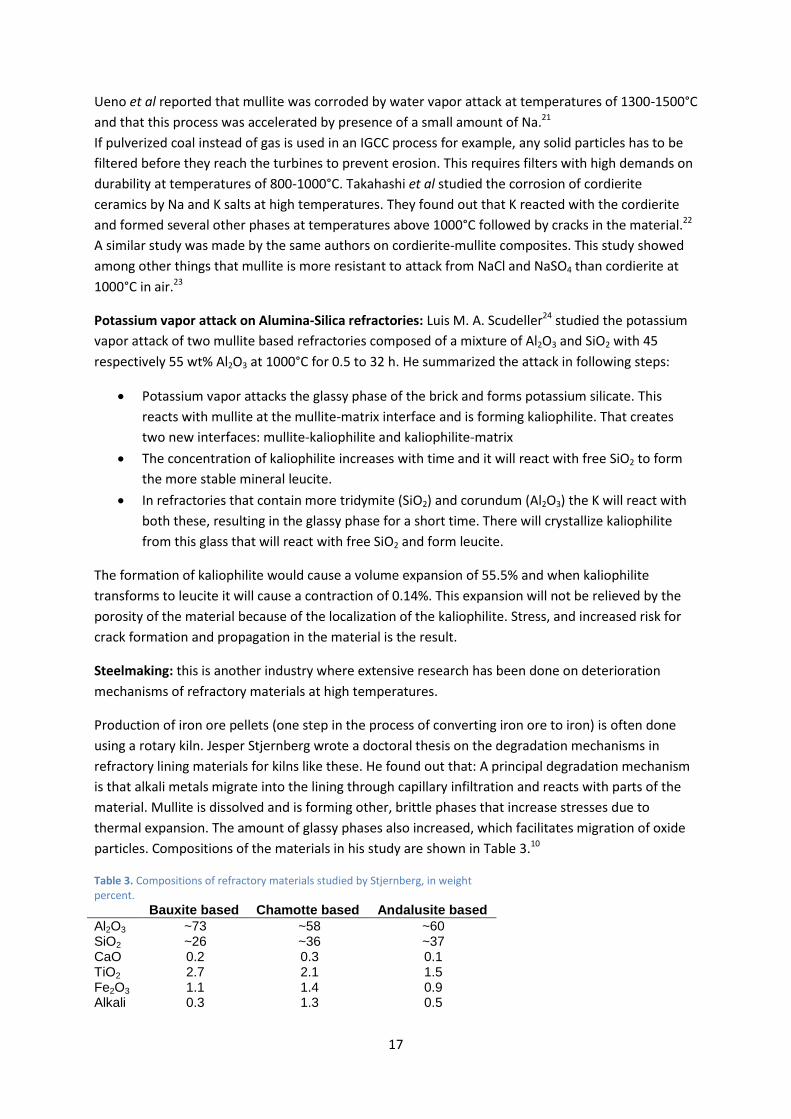
particles. Compositions of the materials in his study are shown in Table 3.10
Table 3. Compositions of refractory materials studied by Stjernberg, in weight percent.
Bauxite based Chamotte based Andalusite based
Al2O3 ~73 ~58 ~60 SiO2 ~26 ~36 ~37 CaO 0.2 0.3 0.1 TiO2 2.7 2.1 1.5 Fe2O3 1.1 1.4 0.9 Alkali 0.3 1.3 0.5
18
4. Experimental
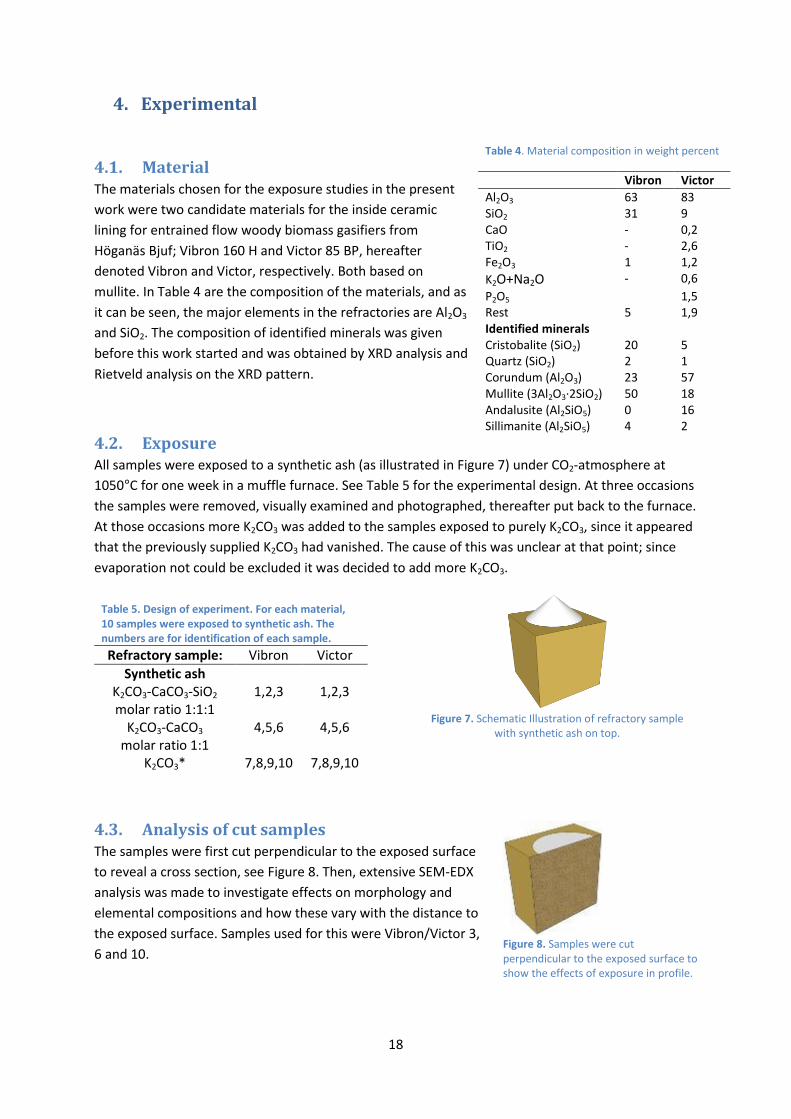
4.1. Material The materials chosen for the exposure studies in the present
work were two candidate materials for the inside ceramic
lining for entrained flow woody biomass gasifiers from
Höganäs Bjuf; Vibron 160 H and Victor 85 BP, hereafter
denoted Vibron and Victor, respectively. Both based on
mullite. In Table 4 are the composition of the materials, and as
it can be seen, the major elements in the refractories are Al2O3
and SiO2. The composition of identified minerals was given
before this work started and was obtained by XRD analysis and
Rietveld analysis on the XRD pattern.
4.2. Exposure All samples were exposed to a synthetic ash (as illustrated in Figure 7) under CO2-atmosphere at
1050°C for one week in a muffle furnace. See Table 5 for the experimental design. At three occasions
the samples were removed, visually examined and photographed, thereafter put back to the furnace.
At those occasions more K2CO3 was added to the samples exposed to purely K2CO3, since it appeared
that the previously supplied K2CO3 had vanished. The cause of this was unclear at that point; since
evaporation not could be excluded it was decided to add more K2CO3.
Table 5. Design of experiment. For each material, 10 samples were exposed to synthetic ash. The numbers are for identification of each sample.
Refractory sample: Vibron Victor
Synthetic ash K2CO3-CaCO3-SiO2 molar ratio 1:1:1
1,2,3 1,2,3
K2CO3-CaCO3 molar ratio 1:1
4,5,6 4,5,6
K2CO3* 7,8,9,10 7,8,9,10
Figure 7. Schematic Illustration of refractory sample
with synthetic ash on top.
4.3. Analysis of cut samples The samples were first cut perpendicular to the exposed surface
to reveal a cross section, see Figure 8. Then, extensive SEM-EDX
analysis was made to investigate effects on morphology and
elemental compositions and how these vary with the distance to
the exposed surface. Samples used for this were Vibron/Victor 3,
6 and 10.
Table 4. Material composition in weight percent
Vibron Victor
Al2O3 63 83 SiO2 31 9 CaO - 0,2 TiO2 - 2,6 Fe2O3 1 1,2
K2O+Na2O - 0,6
P2O5 1,5 Rest 5 1,9 Identified minerals Cristobalite (SiO2) 20 5 Quartz (SiO2) 2 1 Corundum (Al2O3) 23 57 Mullite (3Al2O3·2SiO2) 50 18 Andalusite (Al2SiO5) 0 16 Sillimanite (Al2SiO5) 4 2
Figure 8. Samples were cut perpendicular to the exposed surface to show the effects of exposure in profile.
19
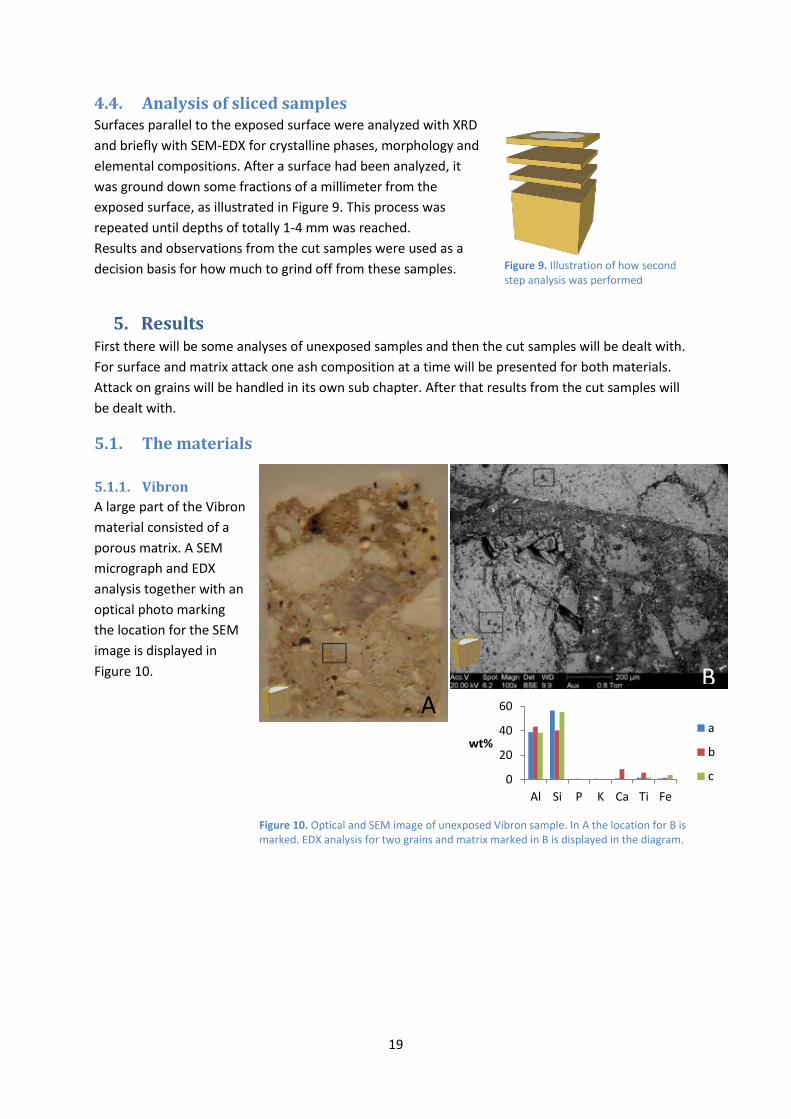
4.4. Analysis of sliced samples Surfaces parallel to the exposed surface were analyzed with XRD
and briefly with SEM-EDX for crystalline phases, morphology and
elemental compositions. After a surface had been analyzed, it
was ground down some fractions of a millimeter from the
exposed surface, as illustrated in Figure 9. This process was
repeated until depths of totally 1-4 mm was reached.
Results and observations from the cut samples were used as a
decision basis for how much to grind off from these samples.
5. Results First there will be some analyses of unexposed samples and then the cut samples will be dealt with.
For surface and matrix attack one ash composition at a time will be presented for both materials.
Attack on grains will be handled in its own sub chapter. After that results from the cut samples will
be dealt with.
5.1. The materials
5.1.1. Vibron
A large part of the Vibron
material consisted of a
porous matrix. A SEM
micrograph and EDX
analysis together with an
optical photo marking
the location for the SEM
image is displayed in
Figure 10.
Figure 9. Illustration of how second step analysis was performed
0
20
40
60
Al Si P K Ca Ti Fe
wt% a
b
c
A B
Figure 10. Optical and SEM image of unexposed Vibron sample. In A the location for B is marked. EDX analysis for two grains and matrix marked in B is displayed in the diagram.
20
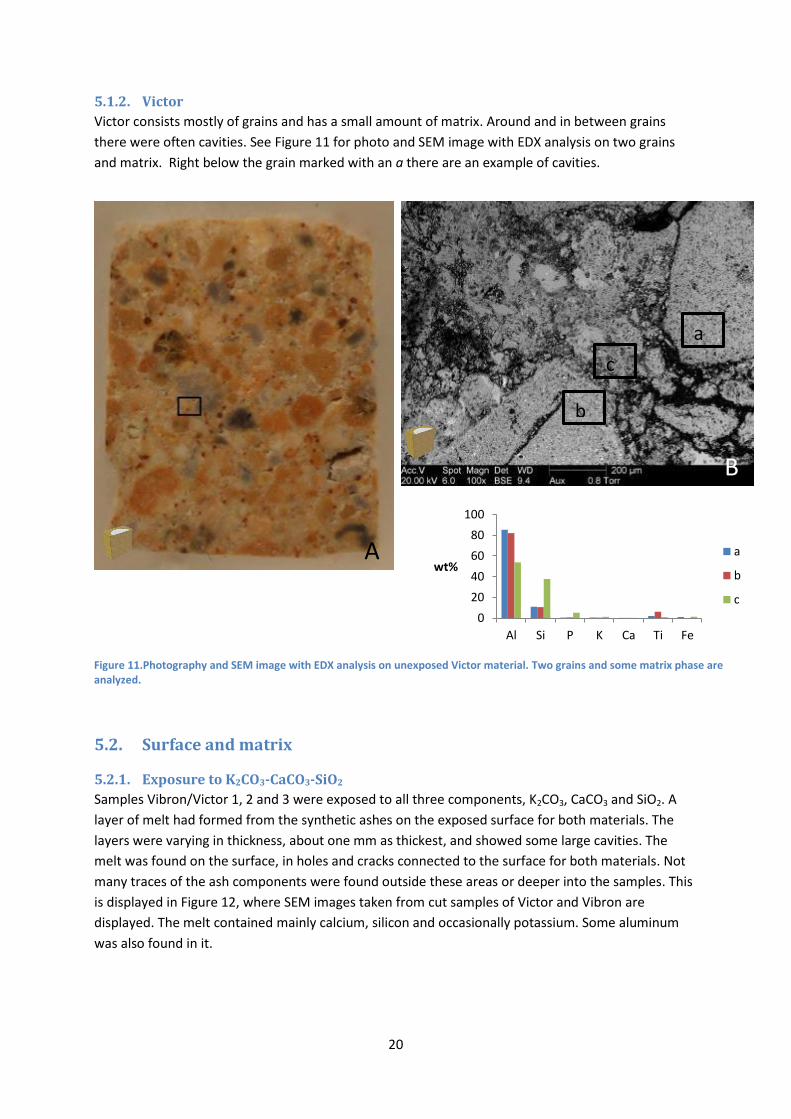
5.1.2. Victor
Victor consists mostly of grains and has a small amount of matrix. Around and in between grains
there were often cavities. See Figure 11 for photo and SEM image with EDX analysis on two grains
and matrix. Right below the grain marked with an a there are an example of cavities.
5.2. Surface and matrix
5.2.1. Exposure to K2CO3-CaCO3-SiO2
Samples Vibron/Victor 1, 2 and 3 were exposed to all three components, K2CO3, CaCO3 and SiO2. A
layer of melt had formed from the synthetic ashes on the exposed surface for both materials. The
layers were varying in thickness, about one mm as thickest, and showed some large cavities. The
melt was found on the surface, in holes and cracks connected to the surface for both materials. Not
many traces of the ash components were found outside these areas or deeper into the samples. This
is displayed in Figure 12, where SEM images taken from cut samples of Victor and Vibron are
displayed. The melt contained mainly calcium, silicon and occasionally potassium. Some aluminum
was also found in it.
0
20
40
60
80
100
Al Si P K Ca Ti Fe
wt% a
b
c
Figure 11.Photography and SEM image with EDX analysis on unexposed Victor material. Two grains and some matrix phase are analyzed.
a
b
c
A
B
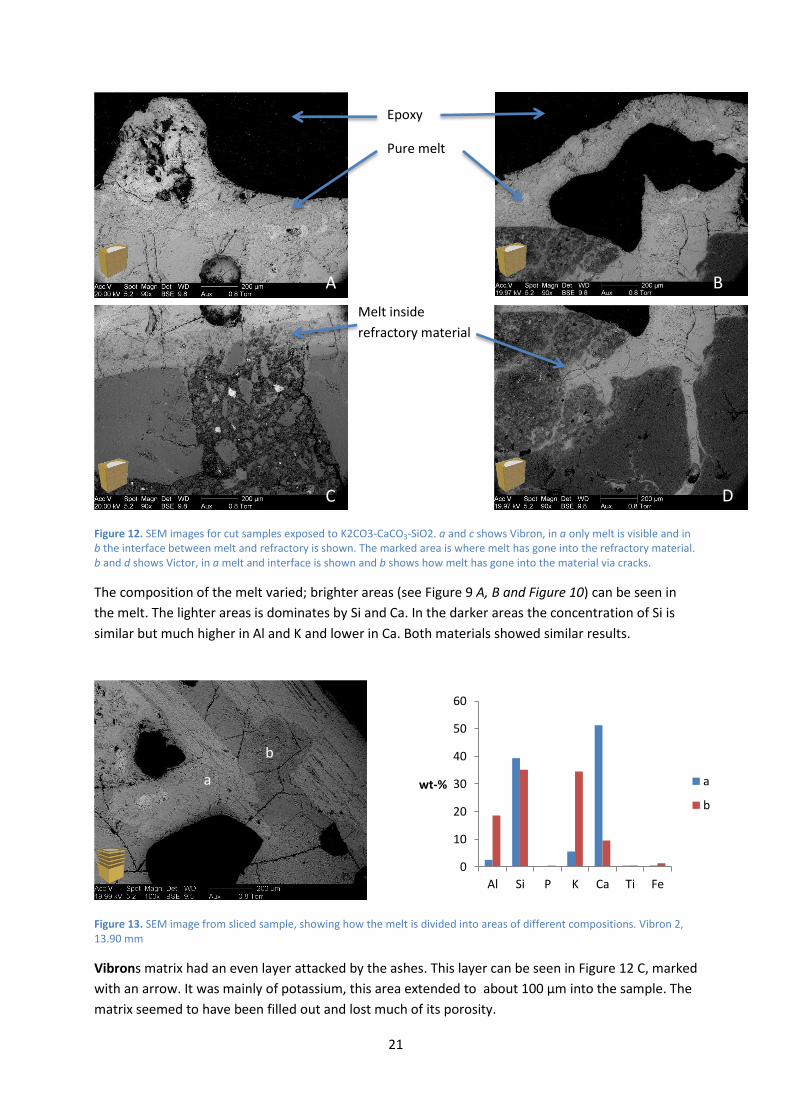
21
Figure 12. SEM images for cut samples exposed to K2CO3-CaCO3-SiO2. a and c shows Vibron, in a only melt is visible and in b the interface between melt and refractory is shown. The marked area is where melt has gone into the refractory material. b and d shows Victor, in a melt and interface is shown and b shows how melt has gone into the material via cracks.
The composition of the melt varied; brighter areas (see Figure 9 A, B and Figure 10) can be seen in
the melt. The lighter areas is dominates by Si and Ca. In the darker areas the concentration of Si is
similar but much higher in Al and K and lower in Ca. Both materials showed similar results.
<
Figure 13. SEM image from sliced sample, showing how the melt is divided into areas of different compositions. Vibron 2, 13.90 mm
Vibrons matrix had an even layer attacked by the ashes. This layer can be seen in Figure 12 C, marked
with an arrow. It was mainly of potassium, this area extended to about 100 µm into the sample. The
matrix seemed to have been filled out and lost much of its porosity.
0
10
20
30
40
50
60
Al Si P K Ca Ti Fe
wt-% a
b
a
b
A
C D
B
Epoxy
Pure melt
Melt inside
refractory material
22
The matrix of Victor was spot wise attacked and potassium could be found about 1 mm into the
matrix.
Grains in contact with the slag responded differently depending on grain composition. Pure alumina
grains were unaffected, while grains containing more Si developed a reaction front.
5.2.2. Samples exposed to K2CO3-CaCO3
Vibron/Victor 4, 5 and 6 were exposed to K2CO3 and CaCO3. The ashes did not form a melt in this
case. Instead, left on the surface, was a CaO powder. Traces of ash, in form of potassium, could be
seen further down into the materials compared to the exposure of K2CO3-CaCO3-SiO2 .
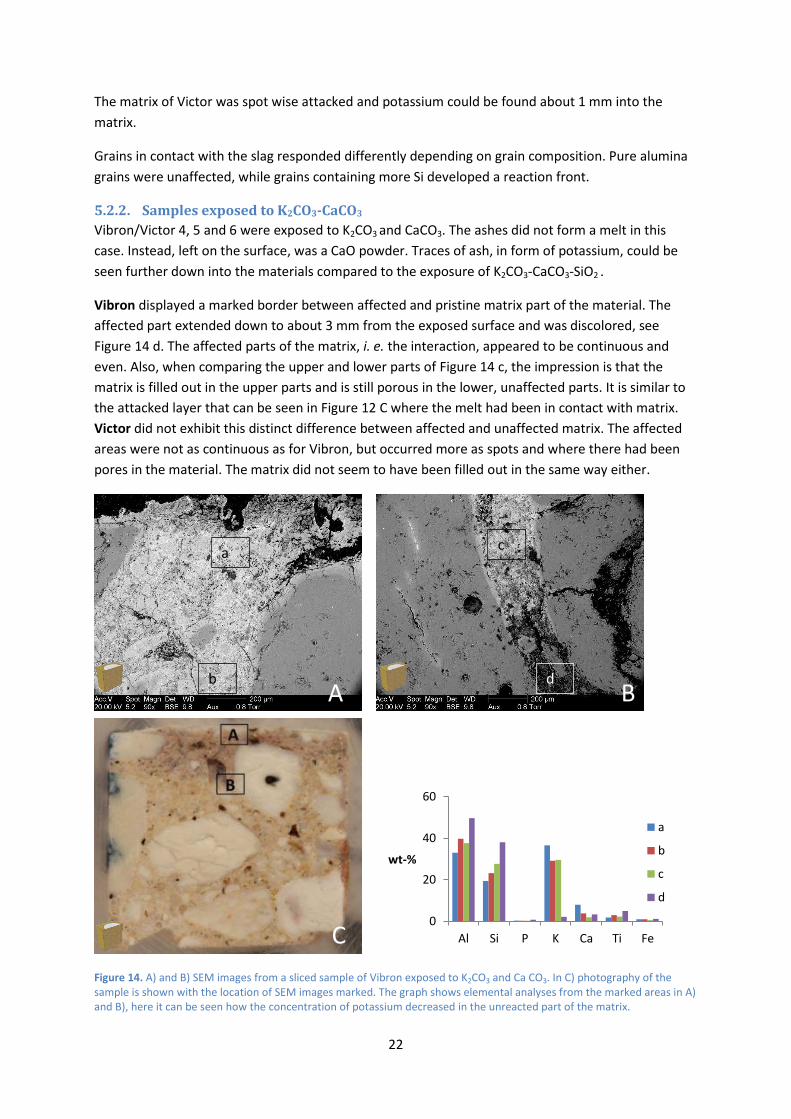
Vibron displayed a marked border between affected and pristine matrix part of the material. The
affected part extended down to about 3 mm from the exposed surface and was discolored, see
Figure 14 d. The affected parts of the matrix, i. e. the interaction, appeared to be continuous and
even. Also, when comparing the upper and lower parts of Figure 14 c, the impression is that the
matrix is filled out in the upper parts and is still porous in the lower, unaffected parts. It is similar to
the attacked layer that can be seen in Figure 12 C where the melt had been in contact with matrix.
Victor did not exhibit this distinct difference between affected and unaffected matrix. The affected
areas were not as continuous as for Vibron, but occurred more as spots and where there had been
pores in the material. The matrix did not seem to have been filled out in the same way either.
Figure 14. A) and B) SEM images from a sliced sample of Vibron exposed to K2CO3 and Ca CO3. In C) photography of the sample is shown with the location of SEM images marked. The graph shows elemental analyses from the marked areas in A) and B), here it can be seen how the concentration of potassium decreased in the unreacted part of the matrix.
Al Si P K Ca Ti Fe
0
20
40
60
wt-%
a
b
c
d
b
a c
d A
C
B
23
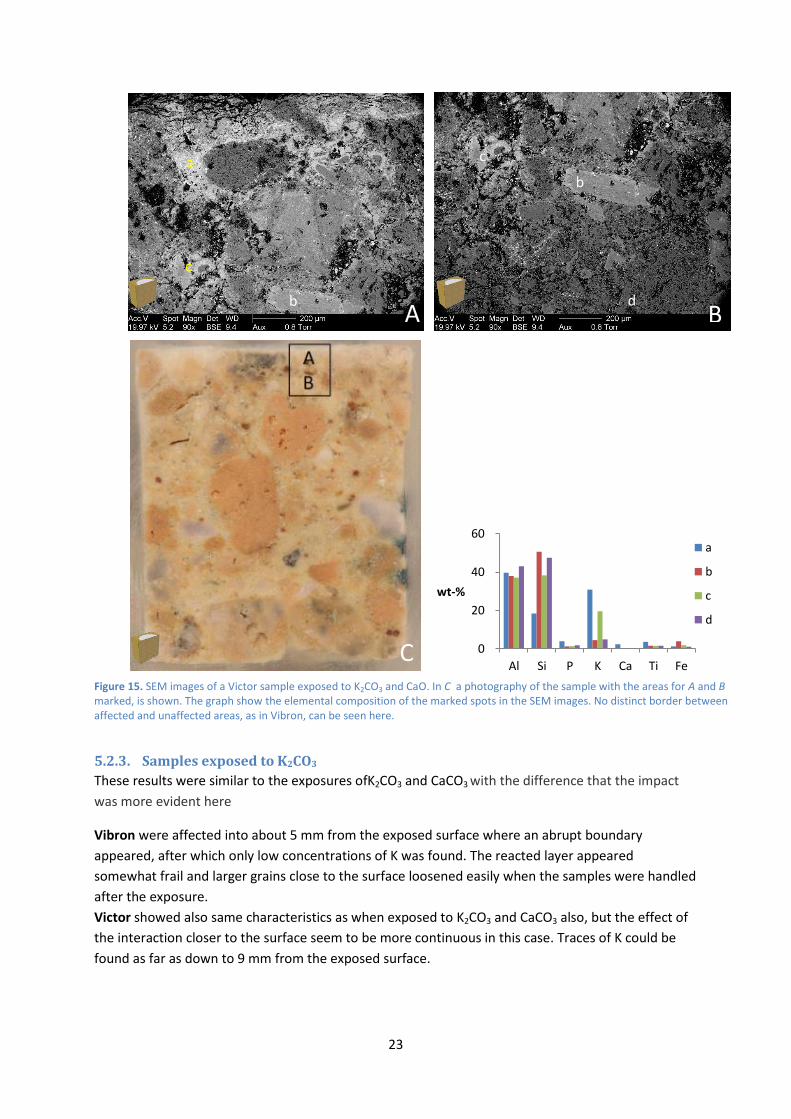
5.2.3. Samples exposed to K2CO3
These results were similar to the exposures ofK2CO3 and CaCO3 with the difference that the impact
was more evident here
Vibron were affected into about 5 mm from the exposed surface where an abrupt boundary
appeared, after which only low concentrations of K was found. The reacted layer appeared
somewhat frail and larger grains close to the surface loosened easily when the samples were handled
after the exposure.
Victor showed also same characteristics as when exposed to K2CO3 and CaCO3 also, but the effect of
the interaction closer to the surface seem to be more continuous in this case. Traces of K could be
found as far as down to 9 mm from the exposed surface.
Figure 15. SEM images of a Victor sample exposed to K2CO3 and CaO. In C a photography of the sample with the areas for A and B marked, is shown. The graph show the elemental composition of the marked spots in the SEM images. No distinct border between affected and unaffected areas, as in Vibron, can be seen here.
Al Si P K Ca Ti Fe
0
20
40
60
wt-%
a
b
c
d
C
A B
a b
a
b
c
d
b
c
24
5.3. Attack on grains The same type of grains was found in both materials, so no distinction between Victor and Vibron will
be made here.
As mentioned in section 5.2, grains were attacked in different ways depending on composition. Only
potassium from the ashes appears to be involved in this attack. All grains consist of oxides of Al and
Si in varying compositions for both materials.
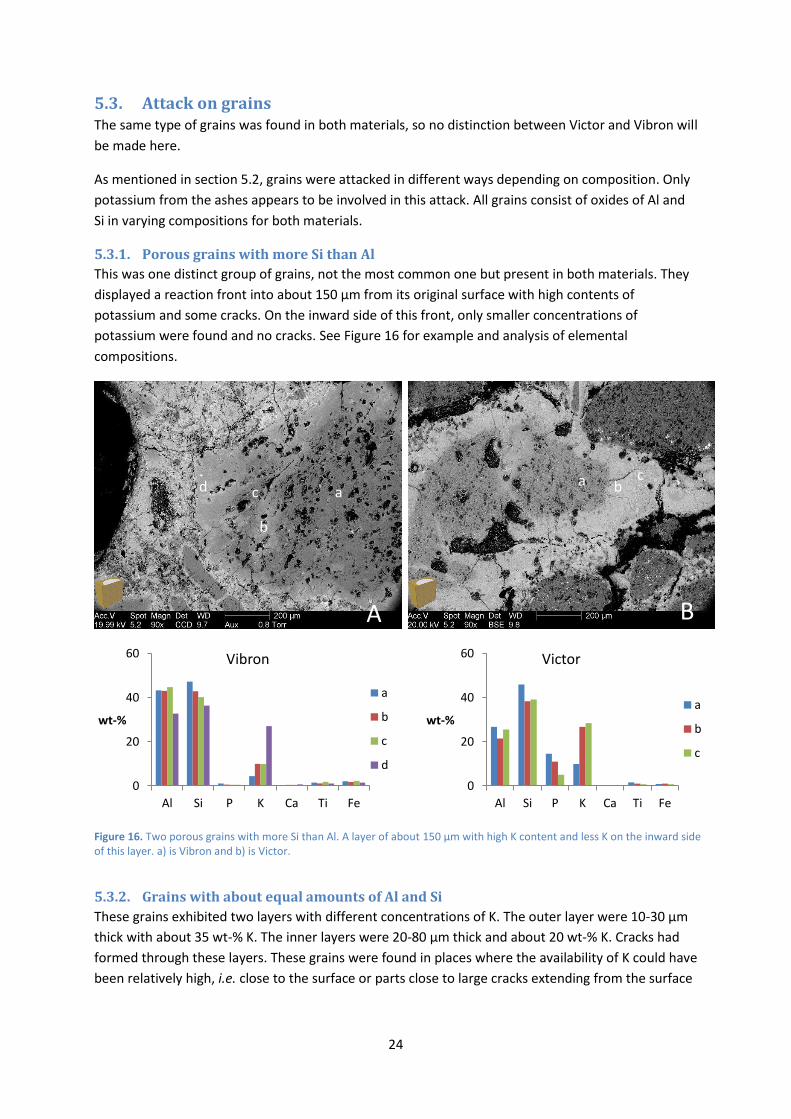
5.3.1. Porous grains with more Si than Al
This was one distinct group of grains, not the most common one but present in both materials. They
displayed a reaction front into about 150 µm from its original surface with high contents of
potassium and some cracks. On the inward side of this front, only smaller concentrations of
potassium were found and no cracks. See Figure 16 for example and analysis of elemental
compositions.
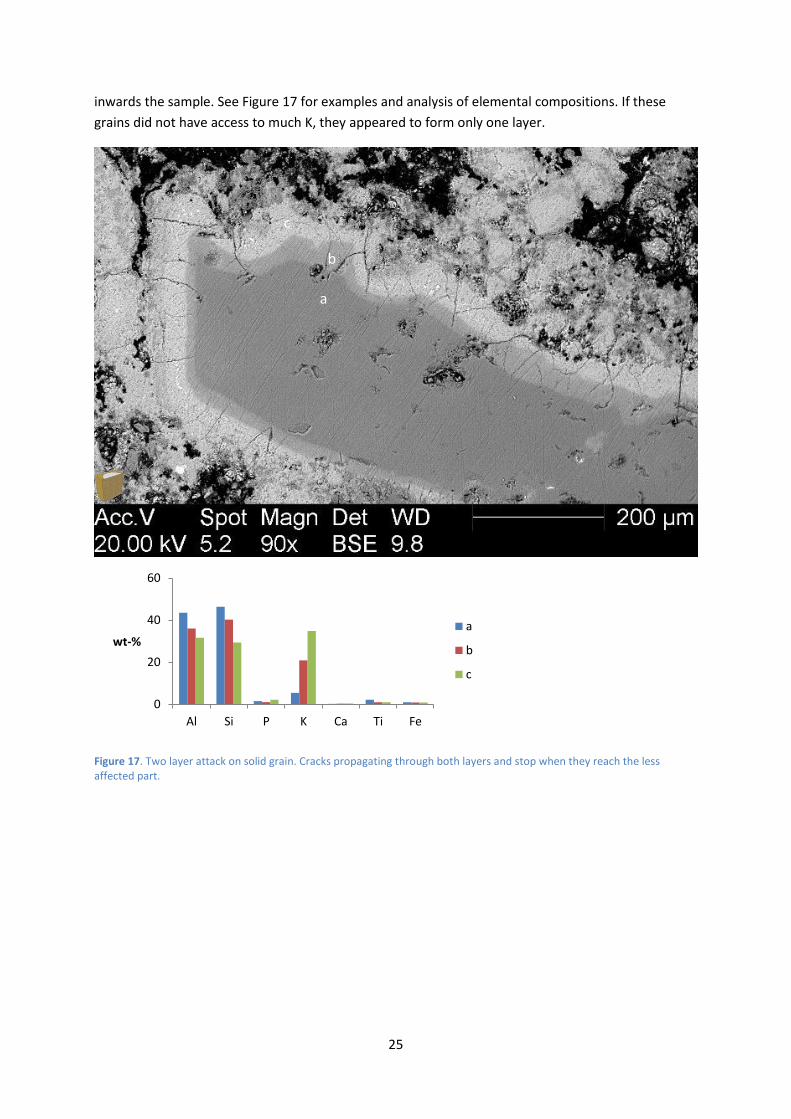
5.3.2. Grains with about equal amounts of Al and Si
These grains exhibited two layers with different concentrations of K. The outer layer were 10-30 µm
thick with about 35 wt-% K. The inner layers were 20-80 µm thick and about 20 wt-% K. Cracks had
formed through these layers. These grains were found in places where the availability of K could have
been relatively high, i.e. close to the surface or parts close to large cracks extending from the surface
Figure 16. Two porous grains with more Si than Al. A layer of about 150 µm with high K content and less K on the inward side of this layer. a) is Vibron and b) is Victor.
0
20
40
60
Al Si P K Ca Ti Fe
wt-%
Vibron
a
b
c
d
0
20
40
60
Al Si P K Ca Ti Fe
wt-%
Victor
a
b
c
a
b
c d a b c
A B
25
inwards the sample. See Figure 17 for examples and analysis of elemental compositions. If these
grains did not have access to much K, they appeared to form only one layer.
Figure 17. Two layer attack on solid grain. Cracks propagating through both layers and stop when they reach the less affected part.
0
20
40
60
Al Si P K Ca Ti Fe
wt-% a
b
c
a
b
c
26
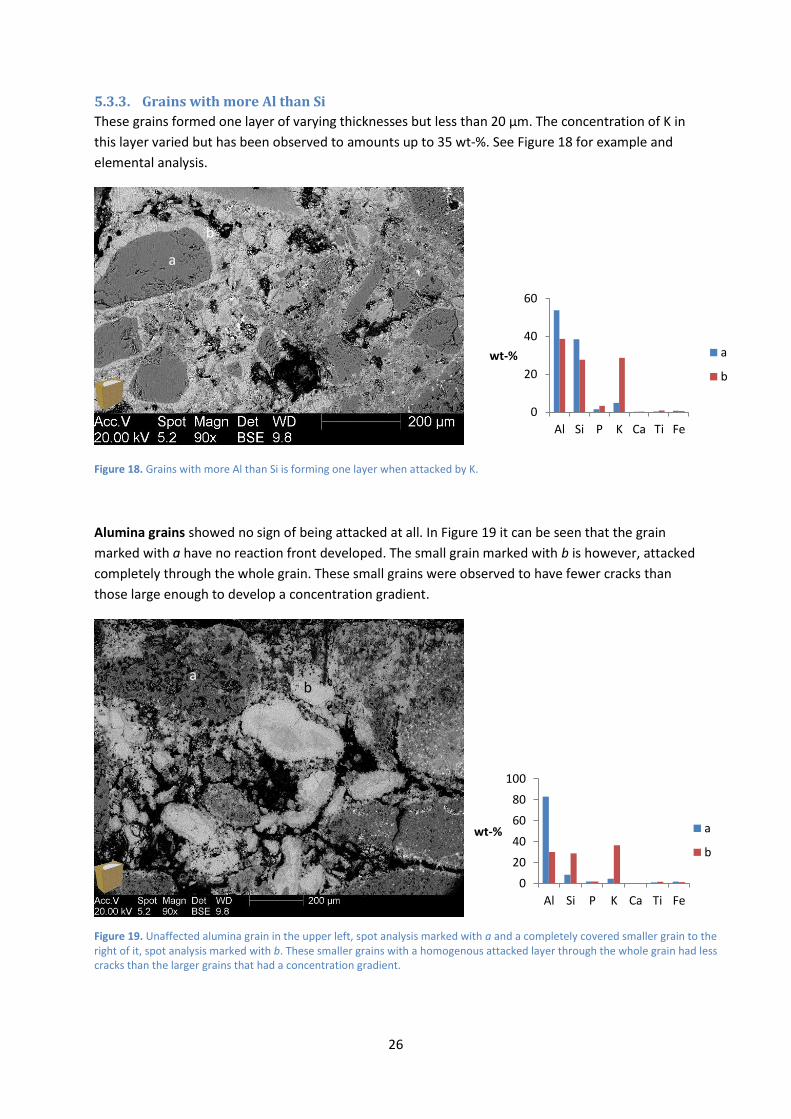
5.3.3. Grains with more Al than Si
These grains formed one layer of varying thicknesses but less than 20 µm. The concentration of K in
this layer varied but has been observed to amounts up to 35 wt-%. See Figure 18 for example and
elemental analysis.
Figure 18. Grains with more Al than Si is forming one layer when attacked by K.
Alumina grains showed no sign of being attacked at all. In Figure 19 it can be seen that the grain
marked with a have no reaction front developed. The small grain marked with b is however, attacked
completely through the whole grain. These small grains were observed to have fewer cracks than
those large enough to develop a concentration gradient.
0
20
40
60
Al Si P K Ca Ti Fe
wt-% a
b
Figure 19. Unaffected alumina grain in the upper left, spot analysis marked with a and a completely covered smaller grain to the right of it, spot analysis marked with b. These smaller grains with a homogenous attacked layer through the whole grain had less cracks than the larger grains that had a concentration gradient.
0
20
40
60
80
100
Al Si P K Ca Ti Fe
wt-% a
b
a
b
a b
27
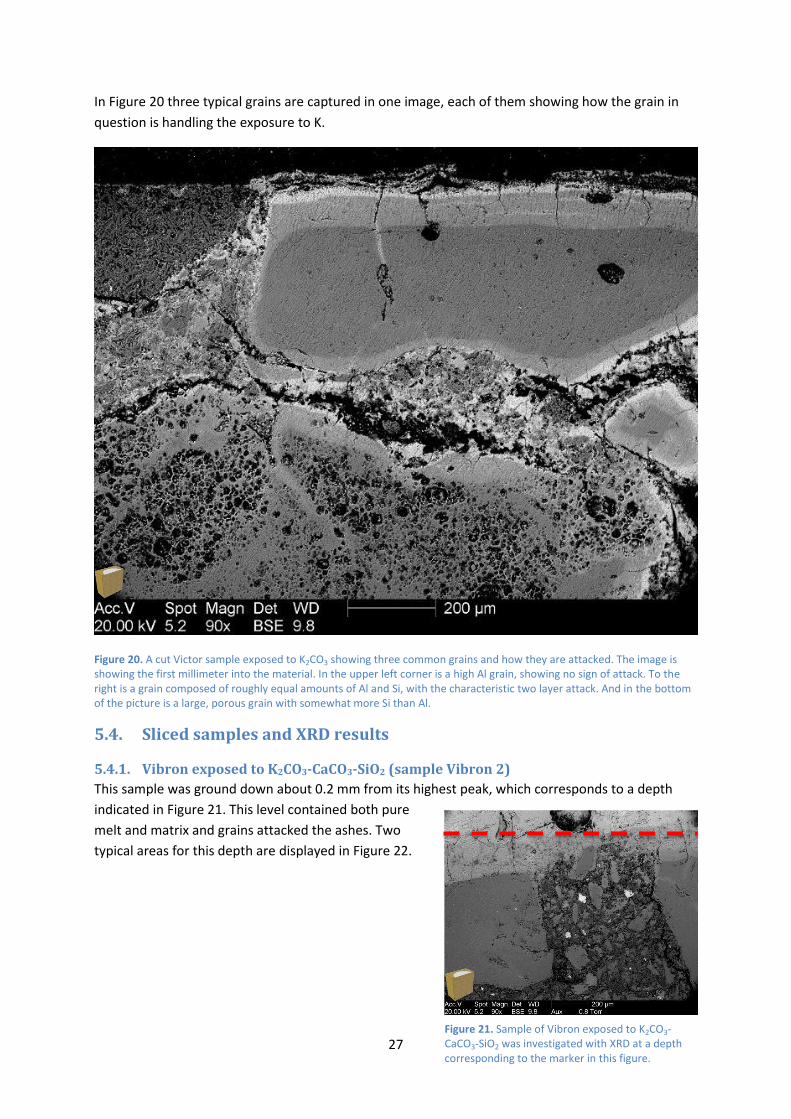
In Figure 20 three typical grains are captured in one image, each of them showing how the grain in
question is handling the exposure to K.
Figure 20. A cut Victor sample exposed to K2CO3 showing three common grains and how they are attacked. The image is showing the first millimeter into the material. In the upper left corner is a high Al grain, showing no sign of attack. To the right is a grain composed of roughly equal amounts of Al and Si, with the characteristic two layer attack. And in the bottom of the picture is a large, porous grain with somewhat more Si than Al.
5.4. Sliced samples and XRD results
5.4.1. Vibron exposed to K2CO3-CaCO3-SiO2 (sample Vibron 2)
This sample was ground down about 0.2 mm from its highest peak, which corresponds to a depth
indicated in Figure 21. This level contained both pure
melt and matrix and grains attacked the ashes. Two
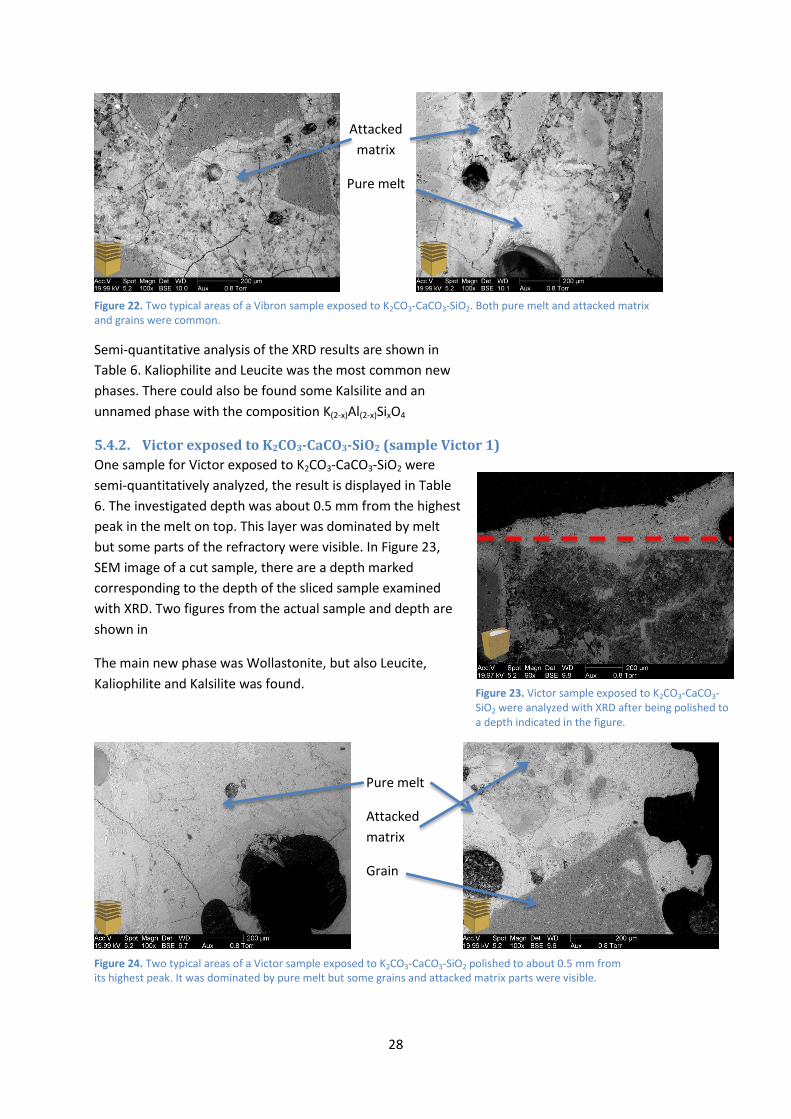
typical areas for this depth are displayed in Figure 22.
Figure 21. Sample of Vibron exposed to K2CO3-CaCO3-SiO2 was investigated with XRD at a depth corresponding to the marker in this figure.
28
Semi-quantitative analysis of the XRD results are shown in
Table 6. Kaliophilite and Leucite was the most common new
phases. There could also be found some Kalsilite and an
unnamed phase with the composition K(2-x)Al(2-x)SixO4
5.4.2. Victor exposed to K2CO3-CaCO3-SiO2 (sample Victor 1)
One sample for Victor exposed to K2CO3-CaCO3-SiO2 were
semi-quantitatively analyzed, the result is displayed in Table
6. The investigated depth was about 0.5 mm from the highest
peak in the melt on top. This layer was dominated by melt
but some parts of the refractory were visible. In Figure 23,
SEM image of a cut sample, there are a depth marked
corresponding to the depth of the sliced sample examined
with XRD. Two figures from the actual sample and depth are
shown in
The main new phase was Wollastonite, but also Leucite,
Kaliophilite and Kalsilite was found.
Figure 24. Two typical areas of a Victor sample exposed to K2CO3-CaCO3-SiO2 polished to about 0.5 mm from its highest peak. It was dominated by pure melt but some grains and attacked matrix parts were visible.
Pure melt
Attacked
matrix
Grain
Attacked
matrix
Pure melt
Figure 22. Two typical areas of a Vibron sample exposed to K2CO3-CaCO3-SiO2. Both pure melt and attacked matrix and grains were common.
Figure 23. Victor sample exposed to K2CO3-CaCO3-SiO2 were analyzed with XRD after being polished to a depth indicated in the figure.
29
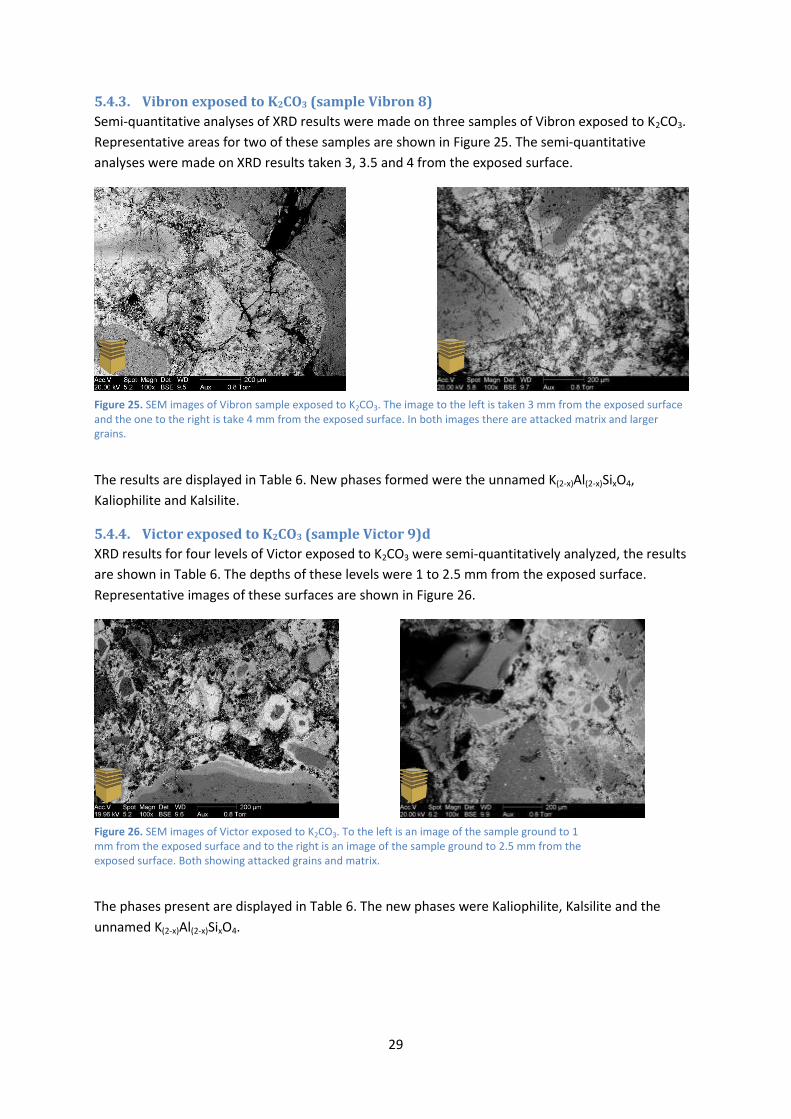
5.4.3. Vibron exposed to K2CO3 (sample Vibron 8)
Semi-quantitative analyses of XRD results were made on three samples of Vibron exposed to K2CO3.
Representative areas for two of these samples are shown in Figure 25. The semi-quantitative
analyses were made on XRD results taken 3, 3.5 and 4 from the exposed surface.
The results are displayed in Table 6. New phases formed were the unnamed K(2-x)Al(2-x)SixO4,
Kaliophilite and Kalsilite.
5.4.4. Victor exposed to K2CO3 (sample Victor 9)d
XRD results for four levels of Victor exposed to K2CO3 were semi-quantitatively analyzed, the results
are shown in Table 6. The depths of these levels were 1 to 2.5 mm from the exposed surface.
Representative images of these surfaces are shown in Figure 26.
The phases present are displayed in Table 6. The new phases were Kaliophilite, Kalsilite and the
unnamed K(2-x)Al(2-x)SixO4.
Figure 25. SEM images of Vibron sample exposed to K2CO3. The image to the left is taken 3 mm from the exposed surface and the one to the right is take 4 mm from the exposed surface. In both images there are attacked matrix and larger grains.
Figure 26. SEM images of Victor exposed to K2CO3. To the left is an image of the sample ground to 1 mm from the exposed surface and to the right is an image of the sample ground to 2.5 mm from the exposed surface. Both showing attacked grains and matrix.
30
6. Discussion The phenomena considered in this report represent the most common cases observed in this
experimental study. There are many other interesting observations that remain to be documented.
Here, these have been left out since they were considered not to be within the scope of the present
work.
Due to troubles with the XRD and SEM instruments, all desired analyses on the sliced samples could
not be performed in time. The material obtained is, however, enough to present ant do draw
conclusions from.
6.1. The materials Both materials were composed of almost entirely of Al2O3 and SiO2, Vibron; 63 % Al2O3, 31 % SiO2 and
6 % others, Victor; 83 % Al2O3, 9 % SiO2 and 8 % others. Vibron showed clear distinctions between
matrix and grain parts. For Victor, the matrix part was not easy observed. It seemed to have less
matrix, as it were more composed of tightly packed grains of same size range. In victor, there were
also more common with larger cavities around the grains.
6.2. Surface and matrix attack
6.2.1. Samples exposed to K2CO3-CaCO3-SiO2
The samples exposed to K2CO3-CaCO3-SiO2 exhibited a melt on top; composed of mainly Si, Ca and
occasionally K. Some Al could also be found in the melt. The melt were heterogeneous, probably as a
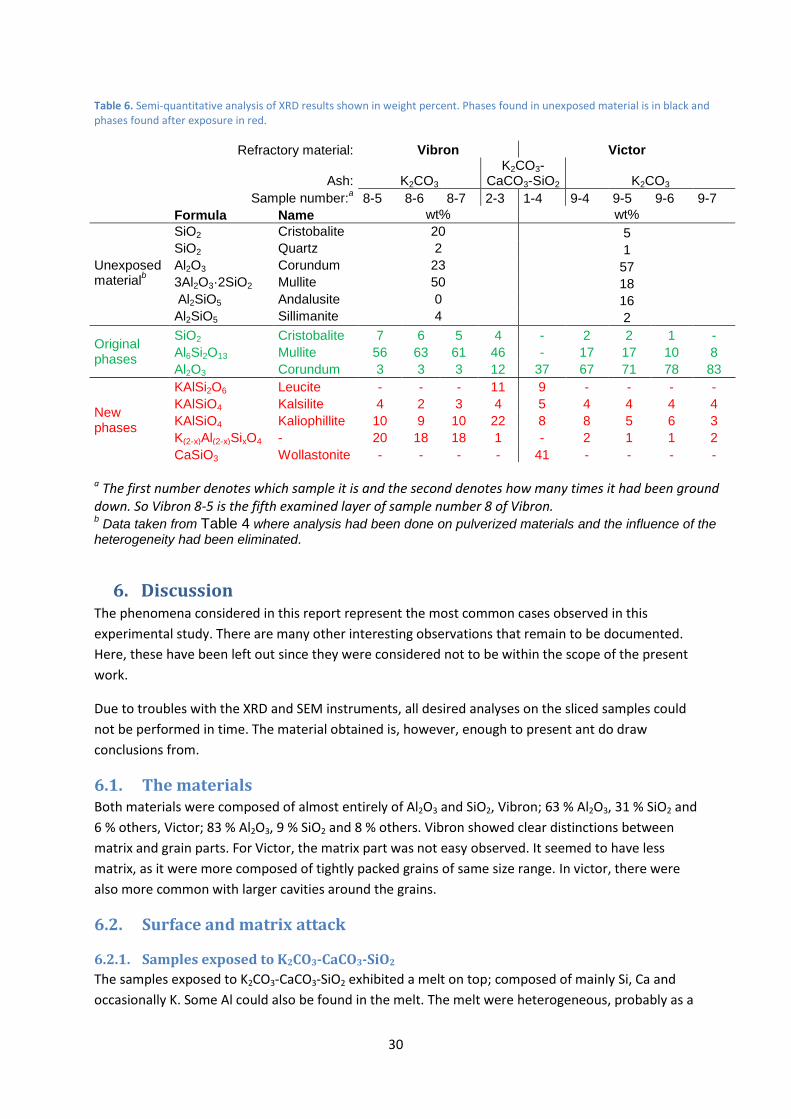
Table 6. Semi-quantitative analysis of XRD results shown in weight percent. Phases found in unexposed material is in black and phases found after exposure in red.
Refractory material: Vibron Victor
Ash: K2CO3 K2CO3-
CaCO3-SiO2 K2CO3
Sample number:a 8-5 8-6 8-7 2-3 1-4 9-4 9-5 9-6 9-7
Formula Name wt% wt%
SiO2 Cristobalite 20 5 SiO2 Quartz 2 1 Unexposed material
b
Al2O3 Corundum 23 57 3Al2O3·2SiO2 Mullite 50 18
Al2SiO5 Andalusite 0 16 Al2SiO5 Sillimanite 4 2
Original phases
SiO2 Cristobalite 7 6 5 4 - 2 2 1 -
Al6Si2O13 Mullite 56 63 61 46 - 17 17 10 8
Al2O3 Corundum 3 3 3 12 37 67 71 78 83
New phases
KAlSi2O6 Leucite - - - 11 9 - - - -
KAlSiO4 Kalsilite 4 2 3 4 5 4 4 4 4
KAlSiO4 Kaliophillite 10 9 10 22 8 8 5 6 3
K(2-x)Al(2-x)SixO4 - 20 18 18 1 - 2 1 1 2
CaSiO3 Wollastonite - - - - 41 - - - - a The first number denotes which sample it is and the second denotes how many times it had been ground down. So Vibron 8-5 is the fifth examined layer of sample number 8 of Vibron. b Data taken from Table 4 where analysis had been done on pulverized materials and the influence of the
heterogeneity had been eliminated.
31
result of fractionated crystallization producing either a mixture of crystalline phases or crystalline and
amorphous phases. The small amounts of Al found in the melt comes from the refractory material.
No big effects from leeching of Al in the material could be seen in this study. However, this should be
expected if the materials would be exposed for a longer time. Especially if the melt are continuously
replaced, as it would be in a real process.
Vibron’s matrix was only attacked down to about 200 µm from the exposed surface and the attacked
layer was continuous and fairly homogenous. This can be seen in the example in Figure 13. The
difference between pure melt and attacked refractory material is somewhat difficult to distinguish,
indicating that melt and refractory has fused together. This part was in general richer in K than Ca,
while layers of melt higher up were dominated by Ca. If this process proceeds, the refractory may be
worn down or have materials exchanged for slag with risk of changed physical properties. Even
though the matrix looks porous, and somewhat spacy, the melt has not penetrated far down.
Victor’s matrix showed a somewhat different behavior; no continuous and homogenous layer
formed and there were a more distinguishable border between melt and refractory material. The
matrix had been attacked in spots, mainly by K and melt had found its way into cracks and porous
areas.
Questions and thoughts
Since this melt are filling cracks and cavities on the surface of the material; this may be a potential
mechanism to induce further propagation of the cracks during heating/cooling cycles depending on
coefficients of expansion in material and melt.
The viscosity of the melt will be one factor that determines how far into the material the melt will
enter. Here, the temperature gradient through the material will and play a role. The temperature will
decrease with the distance from the hot face into the refractory material and subsequently the
viscosity will increase and inhibit the melt intrusion. The lining on the PEBG-reactor is 7.5 cm thick,
and has a temperature gradient of about 80°C, and as we saw, the melt had penetrated 1 mm at the
most for the present materials. So the temperature gradient will probably not have much effect on
the penetration of melt. But it should be remembered that small temperature differences can have
big effects on viscosity, or if the temperatures are close to crystallization points a few degrees can
make difference between liquid or solid.
6.2.2. Samples exposed to K2CO3-CaCO3
Remarkable differences on surface and matrix attack were observed when Si was absent. First of all
no melt were formed, only a fine powder assumed to be CaO was left on the surface. Inside the
refractory, high concentrations of K could be found for both materials.
Vibron was attacked 2-3 mm down into the material and this part was discolored too. The affected
part seemed to have lost its porosity, as it were filled out by some K containing reaction product. It
showed a distinct border between attacked and pristine material, as can be seen in Figure 14 B. The
attack appears to be even and continuous. This distinct border between affected and pristine
material is likely to cause problems. The small region where the border is will be exposed to large
stress if there, at some point, are a mismatch in density (also depending on coefficient of expansion)
If the transition between affected and pristine material were distributed over a longer distance, the
stress would also be more evenly distributed in the material and decreasing the risk of failure.
32
The influence of this ash on Victor could be observed down to to about 2 mm of the material and did
not show any discoloration. The attacked parts occurred in patches and as irregular paths between
larger grains.
6.2.3. Samples exposed to K2CO3
These samples showed similar results as the previous but to a larger extent. For Vibron, the attacked
parts extended down to about 5 mm in the material and for Victor significant concentrations of K
could be found to a depth of 7-8 mm. In this case, i.e. Victor, the attack had gone further down into
the material in comparison with Vibron.
The reason for the larger attack is most likely due to the higher amount of K. (The synthetic ash was
reapplied 5 times during the exposure)
Vibron: This sample showed the same discoloration and distinct border between affected and
pristine matrix. Since it apparently only was K that reacted with the material, this was expected.
Except from that the attack had gone further down, a difference was that larger grains seemed to
have come loose after the exposure; as if the matrix had expanded but the grains stayed the same
size.
Victor: Again, attacks along irregular cracks and in patchy formations were observed for Victor. K
seems to be reacting and transporting relatively fast in the matrix compared to the attack on grains.
Since Victor is composed of less matrix, K finds its way into the material along the small matrix paths
and cavities in between the grains.
The matrix of Vibron seems to absorb the K while the matrix of Victor appears to be more
permeable. One reason for this could be that Vibron is containing more Si. Si is more likely to react
with K than Al. In the K2O-SiO2-Al2O3 phase diagram, there are melting points under 1000 °C in the
high SiO2 corner, along the K2O direction which implies that more Si means higher risk for low melting
K-silicates.25 In addition to this, Vibron contains more porous matrix material, so if the same volume
of matrix is needed to absorb a certain amount of K, the attack would have to go deeper into Victor.
Transport of K in the matrix
The melt formed when CaCO3 and SiO2 are present seems to keep the K from transporting far into
the sample. But when SiO2 is removed, K seems free to transport and react further into the material.
This goes for both materials.
6.3. Attack on grains In general, grains were more attacked if they had lower Al to Si ratio, but there were fluctuations in
both directions.
The XRD-results shows that mullite should be common in the materials, but few EDX-analyses
showed the proper ratio between Al and Si.
6.3.1. Porous grains with more Si than Al
These large grains characterized by pores developed a relatively large, homogenous reaction front
(up to 200 µm). These had a varying ratio between Al and Si but there were in most cases more Si. If
these grains are consisting of a glassy phase, the ratio between Al and Si is allowed to be floating,
and the transport of oxides is easier in a glassy phase than a crystalline. So if these grains are a glass,
that would agree with the varying Al to Si ratio and the large reaction front.
33
6.3.2. Grains with about equal amounts of Al and Si (two layer)
The EDX analysis showed that these grains did not have a composition making a single phase
possible. Mullite has an Al to Si ratio of 3:1, the only phase that holds more Si than this is composed
of pure SiO2. So these grains are likely to be composed of either a glass or a mixture of crystalline
phases. Possibly both, but should not be composed of a single crystalline phase. Sometimes these
grains developed two layers when attacked by K. In these layers, cracks were propagating
perpendicular to the grain boundaries but stopped after the second layer. No sign of enhanced attack
could be seen along these cracks, and therefore they must have been formed after the attack. It can
be seen on the attacked grain in the middle top of Figure 20, where the crack to the left has gone
further into the material than the second layer of attack, and around the crack there is a small
affected area in the grain. This crack must have formed before or during exposure for that to happen.
But where the crack runs in the second layer, there are no sign of enhanced attack. It would be
expected that a small area around the crack in the inner layer would have the same degree of attack
as the outer layer. If this crack was formed during cooling of the sample, the outer part of the grain
will cool off before the inner parts, so the temperatures might have been too low for a reaction to
take place in the inner layer around the crack, but high enough in the inner parts to form a small area
of reacted layer close to the crack. The reason for these cracks is likely to be differences in the
coefficient of thermal expansion for the phases in the new layers and the unreacted parts.
If the grains are composed of the product of heated kaolinite i.e. mullite grains in a silica matrix4, the
two layers can be explained from the SiO2-Al2O3-K2O phase diagram. Along the tie line SiO2-K2O there
are melting points below 1000°C.25 The product of heated kaolinite may contain crystals so small that
they cannot be detected with our equipment.
6.3.3. Grains with more Al than Si
The composition of these grains was still not matching any single phase crystalline compound. They
formed only one reacted layer that also was thinner than the layers formed on grains with more Si.
This is expected because K is more likely to react with Si than Al.
6.4. Sliced samples Because of the heterogeneity of the materials, large deviations in the mineral composition were
expected when compared to the analysis of the crushed, unexposed material, displayed in Table 4.
Due to the heterogeneity, a number of different non-global or local equilibrium conditions may
emerge (seeFigure 27). For instance; isolated grains of silica can react with gaseous K-species to low
melting K-silicates; mullite silica interfaces may upon exposure to gaseous K-species form silica rich
melts; isolated mullite grains and interfaces between mullite and alumina may upon exposure of
gaseous K-species react to form Leucite, and finally reaction with isolated Alumina grains and
gaseous K-species may form KAlO2. Previous investigations (see e.g. Scudeller24) indicate that
scenarios involving melts are the most important for the ash ceramic interactions. Thus the first two
of the conditions described above are believed to be most significant in the present study.
34
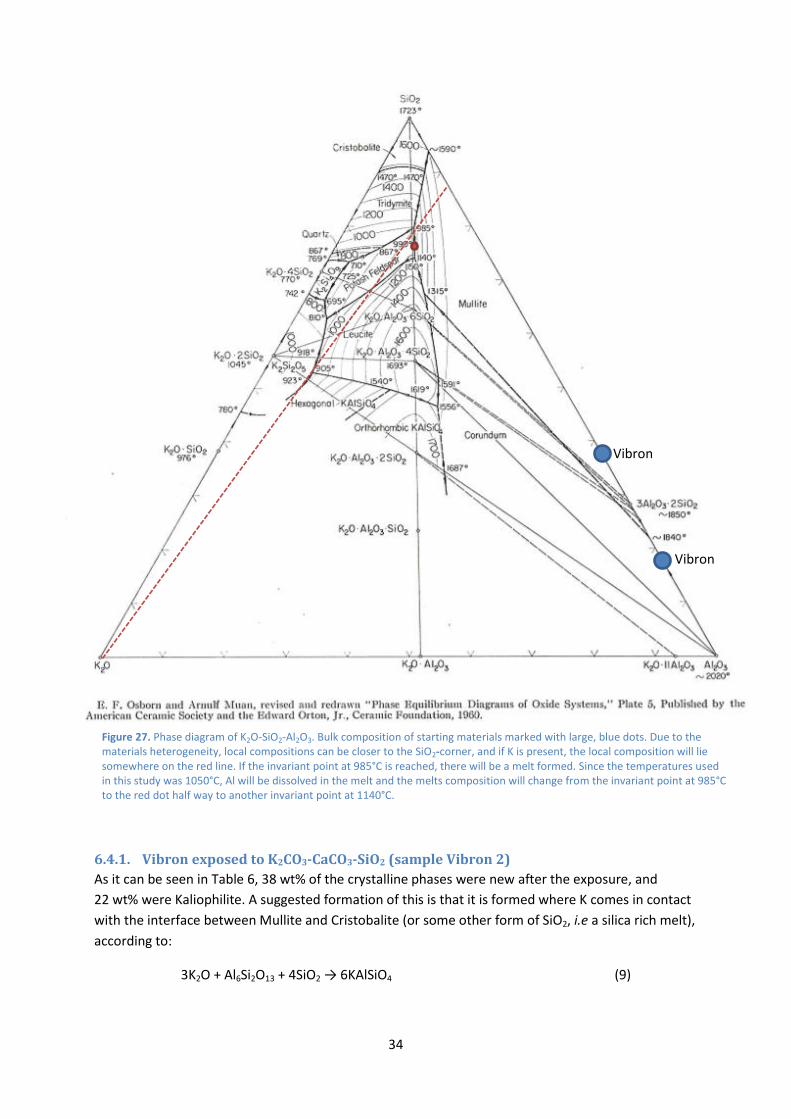
6.4.1. Vibron exposed to K2CO3-CaCO3-SiO2 (sample Vibron 2)
As it can be seen in Table 6, 38 wt% of the crystalline phases were new after the exposure, and
22 wt% were Kaliophilite. A suggested formation of this is that it is formed where K comes in contact
with the interface between Mullite and Cristobalite (or some other form of SiO2, i.e a silica rich melt),
according to:
3K2O + Al6Si2O13 + 4SiO2 → 6KAlSiO4 (9)
Figure 27. Phase diagram of K2O-SiO2-Al2O3. Bulk composition of starting materials marked with large, blue dots. Due to the materials heterogeneity, local compositions can be closer to the SiO2-corner, and if K is present, the local composition will lie somewhere on the red line. If the invariant point at 985°C is reached, there will be a melt formed. Since the temperatures used in this study was 1050°C, Al will be dissolved in the melt and the melts composition will change from the invariant point at 985°C to the red dot half way to another invariant point at 1140°C.
Vibron
Vibron
35
The second most common of the new phases is Leucite (11 wt%) and it is suggest that it is formed by
addition of SiO2 to Kaliophilite24:
KAlSiO4 + SiO2 → KAlSi2O6 (10)
On the other hand, since Leucite is only found for the samples exposed to K2CO3-CaCO3-SiO2, the
additional SiO2 is believed to come from the melt.
6.4.2. Victor exposed to K2CO3-CaCO3-SiO2 (sample Victor 1)
Kaliophilite and Leucite was seen in this sample too, but to a smaller extent than in Vibron. The
dominating new phase here was Wollastonite. Of the original phases only Corundum was observed.
The analysis of this sample were made on a surface mostly containing melt, with some refractory
parts visible, so it was expected to display a majority of new phases. The reason for the large amount
of Wollastonite may be that the investigated surface mainly consisted of melt. But, for the
corresponding Vibron sample no Wollastonite was identified. One explanation would be that the Al
required forming the larger amount of Kaliophilite and Leucite, comes from the more available
Mullite (in Vibron) close to the surface. Victor contains less Mullite, the Al is more in the form of
Corundum (pure Al2O3) and this phase seems to be less reactive, since the grains composed of mostly
Al seemed to be unaffected by the exposure. (See Figure 19). Therefore, it is not enough Al to form
more Kaliophilite or Leucite in the Victor samples.. Thus the excessive Si allows for formation
Wollastonite.
6.4.3. Vibron exposed to K2CO3 (sample Vibron 8)
The main new phase was K(2-x)Al(2-x)SixO4, a phase that is not given in the phase diagram in Figure 27.
However, there are a number of investigations on the pseudobinary system KAlO2 – KAlSiO4, where
solid solution exists26,27. Considering the directions of the compositional changes upon exposure of
K2O (see Figure 27) it is quite reasonable that this phase would form. No Leucite was found here,
indicating that the silica rich melt is required to form it. The function of the melt could either be a
way to provide Si or as a way to make Al available from the refractory.
6.4.4. Victor exposed to K2CO3 (sample Victor 9)
Lesser amount of new phases were formed here, compared to when exposed to K2O-SiO2-Al2O3. No
Leucite was formed in this case, but a small amount of K(2-x)Al(2-x)SixO4 could be found. The small
amount of new phases formed indicates that K either form glasses or does not react with the
material to same extent as for Vibron.
The original plan was to analyze surfaces all the way through the exposed parts of the samples but
was not entirely completed, partially because the work was more time consuming than expected and
partially because of problems with the instruments. There had to be given priority to a few samples
of interest for the Rietveld analysis to finish the project on time. The additional information that
would have been obtained if the original plan was fulfilled would be a relation between phase
changes and distance to the exposed surface.
6.5. Suggestions for improvement and future use of method The extensive XRD analysis is very time consuming. Instead of investigating every layer, one could
choose a few relevant depths. Another way to do this is if a layer could be removed from the sample,
pulverized and examined with XRD. Another way to examine formation of phases is to use a method
36
used by Stjernberg; crush the refractory material to a powder and mix it with the synthetic ash and
expose to heat, then examine with XRD.
Further information on the components of the refractory materials would be of value. To isolate all
components and expose them to the ashes, K, in first hand, since that was the most active element in
this study. Accurate measurements of changes in physical properties should then be possible to do
for the different components. For example: the thermal coefficient of expansion and density of the
matrix after the K attack.
7. Conclusions K is the most active element in chemical attack on the used materials. Ca does not seem to
have any direct effect on the material but it takes part in the formation of melt when the ash
is composed of K2O, CaCO3 and SiO2.
The melt formed when K2O, CaCO3 and SiO2 are present seems to restrain K from far
penetration into the materials.
A difference between Victor’s and Vibron’s matrix is that the later absorb K while the former
more seem to be letting it through. A distinct border between attacked and pristine matrix in
Vibron is developed. For Victor no such border can be seen.
K is transported faster in matrix than in grains. The matrix becomes a distribution path and a
key to attack on grains.
Some grains with about the same concentration of Al and Si developed two distinct reacted
layers.
Grains with about 80 wt% Al or more did not show any sign of being attacked at all.
Grains larger than ~200 µm developed a reacted outer layer with cracks propagating inwards.
These cracks stopped when they reached the unreacted part of the grain. Smaller grains
formed a homogenous attacked layer through the whole grain and fewer cracks were
observed.
Vibron’s matrix showed signs of expansion after deep attack of K: Larger grains hade come
loose and begun to separate from the material.
A similar exposure on the matrixes and all common grain types separated would provide
valuable information on whether the components are compatible with each other after
being attacked by K.
The composition of the individual components of the materials should be considered
The XRD analysis of the pristine and exposed refractories revealed significant differences.
The starting materials were composed of various amounts of Cristobalite, Mullite (Andalusite
and Sillemanite) and corundum. In the exposed ceramics the new phases; Leucite, Kalsilite,
Kaliophilite, K(2-x)Al(2-x)SixO4 and Wollastonite were observed.
37
8. Acknowledgements Thanks to my supervisors Dan Boström and Rainer Backman at Umeå universitet/TFE for the
guidance through this work.
Thanks to Britt Andersson at Umeå universitet/TFE-KBC for helping me with the problems with the
SEM that occurred during the work.
Thanks to Nils Skoglund Umeå universitet/TFE-KBC for technical help with the SEM and XRD when
those have not been working properly.
Thanks to the people working at ex ETPC during my work there for valuable discussions and inputs.
9. References
1 Higman, C.; van der Burgt, M., Gasification¸second edition, Elsevier2008
2 U.S. Department of energy Report, Gasification Markets and Technologies – Present and Future, July 2002
3 Ma, C.; Weiland, F.; Boström, D.; Backman, R.; Öhman, M. Ash formation during pilot-scale trials of
pressurized entrained-flow woody biomass, Impacts of fuel quality on power production and the environment conference, Austria, Pucberg 23-09-2012 4 Kingery, W. D.; Bowen, H. K.; Uhlmann, D. R., Introduction to Ceramics, second edition, John Wiley & Sons,
1976 5 Atkins, P.; de Paula, J., Atkins’ Physical Chemistry, eight edition, Oxford university press, 2006
6 Munson, B. R.; Young, D. F.; Okiishi, T. H.; Fundamentals of Fluid Mechanics, fifth edition, John Wiley & Sons,
2006 7 Olofsson, I.; Nordin, A.; Söderlind, U., Initial Review and Evaluation of Process Technologies and Systems
Suitable for Cost-Efficient Medium-Scale Gasification for Biomass to Liquid Fuels, ISSN 1653-0551 ETPC Report 05-02 8 Callister, W. D.; Rethwisch D. G., Materials Science and Engineering, eight edition, John Wiley & Sons, 2011
9 Schacht, C. A., Refractories Handbook, Taylor & Francis group, 2004
10 Stjernberg, J., Degradation Mechanisms in Refractory Lining Materials of Rotary Kilns for Iron Ore Pellet
Production, Doctoral Thesis, Luleå University of Technology, 2012 11
Höganäs Bjuf webpage. http://brilliant.hoganasbjuf.com/en/Applications/Pulp-and-Paper visited 2013-01-14 12
H. Merker, Refractory lining of lime shaft and rotary kilns including suggestions concerning specific problems, part 1. ZKG international Volume 54, No 5, 2001 13
H. Merker, Refractory lining of lime shaft and rotary kilns including suggestions concerning specific problems, part 2. ZKG international Volume 54, No 6, 2001 14
Kääntee, U.; Zevenhoven R.; Backman, R.; Hupa, M., Cement manufacturing using alternative fuels and the advantages of process modeling, Fuel Processing Technology, 85 (2004), 293-301 15
Lyman Holley, A., The Bessemer Process and Works in the United States, Troy Daily Times, July 27, 1868 (Google eBook) 16
Hogmark, S.; Jacobson, S.; Kassman-Rudolphi, Å.; Svepelektronmikroskopi i Praktik och Teori, Ångströmlaboratoriet Uppsala Universitet, 2010. 17
Rietveld, Hugo M.; Modern Rietveld Analysis Preface, ZEITSCHRIFT FUR KRISTALLOGRAPHIE Volume: 226 Issue: 12 Pages: IV-IV, 2011 18
Fachinformationszentrum Karlsruhe Germany. Version 2012-2 19
Okamoto, Y., Structural modification of KAlSiO4 Minerals. Okayama university Earth science report vol 4 no. 1 (1997), 41-72 20
Burmakin, E. I.;Voronin, V. I.; Akhtyamova, L. Z.; Berger, I.F.; Shekhtman, G. Sh. Rusian Journal of electrochemistry 2004, vol 40, issue 6, 619-625 21
Ueno, S.; Ohji, T.; Lin H-T., Corrosion and recession of mullite in water vapor environment, Journal of the European Ceramic Society 28 (2008) 431-435

38
22
Takahash, J.; Kawai, Y.; Shimada, S., Hot Corrosion of Cordierite Ceramics by Na- and K-salts, Journal of the European Ceramic Society 18 (1998) 1121-1129 23
Takahashi, J.; Kawai, Y.; Shimada, S., Hot corrosion of cordierite/mullite composites by Na-salts, Journal of the European Ceramic Society 22 (2002), 1959-1969 24
Scudeller L. A. M.; Potassium Vapor Attack in Refractories of the Alumina-Silica System, Journal of the American Ceramic Society, 73, (1990), 5, 1413-1416 25
Osborn, E. F.; Muan, A., Revised and redrawn Phase Equilibrium Diagrams Of Oxide System, Plate 5, The American Ceramic Society and the Edward Orton Jr., Ceramic Foundation 1960 26
Shamus L. G. Husheer, John G. Thompson, and Alexandra Melnitchenko. Cristobalite-Related Phases in the KAlO2+KAlSiO4 System, Journal of Solid State Chemistry 147, 624-630 (1999) 27
Yazhenskikh, E.; Hack, K.;Müller, M., Critical thermodynamic evaluation of oxide systems relevant to fuel
ashes and slags, Part 5: Potassium oxide–alumina–silica CALPHAD: Computer Coupling of Phase Diagrams and Thermochemistry 35 (2011) 6–19