exponential functions - haesemathematics.com · b graphs of exponential functions example 1 self...
TRANSCRIPT

19Chapter
Exponentialfunctions
Contents:
Syllabus reference: 4.4
A
B
C
Evaluating exponentialfunctions
Graphs of exponentialfunctions
Growth and decay
IB_STSL-2edmagentacyan yellow black
0 05 5
25
25
75
75
50
50
95
95
100
100 0 05 5
25
25
75
75
50
50
95
95
100
100
Y:\HAESE\IB_STSL-2ed\IB_STSL-2ed_19\581IB_STSL-2_19.CDR Monday, 15 February 2010 4:08:42 PM PETER

OPENING PROBLEM
Bacteria reproduce by dividing themselves
in two to create two ‘daughter’ cells. A
Petri dish contains a colony of 10 million
bacteria. It takes one hour for each of these
bacteria to divide into two bacteria, so every hour the
total number of bacteria doubles. We can make a table
which shows the population b million bacteria over time
t hours.
t (hours) 0 1 2 3 4
b (millions) 10 20 40 80 160
Things to think about:
a
b If b is plotted against t, what shape do these points form on a graph?
c Is it reasonable to connect the points with a smooth curve?
d What function can be used to model the bacteria population over time?
The growth pattern in the Opening Problem can be
shown on a graph like the one alongside.
Since not all the bacteria will divide at the same
time, but rather throughout the hour, it is reasonable
to join the points with a smooth curve. This allows
us to estimate how many bacteria are alive at times
other than on the hour. For example, at 11
2hours
there are about 28 million bacteria present.
However, drawing a curve on a graph and then
reading off values is not a very precise way to
investigate the colony. It would be better to have
an equation linking t and b.
Using our knowledge from Chapter 14, we see that the population after each hour forms a
geometric sequence with common ratio 2. The general term of the sequence is
bt = 20£ 2t¡1.
We therefore use the function b(t) = 20£ 2t¡1
= 2£ 10£ 2t¡1
= 10£ 2t
Functions of this form are called exponential functions because the variable appears in an
exponent.
0
20
40
60
80
100
120
140
160
180
0 1 2 3 4 5
t (hours)
b (millions of bacteria)
What type of series do these values form?
However, we are also interested in what happens when is not an integer.t
582 EXPONENTIAL FUNCTIONS (Chapter 19)
IB_STSL-2edmagentacyan yellow black
0 05 5
25
25
75
75
50
50
95
95
100
100 0 05 5
25
25
75
75
50
50
95
95
100
100
Y:\HAESE\IB_STSL-2ed\IB_STSL-2ed_19\582IB_STSL-2_19.CDR Monday, 15 February 2010 4:09:16 PM PETER

For the function f(x) = 3x + 5, find:
a f(6) b f(0) c f(¡2)
a f(6) = 36 + 5
= 729 + 5
= 734
b f(0) = 30 + 5
= 1 + 5
= 6
c f(¡2) = 3¡2 + 5
=1
32+ 5
= 51
9
EXERCISE 19A
1 If f(x) = 2x ¡ 3, find:
a f(2) b f(1) c f(0) d f(¡1) e f(¡2)
2 If f(x) = 5£ 3x, find:
a f(1) b f(3) c f(0) d f(¡4) e f(¡1)
3 If f(x) = 2x+1, find:
a f(4) b f(0) c f(1) d f(¡1) e f(¡5)
4 If g(x) = 5¡x, find:
a g(1) b g(3) c g(0) d g(¡2) e g(¡3)
5 If h(x) = 3£ (1:1)x, use your calculator to evaluate the following:
a h(0) b h(1) c h(5) d h(¡2) e h(3:8)
For example, y = 2x is an exponential function.
We construct a table of values from which we graph
the function:
x ¡3 ¡2 ¡1 0 1 2 3
y 1
8
1
4
1
21 2 4 8
We notice that when x = ¡10, y = 2¡10 ¼ 0:001
and when x = ¡50, y = 2¡50 ¼ 8:88£ 10¡16.
As x becomes large and negative, the graph of y = 2x
approaches the x-axis from above it.
GRAPHS OF EXPONENTIAL FUNCTIONSB
Example 1 Self Tutor
A EVALUATING EXPONENTIAL FUNCTIONS
y
1
1
-2-3 -1 2 3
2
4
6
8
y = 2x
x
The simplest exponential functions have the form y = ax where a > 0, a 6= 1.
583EXPONENTIAL FUNCTIONS (Chapter 19)
IB_STSL-2edmagentacyan yellow black
0 05 5
25
25
75
75
50
50
95
95
100
100 0 05 5
25
25
75
75
50
50
95
95
100
100
Y:\HAESE\IB_STSL-2ed\IB_STSL-2ed_19\583IB_STSL-2_19.CDR Monday, 15 February 2010 4:09:19 PM PETER

EXPONENTIAL GRAPHSINVESTIGATION 1
We say that y = 2x is ‘asymptotic to the x-axis’ or ‘y = 0 is a horizontal asymptote’.
We use the notation x ! a to say that x approaches the value a. We also write x ! 1to show that x becomes infinitely large.
In this example, as x ! 1, y ! 1, and as x ! ¡1, y ! 0.
The object of this investigation is to examine the graphs of
various families of exponential functions.
1 a On the same set of axes, use a graphing package or graphics calculator to
graph the functions: y = 2x, y = 3x, y = 10x, y = (1:3)x.
b The functions in a are all members of the family y = ax.
i What effect does changing a have on the shape of the graph?
ii What is the y-intercept of each graph?
iii What is the horizontal asymptote of each graph?
2 a On the same set of axes, use a graphing package or graphics calculator to
graph the functions: y = 2x, y = 2x + 1, y = 2x ¡ 2.
b The functions in a are all members of the family y = 2x + c where c is a
constant.
i What effect does changing c have on the position of the graph?
ii What effect does changing c have on the shape of the graph?
iii What is the horizontal asymptote of each graph?
iv What is the horizontal asymptote of y = 2x + c?
c To graph y = 2x + c from y = 2x, what transformation is used?
3 a On the same set of axes, use a graphing package or graphics calculator to
graph the functions y = 2x and y = 2¡x.
b i What is the y-intercept of each graph?
ii What is the horizontal asymptote of each graph?
iii Describe how the graphs of y = 2x and y = 2¡x are related.
4 a On the same set of axes, use a graphing package or graphics calculator to
graph the functions: y = 2x, y = 22x, y = 2¡x, y = 21
2x and y = 2¡3x.
b The functions in a are all members of the family y = 2¸x.
i What effect does changing ¸ have on the shape of the graph?
ii What is the y-intercept of each graph?
iii What is the horizontal asymptote of each graph?
5 a On the same set of axes, use a graphing package or graphics calculator to
graph the following sets of functions:
i y = 2x, y = 3£ 2x, y = 1
2£ 2x
GRAPHING
PACKAGE
What to do:
584 EXPONENTIAL FUNCTIONS (Chapter 19)
IB_STSL-2edmagentacyan yellow black
0 05 5
25
25
75
75
50
50
95
95
100
100 0 05 5
25
25
75
75
50
50
95
95
100
100
Y:\HAESE\IB_STSL-2ed\IB_STSL-2ed_19\584IB_STSL-2_19.CDR Monday, 15 February 2010 4:09:22 PM PETER
ii y = ¡2x, y = ¡3£ 2x, y = ¡1
2£ 2x
b The functions in a are all members of the family y = k £ 2x where k is a
constant. Comment on the effect on the graph when i k > 0 ii k < 0.
c What is the horizontal asymptote of each graph? Explain your answer.
From your investigation you should have discovered that:
For the general exponential function y = ka¸x + c
² a and ¸ control how steeply the graph increases or decreases
² c controls vertical translation and y = c is the equation of the horizontal asymptote.
I if k > 0, a¸ > 1the function is
increasing.
I if k > 0, 0 < a¸ < 1the function is
decreasing.
I if k < 0, a¸ > 1the function is
decreasing.
I if k < 0, 0 < a¸ < 1the function is
increasing.
We can sketch reasonably accurate graphs
of exponential functions using:
² the horizontal asymptote
² the y-intercept
² two other points, for example,
when x = 2, x = ¡2
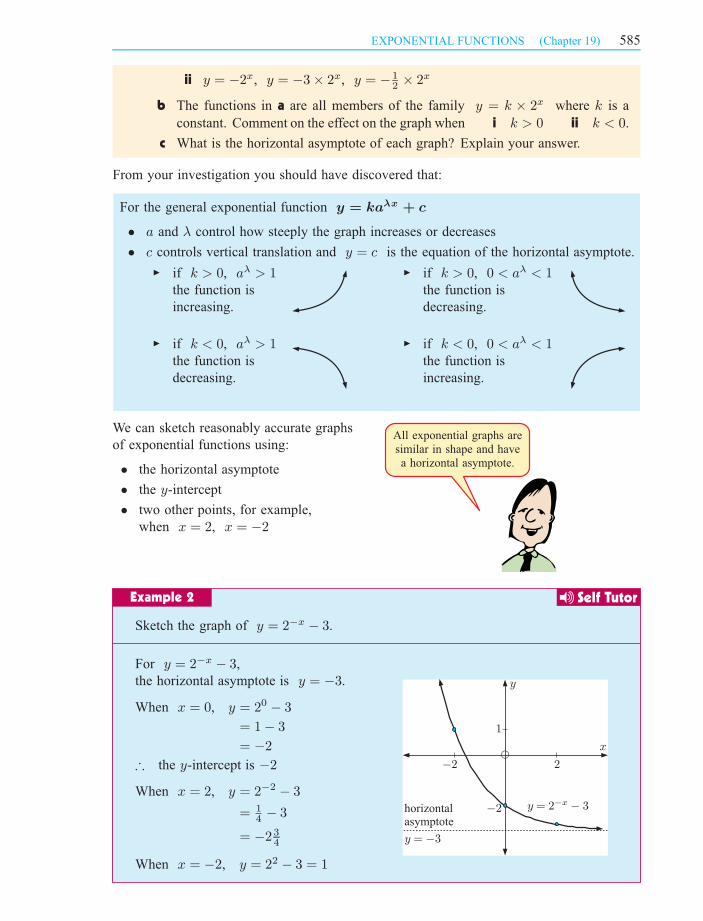
Sketch the graph of y = 2¡x ¡ 3.
For y = 2¡x ¡ 3,
the horizontal asymptote is y = ¡3.
When x = 0, y = 20 ¡ 3
= 1¡ 3
= ¡2
) the y-intercept is ¡2
When x = 2, y = 2¡2 ¡ 3
= 1
4¡ 3
= ¡23
4
When x = ¡2, y = 22 ¡ 3 = 1
Example 2 Self Tutor
All exponential graphs are
similar in shape and have
a horizontal asymptote.
y
x
-2 2
horizontalasymptote
y = 2 - 3-x
y = -3
-2
1
585EXPONENTIAL FUNCTIONS (Chapter 19)
IB_STSL-2edmagentacyan yellow black
0 05 5
25
25
75
75
50
50
95
95
100
100 0 05 5
25
25
75
75
50
50
95
95
100
100
Y:\HAESE\IB_STSL-2ed\IB_STSL-2ed_19\585IB_STSL-2_19.CDR Monday, 15 February 2010 4:09:25 PM PETER

EXERCISE 19B
1 Given the graph of y = 2x we can
estimate values of 2x for various values
of x.
For example:
² 21:8 ¼ 3:5 (point A)
² 22:3 ¼ 5 (point B)
Use the graph to determine approximate
values of:
a 21
2 (=p2) b 20:8
c 21:5 d 2¡1:6
e 2p2 f 2¡
p2
2 Draw freehand sketches of the following pairs of graphs using your
observations from the previous investigation:
a y = 2x and y = 2x ¡ 2 b y = 2x and y = 2¡x
c y = 2x and y = 22x d y = 2x and y = 2(2x)
3 Draw freehand sketches of the following pairs of graphs:
a y = 3x and y = 3¡x b y = 3x and y = 3x + 1
c y = 3x and y = ¡3x d y = 3x and y = 3¡2x
4 Sketch the graphs of:
a y = 2x + 1 b y = 2¡ 2x c y = 2¡x + 3 d y = 3¡ 2¡x
5 Use your graphics calculator to graph the functions in question 4. In each case find the
value of y when x =p2.
6 For the graphs of the functions in question 4, discuss the behaviour of y as x ! §1.
Hence determine the horizontal asymptotes for each graph.
In this section we will examine situations where quantities are either increasing or decreasing
exponentially. These situations are known as growth and decay, and occur frequently in the
world around us.
For example, populations of animals, people, and bacteria usually grow in an exponential
way. Radioactive substances, and items that depreciate in value, usually decay exponentially.
GROWTH AND DECAYC
11
11-1-1-2-2 22
22
33
44
55
yy
xx
H.A. y = 0H.A. y = 0
AA
BB
y = 2xy = 2x
GRAPHING
PACKAGE
586 EXPONENTIAL FUNCTIONS (Chapter 19)
IB_STSL-2edmagentacyan yellow black
0 05 5
25
25
75
75
50
50
95
95
100
100 0 05 5
25
25
75
75
50
50
95
95
100
100
Y:\HAESE\IB_STSL-2ed\IB_STSL-2ed_19\586IB_STSL-2_19.CDR Monday, 15 February 2010 4:09:27 PM PETER
GROWTH
Consider a population of 100 mice which under
favourable conditions is increasing by 20% each
week. To increase a quantity by 20%, we multiply
it by 120% or 1:2.
If Pn is the population after n weeks, then
P0 = 100 fthe original populationgP1 = P0 £ 1:2 = 100£ 1:2
P2 = P1 £ 1:2 = 100£ (1:2)2
P3 = P2 £ 1:2 = 100£ (1:2)3, and so on.
From this pattern we see that Pn = 100£ (1:2)n.
Alternatively:
This is an example of a geometric sequence and we could find the rule to generate it.
Clearly P0 = 100 and r = 1:2, so Pn = P0rn = 100£ (1:2)n for n = 0, 1, 2, 3, ....
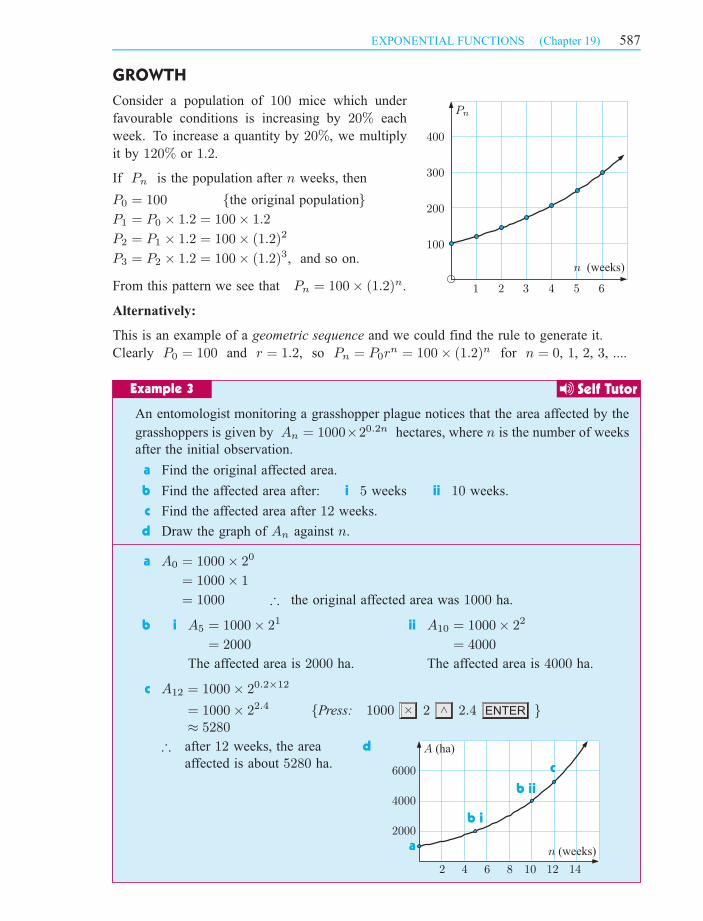
An entomologist monitoring a grasshopper plague notices that the area affected by the
grasshoppers is given by An = 1000£20:2n hectares, where n is the number of weeks
after the initial observation.
a Find the original affected area.
b Find the affected area after: i 5 weeks ii 10 weeks.
c Find the affected area after 12 weeks.
d Draw the graph of An against n.
a A0 = 1000£ 20
= 1000£ 1
= 1000 ) the original affected area was 1000 ha.
b i A5 = 1000£ 21
= 2000
The affected area is 2000 ha.
ii A10 = 1000£ 22
= 4000
The affected area is 4000 ha.
c A12 = 1000£ 20:2£12
= 1000£ 22:4 fPress: 1000 £ 2 ^ ENTER g¼ 5280
) after 12 weeks, the area
affected is about 5280 ha.
d
Example 3 Self Tutor
2 4:
100
200
300
400
Pn
n (weeks)
1 2 3 4 5 6
b ib i
a
1412108642
6000
4000
2000
A (ha)
n (weeks)
cc
b iib ii
587EXPONENTIAL FUNCTIONS (Chapter 19)
IB_STSL-2edmagentacyan yellow black
0 05 5
25
25
75
75
50
50
95
95
100
100 0 05 5
25
25
75
75
50
50
95
95
100
100
Y:\HAESE\IB_STSL-2ed\IB_STSL-2ed_19\587IB_STSL-2_19.CDR Monday, 15 February 2010 4:09:30 PM PETER

EXERCISE 19C.1
1 A weed in a field covers an area of A(t) = 3£ 20:1t square metres after
t days.
a Find the initial area the weed covered.
b Find the area after: i 2 days ii 10 days iii 30 days.
c Sketch the graph of A(t) against t using the results of a and b only.
d Use technology to graph Y1 = 3£ 20:1X and check your answers to a, b and c.
2 A breeding program to ensure the survival of pygmy possums was established with an
initial population of 50 (25 pairs). From a previous program, the expected population
Pn in n years’ time is given by Pn = P0 £ 1:23n.
a What is the value of P0?
b What is the expected population after: i 2 years ii 5 years iii 10 years?
c Sketch the graph of Pn against n using a and b only.
d Use technology to graph Y1 = 50£ 1:23X and check your answers to b.
3 The speed Vt of a chemical reaction is given by Vt = V0 £ 20:05t where t is the
temperature in oC. Find:
a the speed at 0oC b the speed at 20oC
c the percentage increase in speed at 20oC compared with the speed at 0oC.
d Find
µV50 ¡ V20
V20
¶£ 100%. What does this calculation represent?
4 Six pairs of bears were introduced in 1998 to a large island off Alaska where previously
there were no bears. It is expected that the population will increase according to
Bt = B0 £ 20:18t where t is the time since the introduction.
a Find B0. b Find the expected bear population in 2018.
c Find the expected percentage increase from 2008 to 2018.
DECAY
Consider a radioactive substance with original
weight 20 grams. It decays or reduces by 5%
each year. The multiplier is thus 95% or 0:95.
If Wn is the weight after n years, then:
W0 = 20 grams
W1 = W0 £ 0:95 = 20£ 0:95 grams
W2 = W1 £ 0:95 = 20£ (0:95)2 grams
W3 =...
W2 £ 0:95 = 20£ (0:95)3 grams
W20 =...
20£ (0:95)20 ¼ 7:2 grams
W100 = 20£ (0:95)100 ¼ 0:1 grams
From this pattern we see that Wn = 20£ (0:95)n.
GRAPHING
PACKAGE
10 20
25
20
15
10
5
Wn (grams)
n (years)
588 EXPONENTIAL FUNCTIONS (Chapter 19)
IB_STSL-2edmagentacyan yellow black
0 05 5
25
25
75
75
50
50
95
95
100
100 0 05 5
25
25
75
75
50
50
95
95
100
100
Y:\HAESE\IB_STSL-2ed\IB_STSL-2ed_19\588IB_STSL-2_19.CDR Monday, 15 February 2010 4:09:33 PM PETER
Alternatively:
Once again we have a geometric sequence.
In this case W0 = 20 and r = 0:95, so Wn = 20£ (0:95)n for n = 0, 1, 2, 3, ....
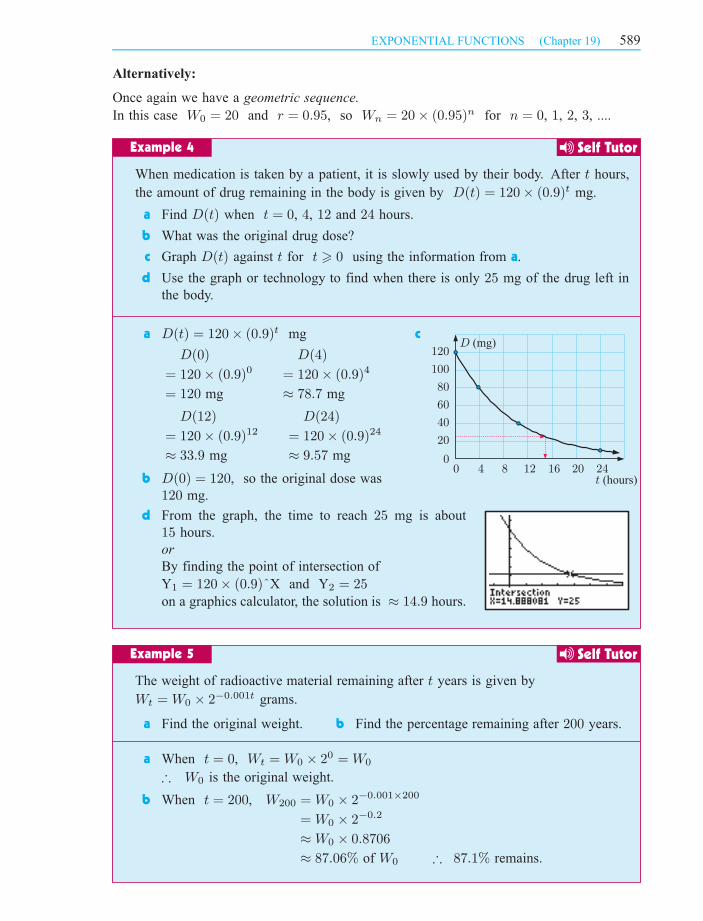
When medication is taken by a patient, it is slowly used by their body. After t hours,
the amount of drug remaining in the body is given by D(t) = 120£ (0:9)t mg.
a Find D(t) when t = 0, 4, 12 and 24 hours.
b What was the original drug dose?
c Graph D(t) against t for t > 0 using the information from a.
d Use the graph or technology to find when there is only 25 mg of the drug left in
the body.
a D(t) = 120£ (0:9)t mg
D(0)
= 120£ (0:9)0
= 120 mg
D(4)
= 120£ (0:9)4
¼ 78:7 mg
D(12)
= 120£ (0:9)12
¼ 33:9 mg
D(24)
= 120£ (0:9)24
¼ 9:57 mg
c
b D(0) = 120, so the original dose was
120 mg.
d From the graph, the time to reach 25 mg is about
15 hours.
or
By finding the point of intersection of
Y1 = 120£ (0:9)^X and Y2 = 25on a graphics calculator, the solution is ¼ 14:9 hours.
The weight of radioactive material remaining after t years is given by
Wt = W0 £ 2¡0:001t grams.
a Find the original weight. b Find the percentage remaining after 200 years.
a When t = 0, Wt = W0 £ 20 = W0
) W0 is the original weight.
b When t = 200, W200 = W0 £ 2¡0:001£200
= W0 £ 2¡0:2
¼ W0 £ 0:8706
¼ 87:06% of W0 ) 87:1% remains.
Example 5 Self Tutor
Example 4 Self Tutor
t (hours)241612840
120
100
80
60
40
20
020
D (mg)
589EXPONENTIAL FUNCTIONS (Chapter 19)
IB_STSL-2edmagentacyan yellow black
0 05 5
25
25
75
75
50
50
95
95
100
100 0 05 5
25
25
75
75
50
50
95
95
100
100
Y:\HAESE\IB_STSL-2ed\IB_STSL-2ed_19\589IB_STSL-2_19.CDR Wednesday, 3 March 2010 4:45:20 PM PETER

EXERCISE 19C.2
1 The weight of a radioactive substance t years after being buried is given by
W (t) = 250£ (0:998)t grams.
a How much radioactive substance was initially buried?
b Determine the weight of the substance after:
i 400 years ii 800 years iii 1200 years.
c Sketch the graph of W (t) for t > 0, using the above information.
d Use your graph or graphics calculator to find how long it takes for the substance to
decay to 125 grams.
2 The temperature T of a liquid which has been placed in a refrigerator is given by
T (t) = 100£ 2¡0:02t oC where t is the time in minutes. Find:
a the initial temperature
b the temperature after: i 15 minutes ii 20 minutes iii 78 minutes.
c Sketch the graph of T (t) for t > 0 using a and b only.
3 The current in a radio t seconds after it is switched off is given by
It = 0:6£ 2¡5t amps.
a Find the initial current.
b Find the current after:
i 0:1 seconds ii 0:5 seconds iii 1 second.
c Graph It against t using a and b only.
4 The intensity of light in the ocean d metres below the surface is given by
L(d) = L0 £ (0:9954)d candelas. Find:
a the light intensity at sea level
b the percentage intensity decrease at 1000 metres.
5 The value of a car depreciates according to the formula Ct = 4500£0:68t+500 euros,
where t is the age of the car in years.
a Sketch a graph of Ct against t. b What was the initial cost of the car?
c How much is the car worth after 41
2years?
d State the equation of the horizontal asymptote of Ct. What does this mean?
6 The population of turtles in a lake decreases each
year to 93% of the previous year. In 2005 there
were 340 turtles in the lake.
a
b Graph your model from a.
c How many turtles were in the lake in 2010?
d If the population falls as low as 10, conservationists will not be able to save the
turtle colony. According to your model, when will this occur?
590 EXPONENTIAL FUNCTIONS (Chapter 19)
Find a model for the number of turtles T
in the lake, n years after 2005. Your model
should have the form T = T0 £ an.
IB_STSL-2edmagentacyan yellow black
0 05 5
25
25
75
75
50
50
95
95
100
100 0 05 5
25
25
75
75
50
50
95
95
100
100
Y:\HAESE\IB_STSL-2ed\IB_STSL-2ed_19\590IB_STSL-2_19.CDR Friday, 5 March 2010 9:32:09 AM PETER
CONTINUOUS COMPOUND INTERESTINVESTIGATION 2
In Chapter 15 we used the compund interest formula A = C¡1 + r
100k
¢knwhere A is the final amount, C is the initial amount,
r is the interest rate per annum,
k is the number of times interest is compounded per year,
n is the number of years.
We can see now that this is an exponential function.
In this investigation we look at the final value of an investment for various values of k,
and allow k to get extremely large.
What to do:
1 Suppose $1000 is invested for one year at a fixed rate of 6% per annum. Use your
calculator to find the final amount or maturing value if the interest is paid:
a annually b quarterly c monthly
d daily e by the second f by the millisecond.
Comment on your answers.
2 If we let a =100k
r, show that A = C
·µ1 +
1
a
¶a¸ r
100n
.
3 For continuous compound growth, the number of interest payments per year k gets
very large.
a Explain why a gets very large as k gets very large.
b Copy and complete, giving your answers as accurately as technology permits:
a 10 100 1000 10 000 100 000µ1 +
1
a
¶a
4 You should have found that for very large values of a,µ1 +
1
a
¶a
¼ 2:718 281 828 459 ::::
This is a special number in mathematics called e. e is an irrational number like ¼.
Use the ex key of your calculator to find the value of e1.
5 For continuous growth, A = Cer
100n where C
r
n
is the initial amount
is the annual percentage rate
is the number of years
Use this formula to find the final value if $1000 is invested for 4 years at a fixed
rate of 6% per annum, where the interest is calculated continuously.
591EXPONENTIAL FUNCTIONS (Chapter 19)
IB_STSL-2edmagentacyan yellow black
0 05 5
25
25
75
75
50
50
95
95
100
100 0 05 5
25
25
75
75
50
50
95
95
100
100
Y:\HAESE\IB_STSL-2ed\IB_STSL-2ed_19\591IB_STSL-2_19.CDR Monday, 15 February 2010 4:09:41 PM PETER

REVIEW SET 19B
REVIEW SET 19A
592 EXPONENTIAL FUNCTIONS (Chapter 19)
1 If f(x) = 3£ 2x, find the value of:
a f(0) b f(3) c f(¡2)
2 a Graph y = 3x, y = 3¡x and y = 3x + 1 on the same set of axes.
b Discuss the behaviour of y as x ! §1 for each of these graphs.
3
a Find the original value of the autograph.
b How much was the autograph worth in: i 1970 ii 1990 iii 2010?
c Draw the graph of V against t.
d When was the autograph worth $1000?
1 If f(x) = 5x+1, find: a f(2) b f(0) c f(¡4)
2 On the same set of axes draw the graphs of: a y = 2x b y = 2x ¡ 4.
In each case state the y-intercept and the equation of the horizontal asymptote.
3 The weight of a lump of radioactive plutonium after t years is given by
Wt = W0 £ 2¡0:07t grams.
a Find the original weight of the plutonium.
b Find the percentage remaining after: i 10 years ii 50 years.
c When has the weight remaining decayed to 1% of the original level?
4 8 pairs of rhinoceroses are introduced onto an Indonesian island. The expected
population Pn after n years is given by Pn = P0 £ 1:03n.
a Find P0.
b Find the expected population after 25 years.
c Once there are 40 pairs of rhinoceroses, a new colony can be formed. When is
this expected to occur?
4
a Find T0.
b
c
Tt = T0 £ 2¡0:133t oC.
An autograph by Marilyn Monroe had value V = 20£1:12t dollars, where t is the
number of years after 1960.
time (min)t
0
20
40
60
80
100
120
140
160
180
200
0 10 20 30
temperature (°C)T
40
The graph opposite shows the
temperature of a pie put in the fridge
immediately after it is cooked. The
temperature after minutes is given
by
T t
What is the temperature of the pie
after minutes?20
The pie is to be served at C.
How long after cooking can it be
served?
5o
IB_STSL-2edmagentacyan yellow black
0 05 5
25
25
75
75
50
50
95
95
100
100 0 05 5
25
25
75
75
50
50
95
95
100
100
Y:\HAESE\IB_STSL-2ed\IB_STSL-2ed_19\592IB_STSL-2_19.CDR Friday, 5 March 2010 9:45:49 AM PETER