explosive, tatp, in a vapour flow. supporting information ... · explosive, tatp, in a vapour flow....
TRANSCRIPT

S1
Supporting Information
Surface Functionalized Silica Nanoparticles for the Off-On Fluorogenic Detection of an Improvised Explosive, TATP, in a Vapour Flow.
José García-Calvo,a Patricia Calvo-Gredilla,a Marcos Ibáñez-Llorente,a Daisy C. Romero,a José V. Cuevas,a Gabriel García-Herbosa,a Manuel Avella,b Tomás Torroba,a,*
a.- Department of Chemistry, Faculty of Science, University of Burgos, 09001 Burgos, Spain.
b.- Advanced Microscopy Unit, Scientific Park Foundation, I+D Building, Miguel Delibes Campus, University of Valladolid, 47011 Valladolid, Spain. ([email protected])
Index1. SYNTHESIS OF PERYLENE DERIVATIVES:..............................................................2
2. PREPARATION AND CHARACTERIZATION OF SILICA SUBSTITUTED NANOPARTICLES ................................................................................................................15
2.1. Synthesis of triethoxysilyl perylene derivatives: .........................................................15
2.2. Synthesis of silica materials with supported perylene derivatives: ............................15
2.3. Characterization of the functional materials...............................................................16
3. SOLVATOCHROMISM: ...............................................................................................18
4. Qualitative and quantitative measures of JG125 and PC63:............................................23
4.1. Qualitative response of solutions to different oxidants: ..........................................23
4.2. Work concentration: ................................................................................................23
4.3. Quantitative measures of probes vs TATP and mCPBA in solution: ......................25
4.4. Quantum yield and lifetime measurements .............................................................30
5. TATP DETECTION IN MODIFIED SILICA: ...............................................................30
5.1. Quantitative study of the presence of the peaks, excitation and emission in fluorescence: .......................................................................................................................32
5.3. Study of increment on the emission: .......................................................................37
5.4. Titration under increasing concentration of TATP..................................................38
5.5. Summary of fluorescence measurements ................................................................39
5.6. Electrochemistry......................................................................................................40
5.7. Quantum chemical calculations...............................................................................41
Electronic Supplementary Material (ESI) for Journal of Materials Chemistry A.This journal is © The Royal Society of Chemistry 2018

S2
1. SYNTHESIS OF PERYLENE DERIVATIVES:General methods. The reactions performed with air sensitive reagents were conducted under dry nitrogen. The solvents were previously distilled under nitrogen over calcium hydride or sodium filaments. Column chromatography: SiO2 (40-63 μm). TLC plates coated with SiO2 60F254 were visualized by UV light. Melting points were determined in a Gallenkamp apparatus and are not corrected. FT-IR spectra were recorded on potassium bromide pellet with a JASCO FT/IR-4200. NMR spectra were recorded in Varian Mercury-300 and Varian Unity Inova-400 machines, in DMSO-d6, CDCl3, CD3CN, CD3OD. Chemical shifts are reported in ppm with respect to residual solvent protons, coupling constants (JX-X’) are reported in Hz. MALDI-TOF mass spectra were measured on a MALDI-TOF Bruker Autoflex Mass Spectrometry instrument using DCTB and DIT matrixes. Quantitative UV-visible measures were performed with a Hitachi U-3900, in 1 cm UV cells at 25ºC. Fluorescence spectra were recorded in a Hitachi F-7000 FL spectrofluorometers, in 1 cm quartz cells at 25ºC. Quantum yield were measured with an integration sphere in a fluorometer Edinburgh Instruments FLS980. pH values were measured with a Metrohm 16 DMS Titrino pH meter with a combined glass electrode and a 3 M KCl solution as a liquid junction, calibrated with Radiometer Analytical SAS buffer solutions. Cyclic voltammetry experiments were registered in a Dropsens µStat 300 potenciostat with platinum bead working and platinum wire auxiliary electrodes and an Ag/AgCl electrode as reference. Scan rate 100 mV/s. Dry purified CH2Cl2 was used as solvent, and [Bu4N][PF6] as supporting electrolyte. Ferrocene as internal reference was added at the end of each experiment.
Synthesis of N-(1-(1-adamantyl)ethyl)perylene-3,4-dicarboxylmonoimide (JG62)
N
O
O
NMP:H2O
NH2
OO
O O
O O ·HCl
(18:1.5)
DABCO
190 ºC - 3 days
+
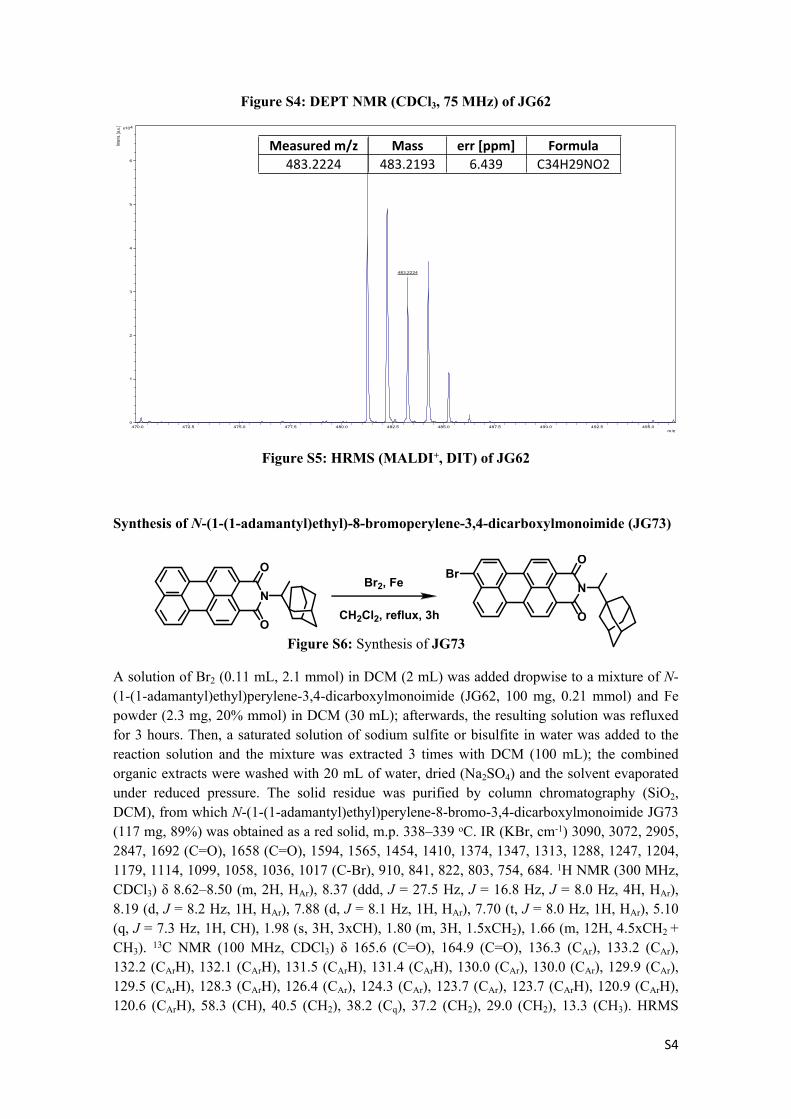
Perylene tetracarboxylic dianhydride (0.50 g, 1.28 mmol), DABCO (0.72 g, 6.4 mmol), and 1-(1-adamantyl)ethylamine hydrochloride (0.31 g, 1.43 mmol) were dissolved in N-methylpyrrolidone (NMP)/water 18.5 mL/1.5 mL and stirred in a high-pressure reactor at 190 ºC for 3 days. Then, the reaction mixture was poured into a 1M HCl solution in water (50 mL) and stirred for one hour. The resulting mixture was filtered under reduced pressure. The solid residue was purified by column chromatography (SiO2, hexane to dichloromethane (DCM)), from which N-(1-(1-adamantyl)ethyl)perylene-3,4-dicarboxylmonoimide JG62 (303 mg, 49%) was obtained as an orange solid, m.p. 309–311 oC. IR (KBr, cm-1) 2903-2846, 1699 (C=O), 1650 (C=O), 1594, 1572, 1351, 1291, 1242, 1057, 1058, 810, 750. 1H NMR (CDCl3, 300 MHz) δ 8.48 (m, 2H, HAr), 8.30 (m, 4H, HAr), 7.83 (d, J = 7.9 Hz, 2H, HAr), 7.56 (t, 2H, J = 7.2 Hz, HAr), 5.10 (m, 1H, CH), 1.97 (s, 3H, 3xCH), 1.84-1.64 (m, 15H, 6xCH2 + CH3). 13C NMR (CDCl3, 75 MHz) δ (ppm) 165.8 (C=O), 165.1 (C=O), 136.9 (CAr), 134.5 (CAr), 132.1 (CArH), 131.4 (CAr), 130.9(CAr), 129.9 (CAr), 129.5 (CArH), 128.2 (CAr), 127.2 (CArH), 126.8 (CAr), 123.7 (CArH), 122.2 (CAr), 121.3 (CAr), 120.4 (CArH), 58.3 (CH), 40.5 (CH2), 38.3 (Cq), 37.2 (CH2), 30.0 (CH2), 13.4 (CH3). HRMS (MALDI+, DIT) m/z calcd. for C34H29NO2 (M+): 483.2193; found: 483.2224. UV-Vis (DCM), λmax nm (log ε): 498 (4.5).
Figure S1: Synthesis of JG62

S3
1.52.02.53.03.54.04.55.05.56.06.57.07.58.08.5ppm
12.3
53.
103.
03
1.00
2.17
1.99
3.97
2.03
1.64
61.
693
1.72
61.
811
1.83
91.
973
5.08
95.
107
7.54
47.
561
7.58
07.
821
7.84
18.
272
8.29
18.
309
8.32
78.
453
8.47
38.
492
8.51
2
Figure S2: 1H NMR (CDCl3, 300 MHz) of JG62
102030405060708090100110120130140150160170ppm
13.4
2
29.0
429.9
6
37.2
438.2
640.5
3
58.2
7
120.3
6121.3
1122.2
0123.7
0126.7
7127.1
9128.1
9129.4
6129.9
3130.8
9130.9
4131.3
9132.1
1134.5
2136.8
8137.0
5
165.1
1165.8
3
Figure S3: 13C NMR (CDCl3, 75 MHz) of JG62
05101520253035404550556065707580859095100105110115120125130135ppm
13.4
2
29.0
429
.96
37.2
4
40.5
2
58.2
6
120.
39
123.
72
127.
21
130.
9113
1.43
132.
14
S4
Figure S4: DEPT NMR (CDCl3, 75 MHz) of JG62
483.2224
0
1
2
3
4
5
6
4x10
Inte
ns. [a
.u.]
470.0 472.5 475.0 477.5 480.0 482.5 485.0 487.5 490.0 492.5 495.0m/z
Figure S5: HRMS (MALDI+, DIT) of JG62
Synthesis of N-(1-(1-adamantyl)ethyl)-8-bromoperylene-3,4-dicarboxylmonoimide (JG73)
Br2, Fe
CH2Cl2, reflux, 3hN
O
O
N
O
O
Br
A solution of Br2 (0.11 mL, 2.1 mmol) in DCM (2 mL) was added dropwise to a mixture of N-(1-(1-adamantyl)ethyl)perylene-3,4-dicarboxylmonoimide (JG62, 100 mg, 0.21 mmol) and Fe powder (2.3 mg, 20% mmol) in DCM (30 mL); afterwards, the resulting solution was refluxed for 3 hours. Then, a saturated solution of sodium sulfite or bisulfite in water was added to the reaction solution and the mixture was extracted 3 times with DCM (100 mL); the combined organic extracts were washed with 20 mL of water, dried (Na2SO4) and the solvent evaporated under reduced pressure. The solid residue was purified by column chromatography (SiO2, DCM), from which N-(1-(1-adamantyl)ethyl)perylene-8-bromo-3,4-dicarboxylmonoimide JG73 (117 mg, 89%) was obtained as a red solid, m.p. 338–339 oC. IR (KBr, cm-1) 3090, 3072, 2905, 2847, 1692 (C=O), 1658 (C=O), 1594, 1565, 1454, 1410, 1374, 1347, 1313, 1288, 1247, 1204, 1179, 1114, 1099, 1058, 1036, 1017 (C-Br), 910, 841, 822, 803, 754, 684. 1H NMR (300 MHz, CDCl3) δ 8.62–8.50 (m, 2H, HAr), 8.37 (ddd, J = 27.5 Hz, J = 16.8 Hz, J = 8.0 Hz, 4H, HAr), 8.19 (d, J = 8.2 Hz, 1H, HAr), 7.88 (d, J = 8.1 Hz, 1H, HAr), 7.70 (t, J = 8.0 Hz, 1H, HAr), 5.10 (q, J = 7.3 Hz, 1H, CH), 1.98 (s, 3H, 3xCH), 1.80 (m, 3H, 1.5xCH2), 1.66 (m, 12H, 4.5xCH2 + CH3). 13C NMR (100 MHz, CDCl3) δ 165.6 (C=O), 164.9 (C=O), 136.3 (CAr), 133.2 (CAr), 132.2 (CArH), 132.1 (CArH), 131.5 (CArH), 131.4 (CArH), 130.0 (CAr), 130.0 (CAr), 129.9 (CAr), 129.5 (CArH), 128.3 (CArH), 126.4 (CAr), 124.3 (CAr), 123.7 (CAr), 123.7 (CArH), 120.9 (CArH), 120.6 (CArH), 58.3 (CH), 40.5 (CH2), 38.2 (Cq), 37.2 (CH2), 29.0 (CH2), 13.3 (CH3). HRMS
Measured m/z Mass err [ppm] Formula483.2224 483.2193 6.439 C34H29NO2
Figure S6: Synthesis of JG73

S5
(MALDI+, DCTB) m/z calcd for C34H28BrNO2 (M+): 561.1298; found: 561.1287. UV-Vis (DCM), λ nm (log ε): 499 (4.5).
1.52.02.53.03.54.04.55.05.56.06.57.07.58.08.5f1 (ppm)
12.3
73.
133.
09
0.96
1.03
0.99
1.00
4.22
2.09
1.62
1.64
1.65
1.73
1.80
1.98
5.09
5.11
7.67
7.70
7.73
7.87
7.90
8.18
8.21
8.27
8.33
8.36
8.38
8.41
8.55
Figure S7: 1H NMR (CDCl3, 300 MHz) of JG73
102030405060708090100110120130140150160170
f1 (ppm)
13.3
0
29.0
1
37.1
938
.19
40.4
9
58.3
2
120.
6212
0.89
121.
8012
3.65
123.
6912
4.30
126.
4412
8.29
129.
4512
9.83
129.
9312
9.97
130.
0213
1.39
131.
4813
2.11
132.
1813
3.20
136.
28
164.
8916
5.63
Figure S8: 13C NMR (CDCl3, 100 MHz) of JG73

S6
569.3152
525.2877
561.1287
563.1316
541.2616
547.4696522.2796
572.3245
0
1
2
3
4
5
6
4x10
Inten
s. [a.
u.]
520 530 540 550 560 570 580m/z
Figure S9: HRMS (MALDI+, DCTB) of JG73
Synthesis of N-[1-(1-adamantyl)ethyl] 8-[2-(N-Boc-piperazin-1-yl)pyrid-5-yl]perylene-3,4-dicarboxylmonoimide (JG125)
NO O
Br
N N
BO
O
N O
O
N
O
O
NNN
O
O
Tol:BuOH:H2O
Pd(PPh3)4
Na2CO3
4:1:0.3
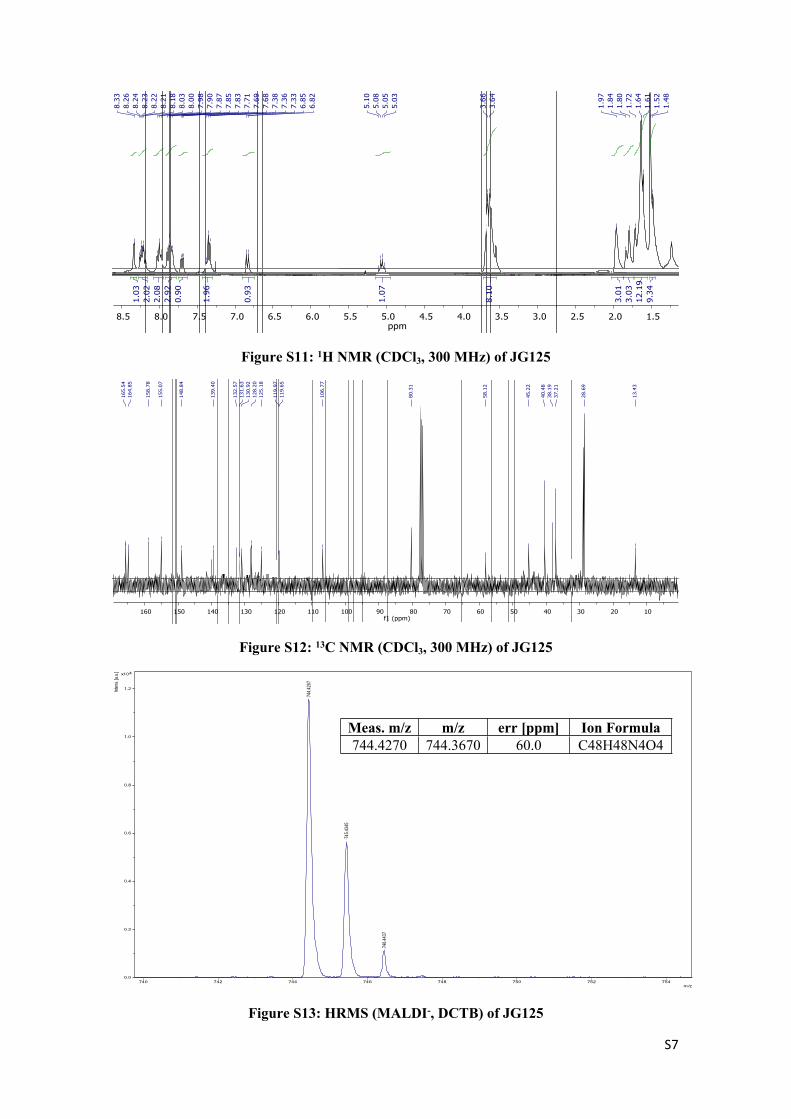
In a 100 mL Schlenk, provided with magnetic stirrer and cooler, 150 mg (0.27 mmol) of N-(1-(1-adamantyl)ethyl) perylene-8-bromo-3,4-dicarboxylmonoimide, JG73, 113 mg (0.29 mmol) of 2-(4-N-Boc-piperazin-1-yl)pyrid-5-yl boronic acid, pinacol ester, 143 mg (1.35 mmol) of Na2CO3 and 15 mg (0.014 mmol) Pd(PPh3)4 were added under nitrogen atmosphere. Then, they were solved into the mixture Tol:BuOH:H2O (8:2:0.6 ml) and heated under reflux for 24 hours. After that, 100 mL of water were added to the mixture and extracted with CH2Cl2 (3 x 75 mL). The combined organic extracts were dried (Na2SO4) and the solvent was evaporated. As a result, the product was obtained and purified by column chromatography DCM:MeOH 4% v/v, obtaining JG125, 138 mg, as a purple solid, 69% yield. m.p. 304-305 ºC, decomposition. IR (KBr, cm-1) 2958 - 2923 (CAr-H), 2853 (C-H), 1738 (C=O), 1651 (C=O), 1598 (CAr-CAr), 1462 (C-O), 1393, 1285, 1240, 1173(C-N), 1361, 1121, 1072, 1055, 936. 1HNMR (300 MHz, CDCl3) δ 8.33 (s, 1H, N=CH (pyr)), 8.26 – 8.18 (m, 2H, HAr), 8.00 (t, J = 7.2 Hz, 2H, HAr), 7.86 (dd, J = 13.6, 6.9 Hz, 3H, HAr), 7.7 (m, 1H, CH-C=N), 7.40 – 7.23 (m, 2H, HAr), 6.84 (d, J = 8.8 Hz, 1H, HAr), 5.07 (q, J = 7.0 Hz, 1H, NCHCH3), 3.65 (m, 8H, 2xCH2), 1.97 (s, 3H, 1.5xCH2), 1.80 (m, 3H, 1.5xCH2), 1.80-1.61 (m, 12H, 4.5xCH2+CH3), 1.52 (s, 9H, C(CH3)3). 13C NMR (100 MHz, CDCl3) δ 165.5 (C=O), 164.9 (C=O), 158.8 (N-C=N), 155.1 (O-C=O), 148.5 (CArH), 139.4 (CAr), 131.6 (CAr), 130.9 (CArH), 128.2 (CAr), 125.2 (CArH), 124.2 (CArH), 123.5 (CArH), 120.0 (CArH), 119.7 (CArH), 106.8 (CArH), 80.3 (C(CH3)3), 57.9 (NCH), 45.2 (NCH2), 37.2 (NCH2), 40.5 (CH2 adam), 38.2 (CH2 adam), 28.7 (CH2 + CH3), 13.4 (CH3). HRMS (MALDI-, DCTB) m/z calcd for C48H48N4O4: 744.3670 (M-, DCTB); found: 744.4270. UV-Vis (DCM), λ nm (log ε): 511 (4.6).
Meas. m/z m/z err [ppm] Ion Formula561.1287 561.1298 -0.1 C34H28Br1N1O2
Figure S10: Synthesis of JG125
S7
1.52.02.53.03.54.04.55.05.56.06.57.07.58.08.5ppm
9.34
12.1
93.
033.
01
8.10
1.07
0.93
1.96
0.90
2.92
2.08
2.02
1.03
1.48
1.52
1.61
1.64
1.72
1.80
1.84
1.97
3.64
3.66
5.03
5.05
5.08
5.10
6.82
6.85
7.33
7.36
7.38
7.68
7.69
7.71
7.83
7.85
7.87
7.90
7.98
8.00
8.03
8.18
8.21
8.22
8.23
8.24
8.26
8.33
Figure S11: 1H NMR (CDCl3, 300 MHz) of JG125
102030405060708090100110120130140150160f1 (ppm)
13.4
3
28.6
9
37.2
138
.19
40.4
8
45.2
2
58.1
2
80.3
1
106.
77
119.
6511
9.97
125.
1812
8.20
130.
9213
1.63
132.
57
139.
40
148.
84
155.
07
158.
78
164.
8516
5.54
Figure S12: 13C NMR (CDCl3, 300 MHz) of JG125
744.
4267
745.
4345
746.
4437
0.0
0.2
0.4
0.6
0.8
1.0
1.2
4x10
Inte
ns. [a
.u.]
740 742 744 746 748 750 752 754m/z
Figure S13: HRMS (MALDI-, DCTB) of JG125
Meas. m/z m/z err [ppm] Ion Formula744.4270 744.3670 60.0 C48H48N4O4
S8
Synthesis of N-[2-(1-adamantyl)ethyl] 8-[2-(piperazin-1-yl)pyrid-5-yl]perylene-3,4-dicarboxylmonoimide (JG125d)
N
O
O
NNN
O
ON
O
O
NNHN
CF3COOH
CH2Cl2
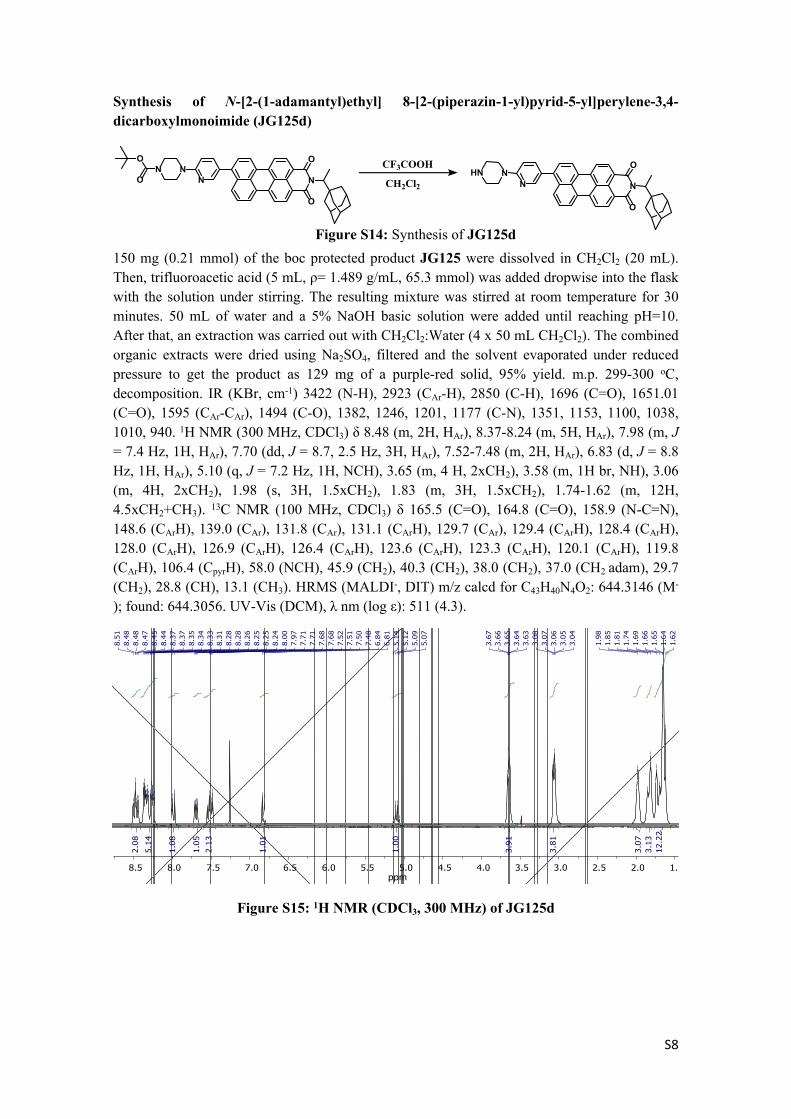
150 mg (0.21 mmol) of the boc protected product JG125 were dissolved in CH2Cl2 (20 mL). Then, trifluoroacetic acid (5 mL, ρ= 1.489 g/mL, 65.3 mmol) was added dropwise into the flask with the solution under stirring. The resulting mixture was stirred at room temperature for 30 minutes. 50 mL of water and a 5% NaOH basic solution were added until reaching pH=10. After that, an extraction was carried out with CH2Cl2:Water (4 x 50 mL CH2Cl2). The combined organic extracts were dried using Na2SO4, filtered and the solvent evaporated under reduced pressure to get the product as 129 mg of a purple-red solid, 95% yield. m.p. 299-300 oC, decomposition. IR (KBr, cm-1) 3422 (N-H), 2923 (CAr-H), 2850 (C-H), 1696 (C=O), 1651.01 (C=O), 1595 (CAr-CAr), 1494 (C-O), 1382, 1246, 1201, 1177 (C-N), 1351, 1153, 1100, 1038, 1010, 940. 1H NMR (300 MHz, CDCl3) δ 8.48 (m, 2H, HAr), 8.37-8.24 (m, 5H, HAr), 7.98 (m, J = 7.4 Hz, 1H, HAr), 7.70 (dd, J = 8.7, 2.5 Hz, 3H, HAr), 7.52-7.48 (m, 2H, HAr), 6.83 (d, J = 8.8 Hz, 1H, HAr), 5.10 (q, J = 7.2 Hz, 1H, NCH), 3.65 (m, 4 H, 2xCH2), 3.58 (m, 1H br, NH), 3.06 (m, 4H, 2xCH2), 1.98 (s, 3H, 1.5xCH2), 1.83 (m, 3H, 1.5xCH2), 1.74-1.62 (m, 12H, 4.5xCH2+CH3). 13C NMR (100 MHz, CDCl3) δ 165.5 (C=O), 164.8 (C=O), 158.9 (N-C=N), 148.6 (CArH), 139.0 (CAr), 131.8 (CAr), 131.1 (CArH), 129.7 (CAr), 129.4 (CArH), 128.4 (CArH), 128.0 (CArH), 126.9 (CArH), 126.4 (CArH), 123.6 (CArH), 123.3 (CArH), 120.1 (CArH), 119.8 (CArH), 106.4 (CpyrH), 58.0 (NCH), 45.9 (CH2), 40.3 (CH2), 38.0 (CH2), 37.0 (CH2 adam), 29.7 (CH2), 28.8 (CH), 13.1 (CH3). HRMS (MALDI-, DIT) m/z calcd for C43H40N4O2: 644.3146 (M-
); found: 644.3056. UV-Vis (DCM), λ nm (log ε): 511 (4.3).
1.52.02.53.03.54.04.55.05.56.06.57.07.58.08.5ppm
12.2
23.
133.
07
3.81
3.91
1.00
1.01
2.13
1.05
1.08
5.14
2.08
1.62
1.64
1.65
1.66
1.69
1.74
1.81
1.85
1.98
3.04
3.05
3.06
3.07
3.08
3.63
3.64
3.65
3.66
3.67
5.07
5.09
5.12
5.14
6.81
6.84
7.48
7.50
7.51
7.52
7.68
7.68
7.71
7.71
7.97
8.00
8.24
8.25
8.25
8.26
8.28
8.28
8.31
8.33
8.34
8.35
8.37
8.37
8.44
8.45
8.47
8.48
8.48
8.51
Figure S15: 1H NMR (CDCl3, 300 MHz) of JG125d
Figure S14: Synthesis of JG125d

S9
102030405060708090100110120130140150160f1 (ppm)
13.1
4
28.7
729
.67
36.9
637
.97
40.2
5
45.9
246
.20
57.9
6
106.
33
120.
8112
0.98
121.
8812
3.45
124.
6912
6.34
128.
4212
9.65
132.
7313
6.73
138.
9914
0.02
148.
43
159.
00
164.
8016
5.53
Figure S16: 13C NMR (CDCl3, 100 MHz) of JG125d
101520253035404550556065707580859095100105110115120125130135140145150
f1 (ppm)
13.1
4
28.7
629
.67
36.9
6
40.2
5
45.9
3
57.9
6
106.
33
119.
8312
0.13
123.
6012
6.86
127.
9913
1.16
131.
87
139.
00
148.
60
Figure S17: DEPT NMR (CDCl3, 100 MHz) of JG125d
644.3056
645.3290
646.3123
0
100
200
300
400
Inten
s. [a.
u.]
638 640 642 644 646 648 650 652 654m/z
Figure S18: HRMS (MALDI-, DIT) of JG125d
Meas. m/z m/z err [ppm] Ion Formula644.3056 644.3146 -9.0 C43H40N4O2

S10
Synthesis of N,N’-Dicyclohexyl-1-[2-(N-Boc-piperazin-1-yl)pyrid-5-yl]perylene-3,4:9,10-tetracarboxydiimide (PC63).
N
N
OO
OO
N
NN O
ON
N
OO
OO
Br
Pd(PPh3)4
Cs2CO3
THF:H2O20:2
N N
BO
O
N O
O
N,N’-Dicyclohexyl-1-bromoperylene-3,4:9,10-tetracarboxydiimide (100 mg, 0.16 mmol) was placed in a Schlenk flask under nitrogen atmosphere, then THF:H2O (20:2 ml), and 15 mg (0.014 mmol) of tetrakis(triphenylphosphine)palladium(0) were added. The mixture was stirred for 5 minutes. After that time 2-(N-Boc-piperazin-1-yl)pyrid-5-yl boronic acid, pinacol ester, (67 mg, 0.17 mmol) and caesium carbonate (168 mg, 0.47 mmol) were added. After 24 hours under reflux, the crude was extracted with dichloromethane (4 × 50 mL CH2Cl2) and dried with Na2SO4. Finally, the crude product was purified by column chromatography (silica gel, CH2Cl2:CH3CN) and perylene bisimide PC63 was obtained as a purple solid in 66 % yield (85 mg, 0.104 mmol). m.p,: 214–216 ºC. FT-IR (KBr, cm-1): 2926 (C-H), 2855 (C-H), 1698 (C=O), 1658 (C=O), 1590 (CAr-CAr), 1493, 1454 (CH2), 1405 (C-N), 1331, 1235, 1164, 1118, 1022, 860, 811, 749 (fingerprint region). 1H NMR (300 MHz, CDCl3) δ: 8.65 – 8.50 (m, 5H, HAr), 8.49 (s, 1H, HAr), 8.31 (d, J = 2.5 Hz, 1H, HAr), 8.20 (d, J = 8.2 Hz, 1H, HAr), 8.06 (d, J = 8.2 Hz, 1H, HAr), 7.52 (dd, J = 8.8, 2.5 Hz, 1H, HAr), 6.72 (d, J = 8.9 Hz, 1H, HAr), 5.08 – 4.96 (m, 2H, N-CH), 3.66 – 3.63 (m, 8H, CH2), 2.59 – 2.51 (m, 4H, CH2), 1.91 (m, 4H, CH2), 1.74 (m, 6H, CH2), 1.52 (s, 9H, CH3), 1.48 – 1.30 (m, 6H, CH2). 13CNMR (101 MHz, CDCl3) δ 164.0 (C=O), 163.9 (C=O), 163.8 (C=O), 163.7 (C=O), 158.6 (CAr-N), 154.9 (COOC(CH3)3), 147.8 (CH), 138.6 (CAr), 138.1 (CArH), 136.0 (CArH), 134.8 (CAr), 134.5 (CAr), 134.3 (CAr), 132.2 (CAr), 131.2 (CArH), 131.0 (CArH), 130.6 (CArH), 130.2 (CArH), 129.3 (CH), 129.0 (CAr), 128.2 (CAr), 128.1 (CAr), 127.6 (CAr), 127.5 (CAr), 123.7 (CH), 123.6 (CAr), 123.1 (CAr), 122.9 (CAr), 122.7 (CH), 122.5 (CAr), 107.7 (CH), 80.3 (Cq), 54.2 (CH), 54.1 (CH), 44.9 (CH2), 29.3 (CH2), 29.2 (CH2), 28.6 (CH3), 26.7 (CH2), 26.7 (CH2), 25.6 (CH2). HRMS (MALDI-, DIT): m/z calcd. for C50H49N5O6 ([M]-): 815.3677; found: 815.3680. UV-Vis (DCM), λ nm (log ε): 484 (4.4), 521 (4.4).
Figure S19: Synthesis of PC63

S11
1.52.02.53.03.54.04.55.05.56.06.57.07.58.08.5f1 (ppm)
6.10
9.04
6.06
4.13
4.10
8.00
2.06
1.02
1.05
1.02
1.03
1.01
0.91
4.95
1.30
1.35
1.40
1.45
1.46
1.48
1.52
1.59
1.72
1.76
1.89
1.93
2.51
2.52
2.55
2.59
3.63
3.65
3.66
4.96
5.02
5.08
6.71
6.73
7.50
7.51
7.53
7.54
8.04
8.07
8.19
8.21
8.31
8.32
8.49
8.50
8.53
8.53
8.55
8.60
8.62
8.63
8.65
Figure S20: 1H NMR (CDCl3, 300 MHz) of PC63
253035404550556065707580859095100105110115120125130135140145150155160165f1 (ppm)
25.5
926
.70
26.7
328
.61
29.2
429
.27
44.8
7
54.1
154
.23
80.2
610
7.69
122.
5312
2.73
122.
9012
3.07
123.
5512
3.70
127.
4612
7.55
128.
1312
8.20
129.
0412
9.27
130.
1713
0.63
131.
0413
1.15
132.
2113
4.28
134.
4913
4.81
136.
0113
8.07
138.
63
147.
77
154.
9215
8.62
163.
7416
3.82
163.
9216
3.96
Figure S21: 13C NMR (CDCl3, 100 MHz) of PC63
20253035404550556065707580859095100105110115120125130135140145150f1 (ppm)
25.6
626
.79
28.6
729
.33
44.9
2
54.1
654
.28
107.
77
122.
6612
3.67
129.
3513
0.28
130.
7213
1.13
131.
2513
6.12
138.
21
147.
84
Figure S22: DEPT NMR (CDCl3, 100 MHz) of PC63

S12
815.3680
816.3731
817.3794
818.3963813.3404
0.0
0.2
0.4
0.6
0.8
1.0
4x10
Inte
ns. [
a.u.
]
813 814 815 816 817 818 819 820 821m/z
Figure S23: HRMS (MALDI-, DIT) of PC63
Synthesis of N,N’-Dicyclohexyl-1-[2-(piperazin-1-yl)pyrid-5-yl]perylene-3,4:9,10-tetracar-boxydiimide (PC63d).
N
N
OO
OO
N
NNH
CF3COOH
CH2Cl2
N
N
OO
OO
N
NN O
O
20 mg of PC63 (0.025 mmol) were dissolved in CH2Cl2 (5 mL). Then, trifluoroacetic acid (1 mL, ρ= 1.489 g/mL, 13.1 mmol) was added dropwise under stirring. The resulting mixture was stirred at room temperature for 30 minutes. Afterwards, 10 mL of water and a 5% NaOH basic solution were added until reaching pH=10. Then, an extraction was performed with CH2Cl2:Water (4 x 20 mL). The combined organic extracts were dried using Na2SO4, filtered and the solvent evaporated under reduced pressure to get the product, 17 mg, as a purple-red solid, 95% yield, m.p. 220-221 oC. IR (KBr, cm-1) 3439 (N-H), 2924 (CAr-H), 2852 (C-H), 1693 (C=O Imide), 1655 (C=O), 1590 (CAr-CAr), 1496 (C-O), 1455, 1402, 1333 (C-N), 1240, 1019, 1010, 808, 749. 1H NMR (300 MHz, CDCl3) δ 8.63 – 8.57 (m, 2H, HAr), 8.52 – 8.46 (m, 3H, HAr), 8.31 (d, J = 2.6 Hz, 1H, HAr), 8.20 (d, J = 8.2 Hz, 1H, HAr), 8.05 (d, J = 8.4 Hz, 1H, HAr),
Meas. m/z m/z err [ppm] Ion Formula815.3680 815.3677 0.3 C50H49N5O6
Figure S24: Synthesis of PC63d

S13
7.49 (dd, J = 8.8, J = 2.5 Hz, 1H, HAr), 6.71 (d, J = 9.0 Hz, 1H, HAr), 5.05 – 5.01 (m, 2H, CH), 3.66 (t, J = 5.0 Hz, 4H, CH2), 3.06 (t, J = 5.0 Hz, 4H, CH2), 2.85 (m, 1H, br, NH), 2.59 – 2.52 (m, 4H, CH2), 1.89 (d, 4H, CH2), 1.76 (m, 6H, CH2), 1.49 – 1.37 (m, 4H, CH2). 13C NMR (75 MHz, CDCl3) δ 164.1 (C=O), 163.9 (C=O), 163.9 (C=O), 163.7 (C=O), 159.0 (CAr), 147.8 (CAr), 138.9 (C), 138.0 (C), 136.2 (C), 135.0 (C), 134.6 (C), 134.5 (C), 132.3 (C), 131.2 (C), 130.7 (C), 130.3 (C), 129.9 (C), 129.3 (C), 128.3 (C), 127.6 (C), 127.3 (C), 123.9 (C), 123.8 (C), 123.7 (C), 123.1 (C), 122.8 (C), 122.6 (C), 107.6 (C), 54.2 (CH), 46.0 (CH2), 45.9 (CH2), 32.1 (CH2), 29.9 (CH2), 29.3 (CH2), 26.7 (CH2), 25.6 (CH2). HRMS (MALDI+, DCTB): m/z calcd. for C45H41N5O4 ([M+H]+): 716.3231; found: 716.3255.
1.01.52.02.53.03.54.04.55.05.56.06.57.07.58.08.5ppm
5.94
6.07
4.06
3.98
3.85
4.00
2.10
0.97
1.06
1.06
1.06
0.98
3.07
2.03
1.37
1.41
1.42
1.45
1.49
1.73
1.76
1.80
1.89
2.52
2.56
2.59
3.04
3.06
3.08
3.64
3.66
3.67
5.00
5.01
5.05
6.69
6.72
7.48
7.50
8.05
8.08
8.18
8.21
8.30
8.31
8.46
8.47
8.48
8.50
8.52
8.57
8.58
8.60
8.61
8.63
Figure S25: 1H NMR (CDCl3, 300 MHz) of PC63d
20253035404550556065707580859095100105110115120125130135140145150155160165ppm
22.6
625
.42
26.5
229
.10
29.6
731
.90
45.7
545
.86
54.0
4
107.
4112
2.41
122.
5712
2.94
123.
4412
3.58
127.
1112
7.44
128.
1112
8.99
129.
1813
0.15
130.
5113
0.98
132.
1513
4.31
134.
4613
4.85
135.
9713
7.82
138.
6814
7.62
158.
8316
3.73
163.
88
Figure S26: 13C NMR (CDCl3, 75 MHz) of PC63d

S14
717.3643
716.3255
718.3725
719.3789
0
500
1000
1500
2000
Inte
ns. [
a.u.
]
715 716 717 718 719 720 721 722 723m/z
Figure S27: HRMS (MALDI+, DCTB) of PC63d
Meas. m/z m/z err [ppm] Ion Formula716.3255 716.3231 2.4 C45H41N5O4

S15
2. PREPARATION AND CHARACTERIZATION OF SILICA SUBSTITUTED NANOPARTICLES
2.1. Synthesis of triethoxysilyl perylene derivatives:
N
O
O
NNHN
OSiOO N
CO
N
O
O
NNNO Si
O O
NHC
OReflux
CHCl3
Figure S28. Synthesis of the triethoxysilyl derivative, JG131 from JG125-deprotected
OSiO O
N C O Reflux
CHCl3
N
N
OO
OO
N
NNH O
SiO ONH
CO N
N
O O
O O
N
NN
Figure S29. Synthesis of the triethoxysilyl derivative of JG135 from PC63-deprotected
The corresponding perylene imide (20 mg, 0.03 mmol) was dissolved in 5 ml of CHCl3. Then, triethoxy(3-isocyanatopropyl)silane (8 mg, 0.03 mmol) was added to the solution and stirred under reflux for 24 hours. The resulting product was checked by 1HNMR and introduced to the next reaction without further purification.
2.2. Synthesis of silica materials with supported perylene derivatives:
Silica 10-20 nm Sigma Aldrich 99.5 % and TLC plates Merck Aluminium sheets 5x10 cm Silicagel 60.
N
O
O
NNN
NHC
OSiO2nJG131
N
O
O
NNN
NHC
O
SiO2
pJG131
Figure S30. Silica derivatives of JG131, in silica nanoparticles (n) and in a TLC (p)
SiO2 NHCO N
N
O O
O O
N
NNSiO2
nJG135
SiO2 NHCO N
N
O O
O O
N
NN
pJG135
Fig S31. Silica derivatives of JG135, on silica nanoparticles (n) or on TLC plates (p)

S16
Functionalized silica nanoparticles were prepared from 500 mg of silica nanoparticles and 4 mg of the triethoxysilyl perylene derivative. The mixture was refluxed at 112ºC in a mixture of Toluene:Water 500:10 µL for 24 hours. Finally, the nanoparticles were washed with 2 x toluene, 2 x DCM and 2 x Et2O. The products obtained were called nJG131 and nJG135. By the same way the silane derivatives were bonded to silica TLC plates, 0.5 mg of JG131 or JG135 for every 5×10 cm plate. Instead of putting it under reflux, it was heated at 60ºC for 48 hours, until the solutions had neither color nor fluorescence. Then, the TLC plates were cleaned by the same procedure. The products obtained were called pJG131 and pJG135. In addition to this synthesis, JG125 and PC63 were put under the same process than to obtain pJG131 and pJG135. However, in this case it is an adsorption process, obtaining the product adsorbed in silica, these products were called pJG125 and pPC63.
2.3. Characterization of the functional materials
The whole quantity of nJG131, nJG135, pJG131, nJG135, pJG125 and pPC63 reacted or adsorbed in the silica leaving colorless solutions. The silica nanoparticles were characterized by checking the fluorescent profiles, emission and excitation.
250 300 350 400 450 500 550
0.0
0.2
0.4
0.6
0.8
1.0
Nor
mal
ized
exc
itatio
n in
tens
ity
Excitation wavelength (nm)
pJG125 pJG131 nJG131
250 300 350 400 450 500
0.0
0.2
0.4
0.6
0.8
1.0
Nor
mal
ized
exc
itatio
n in
tens
ity
Excitation wavelength (nm)
pPC63 pJG135 nJG135
500 550 600 650 700 750 800 850
0.0
0.2
0.4
0.6
0.8
1.0
Nor
mal
ized
Em
issi
on in
tens
ity
Emission wavelength (nm)
nJG131 pJG131 pJG125
500 550 600 650 700 750 800 850
0.0
0.2
0.4
0.6
0.8
1.0
Nor
mal
ized
Em
issi
on in
tens
ity
Emission wavelength (nm)
nJG135 pJG135 pPC63
Figure S32: Normalized Emission (up) and excitation (down) spectra of the supported probes in silica.

S17
The proportions of carbon/silicon were also checked by EDX analysis (Energy-dispersive X-ray spectroscopy).
Figure S33. EDX profile of pJG131.
From the different profiles, the proportion Si/C obtained were around 2-5 % in case of the silica nanoparticles and 5-8 % for the TLC plates. These results are in agreement with the supposed proportions of carbon due to the quantity of perylene added, 2.8 % for the silica nanoparticles. For the TLC plates, the supposed proportion couldn’t be calculated but the results are quite close.
In addition to this, TGA was performed for the nanosilica substituted materials nJG131 and nJG135.
200 400 600 80090
92
94
96
98
100
Temperature (ºC)
% W
eigh
t
0.000
0.025
0.050
0.075
0.100
0.125
0.150
0.175
0.200
Der
iv. W
eigh
t/Tem
p (%
/ºC)
200 40093
94
95
96
97
98
99
100
Temperature (ºC)
% W
eigh
t
0.00
0.02
0.04
0.06
0.08 D
eriv
. Wei
ght/T
emp
(%/ºC
)
Figure S34. TGA in N2 of nJG131 (left) and nJG135 (right).
nJG135 and nJG131 lost 6-8 % weight, corresponding to the presence of organic matter, presumably perylene derivative in each case.
Furthermore, a peak of weight loss was observed in the silica substituted with perylene monoimide at 300 ºC temperature, which is in agreement with the degradation when calculating the melting point.

S18
3. SOLVATOCHROMISM:
The probes JG125 and PC63 (Boc-protected probes) and JG125d and PC63d (deprotected) have properties as potential oxidant detectors, which was detected in preliminar testing. Then, the general behavior was studied in solution.The solvatochromism of compounds JG125 and PC63 (10 µM) is useful for studying the effect and the solubility of the probes in different solvents, because of that, it is the first step in the study of these compounds, the studied solvents were:
1. Water 2. MeOH 3. DMSO4. DMF 5. MeCN 6. Acetone7. AcOEt 8. THF 9. CHCl3
10. CH2Cl2 11. Toluene 12. Et2O13. Hexane 14. Cyclohexane
JG125:
Figure S35. Solvatochromism JG125, under visible light (up) and under UV light (down).
400 450 500 550 600 650
0,0
0,1
0,2
0,3
0,4
0,5
Abs
orba
nce
Wavelength (nm)
H2O MeOH DMSO DMF MeCN Acetone AcOEt THF CHCl3 DCM Toluene Et2O Hexane Cyclohexane
400 450 500 550 600 650
0,0
0,2
0,4
0,6
0,8
1,0
Nor
mal
ized
abs
orba
nce
Wavelength (nm)
MeOH DMSO DMF MeCN Acetone AcOEt THF CHCl3 DCM Toluene Et2O Hexane Cyclohexane
Figure S36. Solvatochromism JG125, absorbance in different solvents.
The change in the wavelength of absorbance is batochromic with the polarity but not very significant, the solubility is very low in water, methanol, hexane, acetonitrile and cyclohexane and when the polarity is very low a shoulder at lower wavelengths may be seen, probably a band that is less overlapped with less polarity.
The fluorescence was measured by excitation with light at 512 nm:
1 2 3 4 5 6 7 8 9 10 11 12 13 14
1 2 3 4 5 6 7 8 9 10 11 12 13 14

S19
550 600 650 700
0
500
1000
1500
2000
2500
3000
3500
4000Em
issi
on in
tens
ity (a
.u.)
Wavelength (nm)
MeOH DMSO DMF MeCN Acetone AcOEt THF CHCl3 DCM Toluene Et2O Hexane Cyclohexane
550 600 650 7000.0
0.2
0.4
0.6
0.8
1.0
Nor
mal
ized
Em
issi
on in
tens
ity
Wavelength (nm)
DMSO Acetone AcOEt THF DCM Toluene Et2O Hexane Cyclohexane
Figure S37. Solvatochromism JG125, fluorescence response when λexc = 512 nm, in different solvents.
The conclusions are similar to absorbance, but the batochromic effect is much more intense, having the maximum of intensity at λ ≥ 700 nm and the intensity of emission is higher when the polarity of the solvent is lower.
JG125d:
Figure S38. Solvatochromism JG125-deprotected, under visible light (up) and under UV light
(down).
400 450 500 550 600 650
0,00
0,05
0,10
0,15
0,20
0,25
Abso
rban
ce
Wavelength (nm)
H2O MeOH DMSO DMF MeCN Acetone AcOEt THF CHCl3 DCM Toluene Et2O Hexane Cyclohexane
400 450 500 550 600 650
0,0
0,2
0,4
0,6
0,8
1,0
Nor
mal
ized
abs
orba
nce
Wavelength (nm)
MeOH DMSO DMF MeCN Acetone AcOEt THF CHCl3 DCM Toluene Et2O
1 2 3 4 5 6 7 8 9 10 11 12 13 14
1 2 3 4 5 6 7 8 9 10 11 12 13 14

S20
550 600 650 7000
200
400
600
800
1000
1200
1400
1600Em
issi
on in
tens
ity (a
.u.)
Wavelength (nm)
H2O MeOH DMSO DMF MeCN Acetone AcOEt THF CHCl3 DCM Toluene Et2O Hexane CH
550 600 650 7000.0
0.2
0.4
0.6
0.8
1.0
Nor
mal
ized
Em
issi
on in
tens
ity
Wavelength (nm)
AcOEt THF CHCl3 DCM Toluene Et2O Hexane CH
Figure S39. Solvatochromism JG125d, absorbance in different solvents (up) and fluorescence response when λexc = 512 nm (down).
JG125d has very similar behavior of JG125, but the color and fluorescence are less intense.
The greatest absorbance was measured in Et2O, THF, DMF and DCM. Et2O is too volatile. Solvents more polar than AcOEt show a maximum of emission beyond 700 nm. DMSO and DMF are hard to evaporate and the fluorescence is negligible. THF could lead to secondary reactions with peroxides. CH2Cl2 shows good solubility, but is too volatile.
PC63:
Figure S40. Solvatochromism PC63, under visible light (up) and under UV light (down).
1 2 3 4 5 6 7 8 9 10 11 12 13 14
1 2 3 4 5 6 7 8 9 10 11 12 13 14

S21
400 450 500 550 600 650 7000,00
0,05
0,10
0,15
0,20
0,25Ab
sorb
ance
Wavelengt (nm)
MeOH DMSO DMF MeCN Acetone AcOEt THF CHCl3 DCM Toluene Et2O Hexane Cyclohexane
400 500 600 700
0,0
0,1
0,2
0,3
0,4
0,5
0,6
0,7
0,8
0,9
1,0
Nor
mal
ized
Abs
orba
nce
Wavelength (nm)
MeOH DMSO DMF MeCN Acetone AcOEt THF CHCl3 DCM Toluene Et2O Hexane Cyclohexane
Figure S41. Solvatochromism PC63, absorbance in different solvents.
The change of the maximum absorption is very low between solvents, however a decrease in polarity makes the band get more stretched and the presence of several overlapped bands may be clearly distinguished.
The fluorescence was measured by excitation at 483 nm:
500 550 600 650 7000
250
500
750
1000
1250
1500
Emis
sion
inte
nsity
(a.u
.)
Wavelength (nm)
MeOH DMSO DMF MeCN Acetone AcOEt THF CHCl3 DCM Toluene Et2O Hexane Cyclohexane
500 550 600 650 7000.0
0.2
0.4
0.6
0.8
1.0
Nor
mal
ized
Em
issi
on in
tens
ity
Wavelength (nm)
MeOH DMSO DMF MeCN Acetone AcOEt THF CHCl3 DCM Toluene Et2O Hexane Cyclohexane
Figure S42. Solvatochromism PC63, fluorescence response when λexc = 483 nm, in different solvents.
The change in absorbance is hypsochromic with an increase in polarity the opposite than JG125, furthermore, the overlapping of the bands with polarity can be clearly observed too. An increase in the emission at 650-700 nm can also be observed in hexane and cyclohexane

S22
PC63d:
Figure S43. Solvatochromism PC63d, under visible light (up) and under UV light (down).
400 500 600 7000.00
0.05
0.10
0.15
Abso
rban
ce
Wavelength (nm)
1.H2O 2. MeOH 3. DMSO 4. DMF 5. MeCN 6. Acetone 7. AcOEt 8. THF 9. CHCl3 10. DCM 11. Toluene 12. Ether 13. Hexane 14. Cyclohexane
400 500 600 7000,0
0,2
0,4
0,6
0,8
1,0
Nor
mal
ized
Abs
orba
nce
Wavelength (nm)
2. MeOH 3. DMSO 4. DMF 5. MeCN 6. Acetone 7. AcOEt 8. THF 9. CHCl3 10. DCM 11. Toluene 12. Ether 13. Hexane 14. Cyclohexane
Figure S44. Solvatochromism PC63d, absorbance in different solvents.
The fluorescence was measured by excitation with light at 483 nm:
500 600 7000
200
400
600
800
1000
Em
issi
on In
tens
ity (a
.u.)
Wavelength (nm)
1.H2O 2. MeOH 3.DMSO 4. DMF 5. MeCN 6. Acetone 7. AcOEt 8. THF 9. CHCl3 10.DCM 11. Toluene 12. Ether 13. Hexane 14. Cyclohexane
500 600 7000.0
0.2
0.4
0.6
0.8
1.0
Nor
mal
ized
Em
issi
on In
tens
ity
Wavelength (nm)
2. MeOH 3.DMSO 4. DMF 5. MeCN 6. Acetone 7. AcOEt 8. THF 9. CHCl3 10.DCM 11. Toluene 12. Ether 13. Hexane 14. Cyclohexane
Figure S45. Solvatochromism PC63d, fluorescence response when λexc = 483 nm, in different solvents.
The response to the solvents was very similar to PC63 but less remarkable and more similar between them. In consequence, the chosen solvent was CHCl3, less volatile than CH2Cl2. In order to dissolve the peroxides it is necessary to add a secondary solvent in which it is possible. It was checked that 10% of methanol was enough.
1 2 3 4 5 6 7 8 9 10 11 12 13 14
1 2 3 4 5 6 7 8 9 10 11 12 13 14

S23
4. Qualitative and quantitative measures of JG125 and PC63:
4.1. Qualitative response of solutions to different oxidants:
The fluorescence of the probes increases in presence of oxidant species, but only in the case of Boc protected probes and not in the deprotected ones. This process is also useful in order to make materials that are sensitive to oxidants, previously deprotected and bound to the material covalently, by formation of a new amide group.
Before the quantitative measurements, the probes were tested with several oxidative reagents. All the probes were dissolved in CHCl3:MeOH 9:1. The reason for using solvent mixtures is because of the minimal change respect CHCl3 solutions and the increase of solubility of oxidants insoluble in organic media. The change under visible and UV light was registered.
500 µL solutions of JG125 and PC63 are prepared in CHCl3:MeOH 9:1, then, 10 µL of the next solutions were added:
A) NothingB) HEPES 0.5 M in water.C) HCl 0.01M in water.D) TATP 0.2 M in CHCl3.E) MCPBA 0.2 M in CHCl3.F) Oxone 0.2 M in water.G) TNB 1mg.
JG125
Figure S44. Response under UV light of JG125 (left) and PC63 (right) against different
oxidant species.
From this study, apparently, JG125 is more sensitive to oxidants like TATP and mCPBA. In contrast, the change in the emission is more significant with PC63, from green to orange. These results were corroborated by the quantitative analysis afterwards.
4.2. Work concentration:
In order to choose an optimum concentration for the quantitative studio, the absorbance and fluorescence of the probes was checked to be linear while concentration changes are small. Studied CHCl3:MeOH 9:1, JG125 is showed as an example:
A B C D E F G A B C D E F G

S24
JG125
400 450 500 550 6000.0
0.1
0.2
0.3
0.4
0.5
0.6Ab
sorb
ance
Wavelength (nm)0 2 4 6 8 10 12 14
0,0
0,1
0,2
0,3
0,4
0,5
Abs
orba
nce
JG125 Concentration (M)
550 600 650 7000
200
400
600
800
1000
1200
1400
1600
1800
2000
Em
issi
on in
tens
ity (a
.u.)
Emission wavelength (nm)0 2 4 6 8 10 12 14
0
50
100
150
200
250
300
Emis
sion
inte
nsity
(a.u
.)
JG125 Concentration (M)
Figure S47. Absorbance (up) and fluorescence (down) of JG125 solution in CHCl3:MeOH 9:1, under increasing concentrations of JG125, λexc = 512 nm (down).
JG125 + MCPBA excess:
400 450 500 550 6000.0
0.1
0.2
0.3
0.4
0.5
0.6
Abso
rban
ce
Wavelength (nm)0 2 4 6 8 10 12 14
0,0
0,1
0,2
0,3
0,4
0,5
Abs
orba
nce
JG125 concentration (M)
y = 28.93x + 7.319R² = 0.998
y = 0.0341x – 0.0057R² = 0.999
y = 0.0363x – 0.0059R² = 0.9996

S25
550 600 650 7000
200
400
600
800
1000
1200
1400
1600
1800
Emis
sion
inte
nsity
(a.u
.)
Emission wavelength (nm)0 2 4 6 8 10 12
0
200
400
600
Emis
sion
inte
nsity
(a.u
.)
JG125 concentration (M)
Figure S48. Absorbance (up) and fluorescence (down) of JG125 solution in CHCl3:MeOH 9:1, under increasing concentrations of JG125 and excess MCPBA.
The maximum the fluorescence increases at 560 nm after adding the oxidant. The work concentration ideally should be at 0.1 of absorbance or less, to avoid inner filter effects and possible dynamic quenching or stacking processes. Therefore, the chosen concentration was 2.5 µM, value around which the Lambert-Beer law is fulfilled.
4.3. Quantitative measures of probes vs TATP and mCPBA in solution:
In order to determine the behavior of PC63 and JG125 with oxidants, the measurements carried out were the next ones:
I. TATP titration: optical changes and the limit of detection.
II. MCPBA titration: optical changes and the limit of detection.
The limit of detection was also calculated for both probes. The emission was adjusted to a minimum squares linear regression. The sloped is checked to be different of zero and without presence of outliers.Then, with the program “R”, the limit of detection associated to the linear regression was calculated. In order to obtain a reliable limit, the values of false positive and false negative were fixed as equal or inferior to 5%.
I. Titration of JG125:A solution of JG125 (2.5·μM) in CHCl3:MeOH 9:1 were prepared. The conditions were:
The concentration of TATP and mCPBA was increased by adding from a concentrated solution in the same solvent.
λexc = 500 nm, λem = 556 nm. The absorbance and fluorescence changes were registered at 25 ºC.
y = 48.627x – 78.33R² = 0.9958
S26
TATP titration:
550 600 650 7000
200
400
600
800
1000
1200
Emis
sion
inte
nsity
(a.u
.)
Wavelength (nm)
0 5000 10000 15000 20000
0
200
400
600
800
1000
1200
Emis
sion
inte
nsity
(a.u
.)
TATP concentration (M)800 1000 1200 1400 1600 1800
20
25
30
35
40
Emis
sion
inte
nsity
(a.u
.)
Concentration (M)
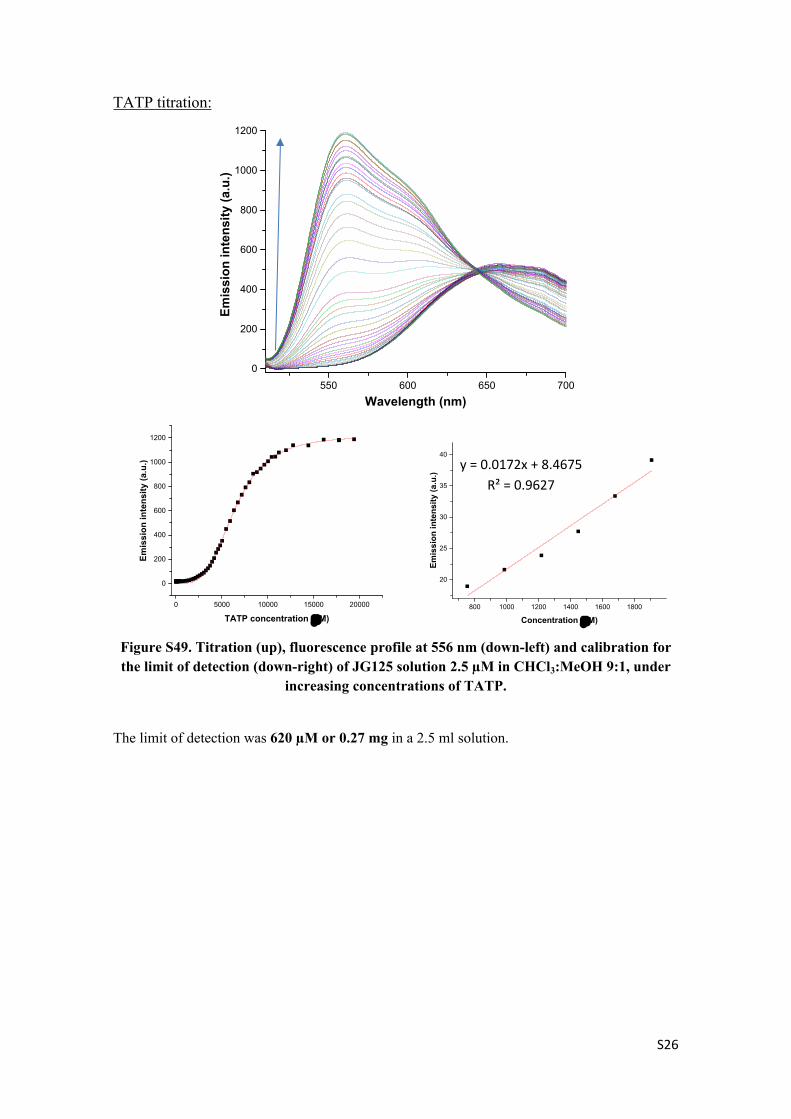
Figure S49. Titration (up), fluorescence profile at 556 nm (down-left) and calibration for the limit of detection (down-right) of JG125 solution 2.5 µM in CHCl3:MeOH 9:1, under
increasing concentrations of TATP.
The limit of detection was 620 µM or 0.27 mg in a 2.5 ml solution.
y = 0.0172x + 8.4675R² = 0.9627

S27
mCPBA titration:
550 600 650 7000
200
400
600
800
1000
1200
Emis
sion
inte
nsity
(a.u
.)
Wavelength (nm)
0 1000 2000 3000 4000 5000 6000 7000
0
250
500
750
1000
1250
Em
issi
on in
tens
ity (a
.u.)
mCPBA concentration (M)
6 8 10 12 14 16 18 20 22 24 26 28
14
16
18
Em
issi
on in
tens
ity (a
.u.)
Concentration (M)
Figure S50. Titration (up), fluorescence profile at 556 nm (down-left) and calibration for the limit of detection (down-right) of JG125 solution 2.5 µM in CHCl3:MeOH 9:1, under
increasing concentrations of mCPBA.
The limit of detection was 7.4 µM or 0.0032 mg in a 2.5 ml solution.
II. Titration of PC63:A PC63 solution (2.5 μM) in CHCl3:MeOH 9:1 was prepared. The conditions were:
The concentration of TATP and mCPBA was increased by adding aliquots from a concentrated solution in the same solvent.
λexc = 484 nm, λem = 536 nm. The absorbance and fluorescence changes were registered at 25 ºC.
y = 0.2562x + 11.941R² = 0.9885

S28
TATP titration:
500 550 600 650 7000
100
200
300
400
500
600
700
Em
issi
on in
tens
ity (a
.u)
Wavelength (nm)
0,000 0,005 0,010 0,015 0,020 0,025 0,030 0,035 0,040400
420
440
460
480
500
520
540
560
Emis
sion
inte
nsity
(a.u
)
TATP concentration (M)
0,002 0,004 0,006 0,008 0,010 0,012
420
440
460
480
500
520
Em
issi
on in
tens
ity (a
.u)
TATP concentration (M)
Figure S51. Titration (up), fluorescence profile at 536 nm (down-left) and calibration for the limit of detection (down-right) of PC63 solution 2.5 µM in CHCl3:MeOH 9:1, under
increasing concentrations of TATP.
The limit of detection was 4.83 mM or 2.1 mg in a 2.5 ml solution.
y = 10559x + 406.92R² = 0.9833

S29
mCPBA titration:
500 600 7000
100
200
300
400
500
600
700
800
Em
issi
on In
tens
ity (a
.u)
Wavelength (nm)
0,00 0,01 0,02 0,03 0,04 0,050
100
200
300
400
500
600
700
Em
issi
on In
tens
ity (a
.u)
mCPBA concentration (M)
501 nm 557 nm
0.015 0.020 0.025
300
400
Em
issi
on in
tens
ity (a
.u.)
Concentration (M)
Figure S52. Titration (up), fluorescence profile at 536 nm (down-left) and calibration for the limit of detection (down-right) of PC63 solution 2.5 µM in CHCl3:MeOH 9:1, under
increasing concentrations of MCPBA.
The limit of detection was 3.2 mM or 1.4 mg in a 2.5 ml solution.
There are two fluorescent responses for the increase of MCPBA concentration, between 3 mM to 32 mM the increase is at 557 nm, then, the fluorescence increases at 501 nm, appearing a new band.
y = 19280x – 4.1445R² = 0.9974

S30
4.4. Quantum yield and lifetime measurements
Quantum yield was determined by its general equation:
Φ=Φ𝑅𝑛2
𝑛2𝑅
𝐴𝑅𝐴𝐹𝐹𝑅
Where Φ is the quantum yield. n represents the refractive index of the solvent.
o n(EtOH) = 1.362o n(CHCl3) = 1.458
A is the absorbance. F is the fluorescence. R means that the parameter is associated to a reference sample.
Parameters: The chosen reference was Rhodamine 6G. The integral was done between 480 – 800 nm, and the Rayleigh signal was
deconvoluted.
The process was repeated three times to obtain the media and a confidence interval. Keeping in mind that the error associated to the method is 1 %, higher than the experimental results.So:
Φ JG125 (CHCl3) = 0.23 ± 0.01Φ JG125+TATP (CHCl3) = 0.65 ± 0.01Φ/ Φ0 = 2.8Φ PC63 (CHCl3) = 0.27 ± 0.01Φ PC63+TATP (CHCl3) = 0.36 ± 0.01 Φ/ Φ0 = 1.33
5. TATP DETECTION IN MODIFIED SILICA:
Several samples were tested as potential TATP sensors, it can be distinguished 3 kinds of modified silica and two probes, the monoimide derivatives (JG125) and diimide derivatives (PC63):
Modified silica nanoparticles (nJG131 and nJG135): 4 mg of probe every 500 mg of silica.
Modified supported silica (pJG131 and pJG135): 0.5 mg every 5×10 cm layer. Silica adsorbed probes (pJG125 and pPC63) were studied: 0.5 mg every 5x10
cm layer.The ratio probe/silica can be altered obtaining different results. The change is the intensity of the color and, specially, in fluorescence. Therefore, it was chosen the optimum ratio to show a clear increase in fluorescence.

S31
The changes in fluorescence were compared between different vapors:Nothing – TATP – HCl – H2O2
The HCl samples increase the fluorescence in all cases, however, this process is different from the increase with TATP. After being under vapors of an amine, like Et3N, the fluorescence of the HCl samples decreases again, a process that does not occur for TATP.So as to measure the increase in fluorescence with TATP, the flux of N2 was controlled to be 100 cm3/min and the temperature in the TATP flask around 55 ºC, going through a flask with 2 mg of TATP. Being able to detect changes in the fluorescence of the probes within several minutes.
N2
N2 + TATP
TATP
N2+ TATP
SENSOR
Figure S53. System to measure a TATP current with the supported sensor.
The changes were studied by several methods that gave different information about the sample:

S32
As a code of colors from the pictures of fluorescent changes. It may be compared in order to detect qualitatively the presence of TATP in the environment, comparing with the initial color. It has to be taken into account that the absorbance and fluorescence depend on the amount of the probe that there is on the silica. (showed in the paper)
Then, the increase in fluorescence in solids was measured by calculation of the quantum yield and measuring the increase directly in the solid. The quantum yield depends on the quantity of the probe that is contained, providing that the quantity of probe is not too high or too low. It would be possible to measure changes in fluorescence by only fluorescence intensity, however, the measures are sometimes dependent on the position of the solid in the sample and factors difficult to control without designing a device for doing so. As a consequence, quantum yields are the most trustworthy way to measure it quantitatively.
The spectra were normalized in order to obtain information from the position of the excitation and emission peaks, which is a way to distinguish between oxidants.
5.1. Quantitative study of the presence of the peaks, excitation and emission in fluorescence:
nJG131
300 400 500 6000.0
0.2
0.4
0.6
0.8
1.0
Nor
mal
ized
Exc
itatio
n In
tens
ity
Wavelength (nm)
nJG131 nJG131+TATP nJG131+HCl
550 600 650 700 750 8000.0
0.2
0.4
0.6
0.8
1.0
Nor
mal
ized
em
issi
on In
tens
ity
Wavelength (nm)
nJG131 nJG131+TATP nJG131+HCl
550 600 650 700 750 8000
10000
20000
30000
40000
50000
Emis
sion
Inte
nsity
(a.u
.)
Wavelength (nm)
nJG131 nJG131+TATP nJG131+HCl nJG131+H2O2
Figure S54. Response in excitation and fluorescence of nJG131. λexc = 492 nm, λem = 614 nm.

S33
pJG131
300 400 500 6000.0
0.2
0.4
0.6
0.8
1.0N
orm
aliz
ed E
xcita
tion
Inte
nsity
Wavelength (nm)
pJG131 pJG131+TATP pJG131+HCl
550 600 650 700 750 8000.0
0.2
0.4
0.6
0.8
1.0
Nor
mal
ized
Em
issi
on In
tens
ity
Wavelength (nm)
pJG131 pJG131+TATP pJG131+HCl
550 600 650 700 750 8000
10000
20000
30000
40000
Emis
sion
Inte
nsity
(a.u
.)
Wavelength (nm)
pJG131 pJG131+TATP pJG131+HCl
Figure S55. Response in excitation and fluorescence of pJG131. λexc = 438 nm, λem = 630 nm.

S34
aJG125 adsorbed on TLC plates
250 300 350 400 450 500 5500.0
0.2
0.4
0.6
0.8
1.0N
orm
aliz
ed E
xcita
tion
Inte
nsity
Wavelength (nm)
pJG125 pJG125+TATP pJG125+HCl
550 600 650 700 750 800 8500.0
0.2
0.4
0.6
0.8
1.0
Nor
mal
ized
Em
issi
on In
tens
ity
Wavelength (nm)
pJG125 pJG125+TATP pJG125+HCl
550 600 650 700 750 800 8500
10000
20000
30000
40000
50000
60000
70000
Emis
sion
Inte
nsity
(a.u
.)
Wavelength (nm)
aJG125 aJG125+TATP aJG125+HCl
Figure S56. Response in excitation and fluorescence of abs aJG125. λexc = 500 nm, λem = 605 nm

S35
nJG135
250 300 350 400 450 500 5500.0
0.2
0.4
0.6
0.8
1.0
Nor
mal
ized
Exc
itatio
n In
tens
ity
Wavelength (nm)
nJG135 nJG135+TATP nJG135+HCl
550 600 650 700 750 8000.0
0.2
0.4
0.6
0.8
1.0
Nor
mal
ized
Em
issi
on In
tens
ity
Wavelength (nm)
nJG135 nJG135+TATP nJG135+HCl
550 600 650 700 750 8000
10000
20000
30000
40000
50000
60000
70000
80000
Emis
sion
Inte
nsity
(a.u
.)
Wavelength (nm)
nJG135 nJG135+TATP nJG135+HCl nJG135+H2O2
Figure S57. Response in excitation and fluorescence of nJG135. λexc = 495 nm, λem = 592 nm

S36
pJG135
250 300 350 400 450 5000.0
0.2
0.4
0.6
0.8
1.0
Nor
mal
ized
Exc
itatio
n In
tens
ity
Wavelength (nm)
pJG135 pJG135+TATP pJG135+HCl
500 550 600 650 700 750 8000.0
0.2
0.4
0.6
0.8
1.0
Nor
mal
ized
Em
issi
on In
tens
ity
Wavelength (nm)
pJG135 pJG135+TATP pJG135+HCl
500 550 600 650 700 750 8000
10000
20000
30000
40000
50000
60000
70000
Emis
sion
Inte
nsity
(a.u
.)
Wavelength (nm)
pJG135 pJG135+TATP pJG135+HCl
Figure S58. Response in excitation and fluorescence of pJG135. λexc = 487 nm, λem = 533 nm

S37
aPC63 adsorbed on TLC plates
250 300 350 400 450 5000.0
0.2
0.4
0.6
0.8
1.0N
orm
aliz
ed E
xcita
tion
Inte
nsity
Wavelength (nm)
pPC63 pPC63+TATP pPC63+HCl
550 600 650 700 750 8000.0
0.2
0.4
0.6
0.8
1.0
Nor
mal
ized
Em
issi
on In
tens
ity
Wavelength (nm)
aPC63 aPC63+TATP aPC63+HCl
550 600 650 700 750 8000
10000
20000
30000
40000
50000
60000
Emis
sion
Inte
nsity
(a.u
.)
Wavelength (nm)
aPC63 aPC63+TATP aPC63+HCl
Figure S59. Response in excitation and fluorescence of pPC63. λexc = 496 nm, λem = 550 nm
These spectra allow us to distinguish between acid and TATP in several ways: The monoimide derivatives (nJG131, pJG131 and pJG125) have a maximum
of emission shift to lower wavelengths in presence of acids. The diimides (nJG135, pJG135 and aPC63) increase their fluorescence at
higher wavelengths only in presence of TATP In nJG135 and pJG135 the excitation at lower wavelengths, around 320 nm,
changes depending on if it is TATP or HCl. pPC63 does not show significant changes in the position of the bands.
5.3. Study of increment on the emission:
The most trustworthy method to measure with precision the increase in fluorescence of a material is by calculation of its quantum yield. To do so, it is necessary to have a fluorometer provided with an integration sphere, in this case a fluorometer Edinburgh Instruments FLS980. The precision of this method is checked by repeating three times each sample, it allows to obtain errors of less than 2%.

S38
ΦTATP/Φ0 ΦHCl/Φ0nJG131 3.5 1.6pJG131 3.4 1.0aJG125 3.0 1.4nJG135 3.1 1.6pJG135 3.5 1.6aPC63 3.2 1.7
Figure S60. Increase in fluorescence between the initial and after being under excess of TATP.
In all cases, the increase in fluorescence goes from 2-4 % to 7-15 %. It depends on the relation probe/silica.
As a general rule, the increase in fluorescence with the probes is situated between 3 to 3.5 times in all samples for TATP and less than 1.7 times with HCl samples.
5.4. Titration under increasing concentration of TATP
Previous testing conditions were performed under a flux of TATP and retired within a few minutes. So as to improve the precision, the increase in fluorescence was tested by measuring TATP quantum yield. The system would need to be coupled to a fluorometer in order to assure the exact quantity (continuous measurements).
Then, this experiment was performed to calculate the minimum amount in gas that produces a detectable response, the calibration was measured in steady state. Fixed quantities of TATP where vaporized in the presence of a sample containing 15 mg of silica nanoparticles and the fluorescence increase was measured.
0.0 0.5 1.0 1.5 2.0 2.5 3.01
2
3
4
5
6
Emis
sion
inte
nsity
x 1
0-4(a
.u.)
TATP (mg)0.0 0.1 0.2 0.3 0.4 0.5 0.6 0.7 0.8
1.5
2.0
2.5
3.0
3.5
4.0
Emis
sion
inte
nsity
x 1
0-4 (a
.u.)
TATP (mg)
Figure S61. Calibration, adding increasing concentrations of TATP. of nJG131. λexc = 495 nm, λem = 620 nm.
y = 2.85x + 1.84R² = 0.94

S39
By making a linear regression at low quantities of TATP the LOD was calculated by having a 5 % or less of false positive/negative when detecting TATP. The calculations lead to a limit of detection of 0.12 mgL-1. (Same method than previous LODs).
Using less TATP leads to low repeatability because of the difficult when handling low quantities. Therefore, 0.12 mgL-1 represents the minimum amount reliably detected by the technique developed.
5.5. Summary of fluorescence measurements
The presence of TATP may be detected easily and qualitatively with any of the silica systems with a code of colors or registering the increase in fluorescence.
In order to distinguish with more precision, by registering the spectra and the increase in fluorescence, it is possible to distinguish selectively TATP from acid.
nJG131 pJG131 aJG125
nJG135 pJG135 aPC63
AcidVapors
H2O2Vapors
TATPVapors
FluorescentEmission
FluorescentEmission
FluorescentEmission
AmineVapors
AmineVapors
FluorescentEmission
FluorescentEmissionconstant
Emission
Emissionconstant
nJG131 pJG131aJG125
Figure S62. Scheme showing the interpretation of the results and the application of the different probes.

S40
5.6. ElectrochemistryCyclic voltammetry of compounds JG125 and JG125d. Internal reference: Ferrocene
N NN
O
O
NO
OJG125
-1.5 -1.0 -0.5 0.0 0.5 1.0 1.5-10
-8
-6
-4
-2
0
2
4
6
8
Cur
rent
(A
)
Potential (V)
Figure S63. Cyclic voltammetry of compound JG125
HN NN
O
O
N
JG125d
-2.0 -1.5 -1.0 -0.5 0.0 0.5 1.0 1.5 2.0-120
-100
-80
-60
-40
-20
0
20
40
Cur
rent
(A
)
Potential (V)
Figure S64. Cyclic voltammetry of compound JG125d

S41
N NN
O
O
NO
O
JG125
O
+ H+
Figure S65. Mass spectrometry of compound JG125[O]. The highest peak corresponds to JG125 + Oxygen + H+, detected by Mass Spectrometry in the MALDI MS spectrum. HRMS (MALDI) m/z calcd for C48H49N4O5: 761.3703 (M++1); found: 761.4210.
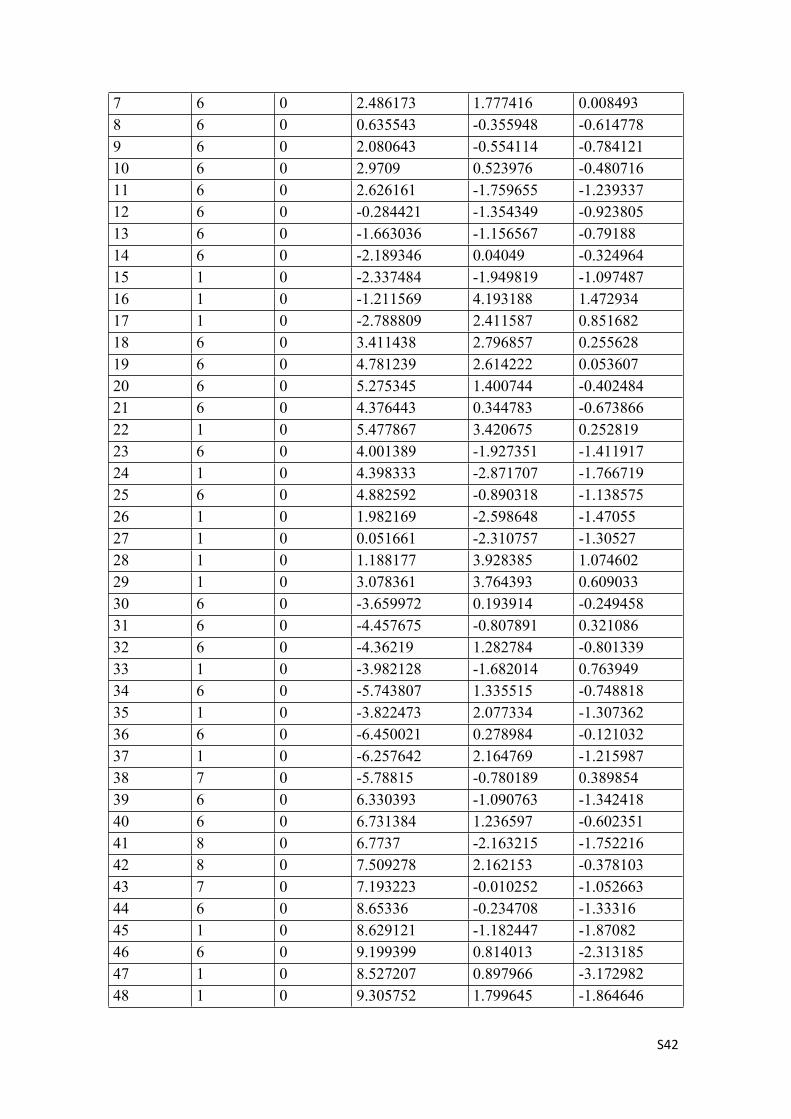
5.7. Quantum chemical calculations
Table S01. Atomic coordinates of optimized JG125
Coordinates (Angstroms)CenterNumber
AtomicNumber
AtomicType X Y Z
1 6 0 -0.847896 3.281212 1.0105142 6 0 0.526673 3.121075 0.785613 6 0 1.042111 1.951191 0.2326744 6 0 0.140825 0.891287 -0.1145245 6 0 -1.274545 1.080423 0.0615236 6 0 -1.731504 2.285349 0.655587
S42
7 6 0 2.486173 1.777416 0.0084938 6 0 0.635543 -0.355948 -0.6147789 6 0 2.080643 -0.554114 -0.78412110 6 0 2.9709 0.523976 -0.48071611 6 0 2.626161 -1.759655 -1.23933712 6 0 -0.284421 -1.354349 -0.92380513 6 0 -1.663036 -1.156567 -0.7918814 6 0 -2.189346 0.04049 -0.32496415 1 0 -2.337484 -1.949819 -1.09748716 1 0 -1.211569 4.193188 1.47293417 1 0 -2.788809 2.411587 0.85168218 6 0 3.411438 2.796857 0.25562819 6 0 4.781239 2.614222 0.05360720 6 0 5.275345 1.400744 -0.40248421 6 0 4.376443 0.344783 -0.67386622 1 0 5.477867 3.420675 0.25281923 6 0 4.001389 -1.927351 -1.41191724 1 0 4.398333 -2.871707 -1.76671925 6 0 4.882592 -0.890318 -1.13857526 1 0 1.982169 -2.598648 -1.4705527 1 0 0.051661 -2.310757 -1.3052728 1 0 1.188177 3.928385 1.07460229 1 0 3.078361 3.764393 0.60903330 6 0 -3.659972 0.193914 -0.24945831 6 0 -4.457675 -0.807891 0.32108632 6 0 -4.36219 1.282784 -0.80133933 1 0 -3.982128 -1.682014 0.76394934 6 0 -5.743807 1.335515 -0.74881835 1 0 -3.822473 2.077334 -1.30736236 6 0 -6.450021 0.278984 -0.12103237 1 0 -6.257642 2.164769 -1.21598738 7 0 -5.78815 -0.780189 0.38985439 6 0 6.330393 -1.090763 -1.34241840 6 0 6.731384 1.236597 -0.60235141 8 0 6.7737 -2.163215 -1.75221642 8 0 7.509278 2.162153 -0.37810343 7 0 7.193223 -0.010252 -1.05266344 6 0 8.65336 -0.234708 -1.3331645 1 0 8.629121 -1.182447 -1.8708246 6 0 9.199399 0.814013 -2.31318547 1 0 8.527207 0.897966 -3.17298248 1 0 9.305752 1.799645 -1.864646

S43
49 1 0 10.171789 0.488687 -2.69189350 6 0 9.533977 -0.522139 -0.06759351 6 0 8.793793 -1.48222 0.90166352 6 0 10.821043 -1.251424 -0.55494753 6 0 9.971697 0.732061 0.73209954 1 0 8.476125 -2.38134 0.35979155 1 0 7.883835 -0.999007 1.27759156 6 0 9.693908 -1.872408 2.0918257 1 0 11.386168 -0.607604 -1.23933758 1 0 10.540982 -2.15052 -1.12059859 6 0 11.725153 -1.644717 0.63057260 1 0 9.093428 1.268262 1.09908261 1 0 10.509566 1.426968 0.07601762 6 0 10.877634 0.339012 1.9185363 1 0 9.134953 -2.544137 2.75607864 6 0 10.955443 -2.59007 1.57275465 6 0 10.106117 -0.603329 2.86386566 1 0 12.618047 -2.153076 0.24443967 6 0 12.140546 -0.375789 1.40057268 1 0 11.166026 1.248751 2.46097769 1 0 10.675597 -3.50849 1.04000670 1 0 11.59458 -2.889887 2.41380471 1 0 9.215555 -0.095523 3.25710972 1 0 10.730113 -0.87102 3.72688373 1 0 12.799516 -0.640141 2.23824374 1 0 12.711163 0.294486 0.74401375 6 0 -8.662077 1.312223 -0.58368876 6 0 -8.526923 -0.992889 0.24427477 6 0 -9.949178 1.511128 0.2230378 1 0 -8.912345 1.050888 -1.62414579 1 0 -8.129328 2.263157 -0.59148680 6 0 -9.804525 -0.785363 1.05583881 1 0 -8.785171 -1.447646 -0.72554782 1 0 -7.854791 -1.668161 0.76982183 1 0 -10.622593 2.185375 -0.30453184 1 0 -9.697477 1.957487 1.19575785 1 0 -10.36213 -1.717628 1.10991486 1 0 -9.544474 -0.474312 2.07780687 7 0 -7.826844 0.277688 0.02403288 7 0 -10.634496 0.24314 0.43310889 6 0 -11.980759 0.148016 0.20367890 8 0 -12.655857 1.06558 -0.254177

S44
91 8 0 -12.447589 -1.077213 0.53566692 6 0 -13.864524 -1.441862 0.34231493 6 0 -14.758098 -0.552761 1.21191794 6 0 -14.229186 -1.365221 -1.14294895 6 0 -13.9005 -2.890903 0.83383996 1 0 -14.439818 -0.601762 2.25794297 1 0 -14.722685 0.484372 0.87883298 1 0 -15.791881 -0.907496 1.15457399 1 0 -13.542161 -1.977873 -1.735041100 1 0 -15.242229 -1.752556 -1.290066101 1 0 -14.189137 -0.337662 -1.504032102 1 0 -14.914508 -3.290639 0.744554103 1 0 -13.22832 -3.517356 0.240293104 1 0 -13.596189 -2.951374 1.882754
Table S02. Atomic coordinates of optimized oxidized JG125+·.
Coordinates (Angstroms)CenterNumber
AtomicNumber
AtomicType X Y Z
1 6 0 -0.942018 3.216026 1.0227412 6 0 0.425057 3.085892 0.7929453 6 0 0.969726 1.894975 0.291464 6 0 0.090631 0.805958 -0.0068695 6 0 -1.327645 0.972485 0.1577666 6 0 -1.806792 2.175462 0.7170327 6 0 2.409093 1.738796 0.0841258 6 0 0.614449 -0.456254 -0.4325489 6 0 2.043952 -0.617485 -0.63664910 6 0 2.912239 0.488129 -0.3791211 6 0 2.609719 -1.82305 -1.09219312 6 0 -0.285831 -1.522911 -0.62659513 6 0 -1.65171 -1.359183 -0.49779814 6 0 -2.221977 -0.111675 -0.17888415 1 0 -2.297755 -2.196631 -0.734637

S45
16 1 0 -1.329977 4.132332 1.45404217 1 0 -2.859171 2.280033 0.94758318 6 0 3.322344 2.780389 0.31451419 6 0 4.691793 2.620366 0.10204420 6 0 5.1976 1.40848 -0.34959421 6 0 4.314811 0.334953 -0.59250822 1 0 5.3766 3.439868 0.28502623 6 0 3.981426 -1.959819 -1.29555524 1 0 4.395234 -2.895713 -1.65140925 6 0 4.838587 -0.893411 -1.05069726 1 0 1.981189 -2.677605 -1.30551927 1 0 0.078995 -2.498454 -0.91932328 1 0 1.067507 3.921355 1.0390329 1 0 2.976509 3.745398 0.66117630 6 0 -3.663298 0.032449 -0.26279531 6 0 -4.52198 -1.036634 0.11324332 6 0 -4.318122 1.182842 -0.77332933 1 0 -4.093691 -1.942931 0.53562134 6 0 -5.686838 1.225763 -0.87790635 1 0 -3.736664 2.018464 -1.14529136 6 0 -6.453261 0.102032 -0.44329537 1 0 -6.152018 2.093045 -1.32463138 7 0 -5.836637 -1.007519 0.04861139 6 0 6.294552 -1.061841 -1.2918640 6 0 6.660593 1.267774 -0.57207641 8 0 6.734421 -2.126985 -1.71281942 8 0 7.413198 2.211946 -0.36072343 7 0 7.139905 0.031614 -1.02624944 6 0 8.600623 -0.159819 -1.34769845 1 0 8.58168 -1.098974 -1.90050646 6 0 9.098374 0.916084 -2.32366447 1 0 8.38675 1.024329 -3.14799948 1 0 9.231175 1.889351 -1.85554749 1 0 10.049811 0.598077 -2.75665350 6 0 9.512083 -0.446208 -0.10527151 6 0 8.832246 -1.472398 0.84045652 6 0 10.824736 -1.095719 -0.63449553 6 0 9.900406 0.80076 0.73036654 1 0 8.550761 -2.36846 0.27417755 1 0 7.906117 -1.045804 1.24525456 6 0 9.767018 -1.858032 2.00518857 1 0 11.349835 -0.400658 -1.29992

S46
58 1 0 10.580502 -1.985559 -1.23051959 6 0 11.762283 -1.486236 0.52571660 1 0 9.00386 1.280936 1.13060961 1 0 10.393814 1.543166 0.0919862 6 0 10.842005 0.411936 1.8905563 1 0 9.249105 -2.576547 2.65335764 6 0 11.052245 -2.49818 1.44555465 6 0 10.130414 -0.597069 2.81383366 1 0 12.671918 -1.938151 0.11015867 6 0 12.129022 -0.224935 1.33188668 1 0 11.095075 1.316172 2.45879869 1 0 10.807749 -3.410796 0.88620370 1 0 11.717267 -2.794546 2.26724771 1 0 9.223123 -0.14605 3.23715372 1 0 10.779623 -0.863381 3.65819673 1 0 12.81148 -0.484975 2.15165874 1 0 12.658092 0.49245 0.69075775 6 0 -8.65404 1.15822 -0.98697676 6 0 -8.570715 -1.144422 -0.1443177 6 0 -9.735632 1.492651 0.05402978 1 0 -9.129263 0.846242 -1.92474879 1 0 -8.061232 2.047635 -1.18236980 6 0 -9.649964 -0.805586 0.89417581 1 0 -9.047579 -1.531577 -1.05316982 1 0 -7.880446 -1.88943 0.24218783 1 0 -10.432053 2.221107 -0.35892884 1 0 -9.25787 1.923745 0.94351685 1 0 -10.2714 -1.680365 1.06978786 1 0 -9.167826 -0.524686 1.8397987 7 0 -7.808546 0.059113 -0.51012888 7 0 -10.477153 0.298541 0.42425789 6 0 -11.839732 0.256318 0.24796790 8 0 -12.488334 1.202513 -0.1844391 8 0 -12.3395 -0.940407 0.61617392 6 0 -13.787975 -1.23209 0.53941293 6 0 -14.558563 -0.288372 1.46621194 6 0 -14.26288 -1.146978 -0.91347495 6 0 -13.85852 -2.672887 1.04938696 1 0 -14.16621 -0.351898 2.48584197 1 0 -14.489858 0.743895 1.12277698 1 0 -15.612348 -0.582519 1.48877799 1 0 -13.659507 -1.801261 -1.550391
S47
100 1 0 -15.30353 -1.479937 -0.974599101 1 0 -14.198337 -0.126276 -1.290213102 1 0 -14.895495 -3.01981 1.041781103 1 0 -13.267112 -3.337814 0.41329104 1 0 -13.478875 -2.740854 2.072901}
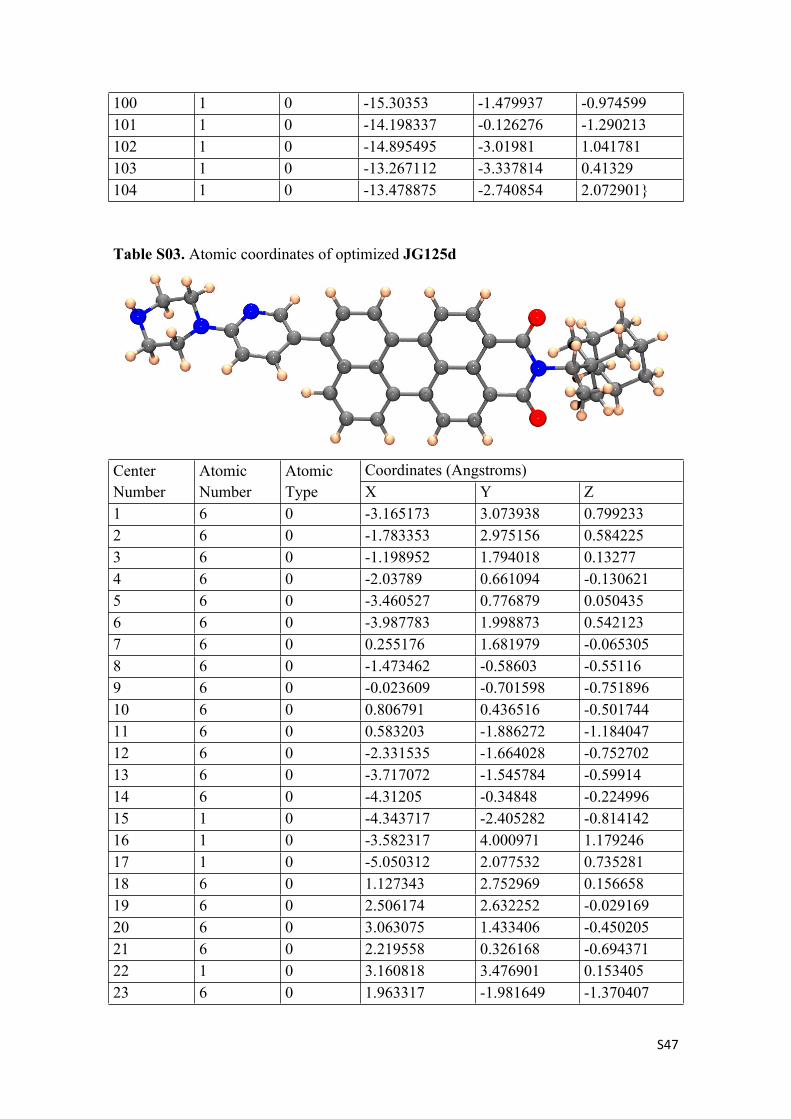
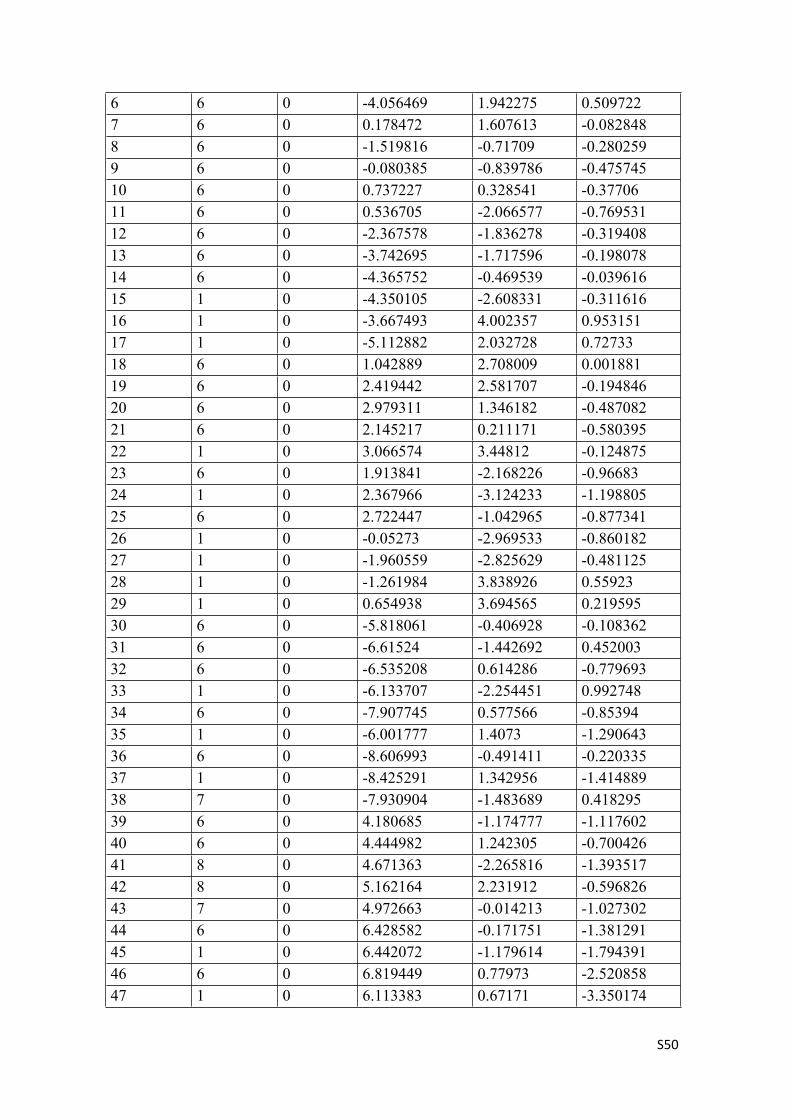
Table S03. Atomic coordinates of optimized JG125d
Coordinates (Angstroms)CenterNumber
AtomicNumber
AtomicType X Y Z
1 6 0 -3.165173 3.073938 0.7992332 6 0 -1.783353 2.975156 0.5842253 6 0 -1.198952 1.794018 0.132774 6 0 -2.03789 0.661094 -0.1306215 6 0 -3.460527 0.776879 0.0504356 6 0 -3.987783 1.998873 0.5421237 6 0 0.255176 1.681979 -0.0653058 6 0 -1.473462 -0.58603 -0.551169 6 0 -0.023609 -0.701598 -0.75189610 6 0 0.806791 0.436516 -0.50174411 6 0 0.583203 -1.886272 -1.18404712 6 0 -2.331535 -1.664028 -0.75270213 6 0 -3.717072 -1.545784 -0.5991414 6 0 -4.31205 -0.34848 -0.22499615 1 0 -4.343717 -2.405282 -0.81414216 1 0 -3.582317 4.000971 1.17924617 1 0 -5.050312 2.077532 0.73528118 6 0 1.127343 2.752969 0.15665819 6 0 2.506174 2.632252 -0.02916920 6 0 3.063075 1.433406 -0.45020521 6 0 2.219558 0.326168 -0.69437122 1 0 3.160818 3.476901 0.15340523 6 0 1.963317 -1.981649 -1.370407

S48
24 1 0 2.408507 -2.91059 -1.70825225 6 0 2.788803 -0.891988 -1.12986226 1 0 -0.015776 -2.76455 -1.38877927 1 0 -1.940486 -2.626648 -1.05869728 1 0 -1.171606 3.843116 0.79682729 1 0 0.745152 3.712243 0.48164430 6 0 -5.787619 -0.284539 -0.12129631 6 0 -6.500427 -1.264938 0.5824232 6 0 -6.576357 0.687761 -0.76643833 1 0 -5.9545 -2.050707 1.10327834 6 0 -7.956169 0.654466 -0.67706135 1 0 -6.104406 1.456344 -1.37110736 6 0 -8.575103 -0.368603 0.08705337 1 0 -8.536198 1.392614 -1.21406638 7 0 -7.827549 -1.317077 0.69131139 6 0 4.243221 -1.018727 -1.34283840 6 0 4.527178 1.335006 -0.63301341 8 0 4.740069 -2.073044 -1.73836342 8 0 5.260656 2.29481 -0.40221843 7 0 5.049387 0.110361 -1.07711244 6 0 6.517525 -0.042831 -1.36071745 1 0 6.538146 -0.993826 -1.89227246 6 0 7.008938 1.024748 -2.34863147 1 0 6.348215 1.050651 -3.22102448 1 0 7.042563 2.021703 -1.91389649 1 0 8.007869 0.759318 -2.70482950 6 0 7.417742 -0.277513 -0.0967251 6 0 6.702052 -1.206517 0.91927352 6 0 8.702214 -1.014858 -0.57849253 6 0 7.858628 1.009544 0.64706754 1 0 6.38345 -2.127922 0.41693455 1 0 5.794627 -0.717207 1.2932556 6 0 7.625556 -1.545303 2.10753957 1 0 9.248554 -0.394209 -1.29906858 1 0 8.4193 -1.937811 -1.1025759 6 0 9.630278 -1.355523 0.60433660 1 0 6.981146 1.552681 1.00591361 1 0 8.380707 1.681601 -0.04500562 6 0 8.787356 0.667792 1.83212663 1 0 7.083542 -2.196196 2.80568664 6 0 8.884613 -2.27138 1.59414865 6 0 8.03975 -0.245118 2.824652

S49
66 1 0 10.520865 -1.870958 0.22225767 6 0 10.047732 -0.055879 1.31992968 1 0 9.076899 1.599225 2.33575969 1 0 8.604042 -3.211217 1.10057970 1 0 9.540327 -2.534187 2.43474971 1 0 7.151901 0.26996 3.21448472 1 0 8.680974 -0.475302 3.68588473 1 0 10.721624 -0.284527 2.15627574 1 0 10.602602 0.593831 0.63009475 6 0 -10.858731 0.427511 -0.46686676 6 0 -10.542084 -1.706969 0.72149677 6 0 -12.176609 0.614548 0.30296378 1 0 -11.065794 0.008248 -1.46633979 1 0 -10.405167 1.40965 -0.60736580 6 0 -11.852111 -1.454914 1.47351581 1 0 -10.739124 -2.352957 -0.15158782 1 0 -9.821293 -2.220672 1.35549883 1 0 -12.87446 1.180795 -0.32235584 1 0 -11.976731 1.214108 1.20023885 1 0 -12.316364 -2.41561 1.71917686 1 0 -11.631423 -0.943032 2.41893887 7 0 -9.942993 -0.442115 0.27325388 7 0 -12.813027 -0.631965 0.73112589 1 0 -13.116334 -1.147726 -0.095
Table S04. Atomic coordinates of optimized oxidized JG125d+·.
Coordinates (Angstroms)CenterNumber
AtomicNumber
AtomicType X Y Z
1 6 0 -3.239971 3.050656 0.6564582 6 0 -1.865885 2.948785 0.4394223 6 0 -1.2697 1.726804 0.1095594 6 0 -2.099365 0.567728 -0.026935 6 0 -3.52355 0.691852 0.126528
S50
6 6 0 -4.056469 1.942275 0.5097227 6 0 0.178472 1.607613 -0.0828488 6 0 -1.519816 -0.71709 -0.2802599 6 0 -0.080385 -0.839786 -0.47574510 6 0 0.737227 0.328541 -0.3770611 6 0 0.536705 -2.066577 -0.76953112 6 0 -2.367578 -1.836278 -0.31940813 6 0 -3.742695 -1.717596 -0.19807814 6 0 -4.365752 -0.469539 -0.03961615 1 0 -4.350105 -2.608331 -0.31161616 1 0 -3.667493 4.002357 0.95315117 1 0 -5.112882 2.032728 0.7273318 6 0 1.042889 2.708009 0.00188119 6 0 2.419442 2.581707 -0.19484620 6 0 2.979311 1.346182 -0.48708221 6 0 2.145217 0.211171 -0.58039522 1 0 3.066574 3.44812 -0.12487523 6 0 1.913841 -2.168226 -0.9668324 1 0 2.367966 -3.124233 -1.19880525 6 0 2.722447 -1.042965 -0.87734126 1 0 -0.05273 -2.969533 -0.86018227 1 0 -1.960559 -2.825629 -0.48112528 1 0 -1.261984 3.838926 0.5592329 1 0 0.654938 3.694565 0.21959530 6 0 -5.818061 -0.406928 -0.10836231 6 0 -6.61524 -1.442692 0.45200332 6 0 -6.535208 0.614286 -0.77969333 1 0 -6.133707 -2.254451 0.99274834 6 0 -7.907745 0.577566 -0.8539435 1 0 -6.001777 1.4073 -1.29064336 6 0 -8.606993 -0.491411 -0.22033537 1 0 -8.425291 1.342956 -1.41488938 7 0 -7.930904 -1.483689 0.41829539 6 0 4.180685 -1.174777 -1.11760240 6 0 4.444982 1.242305 -0.70042641 8 0 4.671363 -2.265816 -1.39351742 8 0 5.162164 2.231912 -0.59682643 7 0 4.972663 -0.014213 -1.02730244 6 0 6.428582 -0.171751 -1.38129145 1 0 6.442072 -1.179614 -1.79439146 6 0 6.819449 0.77973 -2.52085847 1 0 6.113383 0.67171 -3.350174

S51
48 1 0 6.836352 1.824405 -2.21592449 1 0 7.808603 0.507631 -2.89790550 6 0 7.414303 -0.232491 -0.16208151 6 0 6.78465 -1.022537 1.01439452 6 0 8.670188 -1.022172 -0.63814653 6 0 7.892716 1.142414 0.37208654 1 0 6.440372 -2.001954 0.66041455 1 0 5.902406 -0.489045 1.38874656 6 0 7.796848 -1.202591 2.16509557 1 0 9.153473 -0.498387 -1.47164658 1 0 8.363162 -2.007092 -1.01497459 6 0 9.685784 -1.202698 0.50743560 1 0 7.03757 1.727081 0.71971861 1 0 8.358769 1.718108 -0.43685162 6 0 8.908133 0.959735 1.52117563 1 0 7.315132 -1.758907 2.9794164 6 0 9.024488 -1.98537 1.65773165 6 0 8.246012 0.181112 2.6751166 1 0 10.552283 -1.760838 0.13045967 6 0 10.137507 0.180113 1.01541568 1 0 9.22099 1.949636 1.87748969 1 0 8.720394 -2.981533 1.31025270 1 0 9.741704 -2.136171 2.4750871 1 0 7.38312 0.740184 3.06029172 1 0 8.951435 0.065944 3.50859273 1 0 10.873375 0.065156 1.82208374 1 0 10.631887 0.736038 0.20776575 6 0 -10.874022 0.416719 -0.7580576 6 0 -10.668219 -1.681369 0.46209377 6 0 -11.716042 1.003643 0.40989278 1 0 -11.539348 -0.063916 -1.48395979 1 0 -10.332741 1.210127 -1.26680680 6 0 -11.510125 -1.080409 1.61894481 1 0 -11.331497 -2.170944 -0.26014382 1 0 -9.94126 -2.399365 0.83202383 1 0 -12.444942 1.705911 -0.00313484 1 0 -11.042521 1.56329 1.06992285 1 0 -12.093136 -1.881065 2.08175486 1 0 -10.822205 -0.683735 2.37507187 7 0 -9.964035 -0.600993 -0.23595388 7 0 -12.401132 -0.014599 1.18692689 1 0 -13.188486 -0.393906 0.666747

S52
HOMO JG125d
SOMO [JG125d]+
Figure S66. DFT calculated HOMO and SOMO plots for compound JG125d.
10 20 30 40 50 60 70 80
-0,02
0,00
0,02
0,04
0,06
0,08
0,10
0,12
0,14
ato
mic
cha
rges
Atom labels
Figure S67. Difference between the charges of the atoms in JGC125d and the cationic radical JG125d+. The higher variation is observed for the nitrogen atom labeled as 87.

S53
Table S05. Atomic coordinates of optimized N-oxide JC125[O].
Coordinates (Angstroms)CenterNumber
AtomicNumber
AtomicType X Y Z
1 6 0 -0.762971 2.793887 2.3390572 6 0 0.617508 2.662447 2.128983 6 0 1.125404 1.927084 1.0612834 6 0 0.209597 1.298199 0.1544955 6 0 -1.205507 1.466612 0.3494966 6 0 -1.658238 2.209013 1.4712237 6 0 2.574581 1.772962 0.8523138 6 0 0.687404 0.493348 -0.9298919 6 0 2.133839 0.319914 -1.12860510 6 0 3.041735 0.966001 -0.23213811 6 0 2.660098 -0.454946 -2.16659712 6 0 -0.244463 -0.113198 -1.76599213 6 0 -1.622065 0.065936 -1.58905514 6 0 -2.124898 0.853093 -0.5656615 1 0 -2.306745 -0.400884 -2.28979416 1 0 -1.122025 3.354815 3.19580117 1 0 -2.721463 2.301228 1.65529918 6 0 3.520789 2.387441 1.6779119 6 0 4.893821 2.222182 1.47758320 6 0 5.368905 1.434617 0.43982321 6 0 4.448602 0.801894 -0.42609522 1 0 5.606447 2.707293 2.13487123 6 0 4.036685 -0.613515 -2.34284924 1 0 4.419724 -1.221245 -3.15461925 6 0 4.935674 0.003383 -1.48536926 1 0 2.001607 -0.955465 -2.8650927 1 0 0.079157 -0.733435 -2.59244728 1 0 1.286954 3.138664 2.83442729 1 0 3.204402 3.014058 2.502027

S54
30 6 0 -3.597021 1.026711 -0.46208731 6 0 -4.436173 -0.099302 -0.42901732 6 0 -4.221241 2.284389 -0.45514133 1 0 -4.005655 -1.097557 -0.42282934 6 0 -5.610334 2.372025 -0.41223835 1 0 -3.623373 3.188891 -0.50153936 6 0 -6.317394 1.178172 -0.38410337 1 0 -6.15722 3.303994 -0.41052138 7 0 -5.771452 -0.029656 -0.39242439 6 0 6.385913 -0.18317 -1.69360840 6 0 6.828355 1.268012 0.26015141 8 0 6.810828 -0.875877 -2.6172342 8 0 7.625827 1.818943 1.01620843 7 0 7.26867 0.455356 -0.7957744 6 0 8.735801 0.265098 -1.06257745 1 0 8.718294 -0.216923 -2.03952646 6 0 9.449792 1.611244 -1.24931347 1 0 8.904133 2.218768 -1.9782848 1 0 9.53584 2.179044 -0.32503249 1 0 10.45095 1.439309 -1.65354850 6 0 9.449129 -0.77136 -0.12463551 6 0 8.522024 -1.984107 0.15345352 6 0 10.695581 -1.304029 -0.89216853 6 0 9.935857 -0.206836 1.23513754 1 0 8.16816 -2.404238 -0.79606955 1 0 7.634413 -1.654772 0.70696256 6 0 9.254962 -3.068602 0.97009457 1 0 11.387722 -0.480885 -1.10735558 1 0 10.381302 -1.717476 -1.86008859 6 0 11.433085 -2.388378 -0.08098760 1 0 9.087724 0.175627 1.80775661 1 0 10.608834 0.643176 1.06799762 6 0 10.673345 -1.293302 2.04761563 1 0 8.566225 -3.90359 1.15239764 6 0 10.480765 -3.570642 0.18208865 6 0 9.718565 -2.474053 2.31458366 1 0 12.301742 -2.734077 -0.65605967 6 0 11.900701 -1.793462 1.26153268 1 0 10.99924 -0.861359 3.00273769 1 0 10.161648 -4.017559 -0.76874470 1 0 10.999529 -4.355934 0.74755871 1 0 8.851144 -2.13251 2.894672

S55
72 1 0 10.223406 -3.242826 2.91451473 1 0 12.442648 -2.551273 1.84269974 1 0 12.598956 -0.964772 1.08397975 6 0 -8.354905 0.523519 -1.59414576 6 0 -8.305154 0.477522 0.88628577 6 0 -9.874893 0.507433 -1.55168978 1 0 -7.934025 -0.483027 -1.62429479 1 0 -7.992621 1.111966 -2.4380180 6 0 -9.827157 0.458852 0.90641781 1 0 -7.88301 -0.528458 0.86376682 1 0 -7.911392 1.035508 1.73676883 1 0 -10.261029 -0.050819 -2.40359784 1 0 -10.239202 1.538746 -1.59856385 1 0 -10.166206 -0.123289 1.76028886 1 0 -10.188643 1.487605 1.0052387 7 0 -7.820136 1.234457 -0.34968988 7 0 -10.342677 -0.133107 -0.32631889 6 0 -11.299596 -1.110385 -0.39368390 8 0 -11.754304 -1.538999 -1.45024291 8 0 -11.657231 -1.531055 0.8406692 6 0 -12.664852 -2.592812 1.03096893 6 0 -14.016909 -2.135922 0.47547394 6 0 -12.178989 -3.898523 0.39493195 6 0 -12.723234 -2.722848 2.55473696 1 0 -14.310316 -1.183553 0.92784997 1 0 -13.976552 -2.016708 -0.60710798 1 0 -14.782097 -2.878728 0.72139499 1 0 -11.190617 -4.164814 0.7824100 1 0 -12.871716 -4.707126 0.648048101 1 0 -12.122264 -3.810119 -0.689895102 1 0 -13.44913 -3.491288 2.835115103 1 0 -11.746543 -3.006469 2.957453104 1 0 -13.026902 -1.77692 3.012407105 8 0 -8.276047 2.515794 -0.315634
N NN
O
O
NO
O
JG125[O]
O

S56
HOMOJG125[O]
LUMOJG125[O]
Figure S68. DFT calculated HOMO/LUMO plots for compound JG125[O].