exploring the successive waves of cortical folding in the ... · along the developmental sequence...
TRANSCRIPT

EXPLORING THE SUCCESSIVE WAVES OF CORTICAL FOLDING IN THEDEVELOPING BRAIN USING MRI AND SPECTRAL ANALYSIS OF GYRIFICATION
J. Dubois1, D. Germanaud2, H. Angleys1, F. Leroy1, C. Fischer2, J. Lebenberg1,2,F. Lazeyras3, G. Dehaene-Lambertz1, L. Hertz-Pannier2, J.-F. Mangin2, P. Huppi3 and J. Lefevre4
1 INSERM-CEA, NeuroSpin Center, Cognitive Neuroimaging Unit U992, Gif-sur-Yvette, France2 CEA, NeuroSpin Center, UNIACT (UMR INSERM 1129) and UNATI (CATI), Gif-sur-Yvette, France
3 Geneva University Hospitals, CIBM and Department of Pediatrics, Switzerland4 Aix-Marseille University, CNRS, INT UMR 7289, LSIS, UMR 7296, Marseille, France
ABSTRACT
In the developing human brain, gyrification is a complex processgoing through the successive appearance of primary folds (from 20weeks of gestational age GA), secondary folds (from 32w GA) andtertiary folds (around term age). While this sequence is finely des-cribed in fetuses and preterm newborns of different ages using MRIand folding indices, there is still no fully objective assessment ofthe folding stage at the individual level. We examined the potentialof a new method of spectral analysis of gyrification (SPANGY) thatwas applied to cortical surfaces of 26 preterm newborns, 9 full-termnewborns and 17 infants to quantify the spatial-frequency structureof folding. Based on modelling approaches, we unraveled 4 periodsalong the developmental sequence from 27 to 62w GA, with rele-vant timepoints around 31w, 36-38w, and 44-47w GA. These periodsshowed specific folding features, with spatial patterns of increasingfrequencies.
Index Terms— Developing brain, gyrification, structural MRI,spectral analysis, primary folds
1. INTRODUCTION
In the developing human brain, cortical gyrification is a complexprocess that mostly takes place during the second half of pregnancy.While the physical or mechanical mechanisms that underlie this pro-cess are still debated [1], the folds appearance seems to follow a re-latively stable spatio-temporal sequence with three successive wavesduring development [2] : early primary folds are described from 20weeks of gestational age (w GA), secondary folds from 32w GA,and tertiary folds around term age (40w GA) [3]. Since several ge-netic and environmental factors are likely to influence this process,disturbed gyrification patterns have been observed in many develop-mental diseases [4]. Understanding their complexity requires to mapthe folding process in vivo from the early stages, which has becomepossible in the recent years with non-invasive magnetic resonanceimaging (MRI) combined with post-processing tools to extract cor-tical surfaces [5]. In cross-sectional populations of fetuses and pre-
The research leading to these results has received funding from the Fys-sen Fundation, the ”Fondation de France”, the French National Agency forResearch (ANR-12-JS03-001-01, MODEGY), the Geneva CIBM imagingcenter, the Swiss National Science Foundation (102127; 113632; 33CM30;135817), the Leenards Foundation, the European consortium NEOBRAIN,and the European Union Seventh Framework Programme (FP7/2007-2013)under grant agreement no. 604102 (Human Brain Project).
term newborns, folding features have been measured, showing dra-matic increase with age [6, 7]. Nevertheless there is still no quan-titative way to disentangle between primary, secondary and tertiaryfolds in a single newborn brain. In this perspective, we examined thepotential of an original method of spectral analysis of gyrification(SPANGY) [8] to describe and quantify the spatial-frequency struc-ture of cortical folding throughout development, from the pretermperiod to early infancy.
2. MATERIAL AND METHODS
2.1. Methodological background
SPANGY relies on the spectral decomposition of the mean cur-vature of the inner cortical surface (i.e. mesh of the grey/white mat-ter interface), based on the Laplace–Beltrami operator eigenfunc-tions (i.e. a generalization of Fourier analysis to any kind of do-main/surface). In this approach, the complexity of the power spec-trum is reduced by merging levels of successive orders, assuming afolding model of branching with doublings of spatial frequency [8].In the adult brain, 7 bands of increasing frequencies (B0–B6) havebeen shown relevant and sufficient to characterize the curvature pat-terns in regards to the mesh spatial resolution and the expected sizeof folding patterns. This approach has further provided an anatomi-cally relevant segmentation of the cortical folds based on the localspectral composition : while the low frequency bands (B0-B3) havebeen related to the global brain shape, the last 3 bands (B4-B6) havebeen shown to account for the folds shaping. Furthermore, when thesulci were segmented according to their frequency compound, ele-ments associated with B4, B5 and B6 seemed to match essentiallywith primary, secondary and tertiary folds respectively. Neverthe-less, this anatomical analogy observed in the adult brain remains tobe tested throughout the developmental process of folding. We thusapplied SPANGY over a developmental range crucial for sulci appea-rance, covering not only the third trimester of pregnancy, but also thefirst post-natal months.
2.2. Subjects
We studied 3 cohorts of babies (all from single pregnancies).First, 26 preterm newborns (11 girls) without neurological compli-cations were imaged within the first two weeks after birth, at GA bet-ween 27w and 36w. Second, 9 full-term healthy newborns (4 girls)were imaged within the first two days after birth, at GA between

Fig. 1. Cortical surfaces (a) and SPANGY segmentations (b) for 2 preterms, 1 full-term newborn and 2 infants, with regularly sampled agesfrom 27w to 60wGA.
38w and 40w. Third, 17 full-term healthy infants (7 girls) were ima-ged within the first post-natal weeks, at ages (including GA at birth)between 44w and 62w.
2.3. MRI acquisition
High-resolution T2-weighted (T2w) MR images were acquiredat 1.5T for preterm newborns, and at 3T for full-term newborns andinfants. Details on preterm and infant data may be found in [9, 10]respectively. For full-term newborns, coronal slices were imagedwith a spatial resolution of 0.8x0.8x1.2mm (TE/TR=150/4600ms).
2.4. Brain segmentation and morphometric analysis
The interface between cortex and white matter was segmentedusing dedicated semi-automatic procedures for preterm newborns[6] and infants [11], with interactive manual corrections performedin the places of low grey/white matter contrast. 3D meshes of theleft and right inner cortical surfaces were then provided. Meshes ofouter cortical surfaces were also computed from the segmentation ofcortex and cerebro-spinal fluid [12]. Among morphological parame-ters, we measured the area of the inner cortical surface, a sulcationindex (defined as the ratio between this area and the surface area af-ter morphological closing), and a proxi of brain size (the hemisphericvolume defined as the volume inside the closed outer cortical surface[8, 12]). Left and right measures were averaged in all analyses.
2.5. Spectral analysis of cortical curvature
For each newborn and infant, the mean curvature of the innercortical surface was computed as implemented in BrainVISA [12].SPANGY was performed in the same way as in the adult brain, usingthe previously described Fourier-like analysis [8]. In the spectral do-main, total and band B4-B6 spectral powers were computed. In thespatial domain (i.e. on the meshes), we considered a segmentation ofcortical sulci (showing negative curvature) according to the locallydeterminant frequency band [8] : cumulative synthesis was used tolabel each vertex with the number of the band that determined whe-ther it belonged to the sulcal or the gyral pattern. We then computedthe number of parcels of B4 to B6-associated sulci elements.
2.6. Identification of successive waves of folding
In addition to age-related changes in whole-brain morphometricparameters, the dependance of cortical surface area on brain size wasmodelled with a power law. The scaling exponent of the model wascompared to the theoretical one under the hypothesis of strictly pro-portional geometric dependence between surface and volume, to de-monstrate non proportional scaling called allometry [7]. Variationsin SPANGY parameters with age were further studied in order toidentify developmental periods showing specific features of foldingor discontinuities. Three complementary approaches were conside-red.
First, we aimed to evaluate whether spectral bands B4 to B6captured different temporal mechanisms. For each band, age-relatedchanges in spectral power were modelled with a Gompertz function :
K exp(−b exp(−at))
Gompertz models were preferred to logistic functions because age-related evolutions were hardly symmetric. Two timepoints of interestwere then computed per curve : the inflexion point (correspondingto the vanishing point of the second derivative : log(b)/a), and theasymptotic deceleration point (corresponding to the last maximumof the third derivative [13]).
Second, we focused on the proportions between B4-B6 spectralbands through relative spectral powers, defined as the ratios betweenband powers and total power. For each band, relative power was mo-delled as the ratio between 2 Gompertz functions for band power andtotal power. Again, we identified specific timepoints of interest whenrelevant based on the curves observation.
Third, we aimed to identify distinct developmental periods byintegrating the complementary information provided by the threespectral bands. To do so, babies were clustered with a kmeans al-gorithm applied to B4-B6 relative powers, and we a priori hypo-thesized 4 groups that should correspond to different ages. Indeed,according to previous observations of 3 successive waves of folding[3], the preterm period should be splitted in 2 sub-periods (beforeand after 32w GA, when secondary folds start to appear). At termage, when tertiary folds start to appear, another distinct period shouldbe detected. However little is known on the age when folding stops
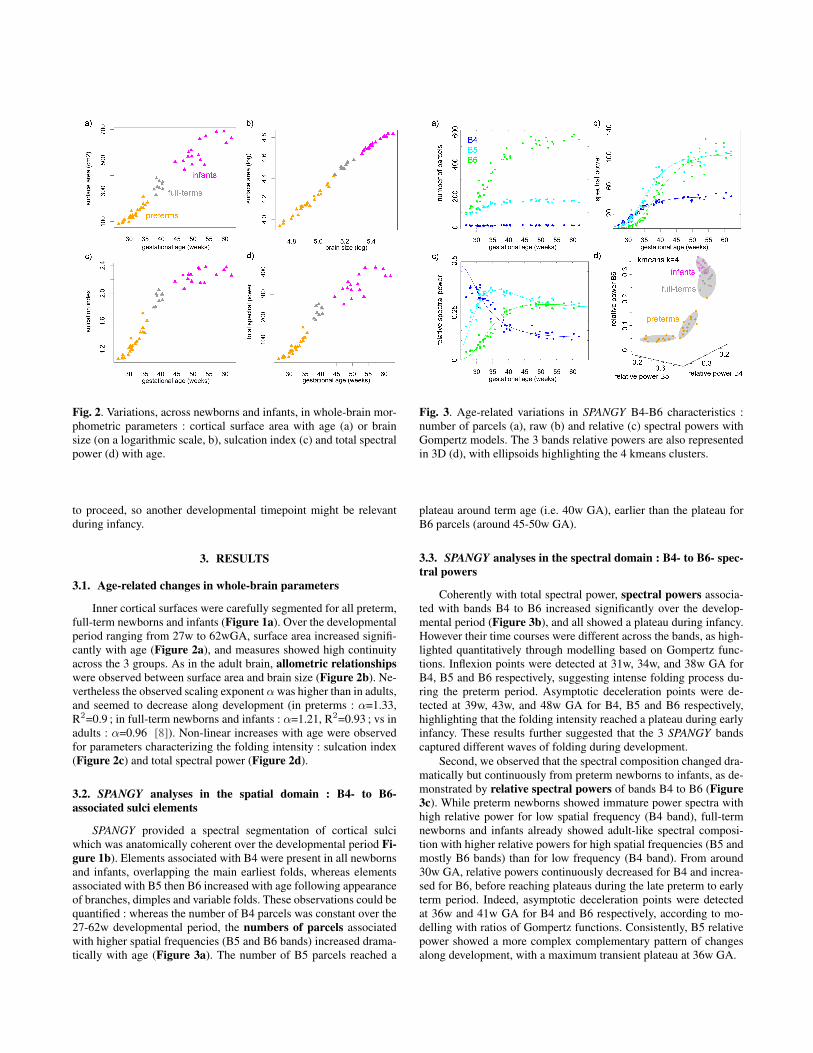
Fig. 2. Variations, across newborns and infants, in whole-brain mor-phometric parameters : cortical surface area with age (a) or brainsize (on a logarithmic scale, b), sulcation index (c) and total spectralpower (d) with age.
to proceed, so another developmental timepoint might be relevantduring infancy.
3. RESULTS
3.1. Age-related changes in whole-brain parameters
Inner cortical surfaces were carefully segmented for all preterm,full-term newborns and infants (Figure 1a). Over the developmentalperiod ranging from 27w to 62wGA, surface area increased signifi-cantly with age (Figure 2a), and measures showed high continuityacross the 3 groups. As in the adult brain, allometric relationshipswere observed between surface area and brain size (Figure 2b). Ne-vertheless the observed scaling exponent αwas higher than in adults,and seemed to decrease along development (in preterms : α=1.33,R2=0.9 ; in full-term newborns and infants : α=1.21, R2=0.93 ; vs inadults : α=0.96 [8]). Non-linear increases with age were observedfor parameters characterizing the folding intensity : sulcation index(Figure 2c) and total spectral power (Figure 2d).
3.2. SPANGY analyses in the spatial domain : B4- to B6-associated sulci elements
SPANGY provided a spectral segmentation of cortical sulciwhich was anatomically coherent over the developmental period Fi-gure 1b). Elements associated with B4 were present in all newbornsand infants, overlapping the main earliest folds, whereas elementsassociated with B5 then B6 increased with age following appearanceof branches, dimples and variable folds. These observations could bequantified : whereas the number of B4 parcels was constant over the27-62w developmental period, the numbers of parcels associatedwith higher spatial frequencies (B5 and B6 bands) increased drama-tically with age (Figure 3a). The number of B5 parcels reached a
Fig. 3. Age-related variations in SPANGY B4-B6 characteristics :number of parcels (a), raw (b) and relative (c) spectral powers withGompertz models. The 3 bands relative powers are also representedin 3D (d), with ellipsoids highlighting the 4 kmeans clusters.
plateau around term age (i.e. 40w GA), earlier than the plateau forB6 parcels (around 45-50w GA).
3.3. SPANGY analyses in the spectral domain : B4- to B6- spec-tral powers
Coherently with total spectral power, spectral powers associa-ted with bands B4 to B6 increased significantly over the develop-mental period (Figure 3b), and all showed a plateau during infancy.However their time courses were different across the bands, as high-lighted quantitatively through modelling based on Gompertz func-tions. Inflexion points were detected at 31w, 34w, and 38w GA forB4, B5 and B6 respectively, suggesting intense folding process du-ring the preterm period. Asymptotic deceleration points were de-tected at 39w, 43w, and 48w GA for B4, B5 and B6 respectively,highlighting that the folding intensity reached a plateau during earlyinfancy. These results further suggested that the 3 SPANGY bandscaptured different waves of folding during development.
Second, we observed that the spectral composition changed dra-matically but continuously from preterm newborns to infants, as de-monstrated by relative spectral powers of bands B4 to B6 (Figure3c). While preterm newborns showed immature power spectra withhigh relative power for low spatial frequency (B4 band), full-termnewborns and infants already showed adult-like spectral composi-tion with higher relative powers for high spatial frequencies (B5 andmostly B6 bands) than for low frequency (B4 band). From around30w GA, relative powers continuously decreased for B4 and increa-sed for B6, before reaching plateaus during the late preterm to earlyterm period. Indeed, asymptotic deceleration points were detectedat 36w and 41w GA for B4 and B6 respectively, according to mo-delling with ratios of Gompertz functions. Consistently, B5 relativepower showed a more complex complementary pattern of changesalong development, with a maximum transient plateau at 36w GA.

To summarize, complex relationships between spectral bandsand age were observed, and different timepoints appeared relevantregarding the folding process : around 30w GA (28w-31w GA),around 35w GA (34w-36w GA), around term age (38w-41w GA),and during early infancy (around 48w GA). This is in relative agree-ment with the previous description of three successive waves of fol-ding along development, with secondary folds appearing from 32wGA, and tertiary folds around 40w GA [3].
To further define developmental periods with distinct foldingfeatures, we finally clustered the newborns and infants in 4 dif-ferent groups using kmeans algorithm applied to the relative powersof the 3 bands (Figure 3d). This clustering enabled to finely sepa-rate the babies in terms of age, with few overlaps across clusters.The first and second clusters gathered almost all preterm newbornsover 2 periods : from 27w to 31w GA, and from 31w to 36w GArespectively. Except one single preterm at 34w GA with possiblyartefactual data, the third and fourth clusters gathered all full-termnewborns and infants ; the period from 38w GA was divided in twosub-periods : one below 47w GA, and one above 44w GA (3 over-lapping infants). Considering 3 clusters instead of 4 in the kmeansprocedure only joined the two latter clusters, with no change in thetwo former clusters.
4. DISCUSSION AND CONCLUSION
In this original study, we analyzed the cortical folding in pre-terms, full-term newborns and infants with SPANGY, over a deve-lopmental period when the progression is intense (from 27w to 62wGA). In comparison with previous studies of folding, SPANGY pro-vided a quantitative characterization of the complex spatial patternsof sulci without a priori hypotheses on localization.
Our results supported the relevance of a frequency-based des-cription of the folding sequence along development. It further streng-thened the link proposed in the adult brain [8], between the 3 typesof spectrally-defined sulci elements provided by SPANGY (associa-ted with bands B4 to B6), and the three types of developmentally-defined folding waves (from primary to tertiary folding), even if thisanatomical correspondence cannot be perfect probably due to theprocess of Fourier-like analysis on complex patterns.
We highlighted that the preterm period is divided in two sub-periods, with a relevant timepoint around 31w GA that correspondsto the appearance of a significant amount of secondary folds. Thesefolds seemed to be finely mapped by the B5 band showing a relativepeak around 36w GA. After 38w GA, two additional sub-periodswere outlined, that match the appearance of tertiary folds from termage, and the end of the folding process a few weeks after duringinfancy.
Despite different MRI acquisitions and segmentation post-processings, high continuity in morphometric and SPANGY parame-ters was observed across the 3 groups of babies. Notably, the kmeansclustering used to define developmental periods was not driven bythe group belonging in a simple way. Nevertheless, some variabilitywas observed across infants, which might rely on inter-individualdifferences in brain size, for instance in relation to gender.
If these preliminary results were confirmed through longitudi-nal data of preterms for instance, SPANGY would provide the firstquantitative and objective measure of the folding stage at the indivi-dual level, in terms of appearance of primary, secondary and tertiaryfolds.
5. REFERENCES
[1] W. Welker, “Why does cerebral cortex fissure and fold ? a re-view of determinants of gyri and sulci,” In : Comparative struc-ture and evolution of cerebral cortex. Jones E, Peters A eds.Plenum, New York., vol. Part II, no. vol 8B, pp. 3–136, 1990.
[2] A. Feess-Higgins and J. Laroche Development of the humanfoetal brain : an anatomical atlas. Inserm-CNRS, Masson,1987.
[3] J. Chi, E. Dooling, and F. Gilles, “Gyral development of thehuman brain,” Annals of Neurology, vol. 1, no. 1, pp. 86–93,1977.
[4] J.-F. Mangin, E. Jouvent, and A. Cachia, “In-vivo measurementof cortical morphology : means and meanings,” Curr OpinNeurol, vol. 23, no. 4, pp. 359–367, 2010.
[5] J. Dubois and G. Dehaene-Lambertz, “Fetal and postnatal de-velopment of the cortex : Mri and genetics.,” In : Arthur W.Toga, editor. Brain Mapping : An Encyclopedic Reference.Academic Press : Elsevier, vol. 2, no. 6, pp. 11–19, 2015.
[6] J. Dubois, M. Benders, A. Cachia, F. Lazeyras, R. Ha-Vinh Leuchter, S. Sizonenko, C. Borradori-Tolsa, J.-F. Mangin,and P. S. Huppi, “Mapping the early cortical folding process inthe preterm newborn brain,” Cerebral Cortex, vol. 18, no. 6,pp. 1444–1454, 2008.
[7] J. Lefevre, D. Germanaud, J. Dubois, F. Rousseau, I. de Ma-cedo Santos, H. Angleys, J.-F. Mangin, P. S. Huppi, N. Girard,and F. De Guio, “Are developmental trajectories of cortical fol-ding comparable between cross-sectional datasets of fetusesand preterm newborns ?,” Cerebral Cortex, vol. in press, p. pii :bhv123, 2015.
[8] D. Germanaud, J. Lefevre, R. Toro, C. Fischer, J. Dubois,L. Hertz-Pannier, and M. Jean-Francois, “Larger is twistier :spectral analysis of gyrification (spangy) applied to adult brainsize polymorphism,” Neuroimage, vol. 63, no. 3, pp. 1257–1272, 2012.
[9] J. Dubois, M. Benders, F. Lazeyras, C. Borradori-Tolsa,R. Leuchter, J.-F. Mangin, and P. S. Huppi, “Structural asym-metries of perisylvian regions in the preterm newborn,” Neu-roImage, vol. 52, no. 1, pp. 32–42, 2010.
[10] C. Kabdebon, F. Leroy, H. Simmonet, M. Perrot, J. Dubois, andG. Dehaene-Lambertz, “Anatomical correlations of the interna-tional 10-20 sensor placement system in infants,” Neuroimage,vol. 99, pp. 342–356, 2014.
[11] F. Leroy, J.-F. Mangin, F. Rousseau, H. Glasel, L. Hertz-Pannier, J. Dubois, and G. Dehaene-Lambertz, “Atlas-free sur-face reconstruction of the cortical grey-white interface in in-fants,” PLoS ONE, vol. 6, no. 11, p. e27128, 2011.
[12] C. Fischer, G. Operto, S. Laguitton, M. Perrot, I. Denghien,D. Riviere, and J.-F. Mangin, “Morphologist 2012 : the newmorphological pipeline of brainvisa,” NeuroImage, vol. Pro-ceedings of HBM Scientific Meeting, no. Beijing, China,p. 670, 2012.
[13] M. Mischan, S. Zambello de Pinho, and L. de Carvalho, “De-termination of a point sufficiently close to the asymptote innonlinear growth functions,” Scientia Agricola, vol. 68, no. 1,pp. 109–114, 2011.