exploring the sensing capability of wireless signals
TRANSCRIPT

Exploring the Sensing Capability of Wireless Signals
Changlai Du
Dissertation submitted to the Faculty of theVirginia Polytechnic Institute and State University
in partial fulfillment of the requirements for the degree of
Doctor of Philosophyin
Computer Science and Application
Wenjing Lou, ChairIng-Ray Chen
Y. Thomas HouAnil VullikantiYingying Chen
May 1, 2018Falls Church, Virginia
Keywords: wireless security, wireless localization, motion sensingCopyright 2018, Changlai Du

Exploring the Sensing Capability of Wireless Signals
Changlai Du
ABSTRACT
Wireless communications are ubiquitous nowadays, especially in the new era of Internet ofThings (IoT). Most of IoT devices access the Internet via some kind of wireless connections.The major role of wireless signals is a type of communication medium. Besides that, takingadvantage of the growing physical layer capabilities of wireless techniques, recent researchhas demonstrated the possibility of reusing wireless signals for both communication andsensing. The capability of wireless sensing and the ubiquitous availability of wireless signalsmake it possible to meet the rising demand of pervasive environment perception. Physicallayer features including signal attributes and channel state information (CSI) can be usedfor the purpose of physical world sensing. This dissertation focuses on exploring the sensingcapability of wireless signals. The research approach is to first take measurements fromphysical layer of wireless connections, and then develop various techniques to extract orinfer information about the environment from the measurements, like the locations of signalsources, the motion of human body, etc.
The research work in this dissertation makes three contributions. We start from wirelesssignal attributes analysis. Specifically, the cyclostationarity properties of wireless signalsare studied. Taking WiFi signals as an example, we propose signal cyclostationarity modelsinduced by WiFi Orthogonal Frequency Division Multiplexing (OFDM) structure includingpilots, cyclic prefix, and preambles. The induced cyclic frequencies is then applied to thesignal-selective direction estimation problem.
Second, based on the analysis of wireless signal attributes, we design and implement aprototype of a single device system, named MobTrack, which can locate indoor interferingradios. The goal of designing MobTrack is to provide a lightweight, handhold system that canlocate interfering radios with sub-meter accuracy with as few antennas as possible. With asmall antenna array, the cost, complexity as well as size of this device are reduced. MobTrackis the first single device indoor interference localization system without the requirement ofmultiple pre-deployed access points (AP).
Third, channel state information is studied in applications of human motion sensing. Wedesign WiTalk, the first system which is able to do fine-grained motion sensing like leapreading on smartphones using the CSI dynamics generated by human movements. WiTalkproposes a new fine-grained human motion sensing technique with the distinct context-free feature. To achieve this goal using CSI, WiTalk generates CSI spectrograms usingsignal processing techniques and extracts features by calculating the contours of the CSIspectrograms. The proposed technique is verified in the application scenario of lip reading,where the fine-grained motion is the mouth movements.

Exploring the Sensing Capability of Wireless Signals
Changlai Du
GENERAL AUDIENCE ABSTRACT
Wireless communications are ubiquitous nowadays, especially in the new era of Internet ofThings (IoT). Most of IoT devices access the Internet via some kind of wireless connections.The major role of wireless signals is a type of communication medium. Besides that, takingadvantage of the growing physical layer capabilities of wireless techniques, recent researchhas demonstrated the possibility of reusing wireless signals for both communication andsensing. The capability of wireless sensing and the ubiquitous availability of wireless signalsmake it possible to meet the rising demand of pervasive environment perception. Physicallayer features including signal attributes and channel state information (CSI) can be usedfor the purpose of physical world sensing. This dissertation focuses on exploring the sensingcapability of wireless signals. The research approach is to first take measurements fromphysical layer of wireless connections, and then develop various techniques to extract orinfer information about the environment from the measurements, like the locations of signalsources, the motion of human body, etc. Based on the analysis to cyclostationary propertiesof wireless signals, we propose a new method for indoor interference source localization. Wealso design a fine-grained human motion detection system using channel state information,which can be applied to application scenarios like lip reading.
Dedicated to my wife Wenbo and my daughter Tang.
iv
Acknowledgments
It takes me six years to finish this dissertation. It would never have been possible for me toachieve it without the support and encouragement from my teachers, colleagues, family andfriends. I know it is not only an individual but also a collaborative work. Therefore, I wouldlike to acknowledge the help of many people during the past six years.
First and foremost, I would like to express my sincere gratitude to my advisor Dr. WenjingLou, for her continuous and intellectual guidance, support and patience. She guides me inmy research with her insightful understanding of the research field, while encourages me topursue my own research interests. I can’t thank her more for her help with developing myresearch skills, for her discussion about my ideas and for the inspiration during my researchprocess. I could not have imagined having a better advisor and mentor for my Ph.D. study.
I am also thankful to Dr. Y. Thomas Hou, Dr. Ing-Ray Chen, Dr. Yingying Chen and Dr.Anil Vullikanti for serving on my dissertation committee. Their insightful comments andsuggestions have helped me to make this work better.
Of course, I would also like to thank my co-authors: Dr. Huacheng Zeng, Ruide Zhang,Dr. Ning Zhang, Dr. Yuichi Kawamoto and Dr. Xiaoqun Yuan. Thank you for your activeparticipation and excellent collaboration in our research.
I wish to thank my labmates in the Complex Networks and Security Research (CNSR) lab:Dr. Qiben Yan, Dr. Yao Zheng, Dr. Bing Wang, Ethan Gabriel, Dr. Wenhai Sun, YangXiao, Tingting Jiang, Dr. Liguang Xie, Dr. Xu Yuan, Dr. Xiaoqi Qin, Dr. Tao Jiang, Dr.Wei Song, Dr. Jin Li, Dr. Xiaofeng Chen, Yaxing Chen, Dr. Feng Li, Dr. Guorui Li, Dr.Wenbo Shi, Dr. Li Yang, Dr. Liang Liu. Thank you for your insightful discussions in myresearch and help in my life.
Last but not least, my deepest thanks go to my family for their continuous love, supportand trust during the journey of my life. Most importantly, I’m indebted to my wife Wenboand my daughter Tang, the two most beautiful girls in the world. You are always my sourceof inspiration and motivation.
v

Funding Acknowledgments
Research work presented in this dissertation is supported in part by National Science Foun-dation (NSF) under grants CNS-1156318, CNS-1446478, CNS-1405747, CNS-1443889, andCNS-1343222.
vi
Contents
1 Introduction 1
1.1 Sensing Using Wireless Signals . . . . . . . . . . . . . . . . . . . . . . . . . . 1
1.1.1 Indoor Localization . . . . . . . . . . . . . . . . . . . . . . . . . . . . 3
1.1.2 Human Motion Sensing . . . . . . . . . . . . . . . . . . . . . . . . . . 4
1.2 Research Contributions . . . . . . . . . . . . . . . . . . . . . . . . . . . . . . 5
1.3 Organization . . . . . . . . . . . . . . . . . . . . . . . . . . . . . . . . . . . 7
2 Sensing Using Wireless Signals: Fundamentals and Applications 9
2.1 Wireless Signals and Communications . . . . . . . . . . . . . . . . . . . . . . 9
2.2 Measurement of RF Signals Attributes . . . . . . . . . . . . . . . . . . . . . 12
2.3 Superposition of RF Signals . . . . . . . . . . . . . . . . . . . . . . . . . . . 15
2.3.1 Interference . . . . . . . . . . . . . . . . . . . . . . . . . . . . . . . . 16
2.3.2 Multipath . . . . . . . . . . . . . . . . . . . . . . . . . . . . . . . . . 17
2.4 Physical Layer Security . . . . . . . . . . . . . . . . . . . . . . . . . . . . . . 18
3 Cyclostationary Analysis of WiFi Signals for Direction Estimation 21
3.1 Motivation and Objects . . . . . . . . . . . . . . . . . . . . . . . . . . . . . 21
3.2 Related Work . . . . . . . . . . . . . . . . . . . . . . . . . . . . . . . . . . . 22
3.3 Cyclostationarity Preliminary . . . . . . . . . . . . . . . . . . . . . . . . . . 23
3.3.1 Cyclostationary Properties . . . . . . . . . . . . . . . . . . . . . . . . 23
3.3.2 Signal Direction Estimation . . . . . . . . . . . . . . . . . . . . . . . 25
3.4 WiFi Cyclostationary Analysis . . . . . . . . . . . . . . . . . . . . . . . . . . 30
vii

3.4.1 OFDM Frame Structure . . . . . . . . . . . . . . . . . . . . . . . . . 30
3.4.2 Pilot-Induced Cyclostationarity . . . . . . . . . . . . . . . . . . . . . 31
3.4.3 CP-Induced Cyclostationarity . . . . . . . . . . . . . . . . . . . . . . 33
3.4.4 Preamble-Induced Cyclostationarity . . . . . . . . . . . . . . . . . . . 34
3.5 Performance Evaluation . . . . . . . . . . . . . . . . . . . . . . . . . . . . . 35
3.6 Summary of Contributions . . . . . . . . . . . . . . . . . . . . . . . . . . . . 37
4 MobTrack: Locating Indoor Interfering Radios With A Single Device 38
4.1 Motivation and Objects . . . . . . . . . . . . . . . . . . . . . . . . . . . . . 38
4.2 Related Work . . . . . . . . . . . . . . . . . . . . . . . . . . . . . . . . . . . 41
4.3 System Design . . . . . . . . . . . . . . . . . . . . . . . . . . . . . . . . . . . 43
4.3.1 Interference Identification . . . . . . . . . . . . . . . . . . . . . . . . 45
4.3.2 AoA Spectrum Computation . . . . . . . . . . . . . . . . . . . . . . . 47
4.3.3 Multipath Suppression . . . . . . . . . . . . . . . . . . . . . . . . . . 49
4.3.4 Triangulation . . . . . . . . . . . . . . . . . . . . . . . . . . . . . . . 50
4.4 Implementation . . . . . . . . . . . . . . . . . . . . . . . . . . . . . . . . . . 51
4.4.1 Time and Frequency Synchronization . . . . . . . . . . . . . . . . . . 53
4.4.2 Phase Synchronization . . . . . . . . . . . . . . . . . . . . . . . . . . 53
4.5 Performance Evaluation . . . . . . . . . . . . . . . . . . . . . . . . . . . . . 55
4.5.1 Test Bed Setup . . . . . . . . . . . . . . . . . . . . . . . . . . . . . . 55
4.5.2 LoS Signal Stability . . . . . . . . . . . . . . . . . . . . . . . . . . . . 55
4.5.3 Localization Accuracy with Different Calculation Points . . . . . . . 56
4.5.4 Localization Accuracy with Different Moving Distances . . . . . . . . 57
4.6 Summary of Contributions . . . . . . . . . . . . . . . . . . . . . . . . . . . . 58
5 Context-Free Fine-Grained Motion Sensing using WiFi 60
5.1 Motivation and Objects . . . . . . . . . . . . . . . . . . . . . . . . . . . . . 60
5.2 Related work . . . . . . . . . . . . . . . . . . . . . . . . . . . . . . . . . . . 64
5.3 CSI Preliminary and CSI-Speed Model . . . . . . . . . . . . . . . . . . . . . 65
viii

5.4 System Design . . . . . . . . . . . . . . . . . . . . . . . . . . . . . . . . . . . 67
5.4.1 Feasibility Analysis and Verification . . . . . . . . . . . . . . . . . . . 67
5.4.2 CSI Data Collection and Preprocessing . . . . . . . . . . . . . . . . . 69
5.4.3 Interference Elimination . . . . . . . . . . . . . . . . . . . . . . . . . 70
5.4.4 Segmentation . . . . . . . . . . . . . . . . . . . . . . . . . . . . . . . 73
5.4.5 Feature Extraction . . . . . . . . . . . . . . . . . . . . . . . . . . . . 73
5.4.6 Classification . . . . . . . . . . . . . . . . . . . . . . . . . . . . . . . 76
5.4.7 Error Correction . . . . . . . . . . . . . . . . . . . . . . . . . . . . . 76
5.5 Performance Evaluation . . . . . . . . . . . . . . . . . . . . . . . . . . . . . 76
5.5.1 System Setup . . . . . . . . . . . . . . . . . . . . . . . . . . . . . . . 76
5.5.2 Syllables Classification Accuracy . . . . . . . . . . . . . . . . . . . . 77
5.5.3 Sentence Recognition Accuracy . . . . . . . . . . . . . . . . . . . . . 78
5.5.4 Performance with Distance . . . . . . . . . . . . . . . . . . . . . . . . 80
5.6 Summary of Contributions . . . . . . . . . . . . . . . . . . . . . . . . . . . . 80
6 Conclusion 82
6.1 Research Summary . . . . . . . . . . . . . . . . . . . . . . . . . . . . . . . . 82
6.2 Future Work . . . . . . . . . . . . . . . . . . . . . . . . . . . . . . . . . . . . 83
Bibliography 85
ix

List of Figures
1.1 Cisco estimates that there will be over 50 billion connected devices by 2020.An important inflection point occurred in 2008, when the number of thingsconnected to the Internet surpassed the human population, which is believedthe “birth” of IoT. . . . . . . . . . . . . . . . . . . . . . . . . . . . . . . . . 2
1.2 The DIKW model. Sensing is the process of collecting data from physicalworld to cyber space. Data need to be analyzed to extract some useful infor-mation. Combining multiple pieces of information, we may get some knowl-edge. From knowledge, it’s possible to learn some wisdom. Wireless sensingshould cover all the four processing steps. . . . . . . . . . . . . . . . . . . . . 6
2.1 Bomb-testing problem diagram. This diagram includes a photon emitter, thebomb to be tested, two photon detectors. Mirrors in the lower left and upperright corners are semi-transparent. . . . . . . . . . . . . . . . . . . . . . . . 11
2.2 The basic elements of RF signals: the amplitude, phase and frequency. . . . 12
2.3 RSSI variations due to path loss, shadow fading and multipath fading [129]. 13
2.4 The FMCW system estimates the ToF by measuring the frequency difference. 14
2.5 A liner chirp and its corresponding spectrogram. . . . . . . . . . . . . . . . 16
2.6 Multipath components of the signal include the line of sight component, staticreflected components, and dynamic reflected components. . . . . . . . . . . 17
2.7 Multipath components. Multipath superposition may be constructive or de-structive. . . . . . . . . . . . . . . . . . . . . . . . . . . . . . . . . . . . . . . 18
2.8 Taxonomy of physical layer security enhancement techniques. . . . . . . . . . 19
3.1 A signal can be modeled as cyclostationary if its cyclic autocorrelation func-tion (CAF) is nonzero for a nonzero cyclic frequency. . . . . . . . . . . . . . 24
x

3.2 Phase Array Data Model. Multipath components from multiple sources im-pinge on the antenna array. Antenna array is a Uniform Liner Array withinterval distance d = λ/2. Propagation phase delay between array elementscan be used to infer the incoming angle θ. . . . . . . . . . . . . . . . . . . . 26
3.3 Illustration of the concept of array manifold and signal subspace. This three-sensor two-source example illustrate the geometry of MUSIC [95]. . . . . . . 28
3.4 FAM Block Diagram. There are two FFT stages. Frequency resolution is∆f = 1/T ; Cyclic frequency resolution is ∆α = 1/∆t. . . . . . . . . . . . . . 29
3.5 IEEE 802.11 a/g OFDM frame structure [50]. The OFDM structure containsfeatures that generate cyclostationary properties: pilots, CP, and preambles. 30
3.6 OFDM Subcarriers. Ten data subcarriers and two pilot subcarriers are in-cluded. Three guard subcarriers and a DC Null are also depicted. All thesubcarriers are indexed. . . . . . . . . . . . . . . . . . . . . . . . . . . . . . 31
3.7 WiFi SCD Surface by simulation. SCD surface is bi-frequency, with one di-mension the frequency and the other the cyclic frequency. The peaks areinduced by pilots on the OFDM subcarriers. Sampling frequency is 20MHzwith 64 points FFT. The pilots index are {−21,−7, 7, 21} and pilot gain isset to 3db. . . . . . . . . . . . . . . . . . . . . . . . . . . . . . . . . . . . . . 32
3.8 Cyclic frequencies when f = 0. The cyclic frequencies are α = ±4.375 MHz,±13.125 MHz. . . . . . . . . . . . . . . . . . . . . . . . . . . . . . . . . . . . 33
3.9 CP-induced Cyclostationarity. SCD surface peaks at the cyclic frequencies±5l
4MHz, with l ∈ {1..13}. . . . . . . . . . . . . . . . . . . . . . . . . . . . . 35
3.10 Cyclic MUSIC and Spatial Smoothing MUSIC. Cyclic MUSIC decreases theratio of the largest undesired singular value and the smallest desired singularvalue. . . . . . . . . . . . . . . . . . . . . . . . . . . . . . . . . . . . . . . . 36
3.11 Ratios of singular values. The ratio values calculated by pilot-induced cyclicfrequencies are smaller than those by CP-induced cyclic frequencies. . . . . 37
4.1 System Model. WiFi communication between AP and client are workingsignals. The interfering radio source is a cordless phone which is the targetwe are trying to locate. MobTrack locates the interfering radio by computethe LoS AoA of the cordless phone at multiple positions on its moving trace. 40
4.2 The research roadmap. We select AoA based method with the help of promis-ing software defined radio (SDR) technique. . . . . . . . . . . . . . . . . . . 43
xi

4.3 MobTrack Architecture. Raw samples are phase aligned and then input intothe interference detection process, where cyclic frequencies α are extracted.Spacial smoothed cyclic-music algorithm is applied to estimate the AoAs ofthe multipath components of only the interfering radio. Multipath suppressionalgorithm is then applied to isolate the LoS component and identify its AoA.LoS AoAs at different points are used to locate the source by triangulation. . 44
4.4 Subarray Spacial Smoothing Totally M antennas in P groups with Q antennasin each group. M = P +Q− 1. . . . . . . . . . . . . . . . . . . . . . . . . . 47
4.5 The eigenvalues before and after Spacial Smoothing. Spacial smoothing suc-cessfully increases the detectable eigenvalues from six to eight. . . . . . . . . 49
4.6 Multipath Suppression. We record the peaks and plot it as a dot in this figure.With the movement of MobTrack device, the LoS AoA changes continuously,but NLoS components will disappear intermittently. By finding the longestline, we can isolate the LoS component. . . . . . . . . . . . . . . . . . . . . . 50
4.7 MobTrack Triangulation. We apply the well-known least square algorithm inlinear algebra to calculate a single estimation point. When employing the leastsquare method, the known variables are the 2D locations of the MobTrack andthe θs in the figure while the unknown variables are the 2D location of theestimation point. . . . . . . . . . . . . . . . . . . . . . . . . . . . . . . . . . 52
4.8 Prototype implementation. The MobTrack prototype is composed of sixUSRP radios mounted on a movable case, which form an antenna array. An-other USRP works as the phase alignment reference, and one more works asthe interferer(not shown in picture). . . . . . . . . . . . . . . . . . . . . . . . 52
4.9 MobTrack prototype connections.Every two of the six USRPs are connectedusing a MIMO cable. The master USRP in each group are connected tothe host computer via a Gigabyte Ethernet switch. All master USRPs areconnected to an external clock for time and frequency synchronization. Aphase reference tone is provided by another USRP. . . . . . . . . . . . . . . 53
4.10 The GRC flowgraph for phase tone USRP. We use 10kHz sine wave as thephase tone signal. . . . . . . . . . . . . . . . . . . . . . . . . . . . . . . . . . 54
4.11 The GRC flowgraph for the antenna array. This is figure is not a completeversion for the purpose of simplicity. We only show the filter channels of oneUSRP. The other USRPs use the filters with the same parameters. . . . . . . 54
4.12 Test bed. This figure is a part of the floor our lab sits on. The dotted line inthis figure is the trace of executed experiments. The blue point in the lab isthe interfering radio we would like to locate. Following the trace, we conducta test per 25 centimeters. . . . . . . . . . . . . . . . . . . . . . . . . . . . . . 56
xii

4.13 The stability of LoS and NLoS components. The distance between the trans-mitter and MobTrack is 172cm. The distance between each location is 2.5cm. 57
4.14 Localization Accuracy with Different Calculation Points. The median error is0.55m estimating from 5 locations. . . . . . . . . . . . . . . . . . . . . . . . 58
4.15 Localization Accuracy with Different Moving Distances. The longer distancebetween the calculation points, the more accurate MobTrack achieve. . . . . 59
5.1 Research Position. The interpretation of the four quadrants classificationmethod. We classify the works in the literature according to whether theyare fine-grained or course-grained, and whether they are resilient to contextchange. . . . . . . . . . . . . . . . . . . . . . . . . . . . . . . . . . . . . . . 61
5.2 The research roadmap. WiTalk follows the solution roadmap from CSI tospectrogram to fine-grained motion detection. . . . . . . . . . . . . . . . . . 62
5.3 CSI streams. The time-series of the CSI matrix contains 30×Ntx ×Nrx CSIstreams. . . . . . . . . . . . . . . . . . . . . . . . . . . . . . . . . . . . . . . 65
5.4 WiTalk System Design and Workflow. We take lip reading as an applicationexample but it can be extended to any fine-grained motion detection. . . . . 68
5.5 The first 4 Fresnel zones for 5.18GHz WiFi signals. Human mouth is in thefirst 4 fresnel zones when human talking over the phone. . . . . . . . . . . . 68
5.6 CSI SNR change with the distance of mouth and smartphone. When thedistance is over 20cm, the SNR is near 0. . . . . . . . . . . . . . . . . . . . . 69
5.7 The original CSI stream contains breathing variations and noise, which canidentified in the corresponding spectrum. . . . . . . . . . . . . . . . . . . . . 71
5.8 Denoising the CSI Streams. Bandpass filter keeps the signals between 1-10Hz.PCA filter utilizes the correlation between CSI streams to enhance filteringquality. . . . . . . . . . . . . . . . . . . . . . . . . . . . . . . . . . . . . . . 72
5.9 Different CSI waveforms for the same syllable are quite different in time do-main, indicating the difficulty of using time domain waveforms as the classi-fication features. . . . . . . . . . . . . . . . . . . . . . . . . . . . . . . . . . 74
5.10 Spectrograms and contours of different syllables. The x axis and y axis aretime and frequency respectively. . . . . . . . . . . . . . . . . . . . . . . . . 75
5.11 System application scenario of WiTalk. WiTalk is implemented on a commer-cial laptop. . . . . . . . . . . . . . . . . . . . . . . . . . . . . . . . . . . . . 77
5.12 WiTalk test bed. The locations of WiTalk device are marked as the blue dots.The locations of the user are marked as stars. . . . . . . . . . . . . . . . . . 78
xiii

5.13 Confusion matrix of 12 syllables in the same context. The average detectionaccuracy is 92.3%. . . . . . . . . . . . . . . . . . . . . . . . . . . . . . . . . 79
5.14 Confusion matrix of 12 syllables in the mixed contexts. The average detectionaccuracy is 82.5%. . . . . . . . . . . . . . . . . . . . . . . . . . . . . . . . . 79
5.15 Sentence recognition accuracy drips significantly when the number of wordsincrease because of the difficulty of in-word segmentation. . . . . . . . . . . . 80
5.16 Identification performance drops with distance between WiTalk device andthe user. . . . . . . . . . . . . . . . . . . . . . . . . . . . . . . . . . . . . . 81
xiv

List of Tables
3.1 Simulation Parameters . . . . . . . . . . . . . . . . . . . . . . . . . . . . . . 35
4.1 Percentage of segmented multipath curves . . . . . . . . . . . . . . . . . . . 56
xv
Chapter 1
Introduction
Wireless signals exist ubiquitously in our daily life, especially in the new era of Internet ofThings (IoT). The major role of wireless signals is a type of communication medium. Recentresearch has extended the role of ubiquitously available wireless signals to be a sensingplatform of the physical world. This dissertation focuses on the problem of exploring thesensing capability of wireless signals. In this section, the research position and the currentresearch status of wireless sensing is briefly introduce. The research goals, research methodsas well as research contributions will be also be covered.
1.1 Sensing Using Wireless Signals
Sensing of objects and the environment using wireless signals is not a new concept. Radarhas been extensively studied and employed to gather information about distant objects suchas the range, angle or velocity [16] using radio waves. When electromagnetic wave encountersan object, some part of the electromagnetic energy is absorbed and the rest energy will bereflected back because of the sudden changes in conductivity in the medium. The reflectedelectromagnetic is then received by Radar antennas and analyzed to locate the objects.However, Radar techniques usually rely on dedicated hardware or ultra-wide bandwidth toachieve high range resolution, which impedes their daily life application.
On the other hand, wireless communication techniques have been tremendously developedand deployed in the new era of IoT. IoT is the network of “things”, where each “thing”is uniquely identified through its embedded computing system and is able to communicatewith others within the network. A “thing” in IoT can be any devices, mechanical or digitalmachines, objects, animals or people implanted with embedded computing systems. KevinAshton first mentioned the Internet of Things in a presentation he made to Procter & Gamblein 1999 [10]. Since then, IoT has been a hot topic both in the industry and in academia.It is estimated that Internet connected devices outnumber humans in sometime between
1

2
2008 and 2009 (Figure 1.1) by Cisco [37], which is believed to be the “birth” of the Internetof Things. Gartner’s estimation is more conservative by suggesting that over 20 billionconnected IoT devices will be in use by 2020 [1]. Most of IoT devices will be connect tothe Internet using some kind of wireless connections because the cost of wireless radios hasdropped tremendously. For example, in 2017, Sigfox pronounced a $0.20 IoT wireless modulethat is so cheap that even disposable items can become part of the internet of things [7].
0
1
2
3
4
5
6
7
0
10
20
30
40
50
60
2003 2010 2015 2020Co
nnec
ted
Devi
ces
per P
erso
n
Wor
ld P
opul
atio
n an
dCo
nnec
ted
Devi
ces(
Billi
on)
World Population Connected Devices Connected Devices per Person
More Connected Devices Than People
Figure 1.1: Cisco estimates that there will be over 50 billion connected devices by 2020. An importantinflection point occurred in 2008, when the number of things connected to the Internet surpassed the humanpopulation, which is believed the “birth” of IoT.
The ubiquitous availability of wireless connections and wireless signals leaves a wide gapfor the research community to explore. The technology of using wireless communicationsystems as the ubiquitous sensors has been named wireless sensing or sensorless sensing[121, 145]. To take after Kristen Woyach in [121], “the radio itself, provided that it canmeasure the strength of the incoming signal, is the only sensor we use; with this sensorlesssensing approach, any wireless network becomes a sensor network”.
It should be noted that the concepts of wireless sensing and wireless sensor network(WSN)[12] are very different. In WSN, a sensor node consists of sensing, data processing andcommunicating components, where the communication module uses some kind of wirelesstechniques. The “wireless” in its name only refers to the used communication technique,while its sensing capability relies on the sensors equipped on the nodes. In wireless sensing,the sensing capability comes from the wireless communication system itself. We are using

3
the “side channel” of wireless communications for the purpose of sensing.
Wireless sensing has various application possibilities, among which indoor localization andhuman motion sensing are the two most active research areas. In the next sub-sections, Iwill briefly introduce the state-of-art of research results along these two directions.
1.1.1 Indoor Localization
Wireless sensing based indoor localization spawns numerous location-based applications in awide range of living, production, commence, and public services. In outdoor environments,global navigation satellite systems are used as the location service, among which GlobalPositioning System (GPS) is the most widely used. But in indoor environments, GPS signalsare usually not accessible, which makes indoor localization more challenging than outdoor.Localization precision requirement is also higher than GPS system to room-level or even sub-meter level. Because of the ubiquitous deployment of wireless networks and devices, wirelesssensing has been extensively studied for indoor localization during the past two decadesThe basic idea of wireless indoor localization is to map physical measurements derived fromwireless signals into geometric parameters such as distances or directions from referencepoints.
The previous research literature can be briefly categorized according to the physical mea-surements. Power(RSSI, CSI), time and angle are the physical measurements for indoorlocalization with different accessibility and accuracy.
Received Signal Strength (RSS) based approach is one of the mostly widely used ap-proaches for indoor localization because of its simplicity and direct availability [25, 47, 60,63, 129, 131]. The value of Received Signal Strength Indication (RSSI) can be read frommost wireless network interface cards (NIC). RSSI based solutions can be archived into twocategories. One is the range based algorithms, which estimate the distances from multi-ple measurement points to the target using wireless signal propagation models and locatethe target geometrically [134]. The other category is fingerprinting based [17, 92, 101, 130].The problem of fingerprinting is that they need extensive accurate environment calibrationworkload before system deployment.
Channel State Information (CSI) provides more fine-grained channel measurementsfor every subcarrier for Orthogonal Frequency Division Multiplexing (OFDM) technologybased wireless systems. It is potential to achieve accurate and pervasive indoor localizationusing CSI, which has attracted much recent research interests [100, 101, 118, 122, 123]. Forexample, [122] and [118] construct CSI fingerprinting to improve the performance of RSSIbased fingerprinting methods. However, like RSSI, CSI fingerprinting localization methodssuffers the same problem of environment calibration.
Time of Flight (ToF) or Time of Arrival (ToA) measures the signal propagation timeto calculate the distance between the transceivers. ToA based ranging solutions require
4
dedicated hardware with high sampling rate. Instead of measuring signal propagation timedirectly, researchers usually turn to measuring frequency differences [11, 42] or using slowersignals like acoustic signals [68, 81, 128, 143]. However, in order to distinguish line-of-sight(LoS) signal and non-line-of-sight (NLoS) signals, ToA based ranging solutions must ap-ply extremely high sampling rate because the propagation distance difference between LoScomponent and the second arriving multipath component is only about tens of nanosec-onds [108,112].
Angle of Arrival (AoA) based estimation algorithms [95, 98] rely on antenna arrays toestimate the angle at which the transmitted signal impinges on the receiver [62, 125]. Sig-nal samples collected from the antennas are processed using eigenvalue decomposition basedmethods to estimate signal AoAs. One challenge for AoA based approaches is to deal withthe multipath phenomenon in indoor environments. Multipath components from the samesource can be highly correlated, which makes eigenstructure based AoA estimation algo-rithms inaccuracy or even infeasible to estimate the AoAs. Recent techniques can overcomethe multipath challenge by using a high density of Access Points (AP). For instance, [29]utilizes over 100 APs, ArrayTrack [125] leverages several WiFi APs with 7 to 8 antennas andPinPoint [52] assumes 5 APs on a floor.
1.1.2 Human Motion Sensing
Motion sensing based human localization, human tracking, gesture and activity recognitionhave been studied intensively in the research community. Existing work on motion sensingcan be briefly divided in three categories: vision-based, wearable sensor-based and RF-based.
Vision-based approaches are the most popular for video gaming and virtual reality plat-forms. Such systems include Microsoft Xbox Kinect [2], Leap Motion [3], and Sony PlaySta-tion Camera [5]. They use color and infrared cameras to do body-depth perception, motiontracking and gesture recognition. The main problem of vision-based motion sensing is thatits performance is highly influenced by the condition of lighting. These systems also requireLoS condition for proper operation.
Wearable device based methods like RF-IDraw [115] traces trajectory of fingers andhands by attaching Radio Frequency Identification Device (RFID) to the fingers. [126] usessmartwatch to identify 37 gestures. TypingRing [83] asks the users to wear a ring for textinputting with the capability of detecting and sending key events in real-time. AllSee [54]is a gesture-recognition system that can operate on a range of computing devices includingthose with no batteries. The problem of wearable device based methods is that they areinvasive. The users have to wear extra devices all the time.
RF-based motion sensing can be briefly divided in two categories. The first category meth-ods rely on specialized hardware. WiTrack [11] tracks 3D human body motion using anFMCW(Frequency Modulated Carrier Wave) radar at the granularity of 10cm. WiSee [89]

5
works by looking at the minute Doppler shifts and multi-path distortions for gesture recog-nition. Google Project Soli [6] uses on-chip 60GHz radar to detect fine-grained motion.However, the short effective range limit its application in long distance scenarios.
Recent work focuses more on Commercial Off-The-Shelf (COTS) instead of specialized hard-ware. By analyzing CSI dynamics from WiFi NICs, it’s possible to estimate human motions.CSI-based method like CARM [117] builds a CSI-speed model and a CSI-activity model,which depicts the relationship between CSI value dynamics and human body parts move-ment speeds, and the relationship between the body movement speeds and specific humanactivities. WiKey [13] uses CSI waveform shape as the features and can recognize keystrokesin a continuously typed sentence. WiKey works well only in controlled environments andspecific devices positioning. WiFinger [110] also uses CSI waveform shape as the featuresand can discern 8 finger gestures. WiFinger also requires static transceivers and finger mo-tions must be near the LoS line of the transceivers. WindTalker [67] allows an attacker toinfer the sensitive keystrokes on a mobile device using CSI. However, WindTalker requiresthat the mobile device being placed in a stable environment. Wi-Wri [22] uses WiFi signalsto recognize written letters. WiDraw [104] leverages WiFi signals from commodity mobiledevices to enable hands-free drawing in the air. WiHear [113] uses specialized directionalantennas to obtain usable CSI variations for the purpose of lip reading.
RF-based motion sensing does not require users to wear any physical sensors. Because ofthe physical properties of RF signals, these approaches can sense user motion under bothLoS and NLoS scenarios. The prevalence of RF wireless network infrastructures also enableslarge scale deployment.
1.2 Research Contributions
This dissertation explores the sensing capability of wireless signals. In the indoor localizationresearch area, the problem of interference source localization is studied. We conquer twomajor challenges to do indoor interference localization: to identify the interfering signaltype and to isolate the LoS component. In the human motion sending research area, weextended the research boundary of CSI based human motion sensing to fine-grained context-free quadrant.
The meaning of sensing capability can be explained using this DIKW model as shown inFigure 1.2. Sensing is the process of collecting data from physical world to cyber space. Thecollected data can be raw data open to interpretation, or have some higher level meaning tohuman, depending on how we define the sensor. Data need to be analyzed to extract someuseful information. Combining multiple pieces of information, we may get some knowledge.And from knowledge, it’s possible to learn some wisdom. The meaning of sensing capabilityshould cover all the four levels and the four processing steps. The sensing capability dependsnot only on what data we can collect, but also on how we interpret the data and what to

6
learn from the data.
In this dissertation, we use the DIKW model to determine the roadmap of each piece ofwork. For the interference localization problem, we use a top-down method. We start fromproblem because the problem definition is clear. We then identify three types of methods touniquely define a location point, namely distances, directions and environment fingerprints.We then go to the data layer, and identify what kind of data we can collect: the RSSI,CSI, ToF and the phase array raw signals and how we can map the collected data to thelocalization methods. Comparing their pros and cons, we make the selection of our roadmap.
For the fine-grained motion sensing problem. We use a bottom-up method. We firstlyidentify CSI as one of the promising research topics. We then analyze CSI to determinewhat kind of information we can get from CSI streams. We find out that spectrogram ispromising for context-free human motion detection. At last we select the research topic offine-grained motion sensing because it’s out of the boundary of the current research status.
learning
combining
analysis
sensing
Data
Information
Knowledge
Wisdom
The DIKW Pyramid
Sen
sin
g C
ap
abili
ty
Figure 1.2: The DIKW model. Sensing is the process of collecting data from physical world to cyber space.Data need to be analyzed to extract some useful information. Combining multiple pieces of information,we may get some knowledge. From knowledge, it’s possible to learn some wisdom. Wireless sensing shouldcover all the four processing steps.
The first piece of work is wireless signal attributes analysis. Specifically, the cyclostationar-ity properties of WiFi signals are studied, which are induced by OFDM features like pilots,cyclic prefix (CP), and preambles. Signal models of these features is first proposed. Thenthe spectral correlation functions are derived. The induced cyclic frequencies is studied ofits applicability to the signal-selective direction estimation (SSDE) problem. Theoretical

7
analysis is verified using simulation results. The analysis results (e.g., OFDM feature in-duced cyclostationarity) are also useful for other applications, such as signal detection andidentification in Cognitive Radio (CR) networks.
The second piece of work is to solve the problem of indoor interference localization. Wedesign and implement a prototype of a single device system that can locate indoor interferingradios. The goal of designing MobTrack is to provide a lightweight, handhold system thatcan locate interfering radios with sub-meter accuracy with as few antennas as possible.With a small antenna array, the cost, complexity as well as size of this device will be alsoreduced. MobTrack is the first single device indoor interference localization system withoutthe requirement of multiple pre-deployed access points.
Channel state information is then studied in human motion sensing applications. We designand implement the prototype of WiTalk, the first context-free fine-grained motion sensingsystem using WiFi physical layer channel information. Similar to previous CSI-based motionsensing solutions, WiTalk infers human motion by analyzing the CSI dynamics. WiTalk isthe first feasible system in the context-free fine-grained quadrant of motion sensing solutionplane using WiFi CSI dynamics. We show the existence of this quadrant I solution byidentifying the CSI spectrograms as the intrinsic stable properties that correlate to fine-grained human motion. We identify and extract effective features from CSI spectrogramsby calculating the contours of CSI spectrograms. These new discerning features solve theproblem of low time-frequency resolution using discrete wavelet transform(DWT). We verifythe feasibility of WiTalk by applying it to the lip reading scenario. Experiment results showthat WiTalk achieves comparable results to previous fine-grained context-related solutions.
1.3 Organization
The dissertation is organized as follows.
Chapter 2 introduces the background knowledge related to this dissertation. We brieflyoverview the knowledge background of wireless signals and technologies related to this dis-sertation. The purpose of this overview is to set a whole map for understanding the positionof the research work of this dissertation. Different types of wireless signals are firstly in-troduced as well as their specific properties both for the purpose of communication andsensing. The introduction is mainly focus on RF signals. Measurement methods of RFsignal attributes as well as applications of using these attributes will be listed. At last, thesuperposition properties of RF signals are introduced, including interference superpositionand multipath superposition.
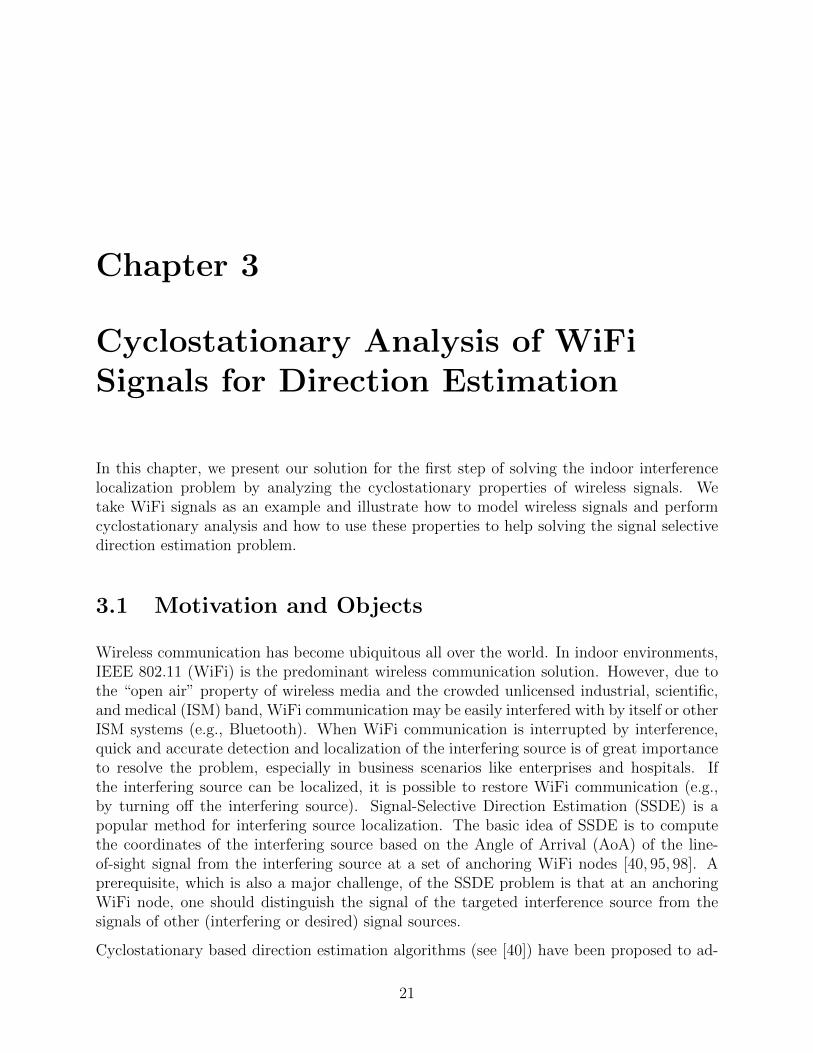
Chapter 3 presents the work on cyclostationary analysis of WiFi signals for direction estima-tion. We present our solution for the first step of solving the indoor interference localizationproblem by analyzing the cyclostationary properties of wireless signals. We take WiFi signalsas an example and illustrate how to model wireless signals and perform cyclostationary anal-
8
ysis and how to use these properties to help solving the signal selective direction estimationproblem.
In Chapter 4, the complete solution to the indoor interference localization problem is pre-sented. We first introduce the related work and research method. The four system workflow steps are then detailed one by one. We then present the implementation details as wellas the performance evaluation.
In Chapter 5, we introduce the research work on WiFi based fine-grained motion sensing. Wefirst briefly talk about the concept of CSI and the preliminary of CSI-based motion sensing.The six system work flow steps are then presented in detail, among which we concentrateon interference elimination and feature extraction. We implement and evaluate the systemdesign using the lip reading application.
Chapter 6 summarizes the research achievements, concludes this dissertation and list severalpossible future research directions.

Chapter 2
Sensing Using Wireless Signals:Fundamentals and Applications
In this chapter, we briefly overview the knowledge background of wireless signals and tech-nologies related to this dissertation. The purpose of this overview is to set a whole mapfor understanding the position of the research work of this dissertation. Different types ofwireless signals is firstly introduced as well as their specific properties both for the purpose ofcommunication and sensing. The introduction will focus on RF signals. Measurement meth-ods of RF signal attributes as well as applications of using these attributes will be listed.The superposition properties of RF signals are introduced, including interference superposi-tion and multipath superposition. At last, we briefly introduce the concept of physical layersecurity, which is an application of wireless sensing.
2.1 Wireless Signals and Communications
In a broad sense, wireless signals can be any signals that are transferred without wire connec-tion. The most commonly used wireless technologies are radio waves. Other types of wirelesssignals include visible light and acoustic based techniques. Recent developed counterfactualcommunication uses quantum mechanics to transfer information without any particles trav-elling between two recipients. In a sense, this counterfactual communication is also wireless,though there is no traditional “signals”.
Radio
A radio frequency (RF) signal refers to a wireless electromagnetic signal used as a form ofcommunication. The radio frequencies of radio waves are in range from 3kHz to 300GHz.Frequency refers to the rate of oscillation of the radio waves. RF signals can cover a largedistance and is able to penetrate opaque objects like wall and human body. This property
9

10
allows radio signals to be used in through-the-wall sending applications. RF wave is electro-magnetic radiation and can propagate at the speed of light and does not need a medium likeair to travel. The high propagation speed makes it hard to accurately measure its travellingtime in a distance at an indoor scale.
Many RF communication systems have been broadly deployed in industry and in our dailylife. Exiting RF technologies which has been used to provide wireless sensing services includeWiFi [50], Bluetooth [21, 78, 79], Zigbee 1 [18, 57, 65], and Radio Frequency IdentificationDevice (RFID) [39,64,120]. As we previously mentioned, RSSI, CSI, ToF and AoA techniquescan be used to provide wireless sensing services using these RF communication signals.
Visible Light
Visible light (VL) as well as its nearby bands like infrared (IR) and ultraviolet (UV) consistsof a wide frequency bands on the electromagnetic spectrum. Optical wireless communica-tion (OWC) [15, 30, 35, 59] uses light propagating in free space to transmit wirelessly data.“Free space” means the light beams travel through the open air or outer space instead oftransmission lines such as optical fiber.
Compared to RF, optical wireless has several technology-specific characteristics. First, RFnetworks suffer from spectrum congestion. Some of the RF bands are licensed to specificorganizations. OWC provides the unlicensed, free of charge optical band. At the same timeit has potentially much larger available bandwidth. So OWC is considered be to a promisingnetwork technology. Second, optical wireless has its own technical limitations compared toRF, such as the absence of line of sight (LoS) and infeasibility of uplink transmission.
Current OWC technologies include visible light communication (VLC) [86,93], light fidelity(LiFi) [33,46,71], optical camera communication (OCC) [44,127,144] and free space optical(FSO) communication [20,55,75].
Using optical signals as remote sensing technology for very-high-resolution 3D mapping isalso proposed such as LiDAR [140].
Sound and Ultrasound
Unlike electromagnetic, sound [58] is a mechanical pressure wave resulting from the backand forth vibration of the particles of the medium. The frequency band of sound waves isbetween 20Hz and 20kHz, while ultrasound [105] is sound waves with frequencies higher than20kHz. Ultrasound devices can be used to detect objects and measure distances [87,107].
Sonic and ultrasonic short range communication systems have been studied and proposed inthe literature [66]. Recently, near ultrasound based localization and raging systems have beenwell studied. These systems leverage the ubiquitous microphone sensors in smartphones andvoice assistant systems to capture acoustic signals emitted by microphones and estimate theuser locations [45,70,82,141]. Traditionally, acoustic-based localization transmits modulatedacoustic signals, containing time stamps or other time related information for the purposeof ToF estimation by the microphone sensors. Another solution is to use the phase and
11
frequency shift of the Doppler effects in the received acoustic signal, which is caused by amoving object to estimate the relative position and velocity.
Quantum communication
Before this counterfactual quantum communication, all our communication is essentiallyphysical, which is to say, all the information is transmitted using actual objects. For ex-ample, in previously mentioned RF and optical communications, the information is carriedby photons and transmitted at the speed of light. However, in the most recently developedquantum communication domain, information can be transmitted using the transfer of qquantum state instead of an actual quantum or classical particle [23, 96].
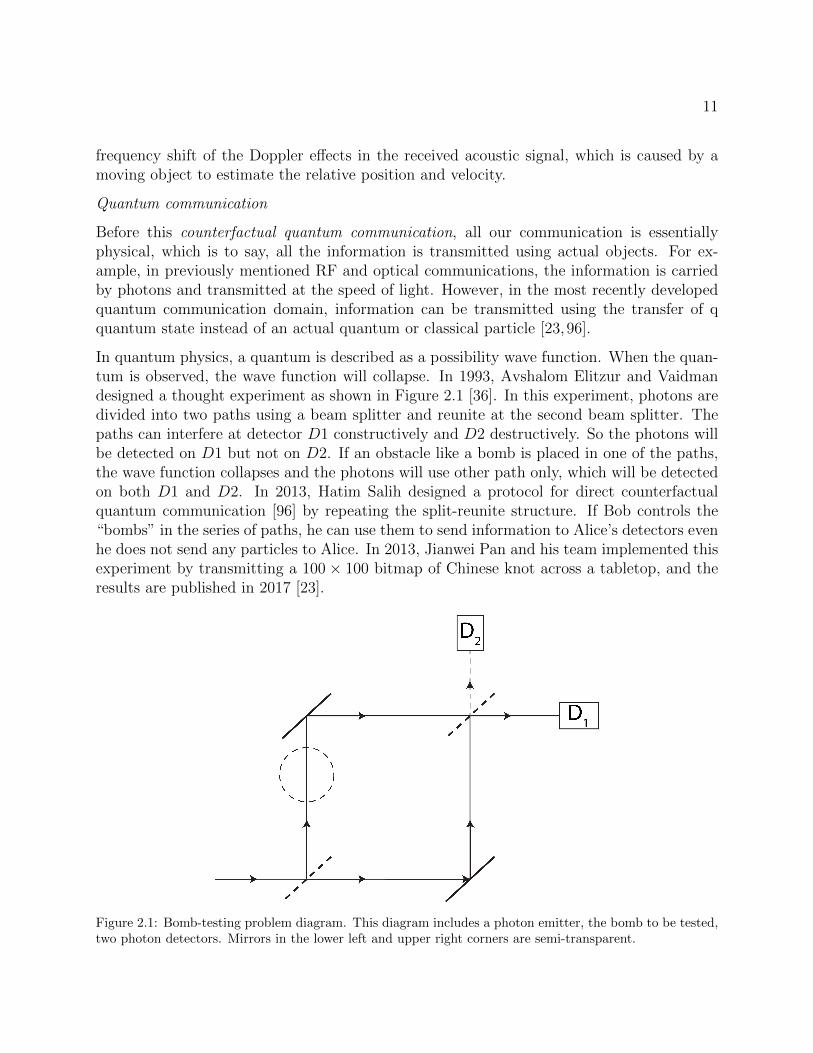
In quantum physics, a quantum is described as a possibility wave function. When the quan-tum is observed, the wave function will collapse. In 1993, Avshalom Elitzur and Vaidmandesigned a thought experiment as shown in Figure 2.1 [36]. In this experiment, photons aredivided into two paths using a beam splitter and reunite at the second beam splitter. Thepaths can interfere at detector D1 constructively and D2 destructively. So the photons willbe detected on D1 but not on D2. If an obstacle like a bomb is placed in one of the paths,the wave function collapses and the photons will use other path only, which will be detectedon both D1 and D2. In 2013, Hatim Salih designed a protocol for direct counterfactualquantum communication [96] by repeating the split-reunite structure. If Bob controls the“bombs” in the series of paths, he can use them to send information to Alice’s detectors evenhe does not send any particles to Alice. In 2013, Jianwei Pan and his team implemented thisexperiment by transmitting a 100× 100 bitmap of Chinese knot across a tabletop, and theresults are published in 2017 [23].
Figure 2.1: Bomb-testing problem diagram. This diagram includes a photon emitter, the bomb to be tested,two photon detectors. Mirrors in the lower left and upper right corners are semi-transparent.

12
Though there is no classical signals transmitted, the quantum wave function does demon-strate its ability of sensing at least the presence/absence of an obstacle. Whether it’s possibleto be used as a more general sensing method needs future study.
2.2 Measurement of RF Signals Attributes
In this dissertation, we mainly focus on the sensing capability of RF signals, because RFcommunication are the main technologies used in our daily life. To reuse the RF communi-cation systems as a sending method, we first identify what measurements we can do to RFsignals and how these measurements can help us in the sensing applications.
An RF signal is an electromagnetic wave that communications systems use to transportinformation through air from one point to another. The basic elements of a RF signal isdepicted in Figure 2.2, including its amplitude, phase and frequency.
t
Amplitude
Phase
T f=1/T
Figure 2.2: The basic elements of RF signals: the amplitude, phase and frequency.
Amplitude
The amplitude of a radio wave is the difference between its maximum and its minimum valueduring one cycle. Radio waves have amplitudes with units used for the intensity of electronicfield, the Volt (V). The amplitude of a radio indicates its strength. In practice, the powerrather than the amplitude of signal is measured, because it’s difficult to perform voltagemeasurements with Alternating Current (AC), especially for high frequency RF signals.Power measurement is simpler and more accurate, and the measurement of power can beconverted to amplitude.
Power

13
The power of a RF signal is the transfer rate of energy per unit time. In terms of electro-magnetic signals, power represents the amount of energy necessary to push the signal over aparticular distance. As the power increases, so does the range. Power is measured with theunit of Watts or in dBm units (decibels referenced to 1 mW) to represent the amplitude ofradio waves. The dBm is the amount of power in watts referenced to 1 mW. Zero (0) dBmequals 1 mW. The dBm values are positive above 1 mW and negative below 1 mW.
In practical systems, RSSI is the measurement of power. The higher the RSSI values, thestronger the signal. Different from dBm, RSSI is a relative index while dBm is the absolutenumber representing power levels in mW. For most widely used wireless techniques rangingfrom UWB, ZigBee, and WiFi to cellular networks, RSSI is handily accessible.
The main drawback of RSSI measurement is that it’s not stable in complex indoor environ-ments. RSSI not only varies over distance but also suffers from shadow fading and multipathfading, as shown in Figure 2.3. RSSI also fluctuates over time even at a static link becauseof the multipath effect.
Figure 2.3: RSSI variations due to path loss, shadow fading and multipath fading [129].
Phase
The phase of a radio wave corresponds to how far the signal is offset from a reference point(such as a particular time or another signal). By convention, each cycle of the signal spans360 degrees. For example, a signal might have a phase shift of 90 degrees, which means thatthe offset amount is one-quarter (90/360 = 1/4) of the signal [41].

14
The phase measurement is important in RF wireless applications. The phase measurementtechniques include: direct oscilloscope methods, Lissajous figure methods, and zero-crossingmethods [84].
Time-of-Arrival
The measurement of RF signal transmission time is name the measurement of Time OfArrival (ToA) and Time Difference Of Arrival (TDoA). ToA is the time used for a signal toflight from the transmitter to the receiver. The measurement of ToA is based on knowingthe exact time the signal leaves the transmitter and the exact time it arrives at the receiver.However, it’s hard to exactly synchronize the transmitters. TDoA is more versatile thanToA by measuring “time difference of arrival” (TDOA) of a signal from the emitter at threeor more synchronized receiver sites. The main drawback of ToA measurement is that itrequires a high Analog-Digital Converter (ADC) sampling rate to get high accuracy.
Frequency Modulated Continuous Waveform (FMCW) is typically used for accurate ToAmeasurement. In FMCW, an electromagnetic signal is continuously transmitted with time-varying frequencies. As shown in Figure 2.4, the signal with an continuously changingfrequency is named a chirp. The difference in frequency between the transmitted signaland the reflected signal can be calculated by mixing the two signals, producing a new signalwhose frequency is in base band and can be measured to determine the time of flight becausethe frequency difference is proportional to the transit time. The time can then be mappedto distance or velocity. FMCW radar is an indirect method of ToA measurement.
138.2𝑘𝐻𝑧
𝑡
𝑓
2.5𝑚𝑠
1.69𝐺𝐻𝑧
Figure 2.4: The FMCW system estimates the ToF by measuring the frequency difference.

15
Angle-of-Arrival
The measurement of Angle of Arrival (AoA) is to determine the electromagnetic wave di-rections of arrival on a sensor. It is important to many wireless sensing systems. Angleinformation is an orthogonal dimension to distance. For geometric mapping, angle can becombined with distance to estimate the location of a target from a single reference point.The measurement of angle can be distinguished in two categories. The first category is tomeasure the maximum signal strength during the antenna rotation and then use algorithmslike maximum likelihood to determine the AoA. The second category is the high resolutionmethod using an antenna array [27], which is high cost specific hardware. However, with thedevelopment software defined radio and MIMO technology, it’s not that hard to constructan antenna array with more than a dozen of antennas.
Instantaneous frequency
The frequency of a radio wave is the number of times per second that the signal repeats itself.The unit for frequency is Hertz (Hz), which is actually the number of cycles occurring eachsecond. The frequency of radio waves impacts heir propagation. Lower-frequency signalshave longer wavelengths. The lower the frequency, the smaller the propagation loss and thelonger the coverage distance. But as the lower frequency bands are limited, low-frequencyradio waves are mainly used for broadcast, TV and paging systems. On the other hand, thehigher the frequency is, the greater the propagation loss and the closer the coverage distance.
In practice, RF signals have a set of frequencies, which is named frequency spectrum. Fre-quency spectrum is measured using spectrum analyzers. Spectrum analyzers use fast Fouriertransform (FFT) to analyze the frequency components of the RF signals.
Time-Frequency Spectrogram
A spectrogram is a visual representation of the spectrum of frequencies as the signals varywith time. Using spectrogram, we not only can see the signal energy at specific frequen-cies, but also we can see how the frequency spectrum changes over time. Spectrogram aretwo dimensional graphs: the time and the frequency. The energy level of the signals arerepresented by colors.
The spectrogram can be generated using short-time Fourier transform (STFT) [90]. Anexample of a liner chirp and its corresponding spectrogram is shown in Figure 2.5.
2.3 Superposition of RF Signals
When two RF signals encounter, they will combine to generate a resultant wave whoseamplitude is the algebraic sum of the individual waves. Two types if superposition canbe identified, namely interference and multipath propagation. Interference signals are fromdifferent signal sources, while multipath components are signals from the same source.

16
0 200 400 600 800 1000 1200 1400 1600 1800 2000-1
-0.5
0
0.5
1
x(t
)
0.2 0.4 0.6 0.8 1 1.2 1.4 1.6 1.8
Time (secs)
0
200
400
Fre
qu
en
cy (
Hz)
-120
-100
-80
-60
-40
-20
Po
we
r/fr
eq
ue
ncy (
dB
/Hz)
Figure 2.5: A liner chirp and its corresponding spectrogram.
2.3.1 Interference
Interference occurs when two different signals are present at the receiving station at thesame time. The two signals have the same frequency band. When interference happens,the RF communication will be degraded because the receiver will fail to decode the signals.Interference can be express as x = s + i + n, where x is the received interfered signal, s isthe sent signal, i is the interfering signal and n is background noise.
To reduce the possibility of signal interference between different systems, the Federal Com-munications Commission (FCC) regulates the use of most frequency bands and modulationtypes. However, radio interference can still occur, especially with systems operating inlicense-free bands. For example, the ISM band is heavily used by many systems includeWiFi, cordless phones, microwave ovens, and Bluetooth devices. When these types of RFdevices are in use, the performance of a wireless network can significantly decrease because ofretransmissions and competition on the network for use of the medium. This requires care-ful planning and consideration of other radio devices that might interfere with the wirelessnetwork.
To combat RF interference, it is important to eliminate the sources of interference. Orgniza-tions may set policies for using wireless devices in their network, but it is hard or evenimpossible to completely restrict the use of wireless devices becuase the large number of

17
them. Another way to avoid interferene is to use a frequency band that does not confict.However, as the radio frequency regulated by FCC, it is usually hard to find unused fre-quency band. In this situation, it is an urgent need for network operators to identify andlocate the interference sources as quick as possible.
2.3.2 Multipath
Multipath propagation occurs when portions of an RF signal take different paths whenpropagating from a source to a destination node, such as an access point, as shown in Figure2.6. A portion of the signal go directly to the destination, which is the line of sight (LoS)component; and another part might bounce from the ceiling, and then to the destination,which is a static reflected component. The part bonce from the moving human body and thento the destination is the dynamic reflected component. Multipath components encounterdelay and travel longer paths to the receiver [38].
Sender Receiver
Figure 2.6: Multipath components of the signal include the line of sight component, static reflected compo-nents, and dynamic reflected components.
Multipath propagation may cause interference. If two components are in phase, then theyare constructive factors, otherwise, they are desctructive factors as shown in Figure 2.7.
In case where the LoS path is much stronger than reflected paths, multipath interferenceeffects may be negligible. However, the LoS path may not always be available and multipathsignals may cause significant corruption of the communication. What is worse, the multipathchannel characteristics may change over time because of the change of channel geometry. Inindoor environments, the propagation path contains all kinds of reflectors like walls, ceilings,the floor, desks , file cabinets, etc. The net channel characteristics result from the sum of allthe individual reflection channels. For example, when a user move a little bit, the electricallengths of all the paths reflected from the user change simultaneously. This will both changethe delays and the phases of the signals. Small differences in the delay and phases can make

18
Original
Constructive
Destructive
sum
sum
t
t
t
Figure 2.7: Multipath components. Multipath superposition may be constructive or destructive.
big differences in the received signal because of the superposition effects. For example, for2.4GHz WiFi, the signal wavelength is about 6cm, and the path delay of half a wavelengthwill totally null the received signal if we assume the signal strength of the two paths are thesame.
OFDM is specially designed to eliminate multipath effects in the wireless communications.Multipath delays cause inter-symbol interferences (ISI). OFDM divides the total signal band-width in to number of small subcarriers and transmits information on each of the subcarriers.By inserting guard time that is longer than the delay of the channel, OFDM is able to mit-igate ISI.
2.4 Physical Layer Security
The application of wireless sensing in security domain is physical layer security (PLS). PLSexploits the unpredictable features of wireless channels such as channel fading. Using theDIKW model, the data collected is the channel/signal status, and then the data are analyzedto extract useful information like physical layer keys for security applications. Like motionsensing, physical layer security does not rely on the communication system but utilize thesensing capability of the wireless signals. Thus we identify PLS as an application of wirelesssensing.
Conventional wireless systems are protected using classical cryptosystems which are mainlybased on computational security. However, there are challenges in applying these approaches

19
in IoT, especially the low-end IoT devices. Those devices are usually embedded devices,which are low-cost and low-energy with limited computing ability. They can’t afford theadditional size, power consumption, and code space needed to perform the expensive math-ematical calculations of cryptographic methodologies [111]. In addition, IoT devices thatwork in a device-to-device communication mode may not have access to a secured public keyinfrastructure (PKI) for the distribution of public keys.
While the main security streams have focused on the upper layers, another research threadhas been active in recent years, which leverage physical layer to enhance security as wellas to decrease hardware complexity requirement and energy cost. Physical layer securityenhancement is twofold as shown in Figure 2.8 [136]. Information-theoretic security [88]which is also known as physical layer security (PLS), exploits the unpredictable featuresof wireless channels such as channel fading. PLS transmission techniques achieve securitythrough artificial noise [43], jamming [72], or beamforming [80], etc. However, these PLStransmission schemes are not practical yet because they require complex coding and theperfect channel state information (CSI) of the receiver and imperfect CSI of the eavesdroppers[146]. Physical layer key generation, which is promising and an active branch of PLS, isimplementable because the legitimate users are able to agree on the same key from the noisychannel estimation [135], which can be used as an alternative to PKI in many circumstances.
Security Enhancement at Physical Layer
Information Theoretic
SecurityComputational Security
Physical Layer Security
Transmission
Physical Layer Security
Key Generation
Physical Layer
Encryption
Figure 2.8: Taxonomy of physical layer security enhancement techniques.
Physical layer encryption (PLE) is a hybrid approach, which integrates information theo-retical security and computational security schemes. Physical layer key generation is usedover the noisy channel to generate common keys using pilot signals. The key generationprotocol that consists of channel probing, quantization, information reconciliation, privacyamplification. The key is then fed to the PLE, which performs encryption operations at themodulation stages of the physical layer, and protects the IoT wireless transmission. Theintegration of information-theoretic security schemes and computational security schemeshas some advantages over conventional upper layer encryption-based security primitives. Itsimplifies the process of common key distribution and removes the requirement of access to

20
PKI. It also protects physical layer package headers from side-channel analysis attacks [91].
Physical layer key generation depends on the randomness of wireless channels, and is built onthree physical principles of the channels: channel reciprocity, temporal variation and spatialdecorrelation. In physical layer key generation protocols, the wireless devices measure thehighly correlated wireless channel characteristics such as channel impulse response(CIR),received signal strengths(RSS), channel state information(CSI), and use the measured valuesas the randomness sources to generate a shared secret key. Physical layer key generationhas the potential to achieve information-theoretic security because it does not rely on thehardness of a computational problem. Thus, it does not require expensive computation.
Channel reciprocity means the channel responses of the forward and backward links are thesame, which is the basis for key generation. When two users measure the same channelparameters at the same frequency in a time-division duplex (TDD) mode, the measurementsat Alice and Bob are impacted by the non-simultaneous sampling and noise. However, ahigh correlation between channel measurements of Alice and Bob can still be maintainedand eligible for key generation in a slow fading channel, as demonstrated in many practicalexperiments [51,77,139].
Temporal variation indicates that there is randomness residing in the dynamic channel,which ensures the extracted keys are random. A random key will make the cryptographicapplications robust against attacks such as brute force. In the urban area, the interferencemay be chaotic, because of the densely deployed access points [53]. The interference willimpact the channel measurements accuracy but will not affect randomness nature of thewireless link between users. In addition, the statistical features of the channel may bedeterministic [28], but key generation is exploiting the instantaneous channel variation, whichis random in nature.
Spatial decorrelation implies that when located a half-wavelength away from the legitimateusers, the eavesdropper experiences an uncorrelated channel compared to that between Aliceor Bob, guaranteeing the security of the key generation. When the system works at 2.4 GHz,a half-wavelength is about 6cm, which is quite short. These principles have been theoreticallymodeled and analyzed in [137,138].
Chapter 3
Cyclostationary Analysis of WiFiSignals for Direction Estimation
In this chapter, we present our solution for the first step of solving the indoor interferencelocalization problem by analyzing the cyclostationary properties of wireless signals. Wetake WiFi signals as an example and illustrate how to model wireless signals and performcyclostationary analysis and how to use these properties to help solving the signal selectivedirection estimation problem.
3.1 Motivation and Objects
Wireless communication has become ubiquitous all over the world. In indoor environments,IEEE 802.11 (WiFi) is the predominant wireless communication solution. However, due tothe “open air” property of wireless media and the crowded unlicensed industrial, scientific,and medical (ISM) band, WiFi communication may be easily interfered with by itself or otherISM systems (e.g., Bluetooth). When WiFi communication is interrupted by interference,quick and accurate detection and localization of the interfering source is of great importanceto resolve the problem, especially in business scenarios like enterprises and hospitals. Ifthe interfering source can be localized, it is possible to restore WiFi communication (e.g.,by turning off the interfering source). Signal-Selective Direction Estimation (SSDE) is apopular method for interfering source localization. The basic idea of SSDE is to computethe coordinates of the interfering source based on the Angle of Arrival (AoA) of the line-of-sight signal from the interfering source at a set of anchoring WiFi nodes [40, 95, 98]. Aprerequisite, which is also a major challenge, of the SSDE problem is that at an anchoringWiFi node, one should distinguish the signal of the targeted interference source from thesignals of other (interfering or desired) signal sources.
Cyclostationary based direction estimation algorithms (see [40]) have been proposed to ad-
21

22
dress this challenge, by exploiting the signal selection properties of cyclic frequencies. A sig-nal can be modeled as cyclostationary if its cyclic autocorrelation function (CAF) is nonzerofor some nonzero cyclic frequencies. The Spectral correlation density function (SCD) is theFourier transform of a CAF, which can be estimated efficiently from discrete samples of thesignals. A cyclic frequency is a frequency at which the CAF is not zero, which can be deter-mined by examining the peaks on the signal CAF or SCD surfaces. Once a cyclic frequencyof the target signal is identified, the Cyclic MUSIC algorithm [97] can be used to estimatethe signal AoA. The Cyclic MUSIC algorithm takes a cyclic frequency of the target signalas an input, and then performs the MUSIC algorithm in [98] to estimate only the desiredsignal directions of arrival. Therefore, estimation of signal cyclic frequencies is the first stepto exploit the Cyclic MUSIC algorithm for direction estimation. A thorough analysis andevaluation of WiFi cyclostationary properties needs to be performed to estimate signal cyclicfrequencies.
OFDM is widely used as the modulation technique for major communication applicationssuch as WiFi (IEEE 802.11a/g/n) to improve spectrum efficiency. For the purpose of sig-naling, channel estimation, and synchronization, OFDM frame structure introduces somefeatures including pilots, cyclic prefix (CP), and preambles. These features generate peakson the SCD surface at specific cyclic frequencies, which can be utilized to distinguish WiFisignals from other signals.
In this chapter, we analyze WiFi cyclostationarity induced by these OFDM features. Wefirst present the signal models of these features and then derive their spectral correlationfunctions. After that, we investigate the applicability of the induced cyclic frequencies tothe SSDE problem. Simulation was conducted and the results are in agreement with ourtheoretical analysis. The work of this chapter are the first to analyze the cyclostationaryproperties of OFDM-based WiFi signals comprehensively for this purpose. The analysisresults (e.g., OFDM feature induced cyclostationarity) are also useful for other applications,such as signal detection and identification in the Cognitive Radio (CR) networks.
The rest of this chapter is organized as follows. Related work is presented in section 3.2.Section 3.3 offers essential background of the cyclostationary analysis. Section 3.4 presentsthe cyclostationary analysis induced by OFDM features of WiFi. In section 3.5 we evaluatethe influence of these features on the direction estimation of WiFi signals. Section 3.5concludes this chapter.
3.2 Related Work
Cyclostationary analysis is widely studied for the purpose of signal detection and identifica-tion. In [103], the authors proposed an OFDM system identification scheme for CR networksbased on pilot-induced cyclostationarity. In [106], an embedded cyclostationary signaturemethod for OFDM-based waveform identification was proposed. They generated a cyclo-

23
stationary signature using OFDM subcarrier set mapping, thus a spectral correlation wascreated in each OFDM symbol by simultaneously transmitting data symbols on more thanone subcarrier. In [24, 73, 99], the authors discussed pilot-induced and preamble-inducedcyclostationarity as well as their applications for signal detection in CR networks.
Cyclostationary property based interfering radio localization was proposed in [49, 52]. Inthese papers, the authors exploited cyclostationary analysis to extract feature vectors todetect signal types, the occupied spectrum, and the AoAs of arriving signals at the detectingradio. However, the authors did not provide the details of how cyclic frequencies(in thesepapers named pattern frequencies) were generated. They only gave a conclusion that thepattern frequencies of WiFi is any one between [fc − BW
2, fc + BW
2] in [49]. Our work is
inspired by these two papers, with a focus on the how cyclostationary properties are inducedby WiFi OFDM structures.
3.3 Cyclostationarity Preliminary
In this section, we introduce the concept of signal cyclostationary properties and the CyclicMUSIC algorithm.
3.3.1 Cyclostationary Properties
A signal x(t) in time domain is shown in Figure 3.1 (a). If x(t) contains some finite-strengthadditive sine-wave components with frequency fn,
x(t) = a0 +N∑n=1
an cos (2πfnt)
if the corresponding Fourier coefficients is not zero. The frequency spectrum of x(t) willpeak at these fn values, as shown in Figure 3.1 (b).
As shown in Figure 3.1 (c). Real life signals contain more frequency components, noise andhigh order “hidden” periodicity [40]. Unlike first order periodicity, signals with high orderperiodicity do not give spectral lines in spectrum. A signal can be modeled as cyclostationaryif its cyclic autocorrelation function (CAF) is nonzero for a nonzero cyclic frequency. TheCyclic Autocorrelation Function (CAF) is defined by
Rαx(τ) ,< x(t+ τ/2)x∗(t− τ/2)e−j2παt >, (3.1)
where the < · > is the time averaging operation defined by

24
t
Time domain
f
Frequency domain
(a) x(t) (b) F(x(t))
(c) y(t) (d) Fα(y(t)y*(t-τ))
Figure 3.1: A signal can be modeled as cyclostationary if its cyclic autocorrelation function (CAF) is nonzerofor a nonzero cyclic frequency.
< · >, limT→∞
1
T
∫ T/2
−T/2(·)dt.
If for some cyclic frequency α and delay τ , Rαx(τ) 6= 0, then this signal x is a cyclosta-
tionary signal, as shown in Figure 3.1 (d). When α = 0 , Rαx(τ) reduces to a conventional
autocorrelation function.
Equation (3.1) can be further interpreted as
Ruv(τ) =< u(t+ τ/2)v∗(t− τ/2) >, (3.2)
where u(t) = x(t)e−jπαt and v(t) = x(t)ejπαt.
We can see from Equation (3.2) that a signal exhibiting the cyclostationary property cor-relates with a frequency-shifted version of itself, which means that the signal exhibits the

25
spectral coherence property.
The Fourier transform of CAF is spectral correlation density function (SCD), which is definedby
Sαx(f) =
∫ ∞−∞
Rαx(τ)e−j2πfτdτ
= limB→0
1
B< [hfB(t)⊗ u(t)][hfB(t)⊗ v(t)]∗ >,
(3.3)
where ⊗ denotes convolution, u(t) and v(t) are given in Equation (3.2), and hfB(t) is theimpulse response of a one-sided bandpass filter with center frequency f (see [40] for details).
In the discrete domain, the continuous signal x(t) is sampled as a series x[n] and the valuesof SCD must be estimated from the samples. The algorithm we choose here is Fast FourierTransform (FFT) accumulation (FAM) [94].
3.3.2 Signal Direction Estimation
MUltiple SIgnal Classification (MUSIC) is an algorithm to determine the parameters ofmultiple wavefronts arriving at an antenna array. MUSIC algorithm can be used to asymp-totically unbiased estimates the number of signals, directions of arrival, strengths and crosscorrelations among the directional waveforms and strength of noise or interference.
Array Signal Measurement Model
For simplicity, we assume a Uniform Linear Array (ULA) for the antenna elements, whichconsists of M antennas with an interval of d between adjacent antennas. The array signalmodel is illustrated in Figure 3.2. Assume I signals exist in the referred space and for theith signal, there are Ki multipath components perceptible by the antenna array. Further,we assume that the signal sources are far field sources, which means the impinging signalsare plane waves.
The signal received by the mth antenna can be expressed as
xm(t) =I∑i=1
Ki∑k=1
sik(t−(m− 1)dsinθik
c) + nm(t) (3.4)
where sik(t) and θik are the wavefront of kth component of ith signal impinging on the ULAand its AoA respectively. nm(t) is additive measurement noise with zero mean value and nocyclostationary property.
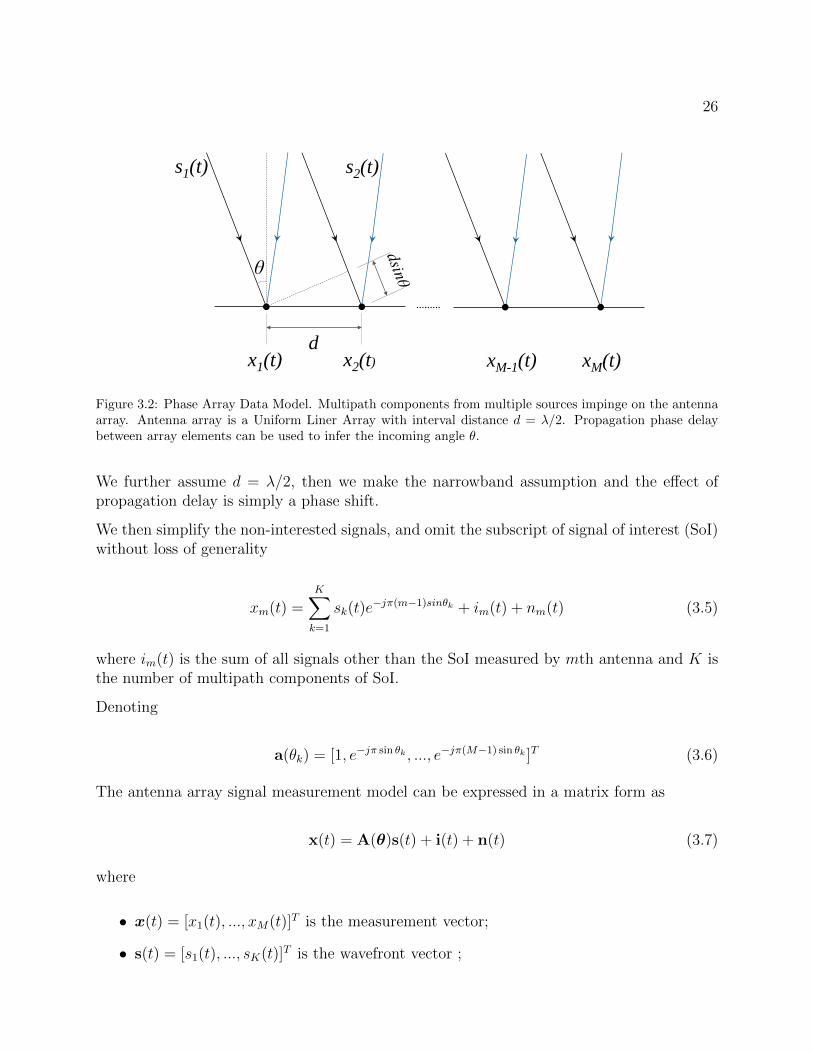
26
x1(t) x2(t)d
s1(t)
θ
xM-1(t) xM(t)
s2(t)
Figure 3.2: Phase Array Data Model. Multipath components from multiple sources impinge on the antennaarray. Antenna array is a Uniform Liner Array with interval distance d = λ/2. Propagation phase delaybetween array elements can be used to infer the incoming angle θ.
We further assume d = λ/2, then we make the narrowband assumption and the effect ofpropagation delay is simply a phase shift.
We then simplify the non-interested signals, and omit the subscript of signal of interest (SoI)without loss of generality
xm(t) =K∑k=1
sk(t)e−jπ(m−1)sinθk + im(t) + nm(t) (3.5)
where im(t) is the sum of all signals other than the SoI measured by mth antenna and K isthe number of multipath components of SoI.
Denoting
a(θk) = [1, e−jπ sin θk , ..., e−jπ(M−1) sin θk ]T (3.6)
The antenna array signal measurement model can be expressed in a matrix form as
x(t) = A(θ)s(t) + i(t) + n(t) (3.7)
where
• x(t) = [x1(t), ..., xM(t)]T is the measurement vector;
• s(t) = [s1(t), ..., sK(t)]T is the wavefront vector ;

27
• i(t) = [i1(t), ..., iM(t)]T is uninterested signals vector;
• n(t) = [n1(t), ..., nM(t)]T is the measurement noise vector;
• A(θ) = [a(θ1), ..., a(θK)].
Note that x(t), i(t),n(t), a(θk) ∈ CM , s(t) ∈ CK and A(θ) ∈ CM∗K and ()T denotes transpose.
As defined in Equation 3.6, a(θ) is the steering vector of the array, which is a function ofthe AoA of the incoming signals.
Conventional MUSIC algorithms
Conventional MUSIC algorithms [98] are based on decomposition of the autocorrelationmatrix of the input signal x(t) = A(θ)s(t) + n(t)
Rxx , E{xx∗} = ARssA∗ + σ2I (3.8)
where A is composed of the steering vectors of the antenna array, and σ2 is the varianceof noise n(t). Rss = E{ss∗} is the source autocorrelation matrix. If the signals s(t) aremodeled as stationary processes, and uncorrelated with the noise, then Rss is a Hermitianmatrix and ARssA
∗ is positive semidefinite whose rank is the number of the incoming signalsI. MUSIC requires that number of antenna M > I.
The autocorrelation matrix Rxx is then eigen-decomposed to getM eigenvalues. The smallestM − I eigenvalues are all equal to noise variance σ2. Using this property, the number ofincoming signals can be estimated.
Corresponding to the eigenvalues, theM eigenvectors span two subspaces: signal subspace Es
and noise subspace EN . The eigenvectors whose eigenvalues are σ2 span the noise subspace.For each ei ∈ EN , we have
Rxx(t)ei = ARssA∗ei + σ2ei
so
ARssA∗ei = 0
A∗ei = 0(3.9)
Equation 3.9 means that for every steering vector a(θk) ∈ A, a(θk) ⊥ ei. The set of a(θ) isnamed the array manifold as shown in Figure 3.3 [95]. For our azimuth-only AoA estimationproblem, the array manifold is a one-parameter “line” in the M -dimensional space spannedby the eigenvectors of Rxx(t).
As a(θk) ⊥ ei, the intersections of array manifold a(θ) and signal subspace Es are thesolutions of estimating θk. The spacial spectrum function is selected to use the inverts of

28
Figure 3.3: Illustration of the concept of array manifold and signal subspace. This three-sensor two-sourceexample illustrate the geometry of MUSIC [95].
the distance between a point moving along the array manifolds and Es, who will peak at thesignal AoAs
P (θ) =1
a∗(θ)ENE∗Na(θ)(3.10)
Cyclic MUSIC
Cyclic MUSIC [97] algorithms automatically classify signals based on their known spectralcorrelation properties and estimate only the desired signals’ directions of arrival. Cyclic MU-SIC algorithms perform singular value decomposition on the signals’ cyclic autocorrelationmatrix defined in Equation (3.1). Improved Cyclic MUSIC algorithms [26, 132] performsingular value decomposition (SVD) on composition of the cyclic autocorrelation matrix.
The incoming signals can be written as
x(t) =I∑i=1
si(t) + n(t),
where si(t) is the ith incoming signal, n(t) is the noise, and I is the number of incomingsignals.

29
In discrete domain, continuous signal x(t) is sampled and becomes a series x[n]. The values ofSCD should be estimated from the samples. There are several SCD estimation algorithms inthe literature. Considering the computation efficiency and result accuracy, we choose a time-smoothing algorithm here named Fast Fourier Transform (FFT) accumulation (FAM) [94]to calculate the bi-frequency SCD values.
The block diagram of FAM is shown in Figure 3.4 [94]. Let fs be the sample rate. Ts = 1/fsis the sample duration. In a time period of ∆t, N = ∆t/Ts data are sampled and input intothe algorithm. The bandpass filter is implemented using a tampering Hamming Windowwhose length is T . N ′ = T/Ts is the number of samples in the window, which is the sizeof the first FFT. In the frequency domain, ∆f = 1/T defines the frequency resolution. Thewindow slides all over N samples, with a hopping step of L samples. P = N/L is the numberof windows, which is the size of the second FFT. ∆α = 1/∆t defines the cyclic frequencyresolution.
x(nL+1:nL+N’)
n=0,…,P-1
N’ Point
Hamming WindowN’ Point FFT
x(nL+1:nL+N’)
n=0,…,P-1
N’ Point
Hamming WindowN’ Point FFT
X(nL, fl )
l=1,…,N’1
N’ Point FFT
X(nL, fl )l=1,…,N’
2
Sα (nL,fl l )N1 2
xy
l1,l2=1,2,…,N’
e-j2πlLn/N’
e-j2πlLn/N’
*
Figure 3.4: FAM Block Diagram. There are two FFT stages. Frequency resolution is ∆f = 1/T ; Cyclicfrequency resolution is ∆α = 1/∆t.
Then we have
Sαx(f) =I∑i=1
Sαsi(f) + Sαn(f). (3.11)
For signal i which has a particular cyclic frequency αi, the SCD in Equation (3.11) can besimplified to
Sαix (f) = Sαisi (f). (3.12)

30
This equation follows from the fact that at cyclic frequency αi, all other signals and noiseare uncorrelated with si. This is the signal selection property of cyclic frequencies, which weexploit to solve the SSDE problem.
3.4 WiFi Cyclostationary Analysis
WiFi standards (IEEE 802.11a/g/n) implement OFDM as the physical layer modulationmethod. OFDM is a modulation scheme that uses multiple carriers to transmit data. Forthe purpose of signaling, channel estimation, and synchronization, OFDM frame structureintroduces some features including pilots, Cyclic Prefix (CP), and preambles. In this section,we analyze the cyclostationary properties induced by these features.
3.4.1 OFDM Frame Structure
The basic frame structure of an 802.11a burst is shown in Figure 3.5. A frame contains apreamble field followed by a SIGNAL field and multiple data fields.
rS rS rS rS rS rS rS rS rS rS1 2 3 4 5 6 7 8 9 10
CPL r L r L1 2
CP SIGNAL CP Data 1 CP Data 2
SERVICE+DATA DATARATE
LENGTH
Channel and Fine Frequency
Offset Estimation
Coarse Freq.
Offset Estimation
Timing Synchronize
Signal Detect,
AGC, Diversity
Selection
0.8+3.2=4.0μs 0.8+3.2=4.0μs 0.8+3.2=4.0μs2×0.8+2×3.2=8.0μs2×0.8+2×3.2=8.0μs
8+8=16μs
Figure 3.5: IEEE 802.11 a/g OFDM frame structure [50]. The OFDM structure contains features thatgenerate cyclostationary properties: pilots, CP, and preambles.
The preamble contains a short training sequence and a long training sequence. The tenfoldrepetition of the short training sequence rS1 , ..., rS10 is used by the receiver to detect theframe, while the two long training sequence symbols are used by the receiver to performchannel response estimation.
The SIGNAL symbol contains the RATE and LENGTH fields. The RATE field transmitsthe data rate, which conveys information about the type of subcarrier modulation, and thecoding rate used in the rest of the packet.
The cyclic prefix acts as a buffer region or guard interval to protect the OFDM signals fromintersymbol interference (ISI). CP is inserted into the OFDM symbol by copying a portion ofthe higher index IFFT output samples and appending it to the front of the OFDM symbol.

31
3.4.2 Pilot-Induced Cyclostationarity
Pilots are a key component in the structure of OFDM signals, making it possible to performchannel estimation and frequency compensation. Figure 3.6 illustrates the subcarrier layoutof a 16 subcarrier OFDM structure [99]. Ten data subcarriers and two pilot subcarriers areadopted in this structure. Three guard subcarriers and a DC Null are also depicted. All thesubcarriers are indexed by the offset to DC Null. Data values are random complex numberswhile the pilots are fixed complex numbers. As the pilots are fixed and of higher power,they exhibit some peaks on their SCD surface over data and noise, where a cyclostationarypattern is formed.
0 1 2 3 4 5 6 7-1-2-3-4-5-6-7-8Subcarrier index:
Data Subcarriers Data SubcarriersDC Null
Frequency
Guard SubcarrierGuard Subcarriers
Pilot Subcarriers
Figure 3.6: OFDM Subcarriers. Ten data subcarriers and two pilot subcarriers are included. Three guardsubcarriers and a DC Null are also depicted. All the subcarriers are indexed.
The discrete-time baseband transmitted OFDM signal with pilots (but without CP1) can bemodeled as
x(m) =
√EsN
[xd(m) + xt(m)] (3.13)
where
xd(m) =∑k
N−1∑n=0n/∈I
ak(n)ej2πnN
(m−kN) · q(m− kN)
1The cyclostationary feature of CP in OFDM signals will be analyzed later.

32
and
xt(m) =∑k
N−1∑n∈I
bk(n)ej2πnN
(m−kN) · q(m− kN).
Es is the signal power and ak(n) is the transmitted data at the nth subcarrier of the kthOFDM symbol. I denotes the set of pilot subcarrier indices and bk(n) is the pilot symbols.q(m) is the pulse shaping filter. For WiFi, the pilot’s index subset I stays the same with allOFDM symbols and is determined by the implementation.
From Equation (3.3), it is easily derived that the SCD surface peaks when the frequency-shifted versions of the OFDM subcarrier layouts align at a pilot subcarrier. Take Figure3.6 as an example, when α = 0, SCD peaks at f = ±4B, where B is subcarrier frequencyspacing. For simplicity, we omit B afterward, and use the index numbers to indicate thefrequencies. Further, when α = ±8, SCD peaks at f = 0.
In general, suppose that OFDM signals have 2K pilots evenly and symmetrically distributedand the index distance between two adjacent pilots is 2p, then SCD peaks at
α = ±4kp, f = ±p,±3p, ...,±(2K − 1− 2k)p,α = ±(4k + 2)p, f = 0,±2p, ...,±(2K − 2− 2k)p,
(3.14)
where 0 < k < K.
Figure 3.7: WiFi SCD Surface by simulation. SCD surface is bi-frequency, with one dimension the frequencyand the other the cyclic frequency. The peaks are induced by pilots on the OFDM subcarriers. Samplingfrequency is 20MHz with 64 points FFT. The pilots index are {−21,−7, 7, 21} and pilot gain is set to 3db.

33
Figure 3.7 and Figure 3.8 illustrate the simulation results of the SCD of OFDM with noCP. The number of subcarriers is N = 64, with 48 data subcarriers, 4 pilot subcarriersand 12 null subcarriers. The sampling frequency is 20 MHz (with subcarrier spacing of 325kHz). The indices of subcarriers are set to {−21,−7, 7, 21}. We can see from Fig. 3.8 thatwhen f = 0, the peaks of the SCD surface appears at the cyclic frequencies α = ±4.375MHz, ±13.125 MHz. We note that in order to illustrate the SCD peaks, the power of pilotsubcarriers is given a 6 dB gain.
-1.3125 -0.4375 0.4375 1.3125
Figure 3.8: Cyclic frequencies when f = 0. The cyclic frequencies are α = ±4.375 MHz, ±13.125 MHz.
3.4.3 CP-Induced Cyclostationarity
In OFDM modulation, the data and pilot on the frequency subcarriers are converted totime-domain signals via IFFT operations. A CP is then inserted into the OFDM symbol bycopying a portion of the higher index IFFT output samples and appending it to the frontof the OFDM symbol. The purpose of the CP is to combat Inter-Symbol Interference (ISI)between neighboring OFDM symbols caused by transmission in a multipath channel.
IEEE 802.11 a/g OFDM frame structure is shown in Figure 3.5, which has 64-point IFFToperations and a CP of 16 points. For a 20 MHz sampling frequency, a standard OFDMsymbol with CP is 4µs in time duration.
The discrete-time baseband OFDM signal with CP can be modeled as

34
x(m) =
√EsN
∑k
N−1∑n=0
ak(n)ej2πnN
(m−D−k(N+D)) · q(m− k(N +D)), (3.15)
where D is the number of points of CP and ak(n) is an independent and identically dis-tributed (i.i.d) message symbol sequence. Notice that in this model we only consider CP-induced cyclostationarity, as pilot-induced cyclostationarity has been studied in the previoussubsection.
The spectral correlation can be derived as:
Sαx (f) =
EsN
∑N−1n=0 Q(f − n
N+ α/2)
·Q∗(f − nN− α/2) α = d
N+D
0 α 6= dN+D
(3.16)
where Q(f) =sin(πf
N)
πfis the Fourier transform of the square shaping pulse q(m).
From Equation (3.16) we can see that CP-induced peaks at the bi-frequency SCD surfaceappear at d
N+D, where d ∈ Z.
Figure 3.9 illustrates the simulation results of the SCD for OFDM with N = 64, D = N/4,and sampling frequency F = 20 MHz. We note that to illustrate CP-induced cyclostation-arity more clearly, the cyclic frequency resolution of the FAM algorithm is set to F/256 inthe simulation, so that the SCD peaks only at ±5l
4MHz, with l ∈ {1..13}.
3.4.4 Preamble-Induced Cyclostationarity
A WiFi physical protocol layer data unit (PPDU) begins with a preamble. As depictedin Figure 3.5, the preamble consists of two parts: the short and long preamble trainingsequences. The preamble in an OFDM signal is designed to provide the means to estimate thechannel, estimate frequency offset, and identify the beginning of the OFDM signal througha preamble correlation process.
Different OFDM implementations have distinct preamble patterns, which enables the receiverto detect the presence of a compliant signal. Although it seems to be a promising methodof signal identification by cyclostationary analysis, the random WiFi package transmissionpattern makes it impossible.
It is worth pointing out that the strategy of inserting specific subcarrier patterns into pream-bles to induce cyclostationarity does not work for our purpose. This is because in the SSDEproblem it is assumed that we have no control of the signal structure of the interferingsources.

35
Figure 3.9: CP-induced Cyclostationarity. SCD surface peaks at the cyclic frequencies ± 5l4 MHz, with
l ∈ {1..13}.
3.5 Performance Evaluation
In this section, we evaluate how these (pilot-induced and CP-induced) cyclic frequenciesperform when using them in Cyclic MUSIC algorithms to estimate the signal direction ofarrival. We evaluate their performance by conducting simulation in Matlab, the simulationparameters are listed in Table 3.1.
Table 3.1: Simulation Parameters
FFT size 64Sampling frequencey 20 MHzSubcarrier spacing 0.325 MHz# of data subcarriers 48# of pilot subcarriers 4Pilot subcarrier index -21, -7, 7, 21# of OFDM frames 10WiFi signal AoAs -60, -45, -30, -15Bluetooth Signal AoAs 15, 30, 45, 60# of array sensors 16Sensor space 0.5 wavelengthPilot gain 2.5 dB
We assume that there are two signal sources: one WiFi and one Bluetooth. The channel fromeach signal source to the anchoring node for detection consists of 4 multipath components.

36
An antenna array with 16 sensors (i.e., 16 antenna elements) in a Uniform Linear Array(ULA) are used to collect signals from the signal sources.
Two AoA estimation algorithms are employed for the purpose of comparison: Spatial smooth-ing MUSIC algorithm (SS-MUSIC) in [125] and Cyclic MUSIC with spatial smoothing in [97].Although SS-MUSIC is not able to distinguish different types of signals, SS-MUSIC efficientlyeliminates the correlation between multipath components of the same signal source.
MUSIC-based AoA estimation algorithms differentiate signals and noises according to theircorresponding singular values (or eigenvalues). Intuitively, Cyclic MUSIC algorithm willdecrease the singular values of undesired signals at proper cyclic frequencies, which makethem easier to differentiate. Simulation results in Figure 3.10 illustrate this effect, wheresingular values after the 5th point are decreased.
Figure 3.10: Cyclic MUSIC and Spatial Smoothing MUSIC. Cyclic MUSIC decreases the ratio of the largestundesired singular value and the smallest desired singular value.
Based on this consideration, we employ the ratio of the largest undesired singular value andthe smallest desired singular value as a metric to evaluate the performance of different cyclicfrequencies in the SSDE problem.
Figure 3.11 depicts the simulation results. The ratio values are the average of 50 runs. Fromthe figure we can see that the ratio values calculated by pilot-induced cyclic frequencies aresmaller than those by CP-induced cyclic frequencies, which indicates that at pilot-inducedcyclic frequencies, it is easier to distinguish desired signals from undesired signals. Supposethat the threshold value is set to 0.3, as depicted in Figure 3.11. We can see that pilot-
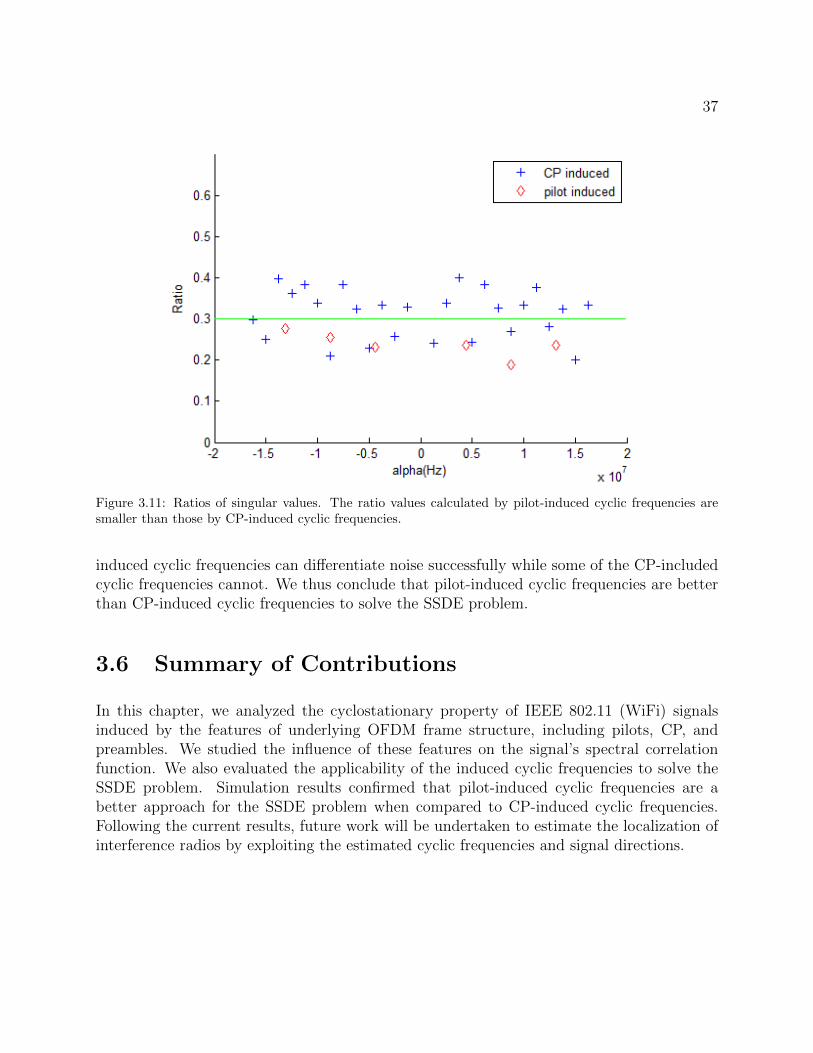
37
Figure 3.11: Ratios of singular values. The ratio values calculated by pilot-induced cyclic frequencies aresmaller than those by CP-induced cyclic frequencies.
induced cyclic frequencies can differentiate noise successfully while some of the CP-includedcyclic frequencies cannot. We thus conclude that pilot-induced cyclic frequencies are betterthan CP-induced cyclic frequencies to solve the SSDE problem.
3.6 Summary of Contributions
In this chapter, we analyzed the cyclostationary property of IEEE 802.11 (WiFi) signalsinduced by the features of underlying OFDM frame structure, including pilots, CP, andpreambles. We studied the influence of these features on the signal’s spectral correlationfunction. We also evaluated the applicability of the induced cyclic frequencies to solve theSSDE problem. Simulation results confirmed that pilot-induced cyclic frequencies are abetter approach for the SSDE problem when compared to CP-induced cyclic frequencies.Following the current results, future work will be undertaken to estimate the localization ofinterference radios by exploiting the estimated cyclic frequencies and signal directions.
Chapter 4
MobTrack: Locating IndoorInterfering Radios With A SingleDevice
In this chapter, the complete solution to the indoor interference localization problem ispresented. This chapter is based on the previous chapter and use its analytical results as thefundamental tools in the system design. We first introduce the related work and researchmethod. The four system work flow steps are then detailed one by one. We then presentsthe implementation details as well as the performance evaluation.
4.1 Motivation and Objects
As the coming of more wireless devices working on the unlicensed ISM band are produced,this portion of the radio spectrum is becoming more and more crowded, which inevitablyleads to interference between these devices. When interference happens, the wireless com-munication performance may be severely degraded. For example, we all have the experiencethat though we are close to the WiFi Access Point, our device still experience poor commu-nication performance. Besides WiFi, many other types of devices like Bluetooth speakers,baby monitors, cordless phones and microwave ovens also work on the same frequency band,which causes interference to our WiFi communications from time to time. The interferenceproblem becomes even more crucial especially in some circumstances like hospitals or busi-ness environments, where sudden poor wireless performance may lead to serious outcomes.
WiFi has become the predominant wireless communication solution in indoor environmentsnowadays. In this chapter, we consider the scenario of WiFi being interfered by one ormultiple unknown radios. When interference happens, a quick and accurate method to findand terminate the interfering radio will be helpful. However, in indoor environments, it is
38

39
not easy to locate the interfering signal.
There are many previous research work on the topic of wireless localization in the literature.However, none of them are applicable for the problem of locating indoor interfering radios.Traditional solutions to the wireless localization problem follows three research lines bymeasuring the values of Received Signal Strength Indication (RSSI), Time of Arrival (ToA)or Angle of Arrival (AoA). RSSI based solutions [17, 134] collect RSSI values and then usesignal propagation models to compute the distances. However, under the circumstance ofinterference, both interfering and working signals impinge on antennas at the same timeand the power is the sum of all incoming signals, which makes it infeasible to differentiateinterfering radios from working signals. ToA based ranging solutions [11, 68] require hightime resolution measurement and usually rely on dedicated hardware or leverage slowerwaveforms like acoustic signals. AoA based algorithms [95, 98] rely on antenna arrays todo angle estimation. However, traditional AoA based algorithms cannot address all thechallenges encountered by our problem.
Locating indoor interfering radios using AoA based methods has many specific challenges.First, as the nature of the interfering radios are unknown to us, nor can we expect cooper-ation from the interfering radios, a way to differentiate the interfering radios from workingsignals is needed. On the other hand, because of the multipath phenomenon, too manysignal components will impinge on the antenna array simultaneously, which significantlyincrease the demand for antenna numbers. The second challenge is to isolate the LoS com-ponents from Non-LoS (NLoS) components. Among all the multipath components, only theLoS component contributes to calculation of signal source position using AoA, so the LoScomponent must be isolated from all Non LoS components.
Recent research has made great advances to address these challenges. In Pinpoint [52], anmodified Access Point (AP) infrastructure is leveraged to compute LoS AoA. Their algo-rithms are based on cyclostationary signal analysis to identify the source of interference. Tomeet the challenge of multipath propagation, they isolate the LoS component by finding therelative delays between LoS and NLoS components and the relative delays between differentantennas at APs. However, as the difference of propagation distance between LoS com-ponent and the second arriving multipath component is only about several meters, whichcorresponds to tens of nanoseconds [108], it is hard to differentiate them without expensivededicated hardware with high sampling rate. Pinpoint uses a modified frontend that wasable to send and receive arbitrary waveforms in the entire 100MHz ISM band [49]. Anotherwork ArrayTrack [125] proposes algorithms to eliminate the effects of multipath by paringpeaks in AoA spectrum. Their multipath suppression algorithm could make 71% percent ofsuccess to find the LoS by moving the mobile device for five centimeters. However, in ourscenario, we have no control to the interfering radio and can not move the source arbitrarily,which makes the solution in ArrayTrack not feasible to our problem. These systems achievesub-meter location accuracy, but the problem is that their performance relies heavily on thenumber of cooperating APs. However, though the density of WiFi APs has increased largely,it is not necessary and infeasible to deploy 4 to 5 APs on the same channel in a single area

40
because of the distributed channel assignment algorithms by the IEEE standards [76].
θ1 θ2
Figure 4.1: System Model. WiFi communication between AP and client are working signals. The interferingradio source is a cordless phone which is the target we are trying to locate. MobTrack locates the interferingradio by compute the LoS AoA of the cordless phone at multiple positions on its moving trace.
In this chapter, we present MobTrack, a single device system that locates indoor interferingradios. The goal of designing MobTrack is to provide a lightweight, handheld system thatcan locate interfering radios with sub-meter accuracy with as less antennas as possible.MobTrack eliminates the dependence on the AP infrastructure. With small antenna array,the cost, complexity as well as size of this device will be also reduced.
MobTrack system model is shown in Figure. 4.1. A MobTrack device consists of an antennaarray, signal processing firmware and our novel algorithms to compute the LoS AoA andestimate the source location. The device is started when an interference is detected. Bymoving it around, our multipath suppression algorithm can isolate the LoS component fromall other impinging components. At the same time, the angles of the LoS component on themovement trace are collected to do triangulation.
Based on cyclostationary signal analysis on existing protocols, we design novel algorithms toclassify the signal types and find the cyclic frequencies. Different from PinPoint which createsa dummy signal as the test signature, we analyze cyclostationary signatures of different

41
signal types theoretically and store their cyclostationary signature in bi-frequency domainlocally. Thus we don’t need to store the dummy signals for every cyclic frequencies. Anotherdifference is that we adopt Cyclic-MUSIC algorithm [97] to calculate AoAs. In contrast,Pinpoint leverages a optimization method, whose target is a residual function of both signalcomponents delays and the angle of arrival. Our algorithms doesn’t work on time domainfor the purpose of efficiency and designing goal of a lightweight system without dedicatedwireless frontends.
To address the problem of multipath propagation, we design a novel algorithm that effectivelyfind the LoS components based on the stability difference of LoS and NLoS components. Thekey insight of our multipath suppression algorithm is that with the movement of MobTrackdevice, the values of LoS AoA tend to be continuous, while reflected paths AoA values aremore segmented. Using this property, MobTrack finds LoS AoA by selecting the longestcontinuous AoA line on the angle-movement plane explained in Section 4.3.3.
The main contributions of this work are summarized as follows:
• To the best of our knowledge, MobTrack is the first single device indoor interferencelocalization system without the requirement of multiple pre-deployed Access Points.
• We propose a novel algorithm to eliminate the multipath effect in the indoor environ-ment. Our multipath suppression algorithm could robustly and efficiently isolate theLoS component from other reflected components.
• We propose a novel signal type identification algorithm for MobTrack to calculate theAoAs of only interfering radios, which significantly reduces the requirement to antennanumbers and device complexity.
A prototype system of MobTrack is implemented on Ettus USRP platform with 6 antennasas the wireless frontend. The location performances are evaluated on a test bed at 16 pointsover one floor of our department building. Experimental results show that within a movementof 1 meter, MobTrack achieves a median 55cm location accuracy using data collected from5 points with an LoS isolation correction of 95%.
The rest of the chapter is organized as follows. The system design details are presented inSection 4.3. Implementation is stated in Section 4.4. Section 4.5 elaborates the simulationand experimental results. We discuss related work in Section 4.2 and conclude the chapterin Section 4.6.
4.2 Related Work
The previous research literature can be briefly categorized according to the physical mea-surements. Power(RSSI, CSI), time and angle are the physical measurements for indoor

42
localization with different accessibility and accuracy.
RSSI based solutions can be archived into two categories. One is the range based algorithms,which estimate the distances from multiple measurement points to the target using wirelesssignal propagation models and locate the target geometrically [134]. However, it can not dis-tinguish different signals. The other category is fingerprinting based [17] [130] [92] [101] butthey need extensive accurate environment calibration workload before system deployment.
ToA based ranging solutions require dedicated hardware with high sampling rate. Instead ofmeasuring signal propagation time directly, researchers usually turn to measuring frequencydifferences [11] or using slower signals like acoustic signals [68]. However, in order to distin-guish LoS signal and NLoS signals, ToA based ranging solutions must apply extremely highsampling rate because the propagation distance difference between LoS component and thesecond arriving multipath component is only about tens of nanoseconds [108].
AoA based estimation algorithms [95, 98] relies on antenna arrays. Signal samples collectedfrom the antennas are processed using eigenvalue decomposition based methods to estimatesignal AoAs. The challenge for AoA is the multipath phenomenon in our scenario. Multipathcomponents from the same source can be highly correlated, which makes eigenstructure basedAoA estimation algorithms inaccuracy or even infeasible to estimate the AoAs. Nevertheless,MobTrack follows the AoA based research line and solve the multipath challenge.
Recent techniques require no costly equipments and they can overcome the multipath chal-lenge, but they assume a high density of APs. For instance, EZ [29] utilizes over 100 APs,ArrayTrack [125] leverages several WiFi APs with 7 to 8 antennas and PinPoint [52] as-sumes 5 APs on a floor. Because of the popularity of WiFi, the density requirement seemsto be acceptable. Nevertheless, there exists some practical limitations. First of all, 4 to 5strong APs with known locations are necessary with multilateraion, which are not realistic inmost circumstances such enterprise or hospital network. Second, FCC permits 802.11 b/g/nstandard to employ 14 channels in the 2.4GHz frequency band, so it is difficult to find 4 to5 strong APs on the same channel even if they do exist. And this problem requires WiFiscanning technique, which is an energy hungry operation and can reduce the battery life ofmobile devices by over 2-3 time [14] even if the scanning operation is invoked once every10 seconds for continuous location tracking. Third, when the APs are operating scanning,regular data communication cannot happen, which impacts the user experience, especiallyfor real-time service like VoIP. In comparison, MobTrack only utilize a single device andthereby will not have the limitations above.
Research Roadmap
We analyze the related work and present the selection of our research roadmap as shownin Figure 4.2. The most intuitiveway to calculate distance is to measure the time-of-flight.However, the time-of-flight is very hard to measure because of the high speed of wirelesssignals. In indoor environments, it is typically several nanoseconds. We need high speedAnalog-Digital Converter (ADC) to get high resolution. So this path is not feasible. Raw

43
signal data from antenna arrays can be used to calculate the signal directions. The rawsignals are ready to use. But we need special hardware, the antenna array. With the helpof software defined radio (SDR), this solution looks very promising. Fingerprinting methodsare based on the measurement of received signal strength RSSI or channel state informationCSI. The RSSI is ready to use. However its very cumbersome to build and maintain thefingerprint database. So we also pass this roadmap. In summary, we choose the directionbased solution.
Data
Information
Knowledge
Wisdom
Location
Distance Direction Fingerprint
ToF Raw Signals RSSI CSI
Figure 4.2: The research roadmap. We select AoA based method with the help of promising software definedradio (SDR) technique.
4.3 System Design
We describe the system design of MobTrack following the data flow in system architecture asshown in Figure 4.3. We assume that the interfered communication is a WiFi link betweenan AP and a client. The interference to this communication from a nearby device is thesignal we want to locate. MobTrack is a movable device equipped with an antenna array.We choose the number of antennas to be 6, which will be explained in Section 4.4. Thisdevice is carried by an operator moving around in the interfered area to locate the interferingradio and get an increasing accuracy continuously by moving towards it.
As we have stated in the introduction, there are two major challenges to do indoor interfer-ence localization using a single device: to identify the interfering signal type and to isolate

44
x(1,…,N) Interference
Identification
x(1,…,N)
αCyclic MUSIC
P(θ) θ1,…,k
Multipath
Suppression
θ(1,…,S)
Triangulation(x,y)
Figure 4.3: MobTrack Architecture. Raw samples are phase aligned and then input into the interferencedetection process, where cyclic frequencies α are extracted. Spacial smoothed cyclic-music algorithm is ap-plied to estimate the AoAs of the multipath components of only the interfering radio. Multipath suppressionalgorithm is then applied to isolate the LoS component and identify its AoA. LoS AoAs at different pointsare used to locate the source by triangulation.
the LoS component. Our system design meets these challenges as well as achieve our goal ofa lightweight system. By identifying signal type and using Cyclic-MUSIC algorithm, we cansignificantly reduce the demand for the number of antennas. The system is designed to be asingle device, so that we are able to move it to get angles from different points and suppressmultipath effect at the same time. The challenges are addressed step by step. We follow thedata flow and make a brief introduction to each step first before diving into the details.
1. Identify the interfering radio type (Section 4.3.1): MobTrack takes the phase-aligned signal samples as input. It has to eliminate the influence of noise and signalsexcept the interfering radio first. The property it utilizes is the cyclostationarity prop-erty of the interfering radio. MobTrack correlates the received signal with pre-storedsignal signatures to determine the interfering signal type. Then it picks a cyclic fre-quency α which is unique to this interfering radio and pass it along with the receivedsamples to the next step.
2. Calculate the AoAs of only interfering radio (Section 4.3.2): Cyclic-Musicalgorithm takes advantage of the signal selection property of cyclic frequencies. If αselected is unique to the interfering radio, all impinging components from other signalsare filtered. Only AoAs from the interfering radio are left. Furthermore, multipathcomponents from the same signal source correlate with each other, which degradesthe performance of MUSIC algorithm. To handle this problem, a spacial smoothingmethod is adopted. In this step, we address the fist challenge. The output of this stepis the AoAs of impinging components from the interfering radio only.
3. Isolate the LoS AoA among multiple NLoS AoAs (Section 4.3.3): At thisstep, MobTrack can finally address the second challenge. It leverages a novel algorithm

45
called LongestCurveFitting to separate LoS signals from NLoS signals and thus findthe LoS AoA of interfering radio. The output of this step is LoS AoAs at multiplepoints on the device moving trace.
4. Triangulation to find the interfering radio (Section 4.3.4): The above stepshelp MobTrack figure out the relative angle between itself and the targeted interferingradio. It can now tell us the direction of the interfering radio. By triangulation, weuse least square method to est*mate its location. Thereby we can follow its lead tofind the target and turn it off.
4.3.1 Interference Identification
WiFi signals are packet based. As we assume that we don’t know the nature of the interferingradio, it may be constant or intermittent. Once the samples of a packet are received fromthe antenna array, we test whether it is interfered using our interference identification algo-rithm described below. If no interfering radio is detected, the samples are dropped off andMobTrack waits for the next packet. Otherwise, it is analyzed to find its signal type. In thissection, we introduce signal cyclostationary properties first, and then we elaborate our in-terference identification algorithm. The purpose of identifying the interfering radio is to findits cyclic frequencies which are used as input in Cyclic-MUSIC algorithm in Section 4.3.2.
Cyclostationary Property
Different types of signals exhibit different cyclic signatures, on which we can rely to detectinterference or even determine the interference source type. We first review the conceptof signal cyclostationary properties and then elaborate on the algorithms to find the cyclicfrequency α.
A signal can be modeled as cyclostationary if its cyclic autocorrelation function (CAF) isnonzero for a nonzero cyclic frequency. The definition of Cyclic Autocorrelation Function(CAF) can be found in Equation(3.1).
Instead of CAF, its Fourier transform is more often used in cyclostationary signal analysisbecause of computation efficiency [40], which is called the spectral correlation density function(SCD). SCD is defined by
Sαx(f) =
∫ ∞−∞
Rαx(τ)e−j2πfτdτ (4.1)
In discrete domain, continuous signal x(t) is sampled to be a series x[n]. The values of SCDshould be estimated from the samples using algorithms like Fast Fourier Transform (FFT)Accumulation (FAM) [94].
46
The simulated WiFi SCD surface is plotted in Figure 3.7. SCD surface is bi-frequency, withone dimension the frequency and the other the cyclic frequency. The peaks are induced bypilots on the OFDM subcarriers. Sampling frequency is 20MHz with 64 points FFT. Thepilots index are -21,-7,7,21 and pilot gain is 3db. As shown in previous chapter, WiFi signalsexhibit cyclostationary properties because of the OFDM structure like pilots and cyclicprefixes. Similarly, other protocols also exhibit similar cyclostationary properties. Withdifferent physical layer implementations, these protocols has their unique cyclic frequencies,on which we rely to differentiate them.
Interference Identification
We make a reasonable assumption here that the WiFi signal modulation parameters areknown, including the number of subcarriers and the positions of the pilot subcarriers. Theseparameters define the value of cyclic frequencies.
MobTrack utilizes peak patterns on the SCD surface to differentiate signal types. By doingcyclostationary analysis on the signal universe (including WiFi, Bluetooth, ZigBee, DECTcordless phone, etc), we calculate their possible SCD peak patterns and store the ”ideal”SCD surfaces locally. An ”ideal” SCD surface take values of only 1 or 0. If there is a peakat a coordinate (α, f), its value is 1. Otherwise, it’s 0.
Once the interfered samples are received and the corresponding SCD surface is calculated,We calculate the correlations of the SCD with each stored ”ideal” SCD surface. We definea threshold CTH . If a correlation is found over CTH , then we say that the interfering radioof this type exists.
The interference identification algorithm is summarized in Algorithm 1.
Algorithm 1 Interference identification algorithm
1: Analyze signal universe, store “ideal” surfaces SN2: Calculate the sample surface Sc3: for each “ideal” surface Si ∈ SN do4: Calculate the correlation Cic of Si and Sc5: if Cic > CTH then6: Set Si as the interfering radio type7: end if8: end for
This algorithm may return two or more signal types. In this situation, we assume more thanone interference exists. We can find unique cyclic frequencies for them separately and allthese interfering signals can be located. However, in this work, we focus on the scenariowhere there’s only one interference.

47
What should be noted is that unlike previous work on signal classification using cyclosta-tionary approaches [56] [49], we don’t use machine learning methods. Instead of trainingthe algorithm when interference happens, we analyze the signal universe and store theirsignatures.
4.3.2 AoA Spectrum Computation
Once the interfering radio is identified, we select a cyclic frequency that is unique to theinterfering radio, and use Cyclic-MUSIC algorithm to calculate the AoA spectrum. Signalcomponents impinging on the antenna array from different directions with different power.AoA spectrum is the incoming signal’s power as a function of angle of arrival. We locatethe peaks on the AoA spectrum and say that there is a signal component at this direction.However, the directions may or may not be the actual direction of the source because ofmultipath propagation. Nor the highest peak means that it is the direct path because thedirect path signal may be blocked. The concept of phase array model, the MUSIC algorithmand Cyclic-MUSIC algorithm have been introduced in Section 3.3.2.
Spacial Smoothing to Eliminate Correlation
1 2 m m+1 m+2 M-1 M
Q
Q
Q
Q
P
Figure 4.4: Subarray Spacial Smoothing Totally M antennas in P groups with Q antennas in each group.M = P +Q− 1.
By selecting cyclic frequency α, we have eliminated the influence of noise and other signals.But in our application scenarios, there is another challenge. Multipath components fromthe same interference source are apparently correlated. If the multipath components are

48
fully correlated, the rank of Rαxx will be 1. This will degrade the performance of eigen-
decomposition based algorithms or even make them infeasible. In order to increase therank of CAF so that we can estimate all the multipath components, we adopts the spacialsmoothing algorithm [102] to eliminate the correlation between multipath components.
An illustration of spacial smoothing is shown in Figure 4.4. We group the antennas in thearray into P groups with Q antennas in each group. For group p, the cyclic correlationmatrix Rp is calculated as in Equation 3.9.
The spatially smoothed cyclic correlation matrix is defined by
R =1
P
P∑p=1
Rp (4.2)
It is proved that as long as the number of antenna groups is more than the number ofmultipath components, namely P > K, the spatially smoothed cyclic correlation matrixR ranks K [102]. Thus, we can use MUSIC algorithm to calculate the AoAs of multipathcomponents of the SoI by eigen-decomposition of R. Figure 4.5 compares the eigenvaluesbefore and after spacial smoothing. There are two independent signal sources with fourmultipath components respectively in this example. Spacial smoothing successfully increasesthe detectable eigenvalues from six to eight.
Cyclic MUSIC Algorithm
The difference between cyclic MUSIC algorithm and conventional MUSIC algorithm [97] isthat instead of the autocorrelation matrix, the decomposition of the cyclic autocorrelationmatrix is leveraged here. Assuming that all signals are not fully correlated, we can thenchoose a cyclic frequency α, at which the K of them exhibit spectral correlation. Becauseof the frequency selection property of cyclic frequency α, the cyclic autocorrelation matrixof i(t) and n(t) are all zeros, and the cyclic cross-correlation between s(t) and i(t) and n(t)are also zeros. So we get
Rαxx = ARα
ssA∗ (4.3)
whose rank is K and K < M .
The rest of the cyclic MUSIC algorithm is the same as conventional MUSIC algorithm.It is worth noting that different from autocorrelation matrix, the CAF matrix Rα
xx is not aHermitian matrix. So the eigendecomposition method is not applicable here and the singularvalue decomposition (SVD) method must be applied.
Because of the signal selection property we stated above, Cyclic-MUSIC does not requirehigher number of antennas than the number of multipath components. Taking the unique

49
Figure 4.5: The eigenvalues before and after Spacial Smoothing. Spacial smoothing successfully increasesthe detectable eigenvalues from six to eight.
cyclic frequency of interfering radio as input, it successfully output the AoAs of only theinterfering radio. Taking advantage of this property, we only need a number of antennas toseparate the multipath components from only one signal source. In indoor environments,there are usually 5 multipath components that can be detected. As MobTrack is movable,the blocking effect of LoS is eliminated when moving around. So we equip MobTrack with6 antennas as we can always find places where LoS component is in the strongest three.
4.3.3 Multipath Suppression
Now we get the directions of all the components of the interfering radio including bothLoS and NLoS components. The next step is to isolate the LOS component in order tofind the target interference. The algorithm we employ to achieve multipath suppression ismotivated by the observation that LoS components and NLoS components have differentstabilities with the movement of the device. As illustrated in Figure 4.6, the LoS componentis continuous compared to discrete NLoS components when we move MobTrack and recordthe angle data. This is because if the location of MobTrack change successively, the anglebetween the target interference and MobTrack will change consecutively. But this is not truefor multipath components, which bounce on walls or object surface which is inconsecutivelythemselves. Based on this observation, we develop an algorithm which can find the longest

50
continuous path in the angle-movement plane, which is the LoS component.
An
gle
s
Movements
LoS component
Three multipath
components here
Segmented multipath
components
Figure 4.6: Multipath Suppression. We record the peaks and plot it as a dot in this figure. With themovement of MobTrack device, the LoS AoA changes continuously, but NLoS components will disappearintermittently. By finding the longest line, we can isolate the LoS component.
The multipath suppression algorithm is summarized in Algorithm 2. We name this algorithmLongestCurveFitting. It takes the AoA spectrum as the inputs, finds the peaks and recordstheir coordinates. It then uses the Curve Fitting algorithm to test which curve line the peakdots belong to. If a curve line is segmented, it is removed from the candidate set. If there isonly one curve line left in the candidate set, we terminate the function and set it as the LoScomponent.
An experimental result will be presented in Section 4.5. Using the above algorithm, we areable to find the LoS AoAs within a movement distance less than half a meter.
As long as we find the LoS AoAs from several points, we can estimate the source locationusing triangulation methods.
4.3.4 Triangulation
As MobTrack is a moveable or handheld device, we can simply find the interference byfollowing the direction which MobTrack is pointing to. We run MobTrack continuously

51
Algorithm 2 LongestCurveFitting
1: Set the LoS candidate set S to be Φ2: while The LoS components is not found do3: Find the peaks on current AoA Spectrum4: For every peak do CurveFitting5: Find the current longest curve C6: if Length of C > LTH then7: C is the line corresponding to LoS AoAs8: end if9: end while
at different locations on the movement trace and then we adopt triangulation to estimatethe location of interference with AoAs displayed. As shown in Figure 4.7, we observe thatthe directions which MobTrack points to will not intersect at a single point because of theestimation and measurement errors. Thus, we apply the well-known least square algorithmin linear algebra to calculate a single estimation point. When employing the least squaremethod, the known variables are the 2D locations of the MobTrack and the θs in the figurewhile the unknown variables are the 2D location of the estimation point. The matrix A andvector b in Ax = b are formed by the 2D locations of the MobTrack and the θs. Becausethe directions which MobTrack points to can not form a single point, so Ax = b will have nosolution. Then we project vector b onto the column space of matrix A to get the projectionvector p. By solving Ax = p, we get the single estimation point we desire.
4.4 Implementation
We implement the MobTrack prototype on Ettus USRP software defined radio platform, asshown in Figure 4.8. The system consists of 6 USRP-N200 software defined radio platform.Four of the USRP devices are equipped with a daughterboard XCVR2450, and two of themare equipped with a daughterboard SBX, which provides the support of 2.4GHz WIFI chan-nel. The distances between antennas are set to be 6.13cm, which is half the wavelength of2.4G signal.
Figure 4.9 explains the connections between the devices of our prototype. Every two ofthe six USRPs are connected using a MIMO cable, which provide communication as wellas synchronization between them. The master USRP in each group is connected to thehost computer via a Gigabyte Ethernet switch. Another USRP N200 works as a phasereference tone provider. The transmit antenna of this USRP is cable connected to the sixreceivers using an SMA (SubMiniature version A) splitter. The cables have the same length,which provide the receivers a stable reference tone. The master USRP in each group aswell as the reference transmitter are all connected to an external clock, which provides a

52
Estimated
location
Actual
location
X axis
Y a
xis
1
2
3
4
Figure 4.7: MobTrack Triangulation. We apply the well-known least square algorithm in linear algebra tocalculate a single estimation point. When employing the least square method, the known variables are the2D locations of the MobTrack and the θs in the figure while the unknown variables are the 2D location ofthe estimation point.
Antenna
Phase tone
EthernetMIMO cable
Clock in
PPS in
Figure 4.8: Prototype implementation. The MobTrack prototype is composed of six USRP radios mountedon a movable case, which form an antenna array. Another USRP works as the phase alignment reference,and one more works as the interferer(not shown in picture).
synchronized 10MHZ reference clock and the PPS signal for the purpose of frequency andtime synchronization.
The phase reference tone and signals received over the air are sampled to GNURadio. Twoband pass filters are used to split them into separate data streams. The data streams are

53
USRPUSRPUSRPUSRPRx
USRPTx
ExternalClock
GigabyteEthernetSwitch
PPS IN
REF IN
CalibrationSignal Network Cable
HostComputer
Network Cable
Figure 4.9: MobTrack prototype connections.Every two of the six USRPs are connected using a MIMO cable.The master USRP in each group are connected to the host computer via a Gigabyte Ethernet switch. Allmaster USRPs are connected to an external clock for time and frequency synchronization. A phase referencetone is provided by another USRP.
then transmitted to a Matlab script via a named pipe. The phase differences are calculatedfrom the phase reference tone and compensated to data streams over the air. And then startour interference identification process.
4.4.1 Time and Frequency Synchronization
Every two USRP N200s are a group and are synchronized with the USRP MIMO cable.The master USRP in each group as well as the reference transmitter are all connected to anexternal clock, which provides a synchronized 10MHZ reference clock and the PPS signal forthe purpose of frequency and time synchronization.
We use a Ettus OCTOCLOCK-G 8-Channel clock distribution module with integrated GPSdisciplined oscillator (GPSDO) [4] as the clock and PPS source. The Ref In ports of themaster USRPs are connected to the 10 MHz reference from which the ADC/DAC clocks andlocal oscillator are derived. The PPS In ports can be used as a standard pulse per secondport or as a general purpose digital trigger input line.
4.4.2 Phase Synchronization
Beamforming and direction finding applications place additional requirements on the antennaarray and sampling system. In addition to time and sample clock alignment, the system mustmaintain a known phase relationship between each RF input. Due to phase ambiguitiescaused by phased- locked loops which are used for up and down-conversion, some calibrationmay be required to determine this phase relationship [9].
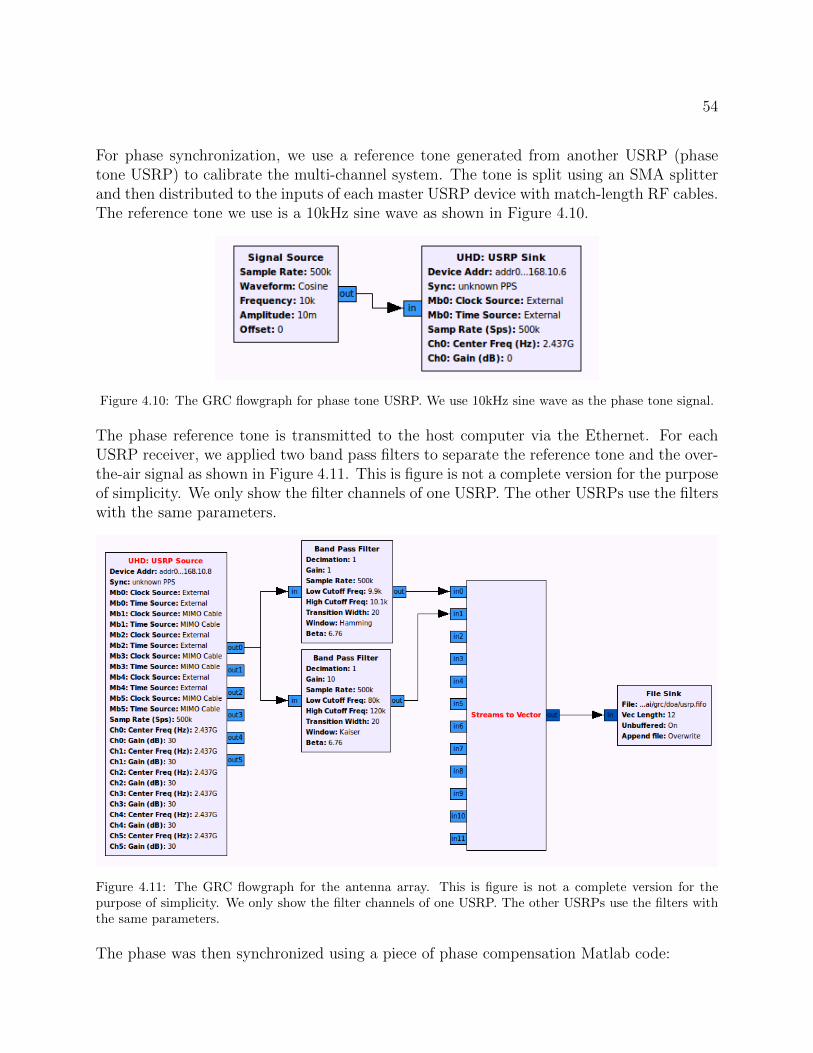
54
For phase synchronization, we use a reference tone generated from another USRP (phasetone USRP) to calibrate the multi-channel system. The tone is split using an SMA splitterand then distributed to the inputs of each master USRP device with match-length RF cables.The reference tone we use is a 10kHz sine wave as shown in Figure 4.10.
Figure 4.10: The GRC flowgraph for phase tone USRP. We use 10kHz sine wave as the phase tone signal.
The phase reference tone is transmitted to the host computer via the Ethernet. For eachUSRP receiver, we applied two band pass filters to separate the reference tone and the over-the-air signal as shown in Figure 4.11. This is figure is not a complete version for the purposeof simplicity. We only show the filter channels of one USRP. The other USRPs use the filterswith the same parameters.
Figure 4.11: The GRC flowgraph for the antenna array. This is figure is not a complete version for thepurpose of simplicity. We only show the filter channels of one USRP. The other USRPs use the filters withthe same parameters.
The phase was then synchronized using a piece of phase compensation Matlab code:

55
air(:, n) = air(:, n). ∗ exp(−1i ∗ angle(direct(:, n)));
where air is the split over-the-air signals, direct is the split reference tone signals, and n isthe index of USRP devices.
4.5 Performance Evaluation
To illustrate the performance of MobTrack in real indoor environments, we present exper-iment results in this section. We first describe the test bed setup methodology. The wepresent an experimental results of LoS signal stability. After that, we present the locationaccuracy MobTrack can achieve, comparing with the results of Pinpoint. We also explore theeffects of number point we use to do triangulation on the movement trace on the performanceof MobTrack.
4.5.1 Test Bed Setup
The location performances are evaluated on a test bed over one floor of our departmentbuilding, as shown in Figure 4.12. The interfering radio is placed at the blue point in Room314, which is in the same room as the WiFi AP. Our device follows the trace in the figureon the same floor. Most of the test points are in the hall and some of them are in the labmentioned above. The distance of the whole trace are 20 meters. Along this trace, we takea measurement every 25 centimeters. The ground truth are measured before the experimentwith an accuracy of 1cm.
4.5.2 LoS Signal Stability
To illustrate the difference of stabilities between LoS component and NLoS components, weset up an experiment in our office room. The transmitter works at frequency 2.437GHz(Channel 6) and locates in the same room as the MobTrack device. The distance betweenthe transmitter and MobTrack is 172cm. We move MobTrack along the parallel directionof the antenna array and the transmitter. In a distance of 1 meter, we record the anglesof arrive estimated by MobTrack, including both LoS and NLoS components. The resultsare shown in Figure 4.13. The distance between each location is 2.5cm. As we can see fromthis figure. The LOS component AoA changes from 0 degree to about -26 degree followinga continuous curve. Our curve fitting algorithm finds this line as the longest successfully.
On the other hand, NLoS components change intermittently. We list the percentage ofsegmented curves in this Figure 4.13 using LongestCurveFitting algorithm. From Table 4.1,we can see that most of the distance of multipath components is about 15cm, which meansthat by moving MobTrack for 15cm, the multipath components almost always change their

56
312 310 308 306 304
314
316
318 320 322 324 326
317 323 325
311
313
309 307 303 301
302
Figure 4.12: Test bed. This figure is a part of the floor our lab sits on. The dotted line in this figure is thetrace of executed experiments. The blue point in the lab is the interfering radio we would like to locate.Following the trace, we conduct a test per 25 centimeters.
impinging direction. This experiment verifies that our multipath suppression algorithm isfeasible.
Table 4.1: Percentage of segmented multipath curves
Distance 5cm 10cm 15cmPercentage of Segmented 30% 75% 95%
4.5.3 Localization Accuracy with Different Calculation Points
This section presents the localization accuracy changes with different calculation points. InFigure 4.14, we estimate the location of interfering radio by the information provided byMobTrack at different locations. We employ respectively 2, 3, 4 and 5 different locationsin the triangulation step in our estimation. We can see that the more locations we selectto do the calculation, the more accurate results we can achieve. The distances betweentwo locations range from 10cm to 1 meter. We prefer to use longer distance because thelonger distance between the points, the better performance it will achieve. Estimating in5 locations, MobTrack achieves a median localization error of 0.55 meter. Comparing withPinpoint locating the interfering radio using 5 static APs with accuracy of 0.97 meter, our

57
Figure 4.13: The stability of LoS and NLoS components. The distance between the transmitter and Mob-Track is 172cm. The distance between each location is 2.5cm.
scheme performs better. The reason for this better performance is that, MobTrack startsestimating the location from the second point and leads moving towards the target. It willperform the estimation repeatedly. At the 5th point, MobTrack has moved 4 meters at mosttowards the interfering radio. Besides, MobTrack’s antenna array contains 6 antennas, whilePinpoint has 4 antennas.
4.5.4 Localization Accuracy with Different Moving Distances
As shown in Figure 4.15, we also test if we can achieve a valuable estimation within a shortdistance. We calculate the location from 5 locations within different distances. And theresults shows we can achieve an accurate estimation even if we only move around a meter.If we want to make an estimation in half a meter, the accuracy drops, but still it can tell thelocation with a median location error of 2 meters. This is vital for us, because MobTrack isa single device designed for users to carry with them, with the ability to find the interferencein a meter, MobTrack is proved practical.

58
Figure 4.14: Localization Accuracy with Different Calculation Points. The median error is 0.55m estimatingfrom 5 locations.
4.6 Summary of Contributions
MobTrack is a single device system that can locate indoor interfering radios with sub-meteraccuracy. Comparing to previous solutions, it significantly reduces the requirement to APinfrastructure and the number of antennas. By moving the device around for a short distancewithin several meters, it depresses multipath effects and determines the LoS component.Simultaneously, the AoAs at these locations are recorded to estimate the location of theinterfering radio by triangulation methods. In order to decrease the physical size of thisdevice and make it suitable for handhold, the method of synthetic array can be exploredwhere the number of antennas can be further reduced to two.

59
Figure 4.15: Localization Accuracy with Different Moving Distances. The longer distance between thecalculation points, the more accurate MobTrack achieve.

Chapter 5
Context-Free Fine-Grained MotionSensing using WiFi
In this chapter, we introduce the research work on WiFi based fine-grained motion sensing.This is the second research area that we explore under the topic of wireless sensing. Unlikeinterference localization, in wireless motion sensing, the wireless signal transmitter and re-ceiver are both parts of the system. We take advantages of the signal reflection to sense themotion of human body. We first briefly talk about the concept of CSI and the preliminaryof CSI-based motion sensing. The six steps of the system work flow are then presented indetail, among which we concentrate on interference elimination and feature extraction. Weimplement and evaluate the system design using the lip reading application.
5.1 Motivation and Objects
WiFi-based motion sensing has received a lot of research attention in recent years, lever-aging the fact that human motion will change the channel states between transceivers. Bymonitoring these channel state changes, researchers are able to extract useful informationto infer human motion. Channel State Information(CSI) is one of the most popular mea-surements for the purpose of motion sensing because it provides more fine-grained channelinformation than Received Signal Strength Index(RSSI). CSI is the time series of the channelfrequency responses(CFR) which can be collected from physical layer of off-the-shelf WiFidevices thanks to the previously released CSI collecting tools [48,124].
Previous work on human motion sensing has made grate effort focusing on several ap-plication scenarios like human localization [122, 129], activity detection and recognition[117, 119], human authentication [116, 133], health care [69, 114] and fine-grained motionsensing [13,67,110,113,142]. Using a quadrant classification method, we position these pre-vious research works and the proposed work in this chapter in Figure 5.1. The four quadrants
60

61
are determined by whether the motion to be detected is coarse-grained or fine-grained, andby whether the detection is context-free or not. For example, E-eyes [119] can recognizehuman activities by comparing the testing CSI measurements to a set of CSI profiles. TheCSI profiles constructed in time domain are not the same in different contexts such as atdifferent locations. E-eyes needs to set up a profile group for a single human activity. Weclassify E-eyes into quadrant III as a coarse-grained context-related solution. On the otherhand, CARM [117], WifiU [116] extract features from CSI spectrograms in time-frequencydomain. CSI spectrogram is proved to be intrinsically correlated to the moving speed ofdifferent human body parts but not correlated to contexts. We classify them into quadrantII as coarse-grained context-free solutions. The work proposed by Liu et al. [69] makes useof channel information in both time and frequency domain to capture human breathing rateand heart rate. These scalar values of vital signs are estimated in frequency domain and areuncorrelated to contexts. Thus we also classify it into quadrant II.
Fine-GrainedCoarse-Grained
Context-Related
Context-Free
Proposed: WiTalk
CARM[11]
WiKey[17]
WindTalker[19]
WiHear[23]
Liu2015[16]
WiFinger[18]E-eyes[12]
WifiU[13]
Figure 5.1: Research Position. The interpretation of the four quadrants classification method. We classifythe works in the literature according to whether they are fine-grained or course-grained, and whether theyare resilient to context change.
In the right half plane of Figure 5.1, existing fine-grained motion sensing solutions constructthe CSI profiles in time domain. Time domain CSI profiles are subject to changes of contexts,including changes of locations, users or multipath environments. For example, WiKey [13]recognizes keystrokes based on CSI-waveform for each key. WindTalker [67] inferencesmobile device keystrokes exploiting the strong correlation between the CSI fluctuation andthe keystrokes. WiFinger [110] senses and identifies subtle movements of finger gestures byexamining the unique patterns in CSI. WiHear [113] detects and analyzes fine-grained radioreflections from mouth movements by introducing Mouth Motion Profile. These solutions

62
are all context-related. They require the construction and testing of the CSI profiles in thesame contexts. For a different user, different location, or a different multipath environment,the profiles need to be reconstructed. We classify them into quadrant IV as fine-grainedcontext-related solutions.
The piece of work follows the bottom-up research method. Three type of information thatcan be analyzed from CSI streams are identified, the waveform, the frequency and the time-frequency spectrogram. Using these information and mainly the machine learning tools,previous work implemented the various applications as shown in Figure 5.2. WiTalk followsthe solution roadmap from CSI to spectrogram to fine-grained motion detection.
Data
Information
Knowledge
Wisdom
Location
Waveform Frequency Spectrogram
CSI
Activity
Vital SignLip Motion Gesture
Figure 5.2: The research roadmap. WiTalk follows the solution roadmap from CSI to spectrogram to fine-grained motion detection.
To design a context-free fine-grained motion sensing solution in quadrant I, some specificchallenges that differ from previous research settings must be addressed. First, WiFi signalreflections from fine-grained human motion are very tiny, much smaller than those fromlarge-scale human movements. CSI dynamics caused by fine-grained human motion are easilyburied in noise and interferences. To ensure the CSI dynamics to be detectable, previoussolutions make some assumptions or use special tools. For example WiKey [13] assumesthat the tested motion takes place near one end of the transceivers. WiFinger [110] assumesthat the tested motion takes place near the line of sight(LOS) between the transceivers.WiHear [113] and WindTalker [67] use special purpose directional antennas to enhance signal-to-noise ratio(SNR) in CSi dynamics. Second, effective denoise methods must be adopted toreduce noises and interferences and obtain a clean CSI waveform that reflects the motion to bedetected. Third, to design a context-free solution, intrinsic properties in CSI dynamics that

63
are only correlated to fine-grained motion to be detected must be identified. To effectivelydetect the fine-grained motion, feasible features must also be carefully identified and selected.
In this chapter, we present WiTalk, the first context-free fine-grained motion sensing systemusing WiFi physical layer channel information. Similar to previous CSI-based motion sensingsolutions, WiTalk infers human motion by analyzing the CSI dynamics. To effectively denoiseCSI streams, we use principal component analysis(PCA) filtering methods based on theobservation that signal fluctuations on all subcarriers are correlated. To address the context-free challenge, we identify CSI spectrogram in time-frequency domain as the stable propertyin CSI dynamics and extract features from CSI spectrograms by calculating the contours ofthe spectrograms.
We verify the feasibility and performance of WiTalk in the application scenario of lip reading.To ensure that the CSI dynamics generated by mouth movements are detectable, we makesimilar assumptions as in previous solutions. Specifically, we assume that mouth movementstake place near one end of the transceivers similar to [13], based on the observation thatpeople tend to hold the phone close to the cheek while talking over the phone. Directionalantennas can also be used to further amplify CSI dynamics and eliminate CSI noises. Weleave this as future research work.
The main contributions of WiTalk are summarized as follows:
• To the best of our knowledge, WiTalk is the first feasible system in the context-freefine-grained quadrant of motion sensing solution plane using WiFi CSI dynamics. Weshow the existence of this quadrant I solution by identifying the CSI spectrograms asthe intrinsic stable properties that correlate to fine-grained human motion.
• We identify and extract effective features from CSI spectrograms by calculating thecontours of CSI spectrograms. These new discerning features solve the problem of lowtime-frequency resolution using discrete wavelet transform(DWT).
• We verify the feasibility of WiTalk by applying it to the lip reading scenario. Exper-iment results show that WiTalk achieves comparable results to previous fine-grainedcontext-related solutions.
We implement WiTalk on a commercial laptop and demonstrate its feasibility through ex-periments. The performance is evaluated under various contexts with different transceiversdistances, different locations and users. The results show that WiTalk can achieve over92.3% recognition accuracy to discern a set of 12 syllables and 74.3% accuracy to discern aset of short sentences up to six words.
The rest of the chapter is organized as follows. We discuss related work in Section 5.2and introduce the technical background in Section 5.3. The system design is detailed inSection 5.4. The performance of WiTalk is verified in Section 5.5 under the lip readingscenario. We conclude the chapter in Section 5.6.

64
5.2 Related work
Motion sensing. Motion sensing based human localization, human tracking, gesture andactivity recognition have been studied a lot in the research community. Existing work onmotion sensing can be divided in three categories: vision-based, sensor-based and RF-based.
The most popular approaches for video gaming and virtual reality platforms are vision-based.Such systems include Microsoft Xbox Kinect [2], Leap Motion [3], and Sony PlayStationCamera [5]. They use color and infrared cameras to do body-depth perception, motiontracking and gesture recognition. The main problem of vision-based motion sensing is thatits performance is highly influenced by the condition of lighting. These systems also requireline-of-sight (LOS) for proper operation.
Wearable device based methods like RF-IDraw [115] traces trajectory of fingers and handsby attaching RFID to the fingers. Xu et. [126] uses smartwatch to identify 37 gestures withan accuracy of 98%. TypingRing [83] asks the users to wear a ring for text inputting withthe capability of detecting and sending key events in real-time with an average accuracy of98.67%.
Earlier work on RF-based motion sensing rely on specialized hardware. WiTrack [11] tracks3D human body motion using an FMCW(Frequency Modulated Carrier Wave) radar at thegranularity of 10cm. WiSee [89] works by looking at the minute Doppler shifts and multi-path distortions for gesture recognition. Google Project Soli [6] uses on-chip 60GHz radar todetect fine-grained motion. However, the short effective range limit its application in longdistance scenarios.
CSI-based method like CARM [117] builds a CSI-speed model and a CSI-activity model,which depicts the relationship between CSI value dynamics and human body parts move-ment speeds, and the relationship between the body movement speeds and specific humanactivities. CARM is coarse-grained as it discerns human activities like walking, falling andsitting down. Different from CARM, WiTalk is fine-grained and reads the motion of humanmouth. CARM also requires a sampling rate as high as 2500 samples per second. It is verydifficult to reach such high sampling rate in WiTalk scenario. WiKey [13] uses CSI waveformshape as the features and can recognize keystrokes in a continuously typed sentence with anaccuracy of 93.5%. WiKey works well only in controlled environments and specific devicespositioning. WiFinger [110] also uses CSI waveform shape as the features and can discern8 finger gestures with 93% recognition accuracy. WiFinger also requires static transceiversand finger motion must be near the LOS line of the transceivers. Different from WiKey andWiFinger, WiTalk removes the limitation of static transceivers and works on mobile devices.WindTalker [67] allows an attacker to infer the sensitive keystrokes on a mobile device usingCSI. However, WindTalker requires that the mobile device being placed in a stable environ-ment. Wi-Wri [22] uses WiFi signals to recognize written letters. WiDraw [104] leveragesWiFi signals from commodity mobile devices to enable hands-free drawing in the air. Thesetwo projects focus on the user’s hand trajectory tracking, which is not WiTalk’s research

65
target. The most related work to our work is WiHear [113]. Our work is inspired by Wi-Hear, but we must point out that the system setting and techniques used are significantlydifferent. WiHear uses specialized directional antennas to obtain usable CSI variations. Ittakes 5-7 seconds for stepper motors to adjust the emitted angle of the radio beam to locatethe target’s mouth, which is not acceptable for a real-time eavesdropping system in our set-ting. Furthermore, WiHear does not have enough noise filter mechanisms. It still needs thetraining process per location per user. On the other hand, WiTalk can be implemented oncommercial WiFi devices and has the one-time training feature.
Lip reading. [34] present a combination of acoustic speech and mouth movement imageto achieve higher accuracy of automatic speech recognition in noisy environment. [61]presents a vision-based lip reading system and compares viewing a person’s facial motionfrom profile and front view. [32] shows the possibility of sound recovery from the silentvideo. SilentTalk [109] generates ultrasonic signals from mobile phone and analyzes thefrequency-shift caused by mouth movements from the reflections. It can identify 12 basicmouth motion up to 95.4% accuracy. Chung et. [31] presents their recent results on lipreading which performs better than hum pros. The system was trained using 5000 hours ofvideos including 118,000 sentences.
5.3 CSI Preliminary and CSI-Speed Model
CSI-based motion sensing researches rely on the same principle that the change of CSI valueshas correlation with the motion to be detected. In this section, we briefly introduce the CSIrelated backgrounds, especially the CSI-speed model proposed in [117].
Figure 5.3: CSI streams. The time-series of the CSI matrix contains 30×Ntx ×Nrx CSI streams.
In WiFi protocols like IEEE 802.11a/n/ac, Orthogonal Frequency Division Multiplexing

66
(OFDM) is adopted as the modulation format. In OFDM, the channel frequency response(CFR) is measured on subcarrier level. Let X(f, t) and Y (f, t) be the transmitted andreceived signals in frequency domain respectively, then we have Y (f, t) = H(f, t)X(f, t),where H(f, t) is the CFR at frequency f and time t. As the FFT/IFFT operations areintegrated in OFDM receivers, the receivers are ready to calculate CFRs. Taking advantageof the released tools [48, 124], CFR values are revealed from NIC firmware to drivers andthen to upper layers in the format of CSI. In IEEE 802.11 standards, CFRs on 30 selectedsubcarriers are reported for every received 802.11 frame. If a WiFi link has Ntx and Nrx ofemitting and receiving antennas respectively, then the reported CFRs form a CSI matrix indimensions of 30 × Ntx × Nrx. A CSI matrix is instantaneous. For a specific subcarrier onan antenna pair, we name the time-series of CFRs a CSI stream. Then the time-series ofthe CSI matrix contains 30×Ntx×Nrx CSI streams. We can see that CSI characterizes thefrequency response of the wireless channels. Please refer to Figure 5.3 for the definition ofCSI streams.
In indoor environments, wireless signals arrive at a receiver antenna through multiple pathsincluding the LOS path, paths reflected by static objects like walls and paths reflectedby moving objects like human body. The signals transmitted through these paths havedifferent amplitudes and phases. The CFR can be modeled as the sum of static and dynamiccomponents [117]:
H(f, t) = e−j2π∆ft(Hs(f) +Hd(f, t)) (5.1)
where ∆f is the carrier frequency difference between the sender and the receiver, Hs(f) isthe sum of static CFRs and Hd(f, t) is the sum of dynamic CFRs:
Hd(f, t) =∑k∈Pd
ak(f, t)e−j2π dk(t)
λ (5.2)
where Pd is the set of dynamic paths, ak is the attenuation and initial phase of kth path anddk(t) is the length of path k at time t. If the static and dynamic components are in phase,the dynamic components are constructive factors, otherwise, they are desctructive factors.
The power of the CFR can be calculated to eliminate ∆f :

67
|H(f, t)|2 =∑k∈Pd
2|Hs(f)ak(f, t)|cos(2πvkt
λ+ φk(0)
)+∑k,l∈Pdk 6=l
2|ak(f, t)al(f, t)|cos(2π(vk − vl)t)
λ+ φk,l(0)
)+∑k∈Pd
|ak(f, t)|2 + |Hs(f)|2 (5.3)
where φk(0) and φk,l(0) are initial phase and phase difference. The total CFR power is thesum of a constant offset and a set of sinusoids. The frequencies are functions of the speeds ofpath length changes, which is further correlated to human movement speed. This CSI-speedmodel is the technical principle of using CSI dynamics to detect human motion.
5.4 System Design
The design of WiTalk is illustrated in Figure 5.4. It consists of the following components: CSIdata collection and preprocessing, interference elimination, segmentation, feature extraction,classification and error correction. In this chapter we mainly focus on three components:interference elimination, feature extraction and classification. We will briefly introduce CSIdata collection and preprocessing, segmentation and error correction components becausethey are not the core contributions of this work.
5.4.1 Feasibility Analysis and Verification
We take lip reading as the example to analyze if it’s feasible to do fine-grained motion sensingbased on CSI dynamics. We make a reasonable assumption that when a person talks overthe phone, he/she tends to hold the phone close to the mouth, specifically, with the topreceiver covering the ear and the bottom microphone close to the mouth. We empiricallyassume that the mouth is less than 10 centimeters from the WiFi antenna of the phone. Theanalysis tool that is ready to use here is the Fresnel zone model [114].
When a signal is reflected, the phase of the signal reverses and its phase changes by π/2.The reflected path is longer than LOS path, so the signal phase is shifted further by thedifference in path length. Fresnel zones refer to the concentric ellipses with foci in a pair oftransceivers. As shown in Figure 5.5, T and R are the transmitter and receiver respectively.For every point Q on the blue lines, the distance of the multipath reflected at Q must benλ/2 longer than the LOS path, that is:
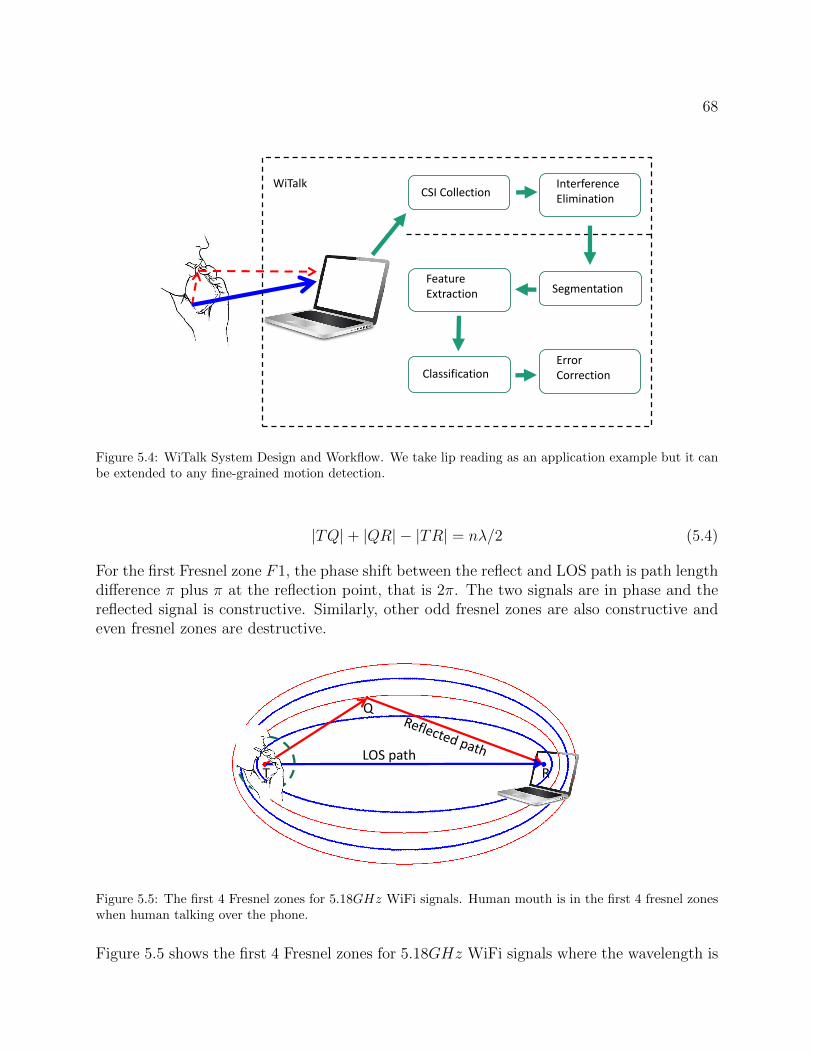
68
CSI CollectionInterference Elimination
Segmentation
Classification
FeatureExtraction
WiTalk
ErrorCorrection
Figure 5.4: WiTalk System Design and Workflow. We take lip reading as an application example but it canbe extended to any fine-grained motion detection.
|TQ|+ |QR| − |TR| = nλ/2 (5.4)
For the first Fresnel zone F1, the phase shift between the reflect and LOS path is path lengthdifference π plus π at the reflection point, that is 2π. The two signals are in phase and thereflected signal is constructive. Similarly, other odd fresnel zones are also constructive andeven fresnel zones are destructive.
T R
Q
LOS path
Figure 5.5: The first 4 Fresnel zones for 5.18GHz WiFi signals. Human mouth is in the first 4 fresnel zoneswhen human talking over the phone.
Figure 5.5 shows the first 4 Fresnel zones for 5.18GHz WiFi signals where the wavelength is

69
about 5.8cm. According to the previous research, the significant zones for RF transmissionare the first 8-12 zones, more than 70% of the energy is transferred via the first Fresnelzone [114]. The dotted green circle in Figure 5.5 has a radius of 10cm, which locates in thefirst 4 Fresnel zones. So it’s reasonable for us to assume that the smartphone WiFi signalsreflected from the mouth have some good level of energy.
Figure 5.6: CSI SNR change with the distance of mouth and smartphone. When the distance is over 20cm,the SNR is near 0.
We verify whether the reflected energy is strong enough to be detected through experiment.We set the distance between the phone and the laptop to 1 meter at the same height in anormal lab environment. A speaker stays still and pronounces /æ/ for 5 times at an intervalof 2s. The speaker then moves in the perpendicular direction of the LOS path for 20cmand repeats this process. The SNR results are shown in Figure 5.6. With the distance ofhuman mouth to the phone antenna increases, the signal power decreases sharply. However,when the human mouth is close enough to the phone, the SNR is about 15dB, indicatingit’s feasible to do smartphone lip reading based on CSI dynamics.
5.4.2 CSI Data Collection and Preprocessing
WiTalk is implemented on the receiving end of a WiFi link and collects CSI measurementson each received packets. For each pair of sending and receiving antennas, 30 CSI streamsare collected.
Different from the previous works which rely on two devices including both of the senderand the receiver to collect CSI data, we apply an approach that leverages Internet ControlMessage Protocol (ICMP) in hotspot to collect CSI data during the user accesses to the pre-installed access point. In particular, WindTalker periodically sends a ICMP Echo Request

70
to the victim smartphone, which will reply an Echo Reply for each request. To acquireenough CSI information of the victim, WindTalker needs to send ICMP Echo Request ata high frequency, which enforces the victim to replay at the same frequency. In practice,WindTalker can work well for several smartphones such as XiaoMi, Samsung and Nexus atthe rate of 800 packets per second. It is important to point out that this approach doesnot require any permission of the target smartphone and is difficult to be detected by thevictim. ICMP based CSI collection approach introduces a limited number of extra traffic.For a 98 bytes ICMP packet, when we are sending 800 ICMP packets per second to thevictim, it needs only 78.4 kB/s for the attack where 802.11n can theoretically support thetransmission speed up to 140 Mbits per second. It is clear that the proposed attack makeslittle interference to the WiFi experience of the victim.
CSI streams are firstly normalized to obtain its z score as Z = (Y − m)/s, where m ands are mean and standard deviation vector respectively. After normalization, Z has a meanof 0 and a standard deviation of 1. The reasons why we normalize CSI streams are two-folds. WiTalk uses CSI spectrograms in time-frequency domain, where the amplitude of CSIstreams does not affect our analysis. Besides, CSI normalization helps in the PCA basedfiltering step because after normalization, all CSI streams contribute equally to PCA andnone of them will dominate the PCA results.
5.4.3 Interference Elimination
CSI streams reported from WiFi NICs are very noisy. Figure 5.7a shows one original CSIstream collected at a sampling rate of 250Hz. The noise sources include environmentalnoises and that are caused by WiFi NICs internal state transitions. These noises are in thehigh frequency zone on the spectrum. Besides the high frequency noises, some interferencesalso exit in CSI streams. Typical interferences include reflected signals from surroundingmoving people and the movement of other body parts of the target like chest movementswhen breathing. In this section, we first use a Butterworth band pass filter to denoise theCSI streams and analyze its parameters. PCA based filter is then applied taking advantageof the correlation among CSI streams.
Band Pass Filtering
The key of designing a band pass filter is to determine its cut-off frequencies. Fine-grainedhuman motion has low speed comparing to large-scale movements. For example, previousstudy on mechanical properties of lip movements [74,85] shows that average movement speedof human jaw and lips when speaking is between 3 − 6cm/s, corresponding to 0.5 − 1.1Hzdynamics in CSI streams for 5.18GHz WiFi signals. Instantaneous speed is higher thanthe average speed, which means a higher CSI frequency. In WiHear [113] the authors use afrequency range of 2− 5Hz. In this work, We choose a wider frequency range of 1− 10Hz

71
(a) Original CSI Stream (b) Spectrum
Figure 5.7: The original CSI stream contains breathing variations and noise, which can identified in thecorresponding spectrum.
to keep more details. In application scenarios other than lip reading, the cut-off frequenciesshould be determined by the corresponding applications.
In a static environment, human respiration is the most significant interference existing in CSIstreams. Figure 5.7a shows one original CSI stream in a static environment. The repeatedpattern of breathing can be clearly observed in this figure. Typical respiratory rate for ahealthy adult at rest is 12 − 20 breaths per minute [19], corresponding to 0.2 − 0.33Hzdynamics in CSI streams. Figure 5.7b shows the spectrum of the CSI stream in Figure 5.7a.
To eliminate out-band interferences and noises, we use band-pass filter on CSI streams.According to what we discussed above, we set the cutoff frequency of the band-pass filterto be 1 − 10Hz. We keep the frequency components up to 10Hz to get more details ofthe mouth movements. We choose 3-order Butterworth filter because it has a maximalflat amplitude response in the pass-band. Most of the high frequency burst noises and lowfrequency interference caused by respiration can be removed by the band-pass filter. Figure5.8b shows the band-pass filter results of the original CSI stream in Figure 5.8a.
PCA Based Filtering
To further denoise the CSI streams and strengthen the effective CSI dynamics, we use princi-pal components analysis(PCA) to track the correlation introduced in CSI streams by humanmotion. We get 30 × 3 × 1 = 90 CSI streams in total when a WiTalk device has threeantennas and the other end of the WiFi link has one antenna.
Among all the 90 CSI streams, we observe that not all of them show strong correlation.Specifically, the correlation is time varying and antenna related. Subcarriers from different

72
(a) Original CSI Stream (b) After Butterworth band-passfilter
(c) After PCA based denoising
Figure 5.8: Denoising the CSI Streams. Bandpass filter keeps the signals between 1-10Hz. PCA filter utilizesthe correlation between CSI streams to enhance filtering quality.
antennas tends to be uncorrelated. For example, Figure 5.9a shows three CSI streams thatare collected from the three different antennas. Though the bottom two streams has someobservable correlations, the top CSI stream from the third antenna does not seem to becorrelated with them. CSI streams of the third antenna are more “noisy”. If we use PCAon all 90 CSI streams from 3 antennas, noises from the third antenna will impinge theperformance of PCA. Thus before PCA, we calculate the mean values of the correlationcoefficients of the 30 CSI streams from an antenna, and setup a threshold to filter out the“noisy” antenna(s). We choose the threshold value 0.95. If none of the three antennas hasa correlation coefficients higher than this threshold, we simply choose the antenna with thehighest mean coefficient.
There are four main steps of applying PCA to CSI streams. The first step is data prepro-cessing. Data of CSI streams are segmented into small chunks to form a data matrix H.Next, we calculate the correlation matrix of the data matrix as HT ×H. The dimension ofthe correlation matrix is N×N , where N = 90 is the number of CSI streams. The third stepis to perform eigen-decomposition of the correlation matrix. In the last step, the principalcomponents are reconstructed as hi = H× qi, where qi is ith eigenvector.
Only the first several principal components of PCA results with highest variance are valuableto our analysis. Due to correlated nature of CSI streams, all principal PCA componentscontain the same information. We discard the first principal component because noisescaused by internal state changes are highly correlated and are captured in the first principalcomponent [117]. We chose the second principal component as the input of the featureextraction step. Figure 5.8c shows the second principle component of the PCA results.Compared to the band-pass filtered result of the same CSI stream in Figure 5.8b, this PCAcomponent contains more details of the CSI stream with higher strength.

73
5.4.4 Segmentation
Segmentation is an important preprocessing step to determine the start and end points ofhuman motion. A good quality of segmentation will improve the performance of fine-grainedmotion sensing. WiTalk simply requires a short static interval between the movements tobe detected. The static interval serves as the sentinel signal, helping WiTalk to segment themovements. We make this requirement because segmentation is not the research focus ofthis work. In lip reading application, more details about syllable and word segmentation canbe found in [113].
5.4.5 Feature Extraction
The design of a context-free fine-grained motion sensing system requires us to find theintrinsic properties in CSI streams that are stable and correlated to human motion only.
Spectrogram Construction
Previous fine-grained motion sensing systems [13,67,110,113] use time domain CSI profiles toextract features for subsequent classification step. However, as time domain CSI waveformschange with different contexts, it is infeasible to use CSI waveforms as the discerning profilesin this work. We verify this claim by performing experiments on mouth movement sensing.Figure 5.9a shows the original CSI waveforms of /æ/ form three subcarriers on three differentantennas. Figure 5.9b shows the corresponding band-pass filtered waveform. The top redline of Figure 5.9b is a CSI waveform of /æ/ collected at a different location. Please be notedthat there are translations of the lines in Figure 5.9b to see them clearly. From Figure 5.9bwe can see that the waveforms from different contexts are significantly different. This verifyour claim that it’s infeasible to use CSI waveforms as the profiles in context-free settings.
As discussed in Section 5.3, the CSi-Speed model proves that CSI spectrogram in time-frequency domain is a stable property of CSI streams that are highly correlated to humanmovement speeds. The movement speeds of different human body parts are correlated to aspecific human activity like pronouncing a syllable. In the lip reading scenario, when pro-nouncing a specific syllable, there exists a specific movement pattern of all mouth parts [109].A movement pattern includes the speed,direction and duration of the movements of everyevolving mouth parts. WiTalk identifies CSI spectrogram in time-frequency domain as thestable property in CSI dynamics and extract features from these CSI spectrograms.
We take the second principle component of PCA based filtering process as the input toconstruct the spectrogram following these steps:
(1) Divide the input into equal-length segments. The segments must be short enough thatthe frequency content of the signal does not change appreciably within a segment. The

74
(a) Original CSI Stream (b) Filtered CSI Stream
Figure 5.9: Different CSI waveforms for the same syllable are quite different in time domain, indicating thedifficulty of using time domain waveforms as the classification features.
segments may or may not overlap. We choose the segment size to be 128, corresponding toabout 0.5 second of samples, so that the time is smaller than pronouncing a syllable andat the same time the number of samples is large enough to calculate the short-time Fouriertransform. The overlap is set to be 126. Large overlap produces more spectrum lines andtherefore a smoother spectrogram.
(2) Window each segment using a Hamming window and compute its spectrum using short-time Fourier transform.
(3) Display segment-by-segment the power of each spectrum in decibels and depict themagnitudes side-by-side as an image with magnitude-dependent colormap.
(4) Segment the CSI spectrogram using the static intervals to get the spectrograms fordifferent syllables.
Figure 5.10 shows the spectrograms for three different syllables. The spectrograms show howthe energy of each frequency component evolves with time, where high-energy componentsare colored in red. We can see that there exists distinguishable patterns in the spectrograms,though not very clearly. As an example, the energy of spectrogram of /æ/ concentrate inthe center. It is because when pronouncing /æ/, the jaw moves at a relatively higher speedin a short time. On the contrary, the spectrogram of /s/ spreads wider than /æ/, becausewhen we pronounce /s/, the lips move slower and last longer time.
Feature Extraction
Though the spectrogram patterns are human distinguishable, we need to further extractfeatures from CSI spectrograms for classification of the fine-grained motion.

75
We find that discrete wavelet transform (DWT) on CSI spectrograms is not suitable forfine-grained motion sensing, which is used in coarse-grained solutions in quadrant II such asCARM [117]. Fine-grained motion like mouth movements have lower speed than large-scalehuman activities like walking or falling, which results in low frequency components in CSIspectrograms. Without enough frequency resolution, it is infeasible to extract frequencies atmultiple resolutions on multiple time scales using DWT.
In WiTalk, we propose to first calculate the contours of the spectrogram images to extractfeatures. The contours represent the edges of different energy levels of the spectrograms, anddepicts the unique patterns of the spectrograms of fine-grained motion. Figure 5.10 showsthree contour lines for the corresponding upper spectrograms. The top yellow contours markthe lines of signal energy and noise. The bottom blue contours enclose the major part theof signal energy.
(a) /æ/ (b) /s/ (c) /u/
(d) /æ/ (e) /s/ (f) /u/
Figure 5.10: Spectrograms and contours of different syllables. The x axis and y axis are time and frequencyrespectively.
Directly using the contour lines as the classification features leads to high computational costsfor classification. Therefore, we use the most relevant signal processing tool DWT on thecontour lines to compress their length by extracting approximate sequences. In WiTalk wechoose Daubechies wavelet filter of order 4 because it has the best classification performance.

76
5.4.6 Classification
People may perform the same micro motion at different speeds, and even for the same person,the motion speeds may vary from time to time. Dynamic time warping(DTW) can be usedto measure similarity between two temporal sequences which may vary in speed. DTWcalculates the optimal match between the two time sequences and warp the sequences tomeasure their similarity. The output of DTW is the distance between the two series. Lowdistance means high similarity between the two sequences. We build a classifier using theDWT compressed contours of the CSI spectrograms as features. The classifier calculate theDTW distances between the input and all the contours in the dataset. The one with theshortest distance is identified as the recognized motion.
5.4.7 Error Correction
The performance of fine-grained motion sensing can be further improved using applicationspecific context information. For example, in the lip reading application, such informationincludes constraints that reject sentences that are not following these constraints. For ex-ample the sentence “The apple is red” will be accepted but “The apple is angry” will berejected [8]. In WiTalk, we implement context-based error correction using a simple Bayesianmethod similar to [109].
5.5 Performance Evaluation
We implement WiTalk on a commercial laptop, and evaluate its performance in a typicallab environment. The system scenario of WiTalk is illustrated in Figure 5.11. WiTalk isimplemented on the receiving end of a WiFi link. The transmitter continually sends packetsto WiTalk at a speed of 250 packets/second. WiTalk collects CSI data and use the proposedalgorithms to infer the fine-grained motion from the hidden patterns of CSI streams. Wedesign experiments to detect a set of pronounced syllables, which is the bases for lip readingapplications. We select lip reading as our example application scenario because it is themost fine-grained motion sensing in the literature that is previously reported using WiFiCSI dynamics [113].
5.5.1 System Setup
WiTalk is implemented on a commercial Thinkpad X301 laptop. The laptop is equippedwith an Intel Core 2 U9600 processor, 4GB memory and an Intel 5300 NIC with 3 omni-directional antennas. The operating system running on the laptop is Ubuntu 14.04 LTS.We install and configure Linux 802.11n CSI Tool as described in [48]. The laptop works as

77
Mouth Reflection
Sender Receiver
Figure 5.11: System application scenario of WiTalk. WiTalk is implemented on a commercial laptop.
the receiver and collects CSI streams using the CSI tool. Collected data are processed usingMatlab scripts for signal processing and classification. Matlab version is R2016a. We do theexperiments on channel 36 at 5.180GHz.
We test WiTalk using two model of smartphones: a LG Nexus 5 with Android 6.0.1 anda Samsung Note 5 with Android 5.1.1. The smartphones work as the transmitters. Thetransmitter continually sends packets to WiTalk at a rate of 250 packets/second during theexperiments. The CSI streams are collected and stored for later processing. WiTalk can alsowork in real time currently. By writing the CSI dynamics to a named pipe, Matlab scriptcan read from the pipe and process the data simultaneously.
We test WiTalk in a normal lab environment depicted in Figure 5.12. The WiTalk deviceis tested at two positions marked as blue dots. We collect data with three volunteers(allmales). The volunteers are asked to stand still at the positions marked as stars. They holdthe phone steadily in normal phone call position the same way as depicted in Figure 5.11.Instead of making a real phone call, they are asked to read a set of syllables and a set ofshort sentences no more than six words. Static intervals are inserted intentionally betweensyllables and words to facilitate segmentation. The set of syllables includes 12 elements: /a//i/ /u/ /e/ /O/ /b/ /f/ /d/ /g/ /j/ /S/ /z/. Each volunteer reads the set of syllables 10times at each test location, and the set of short sentences 5 times at each location.
5.5.2 Syllables Classification Accuracy
The recognition results for the syllables set is depicted in Figure 5.13 and Figure 5.14. Wedo the experiments in two steps to verify the syllable detection performance. We first trainand test the classifier in the same context with the same volunteer at the same location. Theconfusion matrix is reported in Figure 5.13 with an average detection accuracy of 92.3%. Nextwe mix the data collected from different users, different transmitters at different locations

78
A
Tx location
Rx location
1
2
4
3
B
5
Figure 5.12: WiTalk test bed. The locations of WiTalk device are marked as the blue dots. The locationsof the user are marked as stars.
for both training and testing. The confusion matrix is reported in Figure 5.14. In themixed contexts situation, the average detection accuracy is 82.5%. The reasons for the loweraccuracy in mix contexts situation are two-folds: 1) There are slight differences for differentpeople to pronounce the same syllable. For example, in our experiments one of the volunteerstends to pronounce /u/ more lightly than others. His lips pucker very little when he makesthis pronunciation, which impinges the detection accuracy of this syllable. 2) Signal reflectionmultipaths are significantly changed at different locations. This will introduce noises to CSIstreams which cannot be removed completely. This impinges the classification performancecompared to the same-context situation.
5.5.3 Sentence Recognition Accuracy
We evaluate the performance of sentence recognition with and without context-based errorcorrection. The set of short sentences include sentences from 1 word to 6 words. As shown inFigure 5.15, with the increase of the number of words, the accuracy drops significantly. For6 words situation, without context based correction, the recognition accuracy is only about43%. With context based correction, the accuracy is improved by 16%. This is because thelonger the sentences, the more they context information can be applied. The drop of the

79
Figure 5.13: Confusion matrix of 12 syllables in the same context. The average detection accuracy is 92.3%.
Figure 5.14: Confusion matrix of 12 syllables in the mixed contexts. The average detection accuracy is82.5%.
performance is mainly because the difficulty of in-word syllables segmentation. To solve thisproblem, continuous lip reading model could be adopted as in [31].

80
Figure 5.15: Sentence recognition accuracy drips significantly when the number of words increase becauseof the difficulty of in-word segmentation.
5.5.4 Performance with Distance
Figure 5.16 depicts the performance with increase of distance between the transceivers. Forthe receiver location marked as B, we only did the experiments at transmitter location 1, 2and 5. The distance of B1,B2 and B5 are 1.5m, 1.5m and 3m respectively. As we can seefrom Figure 5.16, the syllable discerning accuracy drops by 9% when the distance increasefrom 0.5m to 5m in the same room with LOS available. And the accuracy of sentencedetection drops by 19%. However in through-the-wall scenario as in location 5, both syllableand sentence detection rate drop significantly by over 25% compared to location 4 at thesame distance. To improve the performance and increase the working range of WiTalk, usinga directional antenna will be a promising choice.
5.6 Summary of Contributions
WiTalk is the first fine-grained motion sensing system using CSI dynamics of WiFi. WiTalkcan be implemented on a single WiFi device. We analyse and verify the feasibility of WiTalkin the application of CSI-based lip reading on smartphones. We propose to denoise CSIstreams using band-pass filtering and PCA based filtering. We identify the spectrogramsof CSI dynamics as the intrinsic features that correlate to human fine-grained motion only,and extract features from the contours of CSI spectrograms. WiTalk needs only one-timetraining and works for different environments. Experiment results show that WiTalk can

81
Figure 5.16: Identification performance drops with distance between WiTalk device and the user.
discern a set of 12 syllables with an accuracy of 92.3% and short sentences up to six wordswith an accuracy of 74.3%.
The current implementation of WiTalk has some limitations. First, the performance ofWiTalk degrades with the increase of the distance between the two transceivers and thedistance between the transceiver and moving human body parts. The main reason is thatthe reflected signal power from fine-grained motion is too small and is easily buried in noisesand interferences. Using directional antennas is one possible solution, which we leave asfuture work.
Second, WiTalk requires the user staying relatively still for the fine-grained motion sensing.If the user talks over the phone while walking around, WiTalk will fail because the usefulCSI dynamics will be buried in the CSI changes caused by the moving user body and legs.Even if the user stays still at one location, if he/she makes some hand or body gestures,the extraction of useful CSI dynamics will also become harder. How to eliminate theseinterferences will be our future research target.

Chapter 6
Conclusion
Withe the ubiquitous availability of wireless techniques, we need to pay attention to thesensing capabilities of wireless signals while we enjoy the convenience of wireless communi-cations. Wireless sensing has endless possibility of helping us to know the physical worldaround us.
6.1 Research Summary
This dissertation focuses on the problem of exploring the sensing capability of wireless sig-nals. The research approach is to first take measurements from physical layer of wirelessconnections, and then develop various techniques to extract or infer information about theenvironment use those measurements, like the locations of signal sources, the motion ofhuman body, etc.
The research work in this dissertation has three contributions. My research starts from wire-less signal attributes analysis. Specifically, the cyclostationarity properties of wireless signalsare studied. Taking WiFi signals as an example, we propose signal cyclostationarity modelsinduced by WiFi OFDM structure like pilots, cyclic prefix, and preambles. The inducedcyclic frequencies is then applied to the Signal-Selective Direction Estimation problem. Weare the first to provide complete model for OFDM features-induced cyclostationary prop-erties. Tough we focus on WiFi signals, the analysis methods proposed can be generallyapplicable to other wireless signals. We verified the cyclic frequencies by simulation andcompared the performance of the cyclic frequencies in direction estimation problem.
Second, based on the analysis of wireless signal attributes, we design and implement a proto-type of a single device system, named MobTrack, which can locate indoor interfering radios.The goal of designing MobTrack is to provide a lightweight, handhold system that can locateinterfering radios with sub-meter accuracy with as less antennas as possible. With a small
82

83
antenna array, the cost, complexity as well as size of this device are also reduced. MobTrackis the first single device indoor interference localization system without the requirement ofmultiple pre-deployed Access Points. To the best of our knowledge, MobTrack is the firstsingle device indoor interference localization system without the requirement of multiple pre-deployed Access Points. We propose a novel algorithm to eliminate the multipath effect inthe indoor environment. Our multipath suppression algorithm could robustly and efficientlyisolate the LoS component from other reflected components. We propose a novel signal typeidentification algorithm for MobTrack to calculate the AoAs of only interfering radios, whichsignificantly reduces the requirement to antenna numbers and device complexity.
Third, channel state information is studied in applications of human motion sensing. We de-sign WiTalk, the first system which is able to do fine-grained human motion sensing like leapreading on smartphones using the CSI dynamics generated by human movements. WiTalkproposes a new fine-grained human motion sensing technique with the distinct context-freefeature. To profile human motion using CSI, WiTalk generates CSI spectrograms using signalprocessing techniques and extracts features by calculating the contours of the CSI spectro-grams. The proposed technique is verified in the application scenario of lip reading, wherethe fine-grained motion is the mouth movements. To the best of our knowledge, WiTalkis the first feasible system in the context-free fine-grained quadrant of motion sensing so-lution plane using WiFi CSI dynamics. We show the existence of this quadrant I solutionby identifying the CSI spectrograms as the intrinsic stable properties that correlate to fine-grained human motion. We identify and extract effective features from CSI spectrogramsby calculating the contours of CSI spectrograms. These new discerning features solve theproblem of low time-frequency resolution using discrete wavelet transform(DWT). We verifythe feasibility of WiTalk by applying it to the lip reading scenario. Experiment results showthat WiTalk achieves comparable results to previous fine-grained context-related solutions.
6.2 Future Work
The current work in this dissertation is far from completion and perfection.
MobTrack is designed to be a single device system. However, the current prototype deviceis quite large, because of the size limitations of the antenna array. In the future, we need tofind a better way of implementation. One possible method is to use a virtual antenna array,by moving a single antenna or a couple of antennas in a controlled direction. By measuringthe moving direction and speed of the antenna(s), we can make some compensation usinga software method to construct the virtual antenna array. Though it’s ought to be manychallenges, we believe this is a promising direction to further simplify the device.
The current implementation of WiTalk has some limitations. First, the performance ofWiTalk degrades with the increase of the distance between the two transceivers and thedistance between the transceiver and moving human body parts. The main reason is that
84
the reflected signal power from fine-grained motion is too small and is easily buried in noisesand interferences. Using directional antennas is one possible solution, which we leave asfuture work.
Second, WiTalk requires the user staying relatively still for the fine-grained motion sensing.If the user talks over the phone while walking around, WiTalk will fail because the usefulCSI dynamics will be buried in the CSI changes caused by the moving user body and legs.Even if the user stays still at one location, if he/she makes some hand or body gestures,the extraction of useful CSI dynamics will also become harder. How to eliminate theseinterferences will be our future research target.

Bibliography
[1] Gartner says 8.4 billion connected ”things” will be in use in 2017, up 31 percent from2016. https://www.gartner.com/newsroom/id/3598917. Accessed on 2018-04-01.
[2] Kinect. https://dev.windows.com/en-us/kinect. Accessed on 2018-04-01.
[3] Leap motion. https://www.leapmotion.com/. Accessed on 2018-04-01.
[4] Octoclock clock distribution module with gpsdo - ettus research. https://www.ettus.com/product/details/OctoClock-G. Accessed on 2018-04-01.
[5] Playstation camera. https://www.playstation.com/en-us/explore/accessories/vr-accessories/playstation-camera/. Accessed on 2018-04-01.
[6] Project soli. https://atap.google.com/soli/. Accessed on 2018-04-01.
[7] Sigfox world iot expo - watch the replay. https://www.sigfox.com/en/news/
sigfox-world-iot-expo-watch-replay. Accessed on 2018-04-01.
[8] Speech recognition. https://en.wikipedia.org/wiki/Speech_recognition. Ac-cessed on 2018-04-01.
[9] Synchronization and mimo capability with usrp devices. https://kb.ettus.com/
index.php?title=Synchronization_and_MIMO_Capability_with_USRP_Devices&
action=pdfbook&format=single. Accessed on 2018-04-01.
[10] That ’internet of things’ thing. http://www.rfidjournal.com/articles/view?4986.Accessed on 2018-04-01.
[11] Fadel Adib, Zachary Kabelac, Dina Katabi, and Robert C Miller. 3d tracking via bodyradio reflections. In NSDI, volume 14, pages 317–329, 2014.
[12] Ian F Akyildiz, Weilian Su, Yogesh Sankarasubramaniam, and Erdal Cayirci. Wirelesssensor networks: a survey. Computer networks, 38(4):393–422, 2002.
[13] Kamran Ali, Alex X Liu, Wei Wang, and Muhammad Shahzad. Keystroke recognitionusing wifi signals. In Proceedings of the 21st Annual International Conference onMobile Computing and Networking, pages 90–102. ACM, 2015.
85

86
[14] Arjun Anand, Constantine Manikopoulos, Quentin Jones, and Cristian Borcea. Aquantitative analysis of power consumption for location-aware applications on smartphones. In Industrial Electronics, 2007. ISIE 2007. IEEE International Symposiumon, pages 1986–1991. IEEE, 2007.
[15] Shlomi Arnon. Visible light communication. Cambridge University Press, 2015.
[16] V.S. Bagad. Radar System. Technical Publications, 2009.
[17] Paramvir Bahl and Venkata N Padmanabhan. Radar: An in-building rf-based userlocation and tracking system. In INFOCOM 2000. Nineteenth Annual Joint Conferenceof the IEEE Computer and Communications Societies. Proceedings. IEEE, volume 2,pages 775–784. Ieee, 2000.
[18] Paolo Baronti, Prashant Pillai, Vince WC Chook, Stefano Chessa, Alberto Gotta, andY Fun Hu. Wireless sensor networks: A survey on the state of the art and the 802.15.4 and zigbee standards. Computer communications, 30(7):1655–1695, 2007.
[19] Kim E Barrett, Susan M Barman, Scott Boitano, and Heddwen Brooks. Ganong’sreview of medical physiology. 24. NY: McGraw-Hill Medical, 2012.
[20] David L Begley. Free-space laser communications: a historical perspective. In Lasersand Electro-Optics Society, 2002. LEOS 2002. The 15th Annual Meeting of the IEEE,volume 2, pages 391–392. IEEE, 2002.
[21] Chatschik Bisdikian. An overview of the bluetooth wireless technology. IEEE Com-munications magazine, 39(12):86–94, 2001.
[22] Xiaoxiao Cao, Bing Chen, and Yanchao Zhao. Wi-wri: Fine-grained writing recogni-tion using wi-fi signals. In Trustcom/BigDataSE/ISPA, 2016 IEEE, pages 1366–1373.IEEE, 2016.
[23] Yuan Cao, Yu-Huai Li, Zhu Cao, Juan Yin, Yu-Ao Chen, Hua-Lei Yin, Teng-YunChen, Xiongfeng Ma, Cheng-Zhi Peng, and Jian-Wei Pan. Direct counterfactual com-munication via quantum zeno effect. Proceedings of the National Academy of Sciences,114(19):4920–4924, 2017.
[24] Marcos E Castro. Cyclostationary detection for ofdm in cognitive radio systems. Mas-ter’s thesis, Lincoln, Nebraska. University of Nebraska-Lincoln, 2011.
[25] Paul Castro, Patrick Chiu, Ted Kremenek, and Richard Muntz. A probabilistic roomlocation service for wireless networked environments. In International conference onubiquitous computing, pages 18–34. Springer, 2001.
[26] Pascal Charge, Yide Wang, and Joseph Saillard. An extended cyclic music algorithm.IEEE Transactions on Signal Processing, 51(7):1695–1701, 2003.

87
[27] Zhizhang Chen, Gopal Gokeda, and Yiqiang Yu. Introduction to Direction-of-arrivalEstimation. Artech House, 2010.
[28] Eric Chin, David Chieng, Victor Teh, Marek Natkaniec, Krzysztof Loziak, and JanuszGozdecki. Wireless link prediction and triggering using modified ornstein–uhlenbeckjump diffusion process. Wireless Networks, 20(3):379–396, 2014.
[29] Krishna Chintalapudi, Anand Padmanabha Iyer, and Venkata N Padmanabhan. Indoorlocalization without the pain. In Proceedings of the sixteenth annual internationalconference on Mobile computing and networking, pages 173–184. ACM, 2010.
[30] Mostafa Zaman Chowdhury, Md Tanvir Hossan, Amirul Islam, and Yeong Min Jang.A comparative survey of optical wireless technologies: architectures and applications.IEEE Access, 6:9819–9840, 2018.
[31] Joon Son Chung, Andrew Senior, Oriol Vinyals, and Andrew Zisserman. Lip readingsentences in the wild. In Proceedings of the IEEE Conference on Computer Vision andPattern Recognition, pages 6447–6456, 2017.
[32] Abe Davis, Michael Rubinstein, Neal Wadhwa, Gautham J Mysore, Fredo Durand, andWilliam T Freeman. The visual microphone: passive recovery of sound from video.ACM Transactions on Graphics (TOG), 33(4):79, 2014.
[33] Svilen Dimitrov and Harald Haas. Principles of LED light communications: towardsnetworked Li-Fi. Cambridge University Press, 2015.
[34] Paul Duchnowski, Martin Hunke, Dietrich Busching, Uwe Meier, and Alex Waibel. To-ward movement-invariant automatic lip-reading and speech recognition. In Acoustics,Speech, and Signal Processing, 1995. ICASSP-95., 1995 International Conference on,volume 1, pages 109–112. IEEE, 1995.
[35] Hany Elgala, Raed Mesleh, and Harald Haas. Indoor optical wireless communication:potential and state-of-the-art. IEEE Communications Magazine, 49(9), 2011.
[36] Avshalom C Elitzur and Lev Vaidman. Quantum mechanical interaction-free measure-ments. Foundations of Physics, 23(7):987–997, 1993.
[37] Dave Evans. The internet of things: How the next evolution of the internet is changingeverything. CISCO, 1:1–11, 04 2011.
[38] Ramsey Michael Faragher. Effects of multipath interference on radio positioning sys-tems. PhD thesis, University of Cambridge, 2008.
[39] Klaus Finkenzeller. RFID handbook: fundamentals and applications in contactlesssmart cards, radio frequency identification and near-field communication. John Wiley& Sons, 2010.

88
[40] William A Gardner. Exploitation of spectral redundancy in cyclostationary signals.IEEE Signal processing magazine, 8(2):14–36, 1991.
[41] Jim Geier. Designing and deploying 802.11 n wireless networks. Pearson Education,2010.
[42] Sinan Gezici, Zhi Tian, Georgios B Giannakis, Hisashi Kobayashi, Andreas F Molisch,H Vincent Poor, and Zafer Sahinoglu. Localization via ultra-wideband radios: a lookat positioning aspects for future sensor networks. IEEE signal processing magazine,22(4):70–84, 2005.
[43] Satashu Goel and Rohit Negi. Guaranteeing secrecy using artificial noise. IEEE trans-actions on wireless communications, 7(6), 2008.
[44] Yuki Goto, Isamu Takai, Takaya Yamazato, Hiraku Okada, Toshiaki Fujii, ShojiKawahito, Shintaro Arai, Tomohiro Yendo, and Koji Kamakura. A new automo-tive vlc system using optical communication image sensor. IEEE photonics journal,8(3):1–17, 2016.
[45] Sidhant Gupta, Daniel Morris, Shwetak Patel, and Desney Tan. Soundwave: using thedoppler effect to sense gestures. In Proceedings of the SIGCHI Conference on HumanFactors in Computing Systems, pages 1911–1914. ACM, 2012.
[46] Harald Haas, Liang Yin, Yunlu Wang, and Cheng Chen. What is lifi? Journal ofLightwave Technology, 34(6):1533–1544, 2016.
[47] Andreas Haeberlen, Eliot Flannery, Andrew M Ladd, Algis Rudys, Dan S Wallach, andLydia E Kavraki. Practical robust localization over large-scale 802.11 wireless networks.In Proceedings of the 10th annual international conference on Mobile computing andnetworking, pages 70–84. ACM, 2004.
[48] Daniel Halperin, Wenjun Hu, Anmol Sheth, and David Wetherall. Tool release: Gath-ering 802.11 n traces with channel state information. ACM SIGCOMM ComputerCommunication Review, 41(1):53–53, 2011.
[49] Steven Siying Hong and Sachin Rajsekhar Katti. Dof: a local wireless informationplane. In ACM SIGCOMM Computer Communication Review, volume 41, pages 230–241. ACM, 2011.
[50] IEEE. Ieee standard for information technology–telecommunications and informationexchange between systems local and metropolitan area networks–specific requirements- part 11: Wireless lan medium access control (mac) and physical layer (phy) speci-fications. IEEE Std 802.11-2016 (Revision of IEEE Std 802.11-2012), pages 1–3534,Dec 2016.

89
[51] Suman Jana, Sriram Nandha Premnath, Mike Clark, Sneha K Kasera, Neal Patwari,and Srikanth V Krishnamurthy. On the effectiveness of secret key extraction fromwireless signal strength in real environments. In Proceedings of the 15th annual in-ternational conference on Mobile computing and networking, pages 321–332. ACM,2009.
[52] Kiran Raj Joshi, Steven Siying Hong, and Sachin Katti. Pinpoint: Localizing interfer-ing radios. In NSDI, pages 241–253, 2013.
[53] Shugo Kajita, Tatsuya Amano, Hirozumi Yamaguchi, Teruo Higashino, and MineoTakai. Wi-fi channel selection based on urban interference measurement. In Proceedingsof the 13th International Conference on Mobile and Ubiquitous Systems: Computing,Networking and Services, pages 143–150. ACM, 2016.
[54] Bryce Kellogg, Vamsi Talla, and Shyamnath Gollakota. Bringing gesture recognitionto all devices. In NSDI, volume 14, pages 303–316, 2014.
[55] Mohammad Ali Khalighi and Murat Uysal. Survey on free space optical commu-nication: A communication theory perspective. IEEE Communications Surveys &Tutorials, 16(4):2231–2258, 2014.
[56] Kyouwoong Kim, Ihsan A Akbar, Kyung K Bae, Jung-Sun Um, Chad M Spooner, andJeffrey H Reed. Cyclostationary approaches to signal detection and classification incognitive radio. In New frontiers in dynamic spectrum access networks, 2007. DySPAN2007. 2nd IEEE international symposium on, pages 212–215. IEEE, 2007.
[57] Patrick Kinney et al. Zigbee technology: Wireless control that simply works. InCommunications design conference, volume 2, pages 1–7, 2003.
[58] Lawrence E Kinsler, Austin R Frey, Alan B Coppens, and James V Sanders. Funda-mentals of acoustics. Fundamentals of Acoustics, 4th Edition, by Lawrence E. Kinsler,Austin R. Frey, Alan B. Coppens, James V. Sanders, pp. 560. ISBN 0-471-84789-5.Wiley-VCH, December 1999., page 560, 1999.
[59] Toshihiko Komine and Masao Nakagawa. Fundamental analysis for visible-light com-munication system using led lights. IEEE transactions on Consumer Electronics,50(1):100–107, 2004.
[60] Parameshwaran Krishnan, AS Krishnakumar, Wen-Hua Ju, Colin Mallows, andSN Gamt. A system for lease: Location estimation assisted by stationary emittersfor indoor rf wireless networks. In INFOCOM 2004. Twenty-third AnnualJoint Con-ference of the IEEE Computer and Communications Societies, volume 2, pages 1001–1011. IEEE, 2004.

90
[61] Kshitiz Kumar, Tsuhan Chen, and Richard M Stern. Profile view lip reading. In Acous-tics, Speech and Signal Processing, 2007. ICASSP 2007. IEEE International Confer-ence on, volume 4, pages IV–429. IEEE, 2007.
[62] Swarun Kumar, Stephanie Gil, Dina Katabi, and Daniela Rus. Accurate indoor lo-calization with zero start-up cost. In Proceedings of the 20th annual internationalconference on Mobile computing and networking, pages 483–494. ACM, 2014.
[63] Andrew M Ladd, Kostas E Bekris, Algis Rudys, Lydia E Kavraki, and Dan S Wal-lach. Robotics-based location sensing using wireless ethernet. Wireless Networks,11(1-2):189–204, 2005.
[64] Jeremy Landt. The history of rfid. IEEE potentials, 24(4):8–11, 2005.
[65] Jin-Shyan Lee, Yu-Wei Su, and Chung-Chou Shen. A comparative study of wirelessprotocols: Bluetooth, uwb, zigbee, and wi-fi. In Industrial Electronics Society, 2007.IECON 2007. 33rd Annual Conference of the IEEE, pages 46–51. Ieee, 2007.
[66] Chuan Li, David A Hutchins, and Roger J Green. Short-range ultrasonic digital com-munications in air. IEEE transactions on ultrasonics, ferroelectrics, and frequencycontrol, 55(4):908–918, 2008.
[67] Mengyuan Li, Yan Meng, Junyi Liu, Haojin Zhu, Xiaohui Liang, Yao Liu, andNa Ruan. When csi meets public wifi: Inferring your mobile phone password viawifi signals. In Proceedings of the 2016 ACM SIGSAC Conference on Computer andCommunications Security, pages 1068–1079. ACM, 2016.
[68] Hongbo Liu, Yu Gan, Jie Yang, Simon Sidhom, Yan Wang, Yingying Chen, and FanYe. Push the limit of wifi based localization for smartphones. In Proceedings of the 18thannual international conference on Mobile computing and networking, pages 305–316.ACM, 2012.
[69] Jian Liu, Yan Wang, Yingying Chen, Jie Yang, Xu Chen, and Jerry Cheng. Trackingvital signs during sleep leveraging off-the-shelf wifi. In Proceedings of the 16th ACMInternational Symposium on Mobile Ad Hoc Networking and Computing, pages 267–276. ACM, 2015.
[70] Kaikai Liu, Xinxin Liu, Lulu Xie, and Xiaolin Li. Towards accurate acoustic localiza-tion on a smartphone. In INFOCOM, 2013 Proceedings IEEE, pages 495–499. IEEE,2013.
[71] Hai-Han Lu, Chung-Yi Li, Hwan-Wei Chen, Chun-Ming Ho, Ming-Te Cheng, Zih-YiYang, and Chang-Kai Lu. A 56 gb/s pam4 vcsel-based lifi transmission with two-stageinjection-locked technique. IEEE Photonics Journal, 9(1):1–8, 2017.
91
[72] Ruifeng Ma, Linglong Dai, Zhaocheng Wang, and Jun Wang. Secure communication intds-ofdm system using constellation rotation and noise insertion. IEEE Transactionson Consumer Electronics, 56(3), 2010.
[73] Koji Maeda, Anass Benjebbour, Takahiro Asai, Tatsuo Furuno, and TomoyukiOhya. Cyclostationarity-inducing transmission methods for recognition among ofdm-based systems. EURASIP Journal on Wireless Communications and Networking,2008(1):586172, 2008.
[74] Shinji Maeda and Martine Toda. Mechanical properties of lip movements: How tocharacterize different speaking styles? In Proc. 15th International Congress of PhoneticSciences (ICPhS03), volume 1, pages 189–192, 2003.
[75] Aditi Malik and Preeti Singh. Free space optics: current applications and futurechallenges. International Journal of Optics, 2015, 2015.
[76] Alex T Mariakakis, Souvik Sen, Jeongkeun Lee, and Kyu-Han Kim. Sail: Singleaccess point-based indoor localization. In Proceedings of the 12th annual internationalconference on Mobile systems, applications, and services, pages 315–328. ACM, 2014.
[77] Suhas Mathur, Wade Trappe, Narayan Mandayam, Chunxuan Ye, and Alex Reznik.Radio-telepathy: extracting a secret key from an unauthenticated wireless channel.In Proceedings of the 14th ACM international conference on Mobile computing andnetworking, pages 128–139. ACM, 2008.
[78] Patricia McDermott-Wells. What is bluetooth? IEEE potentials, 23(5):33–35, 2004.
[79] Brent A Miller and Chatschik Bisdikian. Bluetooth revealed: the insider’s guide to anopen specification for global wireless communication. Prentice Hall PTR, 2001.
[80] Amitav Mukherjee and A Lee Swindlehurst. Robust beamforming for security inmimo wiretap channels with imperfect csi. IEEE Transactions on Signal Processing,59(1):351–361, 2011.
[81] Rajalakshmi Nandakumar, Krishna Kant Chintalapudi, and Venkata N Padmanabhan.Centaur: locating devices in an office environment. In Proceedings of the 18th annualinternational conference on Mobile computing and networking, pages 281–292. ACM,2012.
[82] Rajalakshmi Nandakumar, Alex Takakuwa, Tadayoshi Kohno, and Shyamnath Gol-lakota. Covertband: Activity information leakage using music. Proceedings of the ACMon Interactive, Mobile, Wearable and Ubiquitous Technologies, 1(3):87, 2017.
[83] Shahriar Nirjon, Jeremy Gummeson, Dan Gelb, and Kyu-Han Kim. Typingring: Awearable ring platform for text input. In Proceedings of the 13th Annual InternationalConference on Mobile Systems, Applications, and Services, pages 227–239. ACM, 2015.

92
[84] Peter O’Shea. Phase measurement. Electrical Measurement, Signal Processing andDisplays, pages 28–41, 1999.
[85] DJ Ostry and JR Flanagan. Human jaw movement in mastication and speech. Archivesof Oral Biology, 34(9):685–693, 1989.
[86] Parth H Pathak, Xiaotao Feng, Pengfei Hu, and Prasant Mohapatra. Visible lightcommunication, networking, and sensing: A survey, potential and challenges. IEEEcommunications surveys & tutorials, 17(4):2047–2077, 2015.
[87] Paolo Pignoli, Elena Tremoli, Andrea Poli, Pierluigi Oreste, and Rodolfo Paoletti.Intimal plus medial thickness of the arterial wall: a direct measurement with ultrasoundimaging. circulation, 74(6):1399–1406, 1986.
[88] H. Vincent Poor and Rafael F. Schaefer. Wireless physical layer security. Proceedingsof the National Academy of Sciences, 114:19–26, 2017.
[89] Qifan Pu, Sidhant Gupta, Shyamnath Gollakota, and Shwetak Patel. Whole-home ges-ture recognition using wireless signals. In Proceedings of the 19th annual internationalconference on Mobile computing & networking, pages 27–38. ACM, 2013.
[90] Lawrence R Rabiner and Ronald W Schafer. Digital processing of speech signals.Prentice Hall, 1978.
[91] Hanif Rahbari and Marwan Krunz. Secrecy beyond encryption: obfuscating trans-mission signatures in wireless communications. IEEE Communications Magazine,53(12):54–60, 2015.
[92] Anshul Rai, Krishna Kant Chintalapudi, Venkata N Padmanabhan, and RijurekhaSen. Zee: Zero-effort crowdsourcing for indoor localization. In Proceedings of the 18thannual international conference on Mobile computing and networking, pages 293–304.ACM, 2012.
[93] Sridhar Rajagopal, Richard D Roberts, and Sang-Kyu Lim. Ieee 802.15. 7 visible lightcommunication: modulation schemes and dimming support. IEEE CommunicationsMagazine, 50(3), 2012.
[94] Randy S Roberts, William A Brown, and Herschel H Loomis. Computationally efficientalgorithms for cyclic spectral analysis. IEEE Signal Processing Magazine, 8(2):38–49,1991.
[95] Richard Roy and Thomas Kailath. Esprit-estimation of signal parameters via rotationalinvariance techniques. IEEE Transactions on acoustics, speech, and signal processing,37(7):984–995, 1989.
[96] Hatim Salih, Zheng-Hong Li, M Al-Amri, and M Suhail Zubairy. Protocol for directcounterfactual quantum communication. Physical review letters, 110(17):170502, 2013.

93
[97] Stephan V Schell, Robert A Calabretta, William A Gardner, and Brian G Agee. Cyclicmusic algorithms for signal-selective direction estimation. In Acoustics, Speech, andSignal Processing, 1989. ICASSP-89., 1989 International Conference on, pages 2278–2281. IEEE, 1989.
[98] Ralph Schmidt. Multiple emitter location and signal parameter estimation. IEEEtransactions on antennas and propagation, 34(3):276–280, 1986.
[99] Steven R Schnur. Identification and classification of OFDM based signals using pream-ble correlation and cyclostationary feature extraction. PhD thesis, Monterey, California.Naval Postgraduate School, 2009.
[100] Souvik Sen, Romit Roy Choudhury, and Srihari Nelakuditi. Spinloc: Spin once toknow your location. In Proceedings of the Twelfth Workshop on Mobile ComputingSystems & Applications, page 12. ACM, 2012.
[101] Souvik Sen, Bozidar Radunovic, Romit Roy Choudhury, and Tom Minka. You arefacing the mona lisa: spot localization using phy layer information. In Proceedings ofthe 10th international conference on Mobile systems, applications, and services, pages183–196. ACM, 2012.
[102] Tie-Jun Shan, Mati Wax, and Thomas Kailath. On spatial smoothing for direction-of-arrival estimation of coherent signals. IEEE Transactions on Acoustics, Speech, andSignal Processing, 33(4):806–811, 1985.
[103] Francois-Xavier Socheleau, Philippe Ciblat, and Sebastien Houcke. Ofdm system iden-tification for cognitive radio based on pilot-induced cyclostationarity. In Wireless Com-munications and Networking Conference, 2009. WCNC 2009. IEEE, pages 1–6. IEEE,2009.
[104] Li Sun, Souvik Sen, Dimitrios Koutsonikolas, and Kyu-Han Kim. Widraw: Enablinghands-free drawing in the air on commodity wifi devices. In Proceedings of the 21stAnnual International Conference on Mobile Computing and Networking, pages 77–89.ACM, 2015.
[105] K.S. Suslick. Ultrasound: Its Chemical, Physical, and Biological Effects. VCH, 1988.
[106] Paul D Sutton, Keith E Nolan, and Linda E Doyle. Cyclostationary signatures in prac-tical cognitive radio applications. IEEE Journal on selected areas in Communications,26(1), 2008.
[107] Thomas L Szabo. Diagnostic ultrasound imaging: inside out. Academic Press, 2004.
[108] Tsutomu Takeuchi, Masahiro Sako, and Susumu Yoshida. Multipath delay estimationfor indoor wireless communication. In Vehicular Technology Conference, 1990 IEEE40th, pages 401–406. IEEE, 1990.

94
[109] Jiayao Tan, Cam-Tu Nguyen, and Xiaoliang Wang. Silenttalk: Lip reading through ul-trasonic sensing on mobile phones. In INFOCOM 2017-IEEE Conference on ComputerCommunications, IEEE, pages 1–9. IEEE, 2017.
[110] Sheng Tan and Jie Yang. Wifinger: leveraging commodity wifi for fine-grained fingergesture recognition. In Proceedings of the 17th ACM International Symposium onMobile Ad Hoc Networking and Computing, pages 201–210. ACM, 2016.
[111] Wade Trappe, Richard Howard, and Robert S Moore. Low-energy security: Limits andopportunities in the internet of things. IEEE Security & Privacy, 13(1):14–21, 2015.
[112] Deepak Vasisht, Swarun Kumar, and Dina Katabi. Decimeter-level localization witha single wifi access point. In NSDI, volume 16, pages 165–178, 2016.
[113] Guanhua Wang, Yongpan Zou, Zimu Zhou, Kaishun Wu, and Lionel M Ni. We canhear you with wi-fi! In Proceedings of the 20th annual international conference onMobile computing and networking, pages 593–604. ACM, 2014.
[114] Hao Wang, Daqing Zhang, Junyi Ma, Yasha Wang, Yuxiang Wang, Dan Wu, Tao Gu,and Bing Xie. Human respiration detection with commodity wifi devices: do userlocation and body orientation matter? In Proceedings of the 2016 ACM InternationalJoint Conference on Pervasive and Ubiquitous Computing, pages 25–36. ACM, 2016.
[115] Jue Wang, Deepak Vasisht, and Dina Katabi. Rf-idraw: virtual touch screen in the airusing rf signals. In ACM SIGCOMM Computer Communication Review, volume 44,pages 235–246. ACM, 2014.
[116] Wei Wang, Alex X Liu, and Muhammad Shahzad. Gait recognition using wifi signals.In Proceedings of the 2016 ACM International Joint Conference on Pervasive andUbiquitous Computing, pages 363–373. ACM, 2016.
[117] Wei Wang, Alex X Liu, Muhammad Shahzad, Kang Ling, and Sanglu Lu. Under-standing and modeling of wifi signal based human activity recognition. In Proceedingsof the 21st Annual International Conference on Mobile Computing and Networking,pages 65–76. ACM, 2015.
[118] Xuyu Wang, Lingjun Gao, Shiwen Mao, and Santosh Pandey. Csi-based fingerprintingfor indoor localization: A deep learning approach. IEEE Transactions on VehicularTechnology, 66(1):763–776, 2017.
[119] Yan Wang, Jian Liu, Yingying Chen, Marco Gruteser, Jie Yang, and Hongbo Liu. E-eyes: device-free location-oriented activity identification using fine-grained wifi signa-tures. In Proceedings of the 20th annual international conference on Mobile computingand networking, pages 617–628. ACM, 2014.

95
[120] Roy Want. An introduction to rfid technology. IEEE pervasive computing, 5(1):25–33,2006.
[121] Kristen Woyach, Daniele Puccinelli, and Martin Haenggi. Sensorless sensing in wire-less networks: Implementation and measurements. In Modeling and Optimization inMobile, Ad Hoc and Wireless Networks, 2006 4th International Symposium on, pages1–8. IEEE, 2006.
[122] Kaishun Wu, Jiang Xiao, Youwen Yi, Dihu Chen, Xiaonan Luo, and Lionel M Ni. Csi-based indoor localization. IEEE Transactions on Parallel and Distributed Systems,24(7):1300–1309, 2013.
[123] Kaishun Wu, Jiang Xiao, Youwen Yi, Min Gao, and Lionel M Ni. Fila: Fine-grainedindoor localization. In INFOCOM, 2012 Proceedings IEEE, pages 2210–2218. IEEE,2012.
[124] Yaxiong Xie, Zhenjiang Li, and Mo Li. Precise power delay profiling with commoditywifi. In Proceedings of the 21st Annual International Conference on Mobile Computingand Networking, pages 53–64. ACM, 2015.
[125] Jie Xiong and Kyle Jamieson. Arraytrack: a fine-grained indoor location system.In Proceedings of the 10th USENIX conference on Networked Systems Design andImplementation, pages 71–84. USENIX Association, 2013.
[126] Chao Xu, Parth H Pathak, and Prasant Mohapatra. Finger-writing with smartwatch:A case for finger and hand gesture recognition using smartwatch. In Proceedings of the16th International Workshop on Mobile Computing Systems and Applications, pages9–14. ACM, 2015.
[127] Takaya Yamazato, Isamu Takai, Hiraku Okada, Toshiaki Fujii, Tomohiro Yendo, Shin-taro Arai, Michinori Andoh, Tomohisa Harada, Keita Yasutomi, Keiichiro Kagawa,et al. Image-sensor-based visible light communication for automotive applications.IEEE Communications Magazine, 52(7):88–97, 2014.
[128] Jie Yang, Simon Sidhom, Gayathri Chandrasekaran, Tam Vu, Hongbo Liu, NicolaeCecan, Yingying Chen, Marco Gruteser, and Richard P Martin. Detecting driverphone use leveraging car speakers. In Proceedings of the 17th annual internationalconference on Mobile computing and networking, pages 97–108. ACM, 2011.
[129] Zheng Yang, Zimu Zhou, and Yunhao Liu. From rssi to csi: Indoor localization viachannel response. ACM Computing Surveys (CSUR), 46(2):25, 2013.
[130] Moustafa Youssef and Ashok Agrawala. The horus wlan location determination system.In Proceedings of the 3rd international conference on Mobile systems, applications, andservices, pages 205–218. ACM, 2005.

96
[131] Faheem Zafari, Athanasios Gkelias, and Kin Leung. A survey of indoor localizationsystems and technologies. arXiv preprint arXiv:1709.01015, 2017.
[132] Wen-Jun Zeng, Xi-Lin Li, Xian-Da Zhang, and Xue Jiang. An improved signal-selectivedirection finding algorithm using second-order cyclic statistics. In Acoustics, Speechand Signal Processing, 2009. ICASSP 2009. IEEE International Conference on, pages2141–2144. IEEE, 2009.
[133] Yunze Zeng, Parth H Pathak, and Prasant Mohapatra. Wiwho: wifi-based personidentification in smart spaces. In Proceedings of the 15th International Conference onInformation Processing in Sensor Networks, page 4. IEEE Press, 2016.
[134] Dian Zhang, Yunhuai Liu, Xiaonan Guo, Min Gao, and Lionel M Ni. On distinguishingthe multiple radio paths in rss-based ranging. In INFOCOM, 2012 Proceedings IEEE,pages 2201–2209. IEEE, 2012.
[135] Junqing Zhang, Trung Q Duong, Alan Marshall, and Roger Woods. Key generationfrom wireless channels: A review. IEEE Access, 4:614–626, 2016.
[136] Junqing Zhang, Trung Q Duong, Roger Woods, and Alan Marshall. Securing wirelesscommunications of the internet of things from the physical layer, an overview. Entropy,19(8):420, 2017.
[137] Junqing Zhang, Biao He, Trung Q Duong, and Roger Woods. On the key generationfrom correlated wireless channels. IEEE Communications Letters, 21(4):961–964, 2017.
[138] Junqing Zhang, Alan Marshall, Roger Woods, and Trung Q Duong. Efficient key gener-ation by exploiting randomness from channel responses of individual ofdm subcarriers.IEEE Transactions on Communications, 64(6):2578–2588, 2016.
[139] Junqing Zhang, Roger Woods, Trung Q Duong, Alan Marshall, Yuan Ding, Yi Huang,and Qian Xu. Experimental study on key generation for physical layer security inwireless communications. IEEE Access, 4:4464–4477, 2016.
[140] Keqi Zhang, Shu-Ching Chen, Dean Whitman, Mei-Ling Shyu, Jianhua Yan, andChengcui Zhang. A progressive morphological filter for removing nonground measure-ments from airborne lidar data. IEEE transactions on geoscience and remote sensing,41(4):872–882, 2003.
[141] Linghan Zhang, Sheng Tan, and Jie Yang. Hearing your voice is not enough: Anarticulatory gesture based liveness detection for voice authentication. In Proceedingsof the 2017 ACM SIGSAC Conference on Computer and Communications Security,pages 57–71. ACM, 2017.
[142] Ouyang Zhang and Kannan Srinivasan. Mudra: User-friendly fine-grained gesturerecognition using wifi signals. In Proceedings of the 12th International on Conferenceon emerging Networking EXperiments and Technologies, pages 83–96. ACM, 2016.
97
[143] Zengbin Zhang, David Chu, Xiaomeng Chen, and Thomas Moscibroda. Swordfight:Enabling a new class of phone-to-phone action games on commodity phones. In Pro-ceedings of the 10th international conference on Mobile systems, applications, and ser-vices, pages 1–14. ACM, 2012.
[144] Zhong Zheng, Lu Liu, and Weiwei Hu. Accuracy of ranging based on dmt visible lightcommunication for indoor positioning. IEEE Photonics Technology Letters, 29(8):679–682, 2017.
[145] Zimu Zhou, Chenshu Wu, Zheng Yang, and Yunhao Liu. Sensorless sensing with wifi.Tsinghua Science and Technology, 20(1):1–6, 2015.
[146] Yulong Zou, Jia Zhu, Xianbin Wang, and Lajos Hanzo. A survey on wireless security:Technical challenges, recent advances, and future trends. Proceedings of the IEEE,104(9):1727–1765, 2016.