exploring the relationship between general intelligence, executive function, and performance
TRANSCRIPT

Exploring the relationship between general intelligence, executive function, and
performance
by
Jonathan Stermac-Stein
A Thesis
Presented to
The University of Guelph
In partial fulfilment of requirements
for the degree of
Masters of Arts
in
Psychology
© Jonathan Stermac-Stein, January, 2014

ABSTRACT
EXPLORING THE RELATIONSHIP BETWEEN GENERAL INTELLIGENCE,
EXECUTIVE FUNCTION, AND PERFORMANCE
Jonathan Stermac-Stein Advisor:
University of Guelph, 2014 Dr. Peter Hausdorf
An individual’s cognitive ability is arguably the single most important construct in work
performance. The general factor of intelligence, g, is widely considered “as good as it gets” when
attempting to predict work performance. However, development and continued understanding of
the g factor of intelligence is lacking within the field of I-O psychology. This thesis aims to
investigate the mediation of the intelligence-performance relationship by cognitive factors, most
importantly, Executive Function. While the hypotheses of this study were not supported, this
research serves to provide a framework for investigating intelligence within I-O as well as explore
the relationship between Executive Function, various cognitive factors, and general intelligence in
the performance domain.

iii
Acknowledgments
I would like to thank my advisor, Dr. Peter Hausdorf, for his continued support,
motivation, and understanding throughout my undergraduate and graduate career. Most of all, for
the spirited discussions that always lead to new insights and inspiration. It has been an absolute
pleasure working with and learning from Peter. I’d also like to thank my committee members,
Dr. Jeffrey Spence and Dr. Lana Trick for their flexibility, accommodation, and feedback
throughout the process. I would like to especially thank my fellow graduate students for all of
their support and making my graduate experience so memorable. Lastly, I would like to thank
the other faculty members in the UoG Psychology department for their help and friendliness.

iv
Table of Contents
List of Tables ................................................................................................................................. vi
List of Figures ............................................................................................................................... vii
Chapter 1. Introduction ................................................................................................................... 1
Concept of g ................................................................................................................................ 1
Current state of g ......................................................................................................................... 3
Validity of g ................................................................................................................................ 5
Future of g ................................................................................................................................. 10
Cognitive Operations ............................................................................................................. 16
Chapter 2. Method ........................................................................................................................ 26
Participants ............................................................................................................................ 26
Materials ................................................................................................................................ 27
Psychometric g .......................................................................................................................... 27
Executive Function .................................................................................................................... 27
Attention .................................................................................................................................... 28
Working Memory ...................................................................................................................... 28
Visual-Spatial Ability ................................................................................................................ 28
Processing Speed ....................................................................................................................... 29
Task Performance ...................................................................................................................... 29
Procedure ............................................................................................................................... 30
Analysis ................................................................................................................................. 30
Chapter 3. Results ......................................................................................................................... 31
Chapter 4. Discussion ................................................................................................................... 37
Implications ........................................................................................................................... 44
Limitations ............................................................................................................................. 46
Future Research ..................................................................................................................... 48
Conclusion ............................................................................................................................. 49
References ..................................................................................................................................... 51
Appendix of Tables ....................................................................................................................... 63
Appendix A: Information/Consent Form ...................................................................................... 69
Appendix B – Test Materials ........................................................................................................ 72
Appendix C – Cognitive Tasks ..................................................................................................... 75

v
General test of typing speed .................................................................................................. 75
Wonderlic Personnel Test – General Mental Ability (g) ....................................................... 75
Executive Function – Stroop Test ......................................................................................... 76
Attention – Selective attention test ........................................................................................ 78
Working Memory – Operation Span Task ............................................................................ 79
Visual-Spatial Ability – Mental Rotations Test .................................................................... 79
Processing Speed – The Deary-Liewalk Reaction Time Task .............................................. 80
Appendix D - CAPTCHA Task .................................................................................................... 82
Appendix E – Debrief Form ......................................................................................................... 83
Appendix E: Second Consent Form .............................................................................................. 84
Appendix F – Models.................................................................................................................... 86

vi
List of Tables
Table 1. Computation of Variables………………………………………………………………69
Table 2. Descriptive Statistics……………………………………………………………………70
Table 3. Correlations……………………………………………………………………………..71
Table 4. Exploratory Factor Analysis without Covariate and Criterion…………………………72
Table 5. Exploratory Factor Analysis of All Variables………………………………………….72
Table 6. Exploratory Factor Analysis of All Variables Restricted to Two Factors……………...72
Table 7. Measurement Models…………………………………………………………………...73
Table 8. Path Models…………………………………………………………………………….74
Table 9. Extended View of Measurement………………………………………………………..92
Table 10. Path Models…………………………………………………………………………...93

vii
List of Figures
Figure 1. CFA 1 Factor with WPT................................................................................................ 88
Figure 2. CFA 1 Factor Without WPT.......................................................................................... 89
Figure 3. CFA 2 Factor from EFA (covary) ................................................................................. 90
Figure 4. CFA 2 Factor (3 each) ................................................................................................... 91
Figure 5. CFA All variables under 1 factor .................................................................................. 92
Figure 6. All variables under 2 factors.......................................................................................... 93
Figure 7. All variables in 3 factors (from EFA)............................................................................ 94
Figure 8. SEM Model 1 ................................................................................................................ 95
Figure 9. SEM Model 2 ................................................................................................................ 96
Figure 10. SEM Model 3 .............................................................................................................. 97
Figure 11. SEM Model 4 .............................................................................................................. 98
Figure 12. SEM Model 5 .............................................................................................................. 99
Figure 13. SEM Model 6 ............................................................................................................ 100
Figure 14. SEM Model 7 ............................................................................................................ 101
Figure 15. SEM Model 8 ............................................................................................................ 102
Figure 16. SEM Model 9 ............................................................................................................ 103
Figure 17. Layered Reference Model of the Brain ..................................................................... 104
Figure 18. Mediation Model for Hypothesis 2............................................................................ 105
Figure 19. Multiple Mediation Model for Hypothesis 2 ............................................................. 106

1
Chapter 1. Introduction
Concept of g
The concept of intelligence dates back to Aristotle’s division of the psyche in 4th century B.C.
where dianoetic (cognitive function) was separated from orectic (emotion and moral sense).
However, the development of modern definitions of intelligence did not surface until Sir Francis
Galton’s work in the mid to late 19th century when he developed the concept of mental ability. In
the early 20th century, Alfred Binet leveraged Galton’s work to develop the first practically useful
and valid measure of intelligence for school children. While the notion of a general intelligence
was by no means a novel idea at that time, Charles Spearman is largely credited for the
development of the general factor of intelligence, g, and the invention of factor analysis, a
statistical tool that provided empirical evidence towards the existence of a general factor of
intelligence (Jensen, 1998). Given the historical and important nature of the construct of
intelligence, this introduction will review the historical development of the construct, the concept
of a generalized factor of intelligence, g, evidence of its existence and its validity in predicting
performance, controversies surrounding the g factor, and the cognitive operations theorized to
contribute to g.
Spearman’s development of g is a product of his invention of factor analysis, a now
commonly used statistical technique. Factor analysis is used to describe the variability in observed
correlated variables using a smaller number of unobserved variables or factors. Using data from
Galton’s research, Spearman analyzed the correlation matrix with early measures of factor analysis
and confirmed that the correlations between teacher-rated performance in scholastic subjects all
had one general underlying factor in common. This single common factor accounted for their
overall academic achievement. This factor was especially important and surprising given that

2
many of the academic subjects were thought to be unrelated (i.e., performance in Math would not
be related to performance in English or Music). However, the correlations between each variable
and the common factor, g, (i.e., factor loadings) differed slightly, signifying the presence of other
underlying factors outside of g that accounted for the variation in academic performance in each
subject. For example, the positive correlation between g and English was slightly different
compared to the positive correlation between g and Music due to the differences in specific (s)
abilities (e.g., vocabulary or exposure to music; Jensen, 1998).
Spearman described the single factor that all the variables (e.g., performance in English,
Math, Music, etc.) had in common as the general factor, g. Rather than dismissing g as scholastic
attainment, Spearman investigated the relationship between the common g factor and Galton’s
preliminary measure of reaction time (a now widely used index of speed of processing that
underlies cognitive processing) and found a highly significant correlation (r > .67). Spearman was
able to confirm that the g factor represented a general aspect of cognitive ability that was used in
academic performance and other mentally engaging activities.
Based on his data supporting both a common factor g and specific factors related to academic
performance (with 63% and 37% of the variance respectively), Spearman introduced his Two-
Factor Theory. This theory stated that all mental tests of cognitive ability or general intelligence
will measure some g and some s (which will be uncorrelated). Furthermore, a composite score on
a battery of general mental ability tests will more accurately measure g, and erase the presence of
any specific factors (Jensen, 1998).
Unfortunately, Spearman was only able to provide evidence towards the existence of g,
admitting that he did not know exactly what g represented. He described the lack of understanding
of g as follows:

3
But notice must be taken that this general factor g, like all measurements anywhere, is
primarily not any concrete thing but only a value or magnitude. Further, that which this
magnitude measures has not been defined by declaring what it is like, but only by pointing
out where it can be found. It consists in just that constituent- whatever it may be- which
is common to all the abilities interconnected by the tetrad equation. This way of indicating
what g means is just as definite as when one indicates a card by staking on the back of it
without looking at its face. …Such a defining of g by site rather than by nature is just
what is meant originally when its determination was said to be only “objective.”
Eventually, we may or may not find reason to conclude that g measures something that
can appropriately by called “intelligence.” Such a conclusion, however, would still never
be the definition of g, but only a “statement about” it. (Spearman, 1927, p. 75-76)
This lack of clarity of what g constituted did not slow down its widespread acceptance into
psychology as the dominant conceptualization and method of measuring intelligence in individuals
(Neisser et al., 1996).Today the importance of the construct of intelligence and g is widely accepted
in Industrial-Organizational (I-O) psychology (Murphy, Cronin, & Tam, 2003).
Current state of g
Rather than referring to g as the common factor that Spearman discovered, psychometric g
describes any conceptualization of intelligence that relies on a single common underlying factor
representing individual differences in generalized cognitive ability. The most widely accepted test
and models conceptualize g as a higher order factor, under which specific groupings of abilities
are present (e.g., verbal comprehension, perceptual reasoning, quantitative reasoning, etc.). The
most heavily used modern intelligence tests rely on a battery of assessments in order to fully
capture g and many establish an intelligence quotient (IQ) score for test takers.
Beyond Spearman’s proposed two factors, other researchers have proposed the existence of
additional factors (i.e., multiple factor approach) present among groupings of abilities (e.g.,
arithmetic and verbal abilities tasks had large correlations with g and within each other).
Combining Spearman’s work with the multiple factor approach many current intelligence tests

4
utilize a battery of sub-tests designed to provide a more accurate measure of g and group factors
(e.g., math, verbal, spatial ability, etc.; Jensen, 1998).
The Cattell-Horn-Carroll theory of cognitive abilities (CHC theory) is widely considered
the most empirically supported and theoretically comprehensive structure of cognitive abilities.
CHC theory utilizes g as the highest order factor, under which nine broad stratum abilities fall,
each making up a distinct set of narrow abilities. The nine broad abilities represent functional
components of g: crystallized intelligence (breadth and depth of acquired knowledge), fluid
intelligence (novel problem solving and reasoning), quantitative reasoning (comprehend and
manipulate quantitative concepts and symbols), reading and writing ability (skills for basic reading
and writing), short-term memory (apprehending and holding immediately useful information),
long-term storage and retrieval (store and retrieve information for later processing and thinking),
visual processing (perceive, analyze, and think with visual patterns), auditory processing (perceive,
analyze, and discriminate auditory stimuli), and processing speed (performance in automatic
cognitive tasks under focused and maintained attention) (Flanagan, Ortiz, & Alfonso, 2007). The
CHC three-stratum structural model, illustrates the most advanced and currently accepted factor-
based model of intelligence within psychology (McGrew, 2005).
In addition to the CHC model, psychometric g intelligence tests (e.g., Wechsler
Intelligence Scale for Children, Stanford-Binet Intelligence Scale, Wechsler Adult Intelligence
Scale, etc.) have been widely used in education to identify children with learning difficulties,
children with special needs, children’s strengths and/or weaknesses, and children who are gifted
(i.e., score significantly above the mean). They are often used to help diagnose and assess
psychiatric illness, brain injuries, and cognitive functioning. Several tests of psychometric g (i.e.,
Wonderlic Personnel Test [WPT], General Aptitude Test Battery [GATB], etc.) are used in

5
vocational counseling and occupational selection and assessment. While there are substantial
criticisms of current methods of intelligence testing, those and other psychometric g tests are
reliable and valid predictors of future educational achievement, job performance, and a wide
variety of life outcomes (Neisser et al., 1996; Salgado et al., 2003; Schmidt & Hunter, 2004).
Validity of g
Prior to discussing the validity of general intelligence, it is important to illustrate the
connection between the research discussed here and the proposed study. This thesis seeks to
understand the relationship between general intelligence, cognitive factors (especially Executive
Function) and task performance, measure in a laboratory. Examining this relationship will link
cognitive and I-O psychology, bring understanding of cognitive factors and Executive Function to
the realm of workplace psychology, and provide further construct development to general
intelligence from within I-O.
Most relevant to the field of I-O psychology is how well g is able to predict training and
job performance. Among the first to assess the meta-analytic potential of general intelligence as a
predictor of work performance were Hunter and Hunter in 1984. They assessed the validity of a
number of predictors commonly used in organizations for the selection of new employees and the
promotion of existing employees (e.g., general mental ability (GMA), interview, assessment
centre, etc.) across 32,124 participants within 452 studies. For both the selection of new employees
and the promotion of current employees, general mental ability had a mean validity of .53 with
supervisory ratings of current and future job performance (Hunter & Hunter, 1984). Hunter and
Hunter (1984) provide compelling evidence of the validity of general mental ability as a predictor
of job performance in US organizations.

6
Salgado, et al. (2003) extended the validity generalization evidence for Hunter and
Hunter’s (1984) US meta-analysis using the same criteria with 166 European samples. GMA was
found to be a valid predictor for all 10 occupational groups the authors reviewed: engineers,
chemists, managers, clerks, police officers, mechanics, electricians, drivers, and general skilled
workers and apprentices. Criterion-related validities for supervisor ratings of job performance (N
= 1,936) ranged from .12 to .34 (.24 to .67 when corrected for criterion reliability and predictor
range restriction). Uncorrected criterion-related validities for training success ratings (N = 2,897)
ranged from .13 to .46 (.25 to .74 when corrected for criterion reliability and predictor range
restriction).
As well, the authors provided empirical evidence for GMA measures’ generalized validity
for job performance and training success ratings across countries and samples for all occupational
groups (with the exception of training success ratings for police jobs). Most importantly, the
pattern of results were similar to those found in meta-analyses done in North America (Salgado et
al., 2003). Salgado et al. (2003) provided conclusive evidence that current measures of
psychometric g are, “robust predictors of future job performance and training success across
occupational categories, job complexity, and national cultures.” (p. 1076).
Bertua, Anderson, and Salgado (2005) extended Salgado et al.’s work to the United
Kingdom (UK). Investigating 60 independent samples of job performance (N = 13,262) and 223
samples of training success (N = 75,311), the authors found uncorrected criterion-related validities
for GMA – job performance of .19 (.42 when corrected for criterion unreliability and range
restriction) and GMA – training success of .29 (.49 when corrected for criterion unreliability and
range restriction). While the authors did not report the methods through which performance ratings
7
were determined, their results are within the range of those from Hunter and Hunter (1984) and
Salgado et al., (2003).
Hulsheger, Maier, and Stumpp (2007) extended the findings of European and US meta-
analytic studies to Germany. Germany provides a unique scenario as the education system is track-
based (students are sorted into different schools based on aptitude and expected career trajectory,
eliminating much variability in applicant pools and predictor scores). The authors reported 90
independent samples for training success (N = 11,969) and nine for job performance (N = 746).
Hulsheger et al., (2007) found significant uncorrected mean validity coefficients for GMA
measures with supervisory ratings of job performance (.33; .53 when corrected for range restriction
and criterion reliability) and training success (.31; .47 when corrected for range restriction and
criterion reliability).
Additional research in Germany by Kramer (2009) examined the effect of GMA on work
performance and career success (i.e., income and advancement) in a large sample of primary
studies. Operational validities (corrected for range restriction and reliability) of GMA were
assessed for job performance ratings (.66), training performance ratings (.62), income (.35), and
advancement (.33). While Kramer (2009) utilized published articles and data sets, Ziegler, Dietl,
Danay, Vogel, and Buhner (2011) investigated a number of selection methods within one large
sample from a German organization. Ziegler et al., (2011) examined the selection of apprenticeship
positions across eight separate occupational groupings (chemical skilled workers, pharmaceutical
technicians, chemical laboratory workers, biology lab assistances, office communication
assistants, foreign language clerks, electronic technicians, and mechanics) within a pharmaceutical
organization. The results were computed from an objective final examination administered
following the completion of the two-year apprenticeship. This written examination was

8
occupation-specific and based on material that they should have learned during their two-year
period at the company. GMA was found to have an uncorrected mean validity of .22 across all
occupational categories (.65 when corrected for range restriction and criterion reliability) for
training success in apprenticeship positions (Ziegler, Dietl, Danay, Vogel, & Buhner, 2011).
Based on the results of these meta-analyses that span continents and decades, general
intelligence has proven to be a highly valid predictor of training success and job performance.
Uncorrected mean validity scores range from .12 to .46 with operational validities generally found
in the .5-.6 range (Schmidt & Hunter, 1984, Bertua, Anderson, & Salgado, 2005; Hulsheger, Maier,
& Stumpp, 2007; Kramer, 2009; Salgado et al., 2003; Ziegler et al., 2011). With the exception of
Ziegler et al., (2011) and some selected samples (e.g., within Salgado et al., 2003 and Bertua et
al., 2005) all meta-analytic data was procured from samples that used supervisor ratings of job
performance and training success. While there are limitations with supervisor ratings (e.g.,
subjective source, reliability, criteria, etc.), given the similarity in results of Ziegler et al., (2011)
compared to other meta-analyses, the limitations do not seem to affect the findings. The validity
of GMA is supported across a wide range of occupations and objective criteria (e.g., sales
performance, training exit exam, performance data, etc.; Bertua et al., 2005; Salgado et al., 2003;
Ziegler et al., 2011, Berry, Clark, & McClure, 2011).
Despite the extensive meta-analyses assessing the relationship of GMA with supervisory
ratings of job performance and training success, only a select few included moderating variables.
Hulsheger, Maier, and Stumpp (2007) included publication date as a moderator in their analysis
which was negatively related to their validity coefficients. Ziegler et al., (2011) included gender
as a moderating influence in their analysis, which showed no differential effects. While many of

9
the meta-analyses include data that could provide evidence towards occupation as a moderator, it
was often used solely to group occupations by complexity.
Job complexity has been analyzed alongside occupational category within GMA meta-
analyses and moderates the relationship between general intelligence and performance. Hunter and
Hunter (1984) found a significantly positive correlation between cognitive ability and job
complexity, ranging from .27 for less complex jobs to .61 for highly complex occupations. Salgado
et al., (2003) also grouped occupations by complexity. For occupations categorized as high,
medium, and low job complexity, operational validities were .64, .53, and .51, respectively.
The aforementioned meta-analyses that followed the initial study by Hunter and Hunter
(1984) provide substantial and irrefutable evidence for the validity of GMA in the prediction of
training success and job performance. In order to strengthen the evidence supporting the use of
GMA in selection, Hunter and Schmidt (1982) estimated that organizations foregoing the use of
cognitive ability testing in hiring processes were losing eighty billion dollars a year in employee
productivity. Hunter and Schmidt (1984) estimated a $15.61 billion increase in productivity with
the use of GMA measures in the selection process of the entire US federal government. Schmidt
(2002) stated that, “Given the overwhelming evidence showing the strong link between general
cognitive ability (GCA) and job performance, it is not logically possible for industrial-
organizational (I/O) psychologists to have a serious debate over whether GCA is important for job
performance.” (p. 187).
Despite the overwhelming evidence supporting the predictive validity of GMA with job
performance and training success, little research has been conducted to explain why this
relationship exists. At the present time, the only explanation available is job knowledge which is
considered to be a major determining factor in the performance of an individual’s job (Schmidt,

10
Hunter, & Outerbridge, 1986). Schmidt (2002) explained this relationship inversely, “not knowing
what one should be doing- or even not knowing all that one should be doing- is detrimental to job
performance.” (p. 201). Simply put, job knowledge is crucial to the performance of one’s job. The
speed, amount, and application of job knowledge are affected by general mental ability. Thus,
partially through the acquisition of job knowledge, GMA results in higher levels of job
performance (Schmidt, 2002; Schmidt & Hunter, 1992).
Schmidt, Hunter, and Outerbridge (1986) provided support for the mediating role of job
knowledge with four independent military samples (N = 1,474). The authors found that the major
causal impact of mental ability was not on performance directly (path coefficient of .08; measured
by work sample performance) but on job knowledge (path coefficient of .46; measured by a
specific test of job knowledge) which indirectly affected work sample performance (path
coefficient of .66). The indirect effect of GMA on job performance through job knowledge was
twice as large as the direct effect. Therefore, job knowledge was a much stronger determinant of
supervisor job performance ratings than sample work performance (Schmidt, Hunter, and
Outerbridge, 1986). Despite this study, the extent to which I-O psychology understands additional
mediators of the GMA-performance relationship is lacking. This is rooted in the absence of a deep
understanding of the concept of psychometric g within I-O, possibly due to the overwhelming
validity evidence (Scherbaum et al., 2012).
Future of g
GMA will likely become more important for selection in the future as the world of business
is constantly changing, increasing in complexity, and requiring the continual integration of new
technology and knowledge (Boal, 2004; Gatewood, Field, & Barrick, 2008; Pearlman & Barney,
2000). Murphy et al. (2003) reported that 81% of surveyed I-O psychologists believe that cognitive

11
ability will continue to become more and more important as complex competencies are required
for job performance. It is therefore vitally important that I-O psychology continue to investigate
the construct of intelligence. I-O has done well in validating the psychometric g model, however,
we have fallen short when compared to other disciplines within and outside of psychology in
attempting to understand the concept(Schmidt & Hunter, 2004). Understanding how g contributes
to job performance is vital to the future development and use of the construct of intelligence. Many
researchers and practitioners within I-O seem content to research measurement issues, adverse
impact, and other issues surrounding g without increasing our understanding of the construct itself.
Many of the current psychometric g tests (e.g., Wechsler Adult Intelligence Scale (WAIS),
Stanford-Binet Intelligence Scales, General Aptitude Test Battery (GATB), etc.) that are heavily
used in education, business, and military settings but are often regarded as confounded by
education, knowledge, and other factors not related to individual intelligence (Neisser et al., 1996).
Understanding how g contributes to job performance will produce better selection tests. It may
clarify why some individuals score below average on intelligence tests and allow them to
understand where their difficulties arise. Undoubtedly, it may help in being able to strengthen
individuals’ abilities, improving employee and organizational performance. Most importantly, a
deeper understanding of psychometric g may shed new light on the highly controversial topic of
group differences (the differential scoring of races on intelligence tests).
Scherbaum et al., (2012) argue that there is a prevailing idea in I-O that we have what we
need to know and there is no further need for additional research. The tenets of psychometric g are
seen as objective facts, that cannot be questioned and require no further construct development.
Yet, many criticisms of the psychometric approach to intelligence exist outside the realm of I-O.
Understanding and accepting the criticisms and controversies that surround general intelligence

12
can help develop a more complete view and approach to g. Further, the examination of competing
theories of intelligence will help explore new directions and incorporate new findings into the
psychometric concept. Therefore, the following section will briefly examine the common
controversies and criticisms of psychometric g as well as competing theories of intelligence.
Controversial g
Psychometric g is, and has been, a hotly debated topic among researchers in many different
fields (e.g., The Bell Curve by Herrnstein and Murray and the criticisms/defense that followed).
Many of the controversial issues surrounding general intelligence are focused on group differences
and measurement issues (e.g., differential scoring of races and gender differences in ability) and
the alleged link between prominent g researchers and eugenics/racist ideologies (Neisser et al.,
1996; Fancher, 1999; Jensen, 1999). Notwithstanding, criticisms of g often centre on a superficial
understanding of the construct and the limited link to grounded cognitive and neurological abilities
and structures. Interestingly, a few researchers have expressed criticism regarding the quality of
biological and neurophysiological evidence towards the existence of g (discussed later; Partridge,
1999; Burns, 1999; Verleger, 1999; Tan, 1999, Bub, 1999).
Scherbuam et al., (2012) explain that the primary focus of criticisms against the
psychometric g model stem from competing models, such as Sternberg’s Triarchic Theory of
Human Intelligence (Sternberg, 2003) and the PASS Theory of Intelligence (planning, attention,
simultaneous, and successive; Naglieri & Das, 2005). Unfortunately, the aforementioned theories,
have seen little exposure, let alone acceptance, in I-O psychology.
Sternberg’s Triarchic Theory of Human Intelligence (Sternberg, 1985) posits a three-part
intelligence that determines how well individuals deal with environmental changes throughout
their lifespan: analytical (componential), creative (experiential), and practical (contextual).

13
Sternberg (1985) describes analytical intelligence as the cumulative effect of many
functions/components of cognitive processing that reflect how an individual relates to his internal
world (e.g., used in the analysis of complex mathematical problems or written texts). Sternberg
claims that this type of intelligence is the one that is being measured by psychometric g intelligence
tests. Creative intelligence involves the ability to think creatively as well as react to novel situations
and stimuli (e.g., used to create new ideas for research). Finally, practical intelligence involves the
ability to handle everyday tasks and determines how an individual relates to the external world
(e.g., used to figure out what is needed to succeed in the world, outside of having analytical and
creative intelligence; Sternberg, 1985). While Sternberg (1997) postulates his theory based on his
own empirical support, the research, evidence, and subsequently, his theory, have received
substantial criticism regarding the extent and meaning of the supporting evidence (Gottfredson,
2003; Brody, 2003).
Sternberg’s theory represents one side of the intelligence debate, a common sense (i.e.,
layman’s) approach to intelligence, emphasizing real-world applications and development. The
other side of the fence is represented by cognitive psychology and the evidence-based intelligence
theories that emerge out of brain lesion and injury research. The dominant model, PASS, contends
that planning, attention, simultaneous, and successive cognitive processes form the building blocks
of intelligence (Naglieri & Das, 2002). These processes “form an interrelated system of functions
that interact with an individual’s base of knowledge and skills” and are defined as follows:
Planning is a mental activity that provides cognitive control, use of processes,
knowledge and skills, intentionality, and self-regulation;
-e.g., used to plan a problem solving approach
Attention is a mental activity that provides focused, selective cognitive focus over
time and resistance to distraction;
-e.g., used to attend to the problem
Simultaneous is a mental activity that integrates stimuli into inter-related groups;
and

14
-e.g., used to organize information relevant to solving the problem
Successive is a mental activity that integrates stimuli in a specific serial order to
form a chain-like progression (Naglieri & Das, 2002, p. 61).
-e.g., used to complete/remember information in sequence
Planning and attention can also be described as higher-order control processes used in self-
regulation and monitoring. Planning is used in the development and application of plans of action
while attention requires the detection of relevant stimuli and the inhibition of distracting stimuli.
Simultaneous and successive processing coordinate the flow of information through working
memory. Simultaneous processing involves grouping stimuli for ease of processing while
successive processing helps individuals understand and form meaning based on the order of
information.
Much of the research and neurophysiological evidence supporting PASS theory goes
against psychometric g, stating that the brain is made up of separate yet interdependent functional
systems. The PASS was developed from individuals with severe brain injuries and has been used
as the theoretical basis for the Cognitive Assessment System (CAS; a human abilities test for
children). Naglieri and Das (2002) compared the ability to predict scores on academic achievement
tests of several traditional tests of intelligence to the CAS. The CAS accounted for 49% of the
variance in academic achievement, compared to 35% for the WISC-III (Wechsler Intelligence
Scale for Children). The CAS showed the best achievement prediction capability (Naglieri & Das,
2002).
The PASS theory and the CAS are typically used in the assessment and intervention of
children with learning and reading disabilities. While much of the research and empirical evidence
supporting the PASS comes from assessing cognitive difficulties in children, the PASS/CAS
represents a new direction for increasing fairness in the testing of minority populations. The focus

15
on cognitive processes combined with the lack of vocabulary testing result in an assessment system
that has shown less adverse impact for minority groups (Naglieri & Rojahn, 2001; Wasserman &
Becker, 1999). The PASS’s ability to minimize group differences in intelligence testing, provide
specific cognitive details regarding children’s academic difficulties, and predict achievement
illustrates the need for psychometric g models to incorporate and benefit from the cognitive
approach to intelligence.
The PASS’s cognitive and neuropsychological approach to intelligence represents new
directions in intelligence research that can contribute to the further development of the
psychometric approach. The incorporation of cognitive constructs and neurophysiological
structures in the research and development of psychometric g will increase conceptual
understanding and bring forth new directions in research. Cognitive and neuro-scientific evidence
is critical to the substantiation of psychometric g. Psychometric g has suffered in its development
and measurement due to the prevailing idea of g as an omni-present and mysterious
conceptualization of intelligence grounded only in statistical concepts (Scherbaum et al., 2012). A
shift towards a cognition rooted model allows for directed development of psychometric g towards
a construct focused on universal human cognitive functioning. This focus will bridge the gap
between the statistical concept of g and the cognitive abilities that direct intelligent behaviour.
Linking these two domains allows for a better understanding of the relationship between g and job
performance. Rather than relying on purely predictive evidence, this would allow researchers to
break down performance on the job and map it onto cognitive functions that correspond with and
make up general intelligence. This alternative approach to understanding cognitive ability and job
performance increases understanding by removing generalized thinking about intelligence and
creating a new model whereby intelligence can be studied from more than a factor analytic

16
perspective. The following section will examine cognitive and neuro-scientific evidence and
propose the theoretical breakdown of g into fundamental human cognitive operations (given a
specific task). By breaking down g into its cognitive operations, we can develop better theories of
g and its relationship to behaviour and performance. Further, we can determine if cognitive
operations explain more variance in criteria with substantially less adverse impact. In addition, it
should allow for more specific hypotheses with respect to which cognitive operations predict
which performance tasks for a finer analysis of these relationships.
Cognitive Operations
Parallel to the development of g, cognitive psychologists have been developing an
understanding of the primary cognitive operations in the brain for several decades (Deary, Johnson,
& Starr, 2010). As early as 1890 psychologists began researching cognitive differences, but it was
not until the 1950s and 1960s that cognitive psychology was introduced as a discipline. Focused
on the information processing that occurs between sensory inputs and the resulting motor outputs,
cognitive psychology utilizes theories that deal with the processes of thought and inner experience.
As part of a perception-action cycle human cognitive functioning operates by processing sensory
information from the environment and uses it to, “guide the selection and execution of goal-
directed actions.” (Neisser, 1967; MIT, 1999, p. 1). The thoughts and sensory processing are,
“guided in part by selective attention; some of the products of perception are store in memory, and
may in turn influence subsequent perception…[and] perform decision making and problem
solving,” (MIT, 1999, p. 1). Attention, memory, decision making, and problem solving are only a
few of the cognitive operations involved in processing sensory information. Other components
include the speed of information processing, visual-spatial ability, learning, language, and many
more.

17
Attention is seen as the primary driver of information processing as it operates selectively
to govern what sensory information is received. Attention is responsible for, “(a) attentional
orientation (the simple direction of attention to a particular stimulus); (b) selective (or focused)
attention (giving attentional priority to one stimulus in favor of another); (c) divided attention
(dividing attention between two or more different stimuli); and (d) sustained attention (attending
to one stimulus over an increasing period of time)” (Coull, 1998, p. 344). A limited amount of this
information is kept active in working memory (i.e., short-term memory), where it is stored for
concurrent processing of reasoning and comprehension as well as further computing for problem
solving (Becker & Morris, 1999). Attention and working memory have been linked together as
sharing monitoring and information integrating functions that account for shared variance in
reasoning ability. Both attention and working memory have been linked to higher-order cognitive
functioning and aspects of g (Crawford, 1991; Stankov, 1983; Burns et al., 2009).
While working memory is utilized when actively engaged in thinking about and performing
tasks, it encompasses different systems for verbal and nonverbal (spatial) information. The spatial
information stored in working memory is a result of an individuals’ attention and is processed
using their visual-spatial ability, the ability to manipulate two and three-dimensional figures
(sometimes referred to as mental rotation). Visual-spatial ability is extensively used in the
processing of information and complex problem solving when visual information is present.
Visual-spatial ability has been correlated with g, mathematical problem solving and educational
success, specific task performance, and the ability to form mental models in working memory to
aid in reasoning and problem solving (Lohman, 1993, Hegarty & Kozhevnikov, 1999).
Beyond the actual cognitive operations themselves, the speed at which these are executed
is a major component of how these operations contribute to higher-order cognition (i.e., problem

18
solving, learning, etc.). Processing speed can be considered as a mental capacity; the faster the
cognitive processing, the higher the level of cognitive performance and functioning. Some
researchers argue that processing speed, “could be an index of one fundamental capacity of the
central nervous system and, as such, its variance might be shared with those of higher level
cognitive tasks, because the speed with which so-called elementary cognitive operations can occur
dictates the efficiency of more complex mental operations.” (Deary, 2000; Deary et al., 2010 p.
222). Processing speed has been positively correlated with measures of fluid intelligence and
higher level cognitive functions as well as being negatively correlated with aging (Deary, Der, &
Ford, 2001; Grudnik & Kranzler, 2001; Danthiir, Roberts, Schulze, & Wilhelm, 2005; Burns,
Nettelbeck, & McPherson, 2009).
The aforementioned cognitive processes operate both independently and jointly to
contribute to the formation of intelligent thinking and behaviour. Several of the neuro-anatomical
structures linked to attention, working memory, visual-spatial ability, and processing speed
function independently while still utilizing overlapping areas of the brain. Making sense of how
cognitive processes and operations come together to form thoughts, ideas, and behaviour is a
challenging task. One such model, designed to provide a directional approach to understanding the
flow of information and cognitive processing, is the layered reference model of the brain (LRMB)
developed by Wange et al. in 2006.
The LRMB provides an integrative model of the brain and intelligent human behaviour.
Using bottom-up processing, behaviour is explained by 39 cognitive processes across six tiers:
sensation, memory, perception, action, meta-cognition, and higher cognition. Higher-layer
cognitive processes such as problem solving, learning, and decision making rely considerably on
tiers of cognitive operations such as: perception (e.g., attention), memory (e.g., working memory),

19
meta-cognition (e.g., visual-spatial ability), and the overarching speed at which the interdependent
processes are utilized (e.g., processing speed). When attempting to find a solution for a given
problem, how an individual attends to the relevant information, stores and processes it, and
manipulates it, can affect the outcome of the problem by impacting the quality of the solution
generated. See Appendix G for a LRMB highlighting the interaction between tiered cognitive
processes and problem solving.
Guiding higher cognition and subsequently the use and dedication of resources to lower-
order cognitive processes is the proposed control system of the brain, executive function (EF).
While missing from the LRMB, cognitive psychology and cognitive neuroscience have recently
progressed towards the understanding of EF and how it relates to human functioning. Gilbert and
Burgess (2008) state that most theories of executive functioning (of which there are many
competing models) entail, “the modulation of lower-level processes by those at a higher level,” in
order to regulate lower-level perceptual-analysis and output processes for the production of
appropriate behaviour.
Within the LRMB framework, executive function can be thought of as an 8th tier,
controlling, regulating, and restricting the processes found in the lower tiers. Executive function
can be considered similar in conceptualization to psychometric g, involving a wide array of
cognitive functioning, self-regulation of ability, and control of cognitive resources. A recent meta-
analysis investigated the link between a deficit in executive functioning and attention-
deficit/hyperactivity disorder (ADHD) finding that groups with ADHD (N = 3734) had significant
impairment on all tasks measuring executive functioning. Medium effect sizes were found (.46-
.60) but deficits in response inhibition, vigilance, working memory, and planning had the most
consistent relationship with ADHD (Willcutt, Doyle, Nigg, Faraone, & Pennington, 2005).

20
Recently, Barbey, et al., (2012) investigated the neural architecture of psychometric g and
executive function. The researchers were particularly interested in whether psychometric g and
executive function utilized common or distinct systems in the brain and if they operated using
highly localized (e.g., PASS theory) or widely distributed (e.g., psychometric g) neural structures.
Using brain-lesion patients and CT scans, psychometric g was found to be, “…associated with a
distributed network of brain regions, sharing common anatomical substrates with Verbal
Comprehension, Working Memory, Perceptual Organization, and Processing Speed…” (Barbey,
et al., 2012, p. 5).
Furthermore, executive function and psychometric g were found to, “largely depend on
shared neural substrates,” indicating that while not the same, executive function and general
intelligence are highly overlapping constructs (Barbey et al., 2012, p. 6). Despite this overlap,
select regions of brain activity were shown to be related to psychometric g independent of
executive function, and vice versa. Psychometric g demonstrated unique engagement of visual-
spatial processing areas, emphasizing the broad distribution of general intelligence. Psychometric
g therefore reflects the effective integration of: spatial, motor, verbal, and executive processes
through a shared set of cortical connections.
Furthermore, their results suggest that executive function and g utilized a combination of
conceptual knowledge and executive processes, in which the communication between their
associated areas is critically important (Barbey et al., 2012). The authors’ findings suggest that
psychometric g and executive function are grounded in an overlapping and extensively distributed
network of parietal and frontal brain regions. The findings by Barbey et al., (2012) are supported
by a plethora of previous work on the neural substrates of psychometric g (e.g., Jung and Haier,

21
2007; Chiang et al., 2009; Colom et al., 2009; Glascher et al., 2009, 2010; Colom &Thompson,
2011).
This unified neural architecture of executive function and general intelligence highlight the
importance of the fronto-parietal network as the core system for cognitive integration and top-
down control in the brain. Recent evidence suggests that the development of the fronto-parietal
network was central to the evolution of the human brain, indicating its importance in the
development of critical competencies for executive function and general intelligence (Semendeferi
et al., 2001; Van Essen & Dierker, 2007; Barbey et al., 2012).
Barbey et al. (2012) provide the impetus for the proposed research. The unification of
executive control and cognitive processes within a model of psychometric g supports the idea of
an overarching general intelligence responsible for the executive control of delineated cognitive
processes that contribute collectively to performance on tasks. The overlap between g, EF, and
neuroanatomical cognitive functions helps draw a bigger picture, one which may help elucidate
the relationship between intelligence and work performance.
The aforementioned research supporting the neural architecture of psychometric g and
executive function provide evidence that, (i) general intelligence is more than just a statistical
factor, (ii) general intelligence is grounded in neural substrates, (iii) the broad neural network of
general intelligence supports the psychometric approach, (iv) general intelligence can be thought
of as a network of cognitive operations and abilities that operate together and communicate
seamlessly, and (v) general intelligence utilizes top-down executive functioning to regulate and
control intelligent behaviour.
22
Given supporting evidence, the previously mentioned set of five principles provides a
probable explanation for the relationship between a test measuring psychometric g and work
performance. Currently, the pathway from g to performance is well understood in terms of
predictive validity (i.e., we know g predicts work performance). However, little information is
available on the underlying factors driving this relationship. The link between g, executive
function, and higher-order cognitive processes provides the conceptual underpinnings for a
theoretical medation model between g, EF, and performance. This proposal will argue and present
a research methodology for testing a mediation model in which it is hypothesized that the
relationship between g and performance is mediated by the collective functioning of executive
control and highly task-relevant cognitive processes. However, before the hypothesis and
mediation is proposed, it is necessary to discuss the domain of work performance and related task
performance.
Individual performance at work has been a core concept of I-O psychology for several
decades. As organizations need individuals capable of performing their role well, much of the
focus has been on the assessment of performance predictors. However, I-O has been instrumental
in extending and clarifying the concept of work performance (Campbell, 1990). Campbell (1990)
helped clarify the concept of job performance as an employee’s behaviour rather than the outcomes
driven by such behaviour (e.g., actions taken to make a sale vs. revenue or sales numbers generated
by the sale). The focus on behaviour as performance is important as it allows for the delineation
of performance into a factor-analyzed and behaviour-based multidimensional construct.
Among the eight factors of job performance proposed by Campbell (1990), the first factor,
task specific behaviours, refers to the core substantive tasks that differentiate one job from another.
These core tasks drive the fundamental performance of the job and contribute substantially to the

23
productivity, effectiveness, and outcomes of the individual. Arguably, this first factor is the most
important facet of any job, the tasks which an individual must complete as part of their job.
Compared to, non-task specific behaviours (e.g. communication, effort, personal discipline,
helping groups/colleagues, supervisor/leadership, and managerial tasks), task specific behaviours
are the single most important focus of any one job. Given the abundance of predictive validity
research, they are also the most heavily influenced by an individual’s cognitive functioning
(Hulsheger et al., 2007; Hunter & Hunter, 1984; Salgado et al., 2003).
Murphy’s (1994) taxonomy of job performance also features task-oriented behaviours as
the primary factor, indicating that performance on individual tasks is widely seen as primary and
integral to the concept of work performance. Furthermore, Borman and Motowidlo (1993) divided
performance into task performance and contextual performance. Task performance refers to the
employee’s activities contributing to the organization’s technical core or job requirements (e.g.,
selling product) while contextual performance refers to those behaviours which support the
environment of the organization (e.g., organizational citizenship behaviours) (Borman &
Motowidlo, 1993). In summation, necessity dictates that the core factor contributing to job
performance is performance in task specific behaviours as they contribute to an organization’s
productivity, effectiveness, and profitability.
However, some controversy still exists surrounding the measurement of job performance
in research and practice. Many studies use subjective measures of job performance (i.e., supervisor
ratings) in place of objective measures (i.e., sales performance) (Bertua et al., 2005; Maier &
Stumpp, 2007; Salgado, et al., 2003). Yet, even studies utilizing objective measures of job
performance suffer from misguided use, utilizing measures of outcomes, rather than behaviours,
as discussed by Campbell (1990). Therefore, it is necessary that any measures of performance be:

24
i) task focused, ii) objectively measured, and iii) measure performance that is not influenced by
external factors (e.g., sales are influenced by environment, economy, production, client relations,
etc.). The assessment of performance under these three restrictions guides the utilization of
laboratory-based measurement of performance using a task that provides objective performance
data that is not influenced by external factors.
Given the requirements of measures of performance, a laboratory-based task performance
experimental model is necessary. Previous unpublished research by Risavy (2009), Williams
(2010), Stermac-Stein (2010), and Penner (2011) utilized a simple novel task in a controlled
laboratory environment to investigate various contributing factors of task and work performance
(i.e., personality, goal setting, goal orientation, and GMA). Using a 75-item CAPTCHA set
(Completely Automated Public Turing test to tell Computers and Humans Apart; see Figure 1),
the previously mentioned researchers examined the effects of various constructs on individual task
performance with the goal of informing work performance. Williams (2010) and Penner (2011)
validated the effects of goal setting on the CAPTCHA performance. Risavy (2009), Williams
(2010), and Stermac-Stein (2010) explored the differential effects of personality on CAPTCHA
performance, examining the higher performance of conscientious participants. Penner (2011)
investigated the relationship between GMA (as measured by the Wonderlic Personnel Test -
Pretest), goal setting, and CAPTCHA task performance. Irrespective of the effect of goal setting,
GMA correlated significantly with CAPTCHA task performance (r = .34, p < .01), providing the
groundwork for the current study. Penner (2011) provides the evidence for the relationship
between general intelligence and task performance as a valid proxy for the relationship between g
and work performance. Therefore, Hypothesis 1 will serve as both a replication of previous

25
findings and as an effort to establish a relationship between intelligence and performance in the
current study:
Hypothesis 1: Psychometric g will significantly predict performance on the CAPTCHA task
above and beyond typing speed.
Establishing the relationship between g and performance is a critical step in being able to further
explore the function of cognitive operations in driving the connection between intelligence and
task performance.
Individual cognitive functioning contributes to the performance of the CAPTCHA task in
the following ways: i) selectively attending to the overall CAPTCHA and its individual items, ii)
discerning and mentally rotating individual letters and numbers, iii) holding individual
letters/numbers and combinations of characters in working memory until each CAPTCHA is fully
deciphered and input, iv) combining and processing all of the previous operations as fast as
possible, and finally, v) typing into the textbox on the laptop. All of this must be done while
simultaneously attending to real-time accuracy and speed feedback. Given the cognitive
functioning involved in completing the CAPTCHA task, it is theorized that executive function,
attention, working memory, visual-spatial ability, and processing speed are the primary cognitive
drivers of performance on the task, outside of environmental and motivational factors (which have
been explored by previous research, see: Risavy (2009), Williams (2010), and Stermac-Stein
(2010)).
Given the research elucidating its neural architecture, psychometric g can be thought of as
a connected network of cognitive abilities (i.e., verbal, spatial, and motor abilities, working
memory, processing speed, attention, problem solving, etc.). The scope and amount to which these

26
abilities are engaged depends substantially on the task involved. Within a highly complex work
scenario, it would be expected that all the underlying cognitive operations would contribute to the
performance of an individual on that task. Alternatively, given a simpler task, such as completing
a CAPTCHA, only a selection of the cognitive abilities would be utilized. The selection of
cognitive operations utilized in the completion of the CAPTCHA (i.e., executive function,
attention, working memory, processing speed, and visual-spatial ability) should mediate the
relationship between g and CAPTCHA task performance. Therefore, it is hypothesized that:
Hypothesis 2: The relationship between psychometric g and performance on the
CAPTCHA task will be mediated by Executive Function, Attention, Working Memory,
Visual-Spatial Ability, and Processing Speed.
This hypothesis serves to explore the relationship between intelligence and performance, through
the lens of cognitive functioning. Understanding of the contribution of each individual cognitive
operation to the intelligence-performance relationship in this context will help drive further
exploration and discovery.
Given the overlap between g and EF, the selection of cognitive operations (relating to EF
and performance on the CAPTHCA task- based on theoretical evidence), and the relatively
unexplored domain of research within I-O Psychology, the nature of the research is fundamentally
exploratory. Further hypotheses, beyond the two proposed, including but not limited to factor
analysis of the tasks and their relationship to latent g and EF factors would be premature.
Chapter 2. Method
Participants
Ninety four participants were be recruited through the University of Guelph

27
Undergraduate Participant Pool. Participants signed up for the study individually but participated
as a group of 6 in order to facilitate a larger sample size. Participants were undergraduate
students currently enrolled in a first-year psychology course and were granted course credit for
participation in the study. The gender distribution of the sample was 50 females and 44 males,
with an average age of 19.13. On average, participants had worked in part-time positions for 2.39
years and 2.28 months and in full-time positions for .56 years and 1.40 months.
Materials
For a more detailed description of the measures used, see Appendix B. The following
section presents a brief description of the tasks used to represent each latent ability.
Psychometric g
Participants’ GMA was assessed using the WPT Pretest, a valid measure of cognitive
ability (Dodrill & Warner, 1988; McKelvie, 1989). Wonderlic data shows adequate internal
consistency, ranging from .88 to .94, outside data sources ranging from .83 to .89, and test-retest
reliability range from .82 to .94 (McKelvie, 1989; Wonderlic Inc., 1992). As a timed, online test,
the WPT allots a maximum of eight minutes to complete 30 questions. The questions range from
mathematical equations to verbal competency questions. The test yields one score of GMA for
each participant.
Executive Function
Executive function was measured using the Hanover Stroop (Krantz, n.d.). Produced by
the Department of Psychology at Hanover College, this test is a computerized and modified
version of the original Stroop Test (Stroop, 1935). The lack of item-level data did not allow for
internal consistency reliability statistics to be computed during this study’s administration.
However, previous research has examined the test-retest reliability of the Stroop task. Strauss et

28
al. (2005) provide strong evidence for high test-retest reliability of the Stroop color-word task.
All coefficients presented are greater than .7 (Strauss et al., 2005).
Attention
Attention was measured by the Ruff 2 & 7 Selective Attention Test. The 2 & 7 Test
measures both sustained and selective attention. The test was ordered from Psychological
Assessment Resources, Inc. and takes 5 minutes to administer. Normative data is provided in the
test manual. The 2 & 7 Test is derived substantially from a theoretical foundation but is heavily
used in neuropsychological research as a valid measure of attention (Neuropsychological
Assessment, 1992). Alpha and split-half coefficients (for each index of performance) from the
standardization sample (N = 360) are all above .80, with some above .95. Internal consistency
reliability statistics are presented by computing a Cronbach’s alpha coefficient. The 2 & 7 Test
exhibited high internal consistency in this sample population (α = .93).
Working Memory
Working memory was assessed using a modified operation span task (Daneman &
Carpenter, 1980; Turner & Engle, 1989). The task was developed by the author for use in the
study. A sufficiently large body of research has shown good reliability and validity of memory
span tasks, including operation span (Conway, Cowan, Bunting, Therriault, & Minkoff, 2002;
Engle et al., 1999). Internal consistency reliability statistics are presented by computing a
Cronbach’s alpha coefficient. The OSpan task exhibited high internal consistency in this sample
population (α = .87).
Visual-Spatial Ability
Visual-spatial ability was assessed using a redrawn Vandenberg and Kuse mental
rotations test (MRT). This task asked participants to state if images of block shapes are the same,

29
not the same, or mirror images of each other, requiring individuals to mentally rotate and overlay
each image. Mental rotation research has a long-standing history in cognitive psychology and the
MRT is the original and most widely used measure of visual-spatial ability (Caissie, Vigneau, &
Bors, 2009). Internal consistency reliability statistics are presented by computing a Cronbach’s
alpha coefficient. The MRT exhibited high internal consistency in this sample population (α =
.90).
Processing Speed
Processing speed was measured using simple and four-choice reaction time tasks,
cognitive-experimental-level assessments. Deary, Liewald, and Nissan (2011) provide a free and
easy-to-use computerized version of the reaction time tasks used widely in applied psychology.
This newly developed task correlates highly with existing reaction time tasks and is reliable.
Item level data was not acquired for this study’s administration of the CAPTCHA task and
therefore, internal consistency statistics could not be computed. The authors of the task provide
initial reliability statistics. Internal consistency as computed by Cronbach’s alpha was very high
for the choice reaction time task (α = .97; Deary, 2011).
Task Performance
Task performance was assessed using the CAPTCHA task, a timed, 5-minute task where
participants decode a scrambled series of numbers and letters, 6-8 characters long. The
CAPTCHA task provides performance data on the number of correct responses, number of
completed items, percent correct, percent completed, number of incorrect responses, and overall
performance on the task. Item level data was not acquired for this study’s administration of the
CAPTCHA task and therefore, internal consistency statistics could not be computed. However,

30
the CAPTCHA task has been used in previous research in the past several years and provides a
reliable outcome criterion (Risavy, 2009, Stermac-Stein, 2011, Williams, 2011, Penner, 2012).
Procedure
Participants who signed up for the study were scheduled for a one-hour timeslot in a
laboratory simultaneously alongside five other participants. Each participant was first given the
information/consent form (Appendix A) and then completed a brief demographics questionnaire
on a laptop computer (Appendix B). Each participant was then asked to complete the WPT
(Appendix C) and then the following tasks: Stroop Task, Ruff 2 & 7, Reading Span, Mental
Rotation Task, Single and Four Choice Reaction Time Task (Appendix D).
Following the completion of the cognitive operations tasks, participants completed the
CAPTCHA task (Appendix E). Following the task, participants were given a second
questionnaire to fill out, assessing their perception of their own task performance, stress, as well
as any open-ended thoughts they had about the study. Finally, they were provided with the
debrief sheet (Appendix F) and second consent form (Appendix G). The materials in Appendices
A, B, C, D, F, and G were provided to participants in a paper-based format. The CAPTCHA task
was administered using laptop computers. Participants were given short breaks periodically
during the 1-hour session to limit cognitive loading and prevent test-fatigue.
Analysis
Descriptive statistics, correlations, and reliabilities were computed in SPSS for all
variables. Multiple regression analyses were used to test relationships and interactions between
variables. West, Aiken, and Krull (1996) outline the steps needed to: structure the multiple
regressions, code variables, center variables and conduct tests needed for the data analysis of the
study.

31
A mediation analysis was used to assess Hypothesis 2. A Preacher and Hayes (2008)
bootstrapped mediation was used to test Hypothesis 2. Two mediation analyses were run. The
first mediation used latent variables created using CFA scores found in AMOS. The second
analysis was a multiple mediation model computed using observed variables. Variables were
further explored using latent and observed variable path models in SPSS AMOS. Further, post-
hoc exploratory data analysis investigated additional measurement and path models using
goodness of fit statistics in SPSS AMOS.
The data were reviewed for missing values, outliers, and skewness/kurtosis. Individuals
with missing data were removed from the dataset and any participant with a significantly higher
or lower score (as determined by a z-score of ± 3.29) compared to the rest of the sample had their
data point recoded to the next highest or lowest score. The z-score of ± 3.29 was used as a cutoff
value for identifying variables with significant positive or negative skew. Only one variable (RT)
was identified as having a slight positive skew (5.13) and was fixed by applying a square-root
function to achieve a normal distribution. Reliabilities were computed using Cronbach’s Alpha
and were compared against a minimum cutoff value of .70.
The variables used and the computation of them can be seen in Table 1. Composites of
Executive Function (EF) and psychometric g were computed in SPSS, for use in regression
analyses, based on path loadings provided by the measurement model found in Figure 3.
Chapter 3. Results
Means, standard deviations, skewness, and kurtosis can be found in Table 2 in the
Appendix of Tables. Correlations and reliabilities for all variables included in the study can be
found in Table 3 in the Appendix of Tables.
The single best predictor of the task performance (CAPTCHA) was typing speed (WPM;

32
r = .47, p < .001), followed by working memory (OSPAN; r = .31, p < .001), and psychometric g
(WPT; r = .28, p < .001). As seen in Table 3, all of the individual tests of cognitive functioning
had non-significant positive relationships with CAPTCHA performance, with the exception of
the working memory task, the OSpan. The Ruff 2 & 7 test of Attention did not significantly
correlate with any other cognitive task in the battery except for the reaction time task. It did,
however, correlate with the ad-hoc measure of Stress that was completed by participants
following the task battery. The Stress measure did not significantly correlate with any other
measure of cognition in the study. The Ruff 2 & 7 did not significantly correlate with
psychometric g as measured by the Wonderlic. Interestingly, age and CAPTCHA performance
did not correlate significantly. Given that age and cognitive ability are highly correlated in
research (and replicated in this study; r = -.19, p < .05), the lack of relationship between age and
performance on the criterion measure is of note.
Of the cognitive tests used, only three provided enough item level data for internal
consistency reliability to be computed. All other tests’ reliabilities were investigated through
literature searches and were deemed acceptable (i.e., > .70). As seen in Table 3, the MRT, the
RUFF and the created OSPAN task had Cronbach’s alpha reliabilities greater than .86, which is
well above the cut-off for psychological testing purposes.
Previous research indicates that while g and EF are similar and potentially overlapping,
the delineation of contributing cognitive abilities to each, uniquely or shared, is not well
understood (Barbey, et al., 2012). Given the exploratory nature of the research, it is important to
understand how each cognitive operation (i.e., Attention, Working Memory, Processing Speed,
etc.) individually contributes to the latent constructs of g and EF. In order to do so, Exploratory
Factor Analysis is used. Factor loadings of each measure onto latent factors serve to help

33
understand the differentiation between g and EF.
An Exploratory Factor Analysis (EFA) was performed in SPSS using a Principal
Component Analysis and an Eigenvalue cutoff of 1.0. The unrestricted EFA using a Promax
rotation method extracted three factors with minimal cross-loading (see Table 5). The first factor
contained Typing Ability [WPM] and Task Performance [CAPTCHA], the second factor
included Psychometric g [WPT], Task Performance [CAPTCHA], and Working Memory
[OSPAN], and Visual-Spatial Ability [MRT], and the third factor contained Processing Speed
[RT], Attention [RUFF], and Executive Function [STROOP].
Table 4 and 6 represent alternative EFAs aimed at further exploring the breakdown of
latent factors. The EFA from Table 4 does not include the covariate, Typing Speed [WPM] or the
criterion, Task Performance [CAPTCHA] but still exhibits a similar pattern of task breakdown
(i.e., separation of g and EF measures). Table 6 represents an EFA that serves to further validate
the g and EF dichotomy by limiting the solution to two factors. However, the first factor includes
factor loadings for all variables except Typing Speed [WPM]. The second factor includes factor
loadings from Typing Speed [WPM], Task Performance [CAPTCHA], and Executive Function
[STROOP].
Preliminary analysis of the three factor EFA (Table 5) suggests that psychometric g and
EF represent empirically distinct constructs followed by a third factor, representing performance.
However, the EFA in Table 6 illustrates that the separation of EF and g may not be very clear.
The second factor present in Table 6 appears to be the performance factor from the three factor
EFA in Table 5. The somewhat unclear nature of the EFA results suggests that further analysis is
needed. Confirmatory Factor Analyses (CFA) were utilized to verify the three-factor finding.
Several CFAs were performed using AMOS in SPSS. Table 7 presents the results of the

34
CFAs and illustrates the calculations used to compute chi-square difference tests and their
values. Measurement Model 1 (see Figure 1) tests the possibility of all predictor variables
(excluding WPM) fitting under 1 variable, presumably Executive Function due to the five
cognitive tasks compared to only one measure of psychometric g [WPT]. Model fit is poor, χ2
(9) = 13.93, p = .125, CFI = .92, CMIN/DF = 1.547. Comparatively, (see Measurement Model 2
in Table 7 and Figure 2) once you remove psychometric g [WPT], the model fit improves, χ2 (5)
= 2.97, p = .71, CFI = 1, CMIN/DF = .594, indicating a distinction between EF and g.
Measurement Model 3 (see Figure 3) represents the EFA from Table 6 in which all
variables were restricted to two factors, χ2 (8) = 5.64, p = .69, CFI = 1, CMIN/DF = .704.
Finally, Measurement Model 7 represents the EFA from Table 5 and can be seen in Figure 7 in
Appendix F. This model represents the same structure as Measurement Model 3 with the
addition of Typing Speed [WPM] and Task Performance [CAPTCHA] under a third latent
variable. Additionally, it represents the same variables as Measurement Models 5 and 6 (Figures
5 and 6 respectively). Compared to Models 5 and 6, the three factor structure improves
dramatically, χ2 (17) = 19.72, p = .29, CFI = .97, CMIN/DF = 1.16. Therefore, the three-factor
approach from the EFA is confirmed. This finding is supported by the decrease in AIC and BIC
values from a one and two factor approach to the three factor model (see Table 7).
Following confirmation that three factors are present, including the separation of g and
EF into distinct but correlated latent variables, SEM path analysis was used to preliminarily
investigate the hypotheses. Table 10 (Table 8 presents a condensed version) and Figures 8
through 16 in Appendix G illustrate the SEM results. SEM Models 1, 2, and 3 were tested to
illustrate the effect of ignoring the EFA results and to test the theoretical assignment of measures
to their (proposed) respective latent factor. As can be seen in Table 8, all three models indicate

35
poor fit. Models 4 through 6 represent exploratory work using two factor EFA results, of which
no substantial results are found. Model 7 is a simple recreation of Hypothesis 1 using observed
variable path analysis. A regression discussed later on confirms the validity of Hypothesis 1, as
seen in SEM Model 7, χ2 (48) = .478, p = .49, CFI = 1, CMIN/DF = .478.
SEM Model 8 and 9 (see Figure 15 and 16) represent latent variable path diagrams
exploring the structural model proposed by the three factor EFA. Model 8 represents a
moderation approach to predicting performance. Model 9 represents a mediation approach to
predicting performance with the latent EF variable as the mediator. In both models, F1 is the
criterion variable with loadings from Typing Speed [WPM] and Task Performance [CAPTCHA].
F2 represents general intelligence with loadings from Psychometric g [WPT] and Working
Memory [OSPAN] and F3 represents Executive Function with loadings from Visual-Spatial
Ability [MRT], Attention [RUFF], Executive Function [STROOP], and Processing Speed [RT].
The fit statistics for Model 8 and 9 could not be calculated due to an inadmissible solution. This
error was most likely caused by a model variance value that was negative. Further investigation
revealed that the variance associated with F1 was negative, known as a Heywood case.
McDonald (1985) states that the most common and probable cause of a Heywood case is an
insufficient number of variables for each latent factor. McDonald recommends that each factor
be represented by at least 3 or 4 observed variables. One potential solution is to utilize a
generalized least squares or unweighted least squares method in AMOS. However, this approach
failed to remedy the problem. Newsom (2012) states that a common cause of Heywood cases is
empirical underidentification, a positive degrees of freedom number but a lack of covariance
information (likely due to only having two observed variables for a latent factor in a large model.
Given the fixed number of variables, this Heywood case makes SEM testing an inappropriate

36
choice for Hypothesis 2. Therefore, linear regressions were used to confirm Hypothesis 1 and
test Hypothesis 2.
A linear regression was used to test Hypothesis 1. CAPTCHA performance was regressed
on WPM and WPT. WPM was entered separately in the first block. The result of this first
regression was significant [R2 = .23, F(1, 92) = 25.85, p < .01]. WPT accounted for an additional
6% of the variance in CAPTCHA task, R2 = .29, F(2, 91) = 17.60, p < .01. Therefore, Hypothesis
1 was supported.
A Preacher and Hayes (2008) multiple mediation analysis was used to test Hypothesis 2.
Two mediations were conducted, one with latent variables representing the factor breakdown of
EF and g, and one with multiple mediators as per the specifications of Hypothesis 2. Prior to
running the mediations, latent variables were created in SPSS to represent Executive Function
and psychometric g, based on the EFA and CFA results. These latent variables were created
using the factor loadings in Figure 3. Scores on each cognitive task were multiplied by their
factor loading and then summed to create a composite variable. Psychometric g was composed of
the Wonderlic task, the Operation Span task, and the Mental Rotation Task. The Executive
Function composite was composed of the Ruff 2 & 7, the Stroop, and the Deary-Liewald
reaction time task.
The first mediation analysis, run with latent variables, did not result in a partial or full
mediation (see Figure 18 in Appendix F). The second mediation analysis, run with multiple
observed variable mediators, returned mixed results (see Figure 19 in Appendix F). The effect of
the Wonderlic task on CAPTCHA performance was mediated by the Operation Span task.
However, none of the other tasks had a significant effect on CAPTCHA performance. Therefore,
Hypothesis 2 was not supported.

37
A linear multiple regression was conducted to test the interaction between the latent EF
and g factors on CAPTCHA performance. CAPTCHA Performance was regressed on, WPM, g,
EF, and the interaction of EF and g. WPM was entered in the first block as a covariate, the
second block contained EF and g, and the third block contained the interaction of EF and g.
WPM accounted for 23% of the variance in CAPTCHA performance, R2 = .23, F(3, 90) = 8.74,
p < .01. EF and g accounted for an additional 13% of the variance in CAPTCHA, ΔR2 = .13, F(5,
88) = 9.69, p < .01. The interaction between EF and g did not account for any significant
additional variance in CAPTCHA performance, ΔR2 = .01, F(6, 87) = 8.22, p < .01. EF alone did
not significantly predict CAPTCHA performance (β = -.01, t(87) = -.10, ns). Psychometric g did
significantly predict CAPTCHA performance (β = .40, t(87) = 3.99, p < .01).
Chapter 4. Discussion
The goals of this study were to investigate the cognitive operations involved in
psychometric g, understand its relation to Executive Function, and evaluate the role of cognitive
factors in predicting task performance. Understanding the relationship between general
intelligence, EF, and cognitive factors, and how they form intelligent behaviour in the workplace
is an important goal of this study. Through this understanding, this study hopes to reevaluate the
current approach to intelligence research in I-O Psychology, advance our understanding of
psychometric g both within and outside of I-O, and integrate disciplines by combining I-O
research with cognitive psychology. Furthermore, the more practice based goals of this study are
to use the newfound insights into general intelligence to establish more advanced protocols for
developing intelligence assessments and in the process, help alleviate the adverse impact
currently plaguing traditional measures of intelligence. Most importantly, the primary impetus
for this research was and remains Scherbaum’s et al., (2012) call for a reimaging of intelligence
38
research in I-O. This study hopes to spur future research into general intelligence and EF in I-O
Psychology and serve as a building block for further investigation. This section begins by
discussing the results from the previous section and elaborating on their meaning in the context
of the current study.
Replication of the findings associating task performance with general intelligence was the
goal of Hypothesis 1. This replication was successful, general intelligence as measured by the
Wonderlic Personnel Pretest positively predicts performance on the CAPTCHA measure. Given
previous research using the same measure of performance (e.g., Penner, 2012), this study sought
to gain a deeper understanding of that relationship by adding a measure of typing speed.
Interestingly, typing speed correlated significantly with performance on the CAPTCHA task but
not with general intelligence. However, when accounting for typing speed, general intelligence
only predicts six percent of the variance in CAPTCHA performance. This result indicates that an
individual’s ability to type quickly is a much better predictor of CAPTCHA performance than is
general intelligence. Initially, this might seem plausible considering that ability to type quickly
and accurately could be related to intelligence, however, there is a non-significant correlation
between typing speed and psychometric g (r = .09, ns) and the difference between zero-order and
part correlations in the regressions was minimal (i.e., dropping by no more than three one-
hundreds).
Examining the relationships between the cognitive tasks assigned to measure specific
cognitive operations and the CAPTCHA task provide interesting results. Most of the cognitive
tasks did not significantly and positively predict performance on the CAPTCHA task, with the
notable exception of the OSpan task, which had a large relationships with the CAPTCHA task.
The relationship between working memory, general intelligence, and CATPCHA performance is

39
worth exploring further.
The counterintuitive pattern of results for the Ruff 2 & 7 test of Attention may be due to
its design and use as a neuropsychological test. Its primary use is in clinical applications, rather
than performance measurement, and thus may not be suitable for picking up the higher end
performance variance that would generally be associated with university students. Further, its
focus on sustained and selective attention through the process of digit searching may not be
wholly applicable to the CAPTCHA task.
In terms of the relationship between psychometric g and cognitive abilities, all of the
cognitive functioning tasks (except attention and EF) correlated significantly with g (i.e., those
cognitive tasks predict higher levels of g with higher levels of cognitive functioning). Again, this
provides evidence towards issues with the selection of the task used to assess attention, rather
than the objective relationship between general intelligence and attention.
This study explores new avenues of research within I-O Psychology by seeking to
understand the relationship between a heavily I-O focused construct (i.e., g) and a heavily brain
and cognition focused construct (i.e., Executive Function). The author first sought to establish
the independence of psychometric g and EF. Separate EFAs and CFAs support the idea that
psychometric g and EF are functionally distinct but related given the measures used in this study.
Table 5 illustrates a three-factor structure that supports this idea. This factor structure provides
separate but related g and EF factors. The first factor represents a type of performance factor.
Careful consideration lead the author to believe that this first factor (Typing Speed, CAPTCHA,
Stroop) represented a contextual performance factor that included underlying familiarity or
ability with computer keyboards (e.g., the Stroop task had participants performing the task using
the keyboard and generally would do better if they did not have to look down for their

40
keystrokes). In accordance with Spearman’s theory of intelligence, this factor would represent
specific ability, s, as it is contextual to the tasks and setting it is performed in.
The second factor that was extracted is thought to represent general intelligence as its
primary loadings were from the Wonderlic and the Operation Span task and the Mental Rotation
Task. The Operation Span task and the Wonderlic are the only two tasks that include forms of
verbal and mathematical ability in them, thereby representing classical measures of psychometric
intelligence, whereas the others are considered more pure measures of cognitive functioning.
The third factor therefore represents some form of global Executive Function, as defined
by the inclusion of processing speed (RT), attention (RUFF), and executive function/response
regulation and inhibition (STROOP). This factor represents a more cognitive-based approach to
intelligence in that Executive Function is comprised of and regulates the cognitive operations
involved in planned, intelligent behaviour. Therefore, this three-factor representation
differentiates between psychometric intelligence and neural-cognitive intelligence/Executive
Function.
As detailed previously, latent variables of g and EF were created using the CFA factor
loadings based on the 3-factor structure above. Correlations between these factors provide an
interesting look at the disparity between EF and g. CAPTCHA performance is highly correlated
with g (r = .36) but not EF (r = .18). However, there is a strong positive correlation between EF
and g (r = .37). These correlations, along with the 3-factor structure, indicate that EF and g are
distinct but related factors.
Hypothesis 2 was examined in the light of having two distinct but related factors,
representing EF and g. Hypothesis 2 was not supported, the mediation of the g-performance
relationship was not successful. However, it appears as though working memory is driving the

41
relationship behind intelligence and performance on the criterion.
Extrapolating this relationship to workplace job performance, EF would add no predictive
power above and beyond general intelligence. However, previous research supports the idea that
EF could be a useful predictor when examining the cognitive-work performance relationship
(Scherbaum et al., 2012). This is by no means conclusive evidence shutting the door on EF. The
relationship between EF and g espoused in this research does not provide a complete picture. As
well, the intelligence-working memory relationship should be investigated further as it illustrates
some interesting questions regarding the performance of working memory and its role in
intelligence.
The discussion that follows will review the CAPTCHA task, evaluating the overlay with
cognitive operations. Further, it will seek to understand the CAPTCHA task and performance
within the context of g and Executive Function. Further, it will discuss the implications for g and
EF from a testing perspective, and finally the future research that is need to fully investigate the
relationship between EF and g and the application of this research approach to other task
performance domains.
Williams (2013) highlights the connection between speed and accuracy, as measured by
the CAPTCHA task, and their relation to effective organizations. “Businesses value employees
who put forth a considerable amount of persistence and effort into tasks at hand, however,
without executing these tasks with speed and meeting deadlines, this attention to detail does not
lead to efficiency. The goal of all organizations is to make profit through organizational
efficiency, where effective task performance is critical.” (Campbell, et al., 1990; as cited in
Williams, 2013, p. 4). The CAPTCHA task provides exactly that, a simple, novel task for
participants that focuses on accuracy and speed. Participants must decipher strings of letters and

42
numbers and use a keyboard to enter the characters into an on-screen text box. Participants are
given 5 minutes to attempt to decipher up to 75 unique letter/number strings while
simultaneously provided with real-time feedback on their accuracy and speed (as separate
percentages of correct responses and completed responses).
From a participant’s perspective, in order to decipher and respond to the string correctly,
they must: maintain focus on the string of scrambled and rotated letter/numbers, mentally
separate individual characters that are overlapping, mentally orient characters that may be
rotated, hold identified characters in their memory as they continue to unscramble more
characters in the string, process all or some of their identified characters for entry into the text
box, and finally translate mental images into keystrokes for entry. It is important to note that all
of this must be done with precision and speed as they attempt to decipher up to 75 strings in 5
minutes, which is likely impossible for the average participant. Further, the complexity and
difficulty of the strings of characters has been increased substantially from previous studies (i.e.,
Stermac-Stein, 2011, Williams, 2011).
Evaluating the nuanced features of the CAPTCHA task and the individual mental
processes that participants must undertake in order to attempt the task provides a framework for
understanding the overlay of the cognitive operations selected for this study. Moving through the
participants’ thoughts and behaviours during the task with a focus on cognitive operations
illustrates the applicability of both intelligence and Executive Functioning during the task: as the
individual maintains focus on the string and selects individual characters to decipher, they are
utilizing attentional processes of the brain. While they mentally separate individual characters
and orient those that have been rotated, they are utilizing selective attention and visual-spatial
ability. As they identify characters and begin to hold them in mental storage for later entry, they

43
are utilizing their working memory. When participants begin to process their characters for entry
into the textbox and begin typing the letters, they are utilizing their cognitive processing speed.
Throughout this process, individuals often mistake some letter for numbers, some numbers as
letters, some similar letters and other letters, and so on. In order to avoid incorrect identification
and entries, participants must utilize their response inhibition and impulse control in order to
correctly identify the character that may look similar to another. This, coupled with their overall
management and control of their cognitive processes, is done through their Executive
Functioning. This entire process, managed under the control of EF is done quickly and
efficiently. Participants average response rate per CAPTCHA string was 12.17 seconds. All of
the above processes and functions were done repeatedly in (roughly) 12 second intervals for up
to five minutes.
Participants completing the CAPTCHA task theoretically rely on the following cognitive
operations for performing the task: attention, working memory, visual-spatial ability, processing
speed, and executive function. These theoretical links informed the selection of cognitive tasks
for the study: the Ruff 2 & 7 (attention), Operation Span (working memory), Mental Rotation
Task (visual-spatial ability), Deary-Liewald Reaction Time (processing-speed), and the Stroop
task (executive function). Together, these tasks and their respective cognitive functions (among
others) comprise an overarching Executive Function ability that delineates and regulates
cognitive operations in the brain. However, previous evidence supports the ability of
psychometric g to predict performance on the CATPCHA task (Penner, 2012; Williams, 2013).
Therefore, what is driving performance on the CAPTCHA task, general intelligence or Executive
Functions control over individual cognitive operations?
44
Implications
This research provides insight into the underlying factors contributing to general
intelligence, Executive Function, and job performance. The knowledge gained from this research
has both theoretical and practical benefits. Theoretically, the research sheds new light on
psychometric g, addresses the cognitive ability research deficit in I-O, and acts as a catalyst for
further research into the cognitive underpinnings of intelligence. Furthermore, there are potential
implications for adverse impact and the understanding of individual differences.
Adverse impact is defined as, “…when the selection rate for a protected group is lower
than that for the relevant comparison group (which has the higher selection rate).” (Hackett,
Catano, & Wiesner, 2009, p. 88). Adverse impact is most often associated with the use of
psychometric intelligence tests in hiring and selection procedures. Current thinking on adverse
impact and intelligence testing focuses on the dominance of crystallized intelligence in current
psychometric intelligence tests, particularly the Wonderlic Personnel Test (Matthews & Lassiter,
2007). Crystallized intelligence is commonly thought of as the knowledge or information gained
through life and educational settings (Flanagan, McGrew, & Ortiz, 2000). Further, “crystallized
intelligence includes the ability of the individual to apply this acquired knowledge when faced
with problems. Usually, measures assessing crystallized intelligence employ language skills,
vocabulary, a degree of cultural and scientific knowledge and the ability to understand oral
communication.” (Bell, et al., 2002; as cited in Williams, 2013, p. 8).
An understanding of cognitive ability tests, the crystalized knowledge utilized in them,
and the adverse impact produced by them, provides critical implications for the domain of
research emphasized in this study. The examination of alternative forms of intelligence testing
(i.e., Executive Function) presents a potential solution to the problematic individual differences

45
seen in traditional psychometric g tests. Previous alternatives to traditional measures of
intelligence (e.g., Ravens Progressive Matrices) that attempt to focus more on fluid intelligence
(i.e., natural cognitive ability not influenced by learning, education, and life) have taken steps in
the right direction but ultimately fail to provide a solution devoid of adverse impact (Cook, 2009;
Hausdorf, LeBlanc, Chawla, 2003).
Investigation of cognitive focused measures of intelligence/ability testing for application
in the workplace is an avenue of research that is relatively unexplored (Scherbaum et al., 2012).
Cognitive tasks and Executive Functioning provide a potential solution that may be able to
reduce reliance on verbal and mathematical ability, thereby reducing crystallized intelligence,
focusing on cognitive abilities that are less susceptible to practice and education effects, reducing
adverse impact, and creating new avenues of test development in I/O Psychology.
The new avenue of test development for I/O Psychology will provide an alternative
approach to developing predictive validity measures for job performance. Focusing on
developing tests for the workplace around cognitive abilities and EF allows for more focused
selection and development. Understanding how specific cognitive operations are involved in
specific tasks, roles, and jobs will allow for more nuanced testing and insight. Rather than testing
for general mental ability, organizations using tests of specific and overarching cognitive
functions will be able to decrease adverse impact and increase performance through targeted
development programs focusing on specific cognitive functions.
Fundamentally, this research does not provided the evidence necessary to allow the
aforementioned implications to come to fruition, however, it does provide a starting ground in
which to launch further studies. Before discussing what future research may come out of this
investigation, it is important to consider the limitations of the present study and how they may

46
have affected the results.
Limitations
Several of the common limitations plaguing social science research are present in this
study. Utilization of an undergraduate student population at a major research university presents
generalizability concerns when discussing job performance in an organization. Further,
university students most likely possess higher than average intellect and ability due to the
entrance requirements of major Canadian universities. These students come from a Western,
Educated, Industrialized, Rich, and Democratic (WEIRD) population and global comparisons are
thus severely limited.
Further limitations are present in the design of the study. Having participants complete
cognitive tasks for credit in a laboratory environment may increase motivational confounds and
influence their ability and focus on the tasks. Moreover, having a battery of cognitive tests of
varying types may impact performance through mental exhaustion or selective effort. While the
order of tests was altered every session, all six participants in each session must complete the
battery in the same order due to administrative constraints. It was observed that some tests were
favoured heavily compared to others in terms of enjoyment (i.e., participants did not enjoy
completing the OSPAN task) which may impact directed effort.
Completing these tasks in a group environment may also influence participants who are
either competitive or weary of others seeing their scores. While participants were never given
information on others’ performance, the close environment may naturally influence their
perceptions of competition.
The lack of support for Hypothesis 2 is likely due to a multitude of factors. Several
issues are present with the selection of tasks and criterion. Most notably, the CAPTCHA task

47
may not have evoked a high enough level of complex cognitive functioning needed to establish a
significant relationship with Executive Function. While the CAPTCHA task utilizes a substantial
amount of lower level cognitive operations, the missing link with problem solving, reasoning,
planning, and flexibility may be limiting the amount of higher-order functioning typically
present in Executive Function. The selected cognitive tasks all play a fundamental role in
contributing to these higher-order operations but may not be utilized to their full extent during
the CAPTCHA task.
Further, the unsuitability of the Ruff 2 & 7 as a measure of attention in a work
performance context was a substantial factor in limiting the applicability of the results. While
previously discussed, the inability to extract predictive variance out of the only measure of pure
attentional processing severely limits the results of the study. Attention is thought to play a
critically important role in EF and overlap extensively with intelligent functioning (Coull, 1998).
Additionally, the CAPTCHA task is more related to typing ability than originally
thought. The single best predictor of the CAPTCHA task, by a large margin, is typing ability.
The lack of relationship between typing ability and psychometric g, means that there is no
overlap between the variance accounted for by typing ability and general intelligence. Therefore,
a large proportion of the variance in CAPTCHA performance in unaccounted for. Previous
research provides mixed results regarding motivation and its role in predicting CAPTCHA
performance (e.g., Stermac-Stein, 2011; Williams, 2011).
Most importantly, EF as a construct is not as clearly defined as general intelligence.
Therefore, the researcher utilized a definition of EF that fit best with the model of the research,
one that comprises solely cognitive tasks linked to the criterion variable. While EF is often
discussed in terms of attention and working memory, current thinking also includes higher-level

48
concepts such as problem solving, reasoning, planning, and execution (Chan et al., 2008).
Therefore, a partial content valid operationalization of EF might have limited the ability of EF to
predict performance. It is hard to extrapolate the influence of this limitation, as the CAPTCHA
criterion only allowed for g or EF to influence certain aspects of performance (i.e., deciphering
letters/numbers, holding them in memory, etc.).
Further limitations are present in domain of performance covered by the CAPTCHA task.
As the CAPTCHA only measures performance in a limited and specific task environment,
generalizability of performance across task and role domains is limited. It is believed that the
CAPTCHA task represents fundamental cognitive operations and abilities that are present in a
large proportion of tasks and work contexts, the limited scope of performance may not provide
the most adequate representation of performance on the job. This limitations provides ample
opportunity for future research through expansion of the performance domain.
Future Research
Further research is needed as EF presents an exciting pathway into exploring job
performance. Current knowledge on intelligence predicting work performance is focused solely
on using tasks that largely involve components of verbal and mathematical reasoning, which are
often thought to be highly influential in producing adverse impact. Executive Function provides
a potential solution by allowing “intelligence” as a predictor to be interpreted as purely cognitive
functioning. This side-stepping of general intelligence should allow for cleaner measurement as
it has the potential to ignore more social and environmental factors of learning and education
(i.e., crystallized intelligence) than do traditional measures of psychometric g.
Future research should seek to expand the performance domain in order to investigate the
domain of influence that EF can have when higher-order performance concepts are involved (i.e.,

49
reasoning and planning). Current research suggests that as jobs become more complex, general
intelligence is more predictive of performance (Hunter, 1984). Is it possible that at those high
levels of complexity, EF could be a better or cleaner predictor of performance? This current
research is limited as the complexity of the task is relatively low and requires very little high-
level processing in terms of executing successful performance on the task. Expansion of the
construct of work performance in the laboratory is a crucial step in moving this area of research
forward.
Future research should look towards expanding the performance domain in a laboratory
setting. Utilizing a complex performance domain opens the door to a wide variety of Executive
Functions that are not seen at the task level. Through incorporating a higher level of performance
objectives and behaviours (e.g., a sales interaction), the investigation of EF reaches the levels
seen by general intelligence. On an equal playing field, EF is theorized to have a substantial
effect on performance, through reasoning, planning, problem solving, decision making, and
complex thought processes (Chan et al., 2008).
Currently, the Raven’s Progressive Matrices (RPM) provides the highest-level and most
abstract measurement of general intelligence. However, at its core it can be thought of as pattern
recognition. Linking this style of thinking and measurement of intelligence is more difficult than
establishing a case for Executive Function, which can be thought of as the control centre of high-
level cognitive functioning.
Conclusion
This research aimed to investigate the most influential concepts in I-O psychology.
Further understanding of psychometric g and work performance is crucial to the progression and
advancement of these concepts and the field of I-O. Continued understanding of psychometric g

50
and the related aspects of Executive Function and its underlying cognitive functions will further
validate its relationship with job performance and continue to develop a deeper comprehension
of the key drivers of employee performance.
-

51
References
Ackerman, P. L., Beier, M. E., & Boyle, M. D. (2002). Individual differences in working
memory within a nomological network of cognitive and perceptual speed abilities. Journal
of Experimental Psychology: General, 131(4), 567–589. Doi:10.1037//0096-3445.131.4.567
Ackerman, P. L., Beier, M. E., & Boyle, M. O. (2005). Working memory and intelligence: the
same or different constructs? Psychological bulletin, 131(1), 30–60. Doi:10.1037/0033-
2909.131.1.30
Anderson, C. a., Lindsay, J. J., & Bushman, B. J. (1999). Research in the Psychological
Laboratory: Truth or Triviality? Current Directions in Psychological Science, 8(1), 3–9.
Doi:10.1111/1467-8721.00002
Baddeley, A. (2003). Working Memory : looking back and looking forward, 4.
Doi:10.1038/nrn1201
Bakker, A. B., & Demerouti, E. (2007). The Job Demands-Resources model: state of the art.
Journal of Managerial Psychology, 22(3), 309–328. Doi:10.1108/02683940710733115
Ball, K., Edwards, J. D., & Ross, L. A. (2007). The Impact of Speed of Processing Training on
Cognitive and Everyday Functions, 62(I), 19–31.
Barbey, A. K., Colom, R., Solomon, J., Krueger, F., Forbes, C., & Grafman, J. (2012). An
integrative architecture for general intelligence and executive function revealed by lesion
mapping. Brain. Doi:10.1093/brain/aws021
Baron, R. M., & Kenny, D. A. (1986). The moderator-mediator variable distinction in social
psychological research: conceptual, strategic, and statistical considerations. (E. Inc, Ed.)
Journal of Personality and Social Psychology, 51(6), 1173–1182. Retrieved from
http://www.ncbi.nlm.nih.gov/pubmed/3806354
Baum, J. R., Bird, B. J., & Singh, S. (2011). The Practical Intelligence of Entrepreneurs:
Antecedents and a Link With New Venture Growth. Personnel Psychology, 64(2), 397–425.
Doi:10.1111/j.1744-6570.2011.01214.x
Becker, J. T., & Morris, R. G. (1999). Working memory(s). Brain and cognition, 41(1), 1–8.
Doi:10.1006/brcg.1998.1092
Beier, M. E., & Ackerman, P. L. (2005). Working Memory and Intelligence: Different
Constructs. Reply to Oberauer et al. (2005) and Kane et al. (2005). Psychological Bulletin,
131(1), 72–75. Doi:10.1037/0033-2909.131.1.72

52
Bell, S. T. (2007). Deep-level composition variables as predictors of team performance: a meta-
analysis. Journal of Applied Psychology, 92(3), 595–615. Retrieved from
http://www.ncbi.nlm.nih.gov/pubmed/17484544
Berry, C. M., Clark, M. a, & McClure, T. K. (2011). Racial/ethnic differences in the criterion-
related validity of cognitive ability tests: a qualitative and quantitative review. The Journal
of Applied Psychology, 96(5), 881–906. Doi:10.1037/a0023222
Bertua, C., Anderson, N., & Salgado, J. F. (2005). The predictive validity of cognitive ability
tests: A UK meta-analysis. Journal of Occupational and Organizational Psychology, 78(3),
387–409. Doi:10.1348/096317905X26994
Blair, C. (2006). How similar are fluid cognition and general intelligence? A developmental
neuroscience perspective on fluid cognition as an aspect of human cognitive ability. The
Behavioral and Brain Sciences, 29(2), 109–25; discussion 125–60.
Doi:10.1017/S0140525X06009034
Boal, K. (2004). Strategic Leadership. Encyclopedia of Leadership.
Borman, W. C., & Motowidlo, S. J. (1993). Expanding the criterion domain to include elements
of contextual performance. In N. Schmitt, W. C. Borman, & Associates (Eds.), Personnel
selection in organizations: 71–98. San Francisco, CA: Jossey-Bass.
Borman, W. C., & Motowidlo, S. J. (1997). Task performance and contextual performance: The
meaning for personnel selection research. Human Performance, 10: 99–109.
Brody, N., (2003). Construct validation of the Sternberg Triarchic Abilities Test: comment and
reanalysis. Intelligence. 31(4).
Bub, D.N., (1999). Reflections on g and the brain: book review of Jensen on intelligence-g-
factor. Psycoloquy. 10(039).
Burns, N.R., (1999). Biological correlates of IQ scores do not necessarily mean that g exists:
book review of Jensen on intelligence-g-factor. Psycoloquy. 10(073).
Burns, N. R., Nettelbeck, T., & McPherson, J. (2009). Attention and Intelligence. Journal of
Individual Differences, 30(1), 44–57. Doi:10.1027/1614-0001.30.1.44
Caissie, A. F., Vigneau, F., & Bors, D. A. (2009). What does the Mental Rotation Test Measure?
An Analysis of Item Difficulty and Item Characteristics. The Open Psychology Journal,
2(1), 94–102. Doi:10.2174/1874350100902010094
Castejon, J. L., Perez, A. M., & Gilar, R. (2010). Confirmatory factor analysis of Project
Spectrum activities. A second-order g factor or multiple intelligences? Intelligence, 38(5),
481–496. Doi:10.1016/j.intell.2010.07.002

53
Carter C. S., van Veen V., (2007). Anterior cingulate cortex and conflict detection: an update of
theory and data. Cognition, Affective, and Behavioral Neuroscience 7 (4): 367–
79.doi:10.3758/CABN.7.4.367.
Chafetz, M. D. & Matthews, L. H. (2004). A new interference score for the Stroop test. Archives
of Clinical Neuropsychology. 19, 555-567.
Chan, R. C. K., Shum, D., Toulopoulou, T., Chen, E. Y. H., (2008). Assessment of executive
funcitons: review of instruments and identification of critical issues. Archives of Clinical
Neuropsychology, 23(2), 201-216.
Robinson-Riegler, G. L., Robinson-Riegler, B., (2003). Cognitive Psychology Applying the
Science of the Mind, 2nd Edition. Allyn and Bacon.
Colom, R., Abad, F. J., Quiroga, M. Á., Shih, P. C., & Flores-Mendoza, C. (2008). Working
memory and intelligence are highly related constructs, but why? Intelligence, 36(6), 584–
606. Doi:10.1016/j.intell.2008.01.002
Conway, A. R. A., Cowan, N., Bunting, M. F., Therriault, D. J., & Minkoff, S. R. B. (2002). A
latent variable analysis of working memory capacity, short-term memory capacity,
processing speed, and general fluid intelligence, 30, 163–183.
Cook, M., (2009). Personnel selection: adding value through people, 5th edition. Wiley-
Blackwell.
Daneman, M., & Carpenter, P. A. (1980). Individual differences in working memory and
reading. Journal of Verbal Learning and Verbal Behavior, 19(4), 450-466.
Dakin, S., & Armstrong, J. S. (1992). Predicting Job Performance : A Comparison of Expert
Opinion and Research Findings. University of Pennsylvania Scholarly Commons:
Marketing Papers, 5(2), 187–194.
Danthiir, V., Roberts, R. D., Schulze, R., & Wilhelm, O. (2005). Approaches to mental speed. In
O. Wilhelm, & R. W. Engle (Eds.), Understanding and measuring intelligence (pp. 27-46).
London: Sage.
Deary, I. J., Der, G., & Ford, G. (2001). Reaction time and intelligence differences: A population
based cohort study. Intelligence, 29, 389–399.
Deary, I. J., Johnson, W., & Houlihan, L. M. (2009). Genetic foundations of human intelligence.
Human genetics, 126(1), 215–32. Doi:10.1007/s00439-009-0655-4
Deary, I. J., Johnson, W., & Starr, J. M. (2010). Are processing speed tasks biomarkers of
cognitive aging? Psychology and aging, 25(1), 219–28. Doi:10.1037/a0017750

54
Deary, I. J., Liewald, D., & Nissan, J. (2011). A free, easy-to-use, computer-based simple and
four-choice reaction time programme: the Deary-Liewald reaction time task. Behavior
research methods, 43(1), 258–68. Doi:10.3758/s13428-010-0024-1
Deary, I. J., Penke, L., & Johnson, W. (2010). The neuroscience of human intelligence
differences. Nature reviews. Neuroscience, 11(3), 201–11. Doi:10.1038/nrn2793
Deutsch, G., Papanicolaou, A. C., Bourbon, W. T., & Eisenberg, H. M. (1987). Cerebral Blood
Flow Evidence of Right Frontal Activation in Attention Demanding Tasks. International
Journal of Neuroscience, 36, 23–28.
Dodrill, C. B. (1983). Long-term reliability of the Wonderlic Personnel Test. Journal of
Consulting and Clinical Psychology, 51, 316-317.
Dodrill, C. B., & Warner, M. H. (1988). Further studies of the Wonderlic Personnel Test as a
brief measure of intelligence. Journal of Consulting and Clinical Psychology, 56, 145-147.
Engle, R. W. (2002). Working Memory Capacity as Executive Attention. Current Directions in
Psychological Science, 11(1), 19–23.
Engle, R. W., Tuholski, S. W., Laughlin, J.E., & Conway, A. R. A., (1999). Working memory,
short-term memory and general fluid intelligence: a latent-variable approach. Journal of
Experimental Psychology: General, 128, 309-331.
Fein, E. C., & Day, E. A. (2004). The PASS theory of intelligence and the acquisition of a
complex skill: a criterion-related validation study of Cognitive Assessment System scores.
Personality and Individual Differences, 37(6), 1123–1136. Doi:10.1016/j.paid.2003.11.017
Fancher, R.E., (1999.) A Historian’s Look at the g Factor. Psycoloquy: 10(058)
Flanagan, D., McGrew, K. & Oritz, S. (2000). The Wechsler Intelligence Scales and the Gf- Gc
theory: A contemporary interpretive approach. Boston: Allyn and Bacon.
Flanagan, D. P., Ortiz, S. O., & Alfonso, V. C. (2007). Essentials of cross-battery assessment
(Vol. 51). Wiley.
Gatewood, R., Field, H., & Barrick M. (2011). Human resource selection (6th ed.). South-
Western College Publishers.
Gilbert, S. J., & Burgess, P. W. (2008). Executive function. Current biology : CB, 18(3), R110–
4. Doi:10.1016/j.cub.2007.12.014
Gottfredson, L. S. (2003a). Dissecting practical intelligence theory. Intelligence, 31(4), 343–397.
Doi:10.1016/S0160-2896(02)00085-5

55
Gottfredson, L. S. (2003b). g, jobs, and life. In H. Nyborg (Ed.), The scientific study of general
intelligence: Tribute to Arthur R. Jensen (pp. 293-342). New York: Pergamon.
Gottfredson, L. S. (2003c). On Sternberg’s “Reply to Gottfredson.” Intelligence, 31(4), 415-424.
Grudnik, J.L. & Kranzler, J.H. (2001). Meta-analysis of the relationship between intelligence and
inspection time. Intelligence, 29, 523-535.
Hackett, R. D., Catano, V. M., Wiesner, W. H., (2009). Recruitment and selection in Canada.
Nelson College Indigenous.
Hausdorf, P. A., LeBlanc, M. M., Chawla, A., (2003). Cognitive ability testing and employment
selection: does test content relate to adverse impact? Applied H. R. M. Research, 7(2), 41-
48.
Hausknecht, J. P., Halpert, J. a, Di Paolo, N. T., & Moriarty Gerrard, M. O. (2007). Retesting in
selection: a meta-analysis of coaching and practice effects for tests of cognitive ability. The
Journal of applied psychology, 92(2), 373–85. Doi:10.1037/0021-9010.92.2.373
Hegarty, M., & Kozhevnikov, M. (1999). Types of visual-spatial representations and
mathematical problem solving. Journal of Educational Psychology, 91(4), 684–689.
Doi:10.1037//0022-0663.91.4.684
Huffcutt, A. I., Roth, P. L., & McDaniel, M. a. (1996). A meta-analytic investigation of cognitive
ability in employment interview evaluations: Moderating characteristics and implications
for incremental validity. Journal of Applied Psychology, 81(5), 459–473.
Doi:10.1037//0021-9010.81.5.459
Hulsheger, U. R., Maier, G. W., & Stumpp, T. (2007). Validity of General Mental Ability for the
Prediction of Job Performance and Training Success in Germany : International Journal of
Selection and Assessment, 15(1).
Hunter, J. E., & Hunter, R. F. (1984). Validity and utility of alternative predictors of job
performance. Psychological Bulletin, 96(1), 72–98. Doi:10.1037//0033-2909.96.1.72
Hunter, J. E., Schmidt, F. L., & Le, H. (2006). Implications of direct and indirect range
restriction for meta-analysis methods and findings. The Journal of applied psychology,
91(3), 594–612. Doi:10.1037/0021-9010.91.3.594
Jensen, A. R. (1993). Why is Reaction Time Correlated with Psychometric g? Current
Directions in Psychological Science, 2(2), 53–56.
Jensen, A. R. (1984). Jensen oversimplified: A reply to Sternberg. Journal of Social and
Biological Structures, 7, 125-130.
Jensen, A. R. (1998). The g factor: The science of mental ability. Westport, CN: Praeger.

56
Jensen, A. R., Larson, G. E., & Paul, S. M. (1988). Psychometric g and Mental Processing Speed
on a Semantic Verification Test. Personality and Individual Differences, 9(2), 243–255.
Johnson, W., Jung, R. E., Colom, R., & Haier, R. J. (2008). Cognitive abilities independent of IQ
correlate with regional brain structure. Intelligence, 36(1), 18–28.
Doi:10.1016/j.intell.2007.01.005
Johnson, W., Nijenhuis, J. T., & Bouchard, T. J. (2008). Still just 1 g: Consistent results from
five test batteries. Intelligence, 36(1), 81–95. Doi:10.1016/j.intell.2007.06.001
Kail, R., & Salthouse, T. A. (1994). Speed as a mental capacity, Acta Psychologica. 86, 199–
225.
Kane, H., & Brand, C. (1905). The importance of Spearman’s g. The Occidental Quarterly, 3(1),
7–30.
Kane, M. J., & Engle, R. W. (2003). Working memory capacity and the control of attention: The
contributions of goal neglect, response competition, and task set to Stroop
interference. Journal of Experimental Psychology: General, 132, 47-70.
Kanfer, R., & Ackerman, P. L. (1989). Motivation and cognitive abilities: An
integrative/aptitude treatment interaction approach to skill acquisition. Journal of Applied
Psychology, 74(4), 657–690. Doi:10.1037//0021-9010.74.4.657
Kramer, J. (2009). Allgemeine Intelligenz und beruflicher Erfolg in Deutschland. Psychologische
Rundschau, 60(2), 82–98. Doi:10.1026/0033-3042.60.2.82
Kristof-Brown, A. L., Zimmerman, R. D., & Johnson, E. C. (2005). Consequences of
Individuals’ Fit At Work: a Meta-Analysis of Person-Job, Person-Organization, Person-
Group, and Person-Supervisor Fit. Personnel Psychology, 58(2), 281–342.
Doi:10.1111/j.1744-6570.2005.00672.x
Lang, J. W. B. (2010). General mental ability, narrower cognitive abilities, and job performance :
the perspective of the nested-factors, 595–640.
Lohman, D. F. (1993). Spatial Ability and G. Spearman Seminar – University of Plymouth.
Luciano, M., Gow, A. J., Harris, S. E., Hayward, C., Allerhand, M., Starr, J. M., Visscher, P. M.,
et al. (2009). Cognitive ability at age 11 and 70 years, information processing speed, and
APOE variation: the Lothian Birth Cohort 1936 study. Psychology and aging, 24(1), 129–
38. Doi:10.1037/a0014780
Mackie, R. K. (2005). Multiple intelligences and graphic design ability in five north 56sycholo
community colleges. Dissertation, 1–120.

57
Maier, W., & Stumpp, T. (2007). Validity of General Mental Ability for the Prediction of Job
Performance and Training Success in Germany : International Journal of Selection and
Assesment, 15(1).
Makeig, S., Westerfield, M., Townsend, J., Jung, T. P., Courchesne, E., & Sejnowski, T. J.
(1999). Functionally independent components of early event-related potentials in a visual
spatial attention task. Philosophical transactions of the Royal Society of London. Series B,
Biological sciences, 354(1387), 1135–44. Doi:10.1098/rstb.1999.0469
Mann, C. (2011). Cognitive ability and job performance in a New Zealand service organization.
Dissertation — Massey University, 1(1), 1–159.
Matthews, T. D. & Lassiter, K. S. (2007). Does the Wonderlic Personnel Test measure Gf or Gc?
Psychological Reports, 100, 707-712.
May, C.P., & Hasher, L. (1998). Synchrony effects in inhibitory control over thought and action.
Journal of Experimental Psychology: Human Perception and Performance, 24, 363-379.
McDonald, R.P. (1985). Factor Analysis and Related Methods. Hillsdale NJ: Erlbaum.
McKelvie, S. J. (1989). The Wonderlic Personnel Test: Reliability and validity in an academic
setting. Psychological Reports, 65, 161–162.
McGrew, K.S., (2005). The Cattell-Horn-Carroll Theory of Cognitive Abilities: Past, Present,
and Future. Flanagan, Dawn P. (Ed); Harrison, Patti L. (Ed). Contemporary Intellectual
Assessment: Theories, Tests, and Issues. (pp. 136-181). New York, NY, US: Guilford Press,
xvii, 667.
McGrew, K. S. (2009). CHC theory and the human cognitive abilities project: Standing on the
shoulders of the giants of psychometric intelligence research. Intelligence, 37(1), 1–10.
Doi:10.1016/j.intell.2008.08.004
Mead, A. D., & Drasgow, F. (1993). Equivalence of Computerized and Paper-and-Pencil
Cognitive Ability Tests: A Meta-Analysis. Psychological Bulletin, 114(3), 449–458.
Doi:10.1037//0033-2909.114.3.449
Mettrie, L. (2000). Cognitive Psychology, (July), 537–550.
Molenaar, D., Dolan, C. V., Wicherts, J. M., & van der Maas, H. L. J. (2010). Modeling
differentiation of cognitive abilities within the higher-order factor model using moderated
factor analysis. Intelligence, 38(6), 611–624. Doi:10.1016/j.intell.2010.09.002
Mount, M. K., Oh, in-S., & Burns, M. (2008a). Incremental validity of perceptual speed and
accuracy over general mental ability. Personnel Psychology, 61(1), 113–139.
Doi:10.1111/j.1744-6570.2008.00107.x

58
Mount, M. K., Oh, I., & Burns, M. (2008b). Incremental validity of perceptual speed and
accuracy over general mental ability, 113–139.
Murphy, K. R., Cronin, B. E., & Tam, A. P. (2003). Controversy and consensus regarding the
use of cognitive ability testing in organizations. Journal of Applied Psychology, 88(4), 660–
671. Doi:10.1037/0021-9010.88.4.660
Neisser, U., Boodoo, G., Bouchard, T. J., Jr., Boykin, a. W., Brody, N., Ceci, S. J., Halpern, D.
F., et al. (1996). Intelligence: Knowns and unknowns. American Psychologist, 51(2), 77–
101. Doi:10.1037//0003-066X.51.2.77
Newsom, (2012). Improper Solutions in SEM. Structural Equiation Modeling. Retrieved from:
www.upa.pdx.edu/IOA/newsom/semclass/ho_improper.pdf on December 4, 2013.
Nisbett, R. E., Aronson, J., Blair, C., Dickens, W., Flynn, J., Halpern, D. F., & Turkheimer, E.
(2012). Intelligence: New findings and theoretical developments. The American
psychologist, 67(2), 130–59. Doi:10.1037/a0026699
Nyborg, H., & Jensen, A. R. (2001). Occupation and income related to psychometric g.
Intelligence, 29(1), 45–55. Doi:10.1016/S0160-2896(00)00042-8
Oberauer, K, Su, H., Schulze, R., Wilhelm, O., & Wittmann, W. W. (2000). Working memory
capacity facets of a cognitive ability construct. Personality and Individual Differences, 29,
1017–1045.
Oberauer, Klaus, Schulze, R., Wilhelm, O., & Süss, H.-M. (2005). Working memory and
intelligence—their correlation and their relation: comment on Ackerman, Beier, and Boyle
(2005). Psychological bulletin, 131(1), 61–5; author reply 72–5. Doi:10.1037/0033-
2909.131.1.61
Owen, A. M., McMillan, K. M., Laird, A. R., & Bullmore, E. (2005). N-back working memory
paradigm: a meta-analysis of normative functional neuroimaging studies. Human brain
mapping, 25(1), 46–59. Doi:10.1002/hbm.20131
Partridge, T., (1999). The g factor and the role of biology in complex behavior: book review of
Jensen on intelligence-g-factor. Psycoloquy. 10(060).
Pearlman, K., & Barney, M. F. (2000). Selection for a changing workplace. In J. F. Kehoe (Ed.),
Managing selection in changing organizations: Human resource strategies (pp. 3-72). San
Francisco, CA: Jossey-Bass.
Penner, E. (2012). Investigating the Impact of Cognitive Ability and Motivation on Task
Performance. Unpublished honours thesis. Guelph, Ontario: University of Guelph.
Pinker, S. (1984). Visual cognition: an introduction. Cognition, 18(1-3), 1–63. Retrieved from
http://www.ncbi.nlm.nih.gov/pubmed/6396030

59
Posner, M. (1989). The Attention System of the Brain. DTIC.
Preacher, K. J., & Hayes, A. F. (2008). Asymptotic and resampling strategies for assessing and
comparing indirect effects in multiple mediator models. Behavior Research Methods, 40,
879-891.
Raven, J. (2000). The Raven’s progressive matrices: change and stability over culture and time.
Cognitive psychology, 41(1), 1–48. Doi:10.1006/cogp.1999.0735
Risavy, S. (2010). Predicting task-specific performance: An integration and extension of the
theory of planned behavior and trait activation theory. PhD Dissertation. Guelph, Ontario:
University of Guelph.
Roberts, R. D., Pallier, G., & Goff, G. N. (1998). Processes within the structure.
Rohde, T. E., & Thompson, L. A. (2007). Predicting academic achievement with cognitive
ability. Intelligence, 35(1), 83–92. Doi:10.1016/j.intell.2006.05.004
Salgado, J., & Anderson, N. (2003). Validity generalization of GMA tests across countries in the
European Community. European Journal of Work and Organizational Psychology, 12(1),
1–17.
Salgado, Jesus F, Anderson, N., Moscoso, S., Bertua, C., & de Fruyt, F. (2003). International
Validity Generalization of GMA and Cognitive Abilities: A European Community Meta-
Analysis. Personnel Psychology, 56, 573–605.
Salgado, Jesús F, Anderson, N., Moscoso, S., Bertua, C., de Fruyt, F., & Rolland, J. P. (2003). A
meta-analytic study of general mental ability validity for different occupations in the
European community. The Journal of applied psychology, 88(6), 1068–81.
Doi:10.1037/0021-9010.88.6.1068
Scherbaum, C. A., Goldstein, H. W., Yusko, K. P., Ryan, R., & Hanges, P. J. (2012). Intelligence
2.0: Reestablishing a Research Program on g in I-O Psychology. In press.
Schmidt, F. L. (2002). The Role of General Cognitive Ability and Job Performance: Why There
Cannot Be a Debate. Human Performance, 15(1-2), 187–210.
Doi:10.1080/08959285.2002.9668091
Schmidt, F. L., & Hunter, J. (2004). General mental ability in the world of work: occupational
attainment and job performance. Journal of personality and social psychology, 86(1), 162–
73. Doi:10.1037/0022-3514.86.1.162
Schmidt, F. L., & Hunter, J. E. (1992). Development of a Causal Model of Processes
Determining Job Performance. Current Directions in Psychological Science, 1(3), 89–92.
Doi:10.1111/1467-8721.ep10768758

60
Schmidt, F. L., & Hunter, J. E. (1998). The Validity and Utility of Selection Methods in
Personnel Psychology : Practical and Theoretical Implications of 85 Years of Research
Findings, 124(2), 262–274.
Schmidt, F. L., Hunter, J. E., & Outerbridge, A. N. (1986). Impact of Job Experience and Ability
on Job Knowledge , Work Sample Performance , and Supervisory Ratings of Job
Performance, 71(3), 432–439.
Schmitt, N., Gooding, R. Z., Noe, R. a., & Kirsch, M. (1984). Meta-analyses of Validity Studies
Published Between 1964 and 1982 and the Investigation of Study Characteristics. Personnel
Psychology, 37(3), 407–422. Doi:10.1111/j.1744-6570.1984.tb00519.x
Semendeferi, K., Armstrong, E., Schleicher, A., Zilles, K., &Van Hoesen, G. W. (2001).
Prefrontal cortex in humans and apes: a comparative study of area 10. Am. J. Phys.
Anthropol.,114, 224–41.
Shelton, J. T., Elliott, E. M., Matthews, R. a, Hill, B. D., & Gouvier, W. D. (2010). The
relationships of working memory, secondary memory, and general fluid intelligence:
working memory is special. Journal of experimental psychology. Learning, memory, and
cognition, 36(3), 813–20. Doi:10.1037/a0019046
Sonnentag, S. (2002). Chapter 1 Performance Concepts.
Spearman, C. (1904). “General Intelligence,” Objectively Determined and Measured. The
American Journal of Psychology, 15(2), 201–292.
Spreen, O., & Strauss, E., Sherman, E.M.S., (2006). A compendium of neuropsychological tests:
administration, norms, and commentary. Oxford University Press. 477–499.
Sternberg, R. J., & Kaufman, J. C. (1998). Human abilities. Annual review of psychology, 49,
479–502. Doi:10.1146/annurev.psych.49.1.479
Strauss, G. P., Allen, D.N., Jorgensen, M.L., Cramer, S.L., Test-retest reliability of standard and
emotional stroop tasks: an investigation of color-word and picture-word versions.
Assessment.12(3), 330-337.
Stroop, J.R., (1935). Studies of interference in serial verbal reactions. Journal of Experimental
Psychology 18 (6): 643–662.
Tabachnick, B. G., & Fidell, L. S. (2001). Computer-assisted research design and analysis.
Boston: Allyn & Bacon.
Tan, U., (1999). Demystifying g: book review of Jensen on intelligence-g-factor. Psycoloquy.
10(048).

61
Theeuwes, J., Kramer, A. F., & Irwin, D. E. (2011). Attention on our mind: the role of spatial
attention in visual working memory. Acta 61sychological, 137(2), 248–51.
Doi:10.1016/j.actpsy.2010.06.011
Turner, M. L., & Engle, R. W. (1989). Is working memory capacity task dependent? Journal of
Memory and Language, 28(2), 127–154. Doi:10.1016/0749-596X(89)90040-5
Van Essen D.C., & Dierker, D.L., (2007). Surface-based and probabilistic atlases of primate
cerebral cortex. Neuron. 56 (2): 209-25.
Verleger, R., (1999). The g factor and event-related eeg potentials: book review of Jensen on
intelligence-g-factor. Psycoloquy. 10(039).
Vinchur, A. J., Schippmann, J. S., Switzer, F. S., Iii, & Roth, P. L. (1998). A meta-analytic
review of predictors of job performance for salespeople. Journal of Applied Psychology,
83(4), 586–597. Doi:10.1037//0021-9010.83.4.586
Wang, Y., & Chiew, V. (2010). On the cognitive process of human problem solving. Cognitive
Systems Research, 11(1), 81–92. Doi:10.1016/j.cogsys.2008.08.003
Wang, Y., Member, S., Wang, Y., Patel, S., & Patel, D. (2006). A Layered Reference Model of
the Brain (LRMB), 36(2), 124–133.
Wanzel, K. R., Hamstra, S. J., Caminiti, M. F., Anastakis, D. J., Grober, E. D., & Reznick, R. K.
(2003). Visual-spatial ability correlates with efficiency of hand motion and successful
surgical performance. Surgery, 134(5), 750–757. Doi:10.1016/S0039-6060(03)00248-4
Weinstein, J., Gaultney, J.F., Kipp, K., & McNeill, J. (1999). Inhibition and mental effort in
attention deficit hyperactivity disorder. Journal of Developmental and Physical Disabilities,
West, S. G., Aiken, L. S., & Krull, J. L. (1996). Experimental personality designs: Analyzing
categorical by continuous variable interactions. Journal of Personality, 64, 1–49.11, 105–
114.
Willcutt, E. G., Doyle, A. E., Nigg, J. T., Faraone, S. V., & Pennington, B. F. (2005). Validity of
the Executive Function Theory of Attention- Deficit / Hyperactivity Disorder : A Meta-
Analytic Review. Doi:10.1016/j.biopsych.2005.02.006
Williams, E. (2013. What’s Better: Being Smarter or More Motivated? Predicting Task
Performance. Unpublished honours thesis. Guelph, Ontario: University of Guelph.
Williams, A. M.(2011). Goal-Setting and Task Performance: Understanding the Impact of
Multiple Competing Goals and Conscientiousness Facets. Unpublished honours thesis.
Guelph, Ontario: University of Guelph.
Wright, D. E., & Dennis, I. A. N. (1996). The Speed-Accuracy Trade-Off.

62
Zhang, J.-P., Burdick, K. E., Lencz, T., & Malhotra, A. K. (2010). Meta-analysis of genetic
variation in DTNBP1 and general cognitive ability. Biological psychiatry, 68(12), 1126–33.
Doi:10.1016/j.biopsych.2010.09.016
Ziegler, M., Dietl, E., Danay, E., Vogel, M., & Buhner, M. (2011). Predicting Training Success
with General Mental Ability, Specific Ability Tests, and (Un) Structured Interviews : A
meta-analysis with unique samples. International Journal of Selection and Assessment,
19(2).

63
Appendix of Tables
Table 1. Computation of Variables
Variable Name Computation
WPM Total words per minute as reported by website task
WPT Raw psychometric g score provided by Wonderlic
RT (CorrMean) Average response time of correct responses in Four-Choice
Reaction Time Task
CAPTCHA Multiplicative of participant’s speed and accuracy percentage
data on CAPTCHA task
MRT Sum of total correct responses on Mental Rotation Task as
provided by scoring instructions
OSPAN Multiplication of participants sum score on words and sum
score on operations
RUFF Overall attention performance score as provided by Ruff 2 &
7 scoring instructions
STROOP Difference in response time between congruent and
incongruent trials

64
Table 2. Descriptive Statistics
Variable N Minimum Maximum Mean Std. Deviation Skewness
Age 94 17.0 31.0 19.13 1.76 3.64
PTY 94 0.0 14.0 2.39 2.64 1.47
FTY 94 0.0 7.0 0.56 1.43 2.96
WPM 94 14.00 96.00 44.45 17.21 1.05
WPT 94 13.0 30.0 22.52 3.78 -0.14
RT 94 -555.0 -303.0 -399.48 57.58 1.22
MRT 94 9.0 45.00 28.34 9.09 -0.37
RUFF 94 55.44 478.82 245.37 83.16 1.08
OSPAN 94 88.00 1110.0 505.53 254.06 0.59
STROOP 94 -647.0 69.0 -285.41 172.49 0.85
CAPTCHA 94 533.40 3333.64 2039.73 594.32 0.03
PTY = Part-Time Years Work Experience, FTY = Full-Time Years Work Experience, WPM = Words Per Minute, WPT = Wonderlic
Personnel Test Pre-Test, RT = Deary-Liewald Reaction Time task, MRT = Mental Rotation Task, RUFF = Ruff 2 & 7 Selective
Attention Test, OSPAN = Operation Span Task, STROOP = Hanover Stroop Task, STRESS = Post-Hoc Measure of Stress,
CAPTCHA = CAPTCHA Task

65
Table 3. Correlations
Variable Gender Age PTY FTY WPM WPT RT MRT RUFF OSPAN STROOP STRESS
PTY -- .395**
FTY -- .579** 0.116
WPM -.072 -.133 -0.030 0.162
WPT .200 -.182 -0.106 .208* .072
RT .377** .053 -0.019 0.028 .129 .225*
MRT .406** -.140 -0.026 0.110 -.023 .218* .373** .900
RUFF .149 .141 0.128 .167* .065 -.009 .263* .133 .930
OSPAN .224* -.207* .240** 0.123 .021 .476** .312** .211* .160 .870
STROOP .002 .032 0.013 0.158 .105 .046 .188 .051 .167 .116
STRESS -- -.047 -0.091 0.098 .082 .084 -.107 .013 -.207* -.075 .116
CAPTCHA -.051 -.138 -.140 .140 .468** .277** .147 .184 .107 ..309** .122 .066
** Correlation is significant at the 0.01 level (1-tailed). * Correlation is significant at the 0.05 level (1-tailed).
Values along the diagonal represent reliability (Cronbach’s alpha). PTY = Part-Time Years Work Experience, FTY = Full-Time Years Work Experience,
WPM = Words Per Minute, WPT = Wonderlic Personnel Test Pre-Test, RT = Deary-Liewald Reaction Time task, MRT = Mental Rotation Task, RUFF =
Ruff 2 & 7 Selective Attention Test, OSPAN = Operation Span Task, STROOP = Hanover Stroop Task, STRESS = Post-Hoc Measure of Stress,
CAPTCHA = CAPTCHA Task

66
Table 4. Exploratory Factor Analysis without Covariate and Criterion
Factor
Variable 1 2
WPT .866 -.277
RT .445 .505
MRT .491 .239
OSPAN .779 .008
RUFF -.074 .769
STROOP -.076 .640
Table 5. Exploratory Factor Analysis of All Variables
Factor
Variables 1 2 3
WPM .888 -.165 .115
WPT .106 .823 -.276
RT -.043 .428 .536
CAPTCHA .757 .278 .015
MRT -.188 .551 .262
OSPAN .052 .768 -.002
RUFF .000 -.058 .762
STROOP .192 -.125 .611
Table 6. Exploratory Factor Analysis of All Variables Restricted to Two Factors
Factor
Variables 1 2
WPM -.172 .900
WPT .587 .117
RT .708 -.010
CAPTCHA .191 .775
MRT .677 -.165
OSPAN
RUFF
STROOP
.700
.387
.220
.073
.031
.218

67
Table 7. Measurement Models
Model Name CMIN/DF P GFI AGFI CFI PCFI PCLOSE RMSEA AIC BIC CHISQUARE
General fit rules >.05 >.95 >.80 >.90 >.05 <.05 < 3
1. CFA: 1 Factor with WPT 1.547 0.125 0.95 0.883 0.922 0.553 0.255 0.077 37.926 68.445 13.926
2. CFA: 1 Factor without
WPT
0.594 0.705 0.988 0.963 1 0.5 0.795 0 22.968 48.401 2.968
3. CFA: 2 Factor from EFA
(covary)
0.704 0.688 0.98 0.947 1 0.533 0.807 0 31.636 64.699 5.636
4. CFA: 2 Factor (3 each) 0.981 0.448 0.973 0.928 1 0.533 0.611 0 33.849 66.912 7.849
5. CFA: All variables under
1 factor
2.269 0.001 0.897 0.815 0.752 0.537 0.011 0.117 77.38 118.073 45.38
6. CFA: All variables under
2 factors
1.477 0.082 0.932 0.872 0.911 0.618 0.245 0.072 62.072 105.308 28.072
7. CFA: All variables in 3
factors (from EFA)
1.16 0.289 0.954 0.904 0.973 0.591 0.527 0.041 57.712 106.034 19.72
Chi-square difference test for Model 1 (df = 9) and 2 (df = 5) = 10.992, df = 4, p = .027
Chi-square difference test for Model 1 (df = 9) and 3 (df = 8) = 8.29, df = 1, p = .004
Chi-square difference test for Model 5 (df = 20) and 6 (df = 19) = 17.308, df = 1, p = .000
Chi-square difference test for Model 6 (df = 19) and 7 (df = 17) = 8.352, df = 2, p = .015

68
Table 8. Path Models
Model Number CMIN/DF P GFI AGFI CFI PCFI PCLOSE RMSEA AIC BIC CHISQUARE
General fit rules >.05 >.95 >.80 >.90 >.05 <.05 < 3
SEM Model 1 2.494 0 0.895 0.811 0.708 0.506 0.004 0.127 81.887 122.579 49.887
SEM Model 2 1.578 0.052 0.929 0.865 0.893 0.606 0.181 0.079 63.983 107.219 29.983
SEM Model 3 1.504 0.068 0.928 0.87 0.901 0.515 0.222 0.074 62.089 102.781 30.089
SEM Model 4 (2 factor-2vs3each) 1.952 0.008 0.916 0.84 0.823 0.559 0.048 0.101 71.09 114.326 37.09

Appendix A: Information/Consent Form
Consent to Participate in Research
Title of Project: CAPTCHA Task Study
You are asked to participate in a research study conducted by Jonathan Stermac-Stein and Dr. Peter Hausdorf, from the Department of Psychology at the University of Guelph. The results will be contributed to Jonathan’s Master’s thesis research. If you have any questions or concerns about the research, please feel free to contact either Jonathan Stermac-Stein ([email protected]) or Dr. Peter Hausdorf (519.824.4120 x53976; [email protected]). PURPOSE OF THE STUDY The main purpose of this study is to understand performance on cognitive tasks and the CAPTCHA (Completely Automated Public Turing test to tell Computers and Humans Apart) task. The CAPTCHA task involves deciphering a string of distorted letter and numbers and inputting them into a computerized text box. PROCEDURES If you volunteer to participate in this study, we would ask you to do the following things:
1) Read a description about a new laboratory task (i.e., the CAPTCHA task), 2) Answer questions about yourself and the CAPTCHA task 3) Complete six cognitive-based tasks, and 4) Complete the CAPTCHA task.
Please note that participation will take no longer than 120 minutes. POTENTIAL RISKS AND DISCOMFORTS The questions asked and the tasks are innocuous and there are no reasonably foreseeable risks, discomforts, and/or inconveniences associated with the current study. POTENTIAL BENEFITS TO PARTICIPANTS AND/OR TO SOCIETY

70
Participants will learn about laboratory research methods in general and specifically, psychological research. You may not benefit from participating in this study. Regarding the scientific community, this study may help to redress a gap in the industrial and organizational psychology literature. Please note that the results will not be made available to participants while completing the study, as the tasks require further scoring in order to produce a meaningful result. Participants are asked to email the researchers if they wish to receive their results once they have been scored. Participants who wish to receive information regarding the final results of the research study may contact the researchers and will be notified when they are available. PAYMENT FOR PARTICIPATION As a participant in this study you will receive one participation credit. CONFIDENTIALITY Every effort will be made to ensure confidentiality of any identifying information that is obtained in connection with this study. All data will be stored for seven years without identifying information. Identifying information will be immediately destroyed following participation in this study. Your unique ID number will be stored instead and any link of your information to your ID number will be removed completely. Data will be stored in a locked filing cabinet within a locked room. Electronic data will be stored on password-protected computers that are locked within a room. Data will not be shared with anyone other than in an aggregated format so as to not reveal individual participant information. PARTICIPATION AND WITHDRAWAL You can choose whether to be in this study or not. If you volunteer to be in this study, you may withdraw at any time without consequences of any kind (participants will still get course credit if they withdraw). You may exercise the option of removing your data from the study (by letting the researchers know of your decision). You may also refuse to answer any questions you don’t want to answer and still remain in the study. The investigator may withdraw you from this research if circumstances arise that warrant doing so. If you volunteer to be in this study, you may withdraw at any time (simply inform the experimenter). RIGHTS OF RESEARCH PARTICIPANTS . You are not waiving any legal claims, rights, or remedies because of your participation in this research study. This study has been reviewed and received ethics clearance through the University of Guelph Research Ethics Board. If you have questions regarding your rights as a research participant and/or the use and safety of human subjects in this research project, contact:
Research Ethics Coordinator Telephone: (519) 824-4120, ext. 56606

71
University of Guelph Email: [email protected] 437 University Centre Fax: (519) 821-5236 Guelph, ON N1G 2W1
Thanks for considering to participate in our study! Jonathan Stermac-Stein [email protected] Department of Psychology University of Guelph
Dr. Peter Hausdorf [email protected] Department of Psychology University of Guelph
SIGNATURE OF RESEARCH PARTICIPANT
I have read the information provided for the study “CAPTCHA Task Study” as described herein. My questions have been answered to my satisfaction, and I agree to participate in this study. I have been given a copy of this form. ______________________________________ Name of Participant (please print) ______________________________________ ______________ Signature of Participant Date SIGNATURE OF WITNESS
______________________________________ Name of Witness (please print) ______________________________________ _______________ Signature of Witness Date [The witness is ideally NOT the investigator, but if there is no readily available alternative, the investigator can act as witness.]

72
Appendix B – Test Materials
Participant ID Number: ___________________
Please respond to the following questions.
General Demographic Questions: 1) What is your sex? ______ Female ______ Male _____ Other 2) How old are you? ______ (in years) 3) How much part-time work experience do you have? ______ Years, ______ Months 4) How much full-time work experience do you have? ______ Years, ______ Months Typing Test (10 Fast Fingers) What was your Words Per Minute (WPM) result? ____________ How many correct words? ____________ How many wrong words? ____________ What is your percentile score (percentage better than)? _____________ Stroop Experiment 1. Condition: XXX Coloured Stroop RT: ___________ Stroop Accuracy: ___________ 2. Condition: Congruent Words Stroop RT: ___________ Stroop Accuracy: ___________

73
3. Condition: Incongruent Words
Stroop RT: ___________ Stroop Accuracy: ___________ Operation Span
Write T or F for each presented equation. Each set represents several slides, therefore, you must write across, not down. When prompted, write the words below.
Practice Trial Set (T/F): Words:
ACTUAL TRIALS SET 1: SET 6: WORDS: WORDS: SET 2: SET 7: WORDS: WORDS: SET 3: SET 8: WORDS: WORDS: SET 4: SET 9: WORDS: WORDS: SET 5: SET 10: WORDS: WORDS:
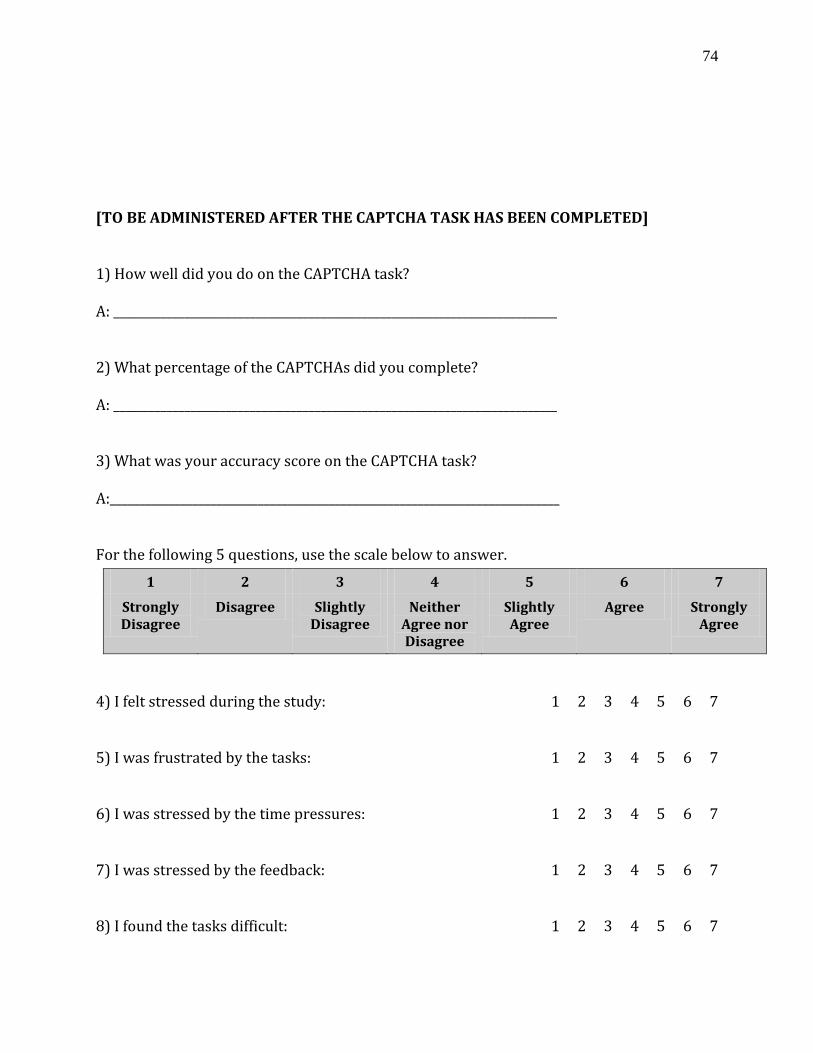
74
[TO BE ADMINISTERED AFTER THE CAPTCHA TASK HAS BEEN COMPLETED] 1) How well did you do on the CAPTCHA task? A: ___________________________________________________________________________ 2) What percentage of the CAPTCHAs did you complete? A: ___________________________________________________________________________ 3) What was your accuracy score on the CAPTCHA task? A:____________________________________________________________________________ For the following 5 questions, use the scale below to answer.
4) I felt stressed during the study: 1 2 3 4 5 6 7 5) I was frustrated by the tasks: 1 2 3 4 5 6 7 6) I was stressed by the time pressures: 1 2 3 4 5 6 7 7) I was stressed by the feedback: 1 2 3 4 5 6 7 8) I found the tasks difficult: 1 2 3 4 5 6 7
1 2 3 4 5 6 7
Strongly Disagree
Disagree Slightly Disagree
Neither Agree nor Disagree
Slightly Agree
Agree Strongly Agree

75
9) I enjoyed the tasks: 1 2 3 4 5 6 7
Appendix C – Cognitive Tasks
General test of typing speed
The 10 Fast Fingers online typing test will be used to assess participants’ typing speed as
a measure of both computer familiarity and speed at which they will be able to enter the
CAPTCHA letters and numbers. The typing test can be found online at:
http://10fastfingers.com/typing-test/english
The following is a screenshot of the test.
Wonderlic Personnel Test – General Mental Ability (g)
Participants’ GMA will be assessed using the WPT, a valid measure of cognitive ability
(Dodrill & Warner, 1988; McKelvie, 1989). Wonderlic data shows adequate internal
consistency, ranging from .88 to .94, outside data sources ranging from .83 to .89, and test-retest
reliability range from .82 to .94 (McKelvie, 1989; Wonderlic Inc., 1992). As a timed, online test,
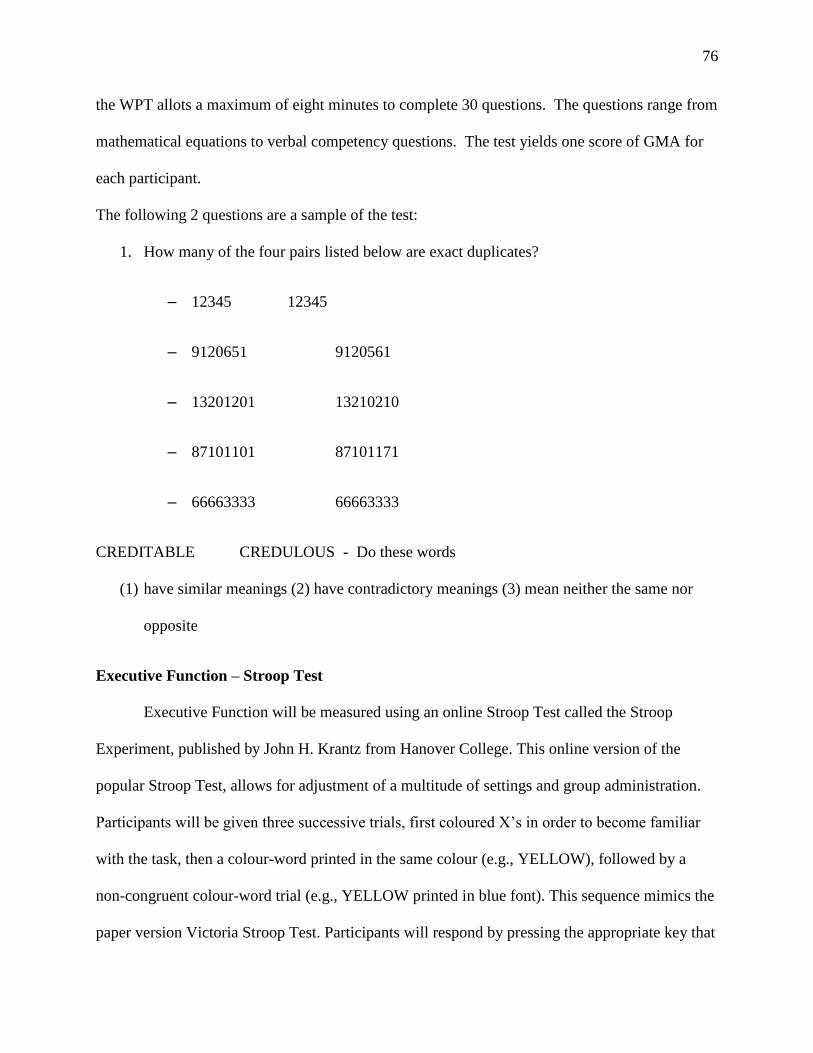
76
the WPT allots a maximum of eight minutes to complete 30 questions. The questions range from
mathematical equations to verbal competency questions. The test yields one score of GMA for
each participant.
The following 2 questions are a sample of the test:
1. How many of the four pairs listed below are exact duplicates?
– 12345 12345
– 9120651 9120561
– 13201201 13210210
– 87101101 87101171
– 66663333 66663333
CREDITABLE CREDULOUS - Do these words
(1) have similar meanings (2) have contradictory meanings (3) mean neither the same nor
opposite
Executive Function – Stroop Test
Executive Function will be measured using an online Stroop Test called the Stroop
Experiment, published by John H. Krantz from Hanover College. This online version of the
popular Stroop Test, allows for adjustment of a multitude of settings and group administration.
Participants will be given three successive trials, first coloured X’s in order to become familiar
with the task, then a colour-word printed in the same colour (e.g., YELLOW), followed by a
non-congruent colour-word trial (e.g., YELLOW printed in blue font). This sequence mimics the
paper version Victoria Stroop Test. Participants will respond by pressing the appropriate key that

77
matches the colour of the word or font (e.g., “b” for BLUE or YELLOW printed in blue font,
depending on the trial). Each trial will be 20 items and be completed as fast as possible.
Participants will be presented with information on the last screen, which will need to be recorded
onto a separate sheet of paper. This information will be used to determine their score/result on
this task, and does not in itself constitute their score on the task. The results of this task and all
other tasks will be provided to participants who email the researcher following their
participation. The Stroop Test correlates moderately with other measures of response inhibition
(the key facet of Executive Function); Chafetz & Matthew, 2004; May & Hasher, 1998). This
task utilized three task trial sections, making it substantially shorter than the 100+ item versions
of the test that are often used, yet is more sensitive to difficulties in response inhibition (a key
facet of EF; Klein et al., 1997). Used as a tool in the measure of EF, Stroop tests consistently see
activation in the frontal lobe during participation in the task (the neuroanatomical location of
executive functioning; Spreen et al., 2006; Carter & van Veen, 2007). It also correlates with
some measures of attention and working memory, however, this is to be expected as executive
function is thought to regulate and control lower level cognitive processes (Weinstein et al.,
1999; Kane & Engle, 2003).

78
Attention – Selective attention test
Attention will be measured by a created selective attention test. It will take 5 minutes to
administer. It will measure both sustained and selective attention. It will consist of 20 trials of a
visual search and cancellation task. Respondents will be asked to detect and mark all occurrences
of pre-determined digits (e.g., 3 and 8). In the first 10 trials, the pre-determined digits will be
embedded among letters that serve as distractors. In the next 10 trials, the pre-determined digits
will be embedded among numbers. Hits and errors are used to score the test. Speed is measured
by the total number of correct hits. Accuracy represents the number of hits to possible hits ratio.
Selective attention test are used in neuropsychological research as a valid measure of attention
(Neuropsychological Assessment, 1992). Ruff describes the test as follows,
The test consists of a series of 20 trials of a visual search and cancellation task. The
respondent detects and marks through all occurrences of the two target digits: "2"

79
and "7." In the 10 Automatic Detection trials, the target digits are embedded among
alphabetical letters that serve as distractors. In the 10 Controlled Search trials, the
target digits are embedded among other numbers that serve as distractors. Correct
hits and errors are counted for each trial and serve as the basis for scoring the test.
Speed scores reflect the total number of correctly identified targets (hits). Accuracy
scores evaluate the number of targets identified in relation to the number of possible
targets. (Ruff, 2008)
Example of first 10 trials
A3BCDE8FG3HIJK8L3MN8OP8QR3TY3V8WXY3X
Example of second 10 trials
234675824689576513423279546532832198576293
Working Memory – Operation Span Task
Working memory will be assessed using a modified operation span task. The task
presented ten trials to participants. Each trial was composed of two to six Powerpoint slides on
the computer that auto-advanced every 3 seconds. Each slide in the trial would present
participants with a mathematical expression that had already been solved and a simple English
word. The participant was required to judge whether the expression was correctly solved by
writing down True or False (T/F) while simultaneously trying to remember all of the words
presented. Following each trial, participants are given unlimited time to write down all of the
word they can remember. Practice trials will familiarize participants with the task. Operation
span is designed to measure simultaneous storage and transformation of information utilized in
working memory.
Visual-Spatial Ability – Mental Rotations Test
Visual-spatial ability will be assessed using a redrawn Vandenberg and Kuse mental rotations
test (MRT). This task will ask participants to state if images of block shapes are the same, not the
same, or mirror images of each other, requiring individuals to mentally rotate and overlay each

80
image. Mental rotation research has a long-standing history in cognitive psychology and the
MRT is the original and most widely used measure of visual-spatial ability (Caissie, Vigneau, &
Bors, 2009). The following is an accurate representation of a potential item on the test. However,
the MRT we are using was designed by Dr. Michael Peters of the University of Guelph and each
item includes a sample image and 4 answer options, of which the participant must choose the
image that contains the accurate but rotated figure.
Processing Speed – The Deary-Liewalk Reaction Time Task
Processing speed will be measured using simple and four-choice reaction time tasks,
cognitive-experimental-level assessments. Deary, Johnson, and Starr (2010) describe the tasks,
using self-contained reaction time boxes, as follows, “For simple reaction time there were eight
practice trials and 20 test trials. Simple reaction time testing was followed by four-choice
reaction time. For four-choice reaction time there were eight practice trials and 40 test trials. The
interval varied between 1 and 3 s for both simple and four-choice reaction time. For simple
reaction time, participants pressed a key when a zero appeared in an LCD window. For four-

81
choice reaction time, participants pressed the appropriate key when 1, 2, 3, or 4 appeared in the
window; participants kept the index and middle fingers of their left and right hands lightly on the
keys between trials. Participants made few errors on the four-choice reaction time test. Scores for
these tests were means for simple and four-choice correct response reaction times.” (p. 222). The
task will take approximately five minutes to administer.

82
Appendix D - CAPTCHA Task
Instructions: As indicated in the task information and prior instructions, this part of the task will involve deciphering 75 strings of 6–8 distorted letters and numbers. Please focus on the computer screen and when the CAPTCHA is presented, please input your response into the field below each CAPTCHA—please note that only uppercase (i.e., capital) letters are included in the task and thus, it does not matter if you input upper or lowercase letters in your response. You also do not need to worry about entering spaces between characters (CAPTCHAs do not account for space between the characters). After inputting your response and pressing the enter key, the next CAPTCHA will be presented. First, we will give you the opportunity to respond to two practice CAPTCHAs. Press enter when you are ready to begin the two practice CAPTCHAs.
Instructions: Now that the practice CAPTCHAs have been responded to, please ask the researcher any questions that you might have; if you do not have any questions, then please proceed to the actual CAPTCHA task. Press enter when you are ready to begin the actual CAPTCHA task.

83
Appendix E – Debrief Form
CAPTCHA Task Study—Debrief Form The main goal of this study was to test what cognitive functions/operations are involved in cognitive ability (psychometric g) that predicts task performance. Much research has been done regarding the link between cognitive ability and performance. Comparatively less research has been done regarding the underlying cognitive functions that contribute to cognitive ability. In the current study, the researchers were attempting to predict task performance based on cognitive operations and psychometric g. The model that the researchers have created relies upon the notion that the link between cognitive ability and task performance is mediated by a group of cognitive functions. As part of a larger program of research, the results of the current study may help to redress a gap in the industrial and organizational psychology literature (i.e., testing a model of performance regarding a specific task; the underlying cognitive processes involved in psychometric g). It is important to integrate and extend these two conceptualizations because together they may be able to better predict performance, and create a better understanding of general mental ability. Lastly, in order to get participants engaged in thinking about our task, a cover story (i.e., that the task was actually being used to help a large ticket sales company) was invoked; however, in reality, there is no large ticket sales company. The deception around the large ticket sales company was used to get participants engaged in the task, yet the actual purpose of the task was to assess participants’ general mental ability and performance on specific cognitive operations and a simple novel task. Thank you for your participation in this study. We appreciate your contribution to our program of research. If you have any further questions about the study, please contact either:
Jonathan Stermac-Stein [email protected] Department of Psychology University of Guelph
Dr. Peter Hausdorf [email protected] Department of Psychology University of Guelph

84
Appendix E: Second Consent Form
Consent to Participate in Research
Title of Project: CAPTCHA Task Study
The purpose of this second consent form is to allow participants the opportunity to agree with a second consent form following the revealing of the deception to ensure a fully informed consent. As indicated on the Debrief Form, in order to get participants engaged in our task, a cover story (i.e., that the task was actually being used to help a large ticket sales company) was invoked; however, in reality, there is no large ticket sales company. If you have any questions or concerns regarding this deception please feel free to discuss them with the experimenter. If, after having read about the deception invoked in this study, you are still willing to allow the researchers to use your results in their analyses, please complete the information below. Thanks for your participation in our study!
Jonathan Stermac-Stein [email protected] Department of Psychology University of Guelph
Dr. Peter Hausdorf [email protected] Department of Psychology University of Guelph
SIGNATURE OF RESEARCH PARTICIPANT
I have read the information about the deception provided for the study “CAPTCHA Task Study” as described herein. My questions have been answered

85
to my satisfaction, and I agree to allow the researchers to use my results in their analyses. I have been given a copy of this form. ______________________________________ Name of Participant (please print) ______________________________________ ______________ Signature of Participant Date

Appendix F – Models
Table 9. Extended View of Measurement
Model Name CMIN/DF P GFI AGFI CFI PCFI PCLOSE RMSEA AIC BIC CHISQUARE
General fit rules >.05 >.95 >.80 >.90 >.05 <.05 < 3
1. CFA: 1 Factor with WPT 1.547 0.125 0.95 0.883 0.922 0.553 0.255 0.077 37.926 68.445 13.926
2. CFA: 1 Factor without
WPT
0.594 0.705 0.988 0.963 1 0.5 0.795 0 22.968 48.401 2.968
3. CFA: 2 Factor from EFA
(covary)
0.704 0.688 0.98 0.947 1 0.533 0.807 0 31.636 64.699 5.636
4. CFA: 2 Factor (3 each) 0.981 0.448 0.973 0.928 1 0.533 0.611 0 33.849 66.912 7.849
5. CFA: All variables under
1 factor
2.269 0.001 0.897 0.815 0.752 0.537 0.011 0.117 77.38 118.073 45.38
6. CFA: All variables under
2 factors
1.477 0.082 0.932 0.872 0.911 0.618 0.245 0.072 62.072 105.308 28.072
7. CFA: All variables in 3
factors (from EFA)
1.16 0.289 0.954 0.904 0.973 0.591 0.527 0.041 57.712 106.034 19.72

87
Table 10. Path Models
Model Number CMIN/DF P GFI AGFI CFI PCFI PCLOSE RMSEA AIC BIC CHISQUARE
General fit rules >.05 >.95 >.80 >.90 >.05 <.05 < 3
SEM Model 1 2.494 0 0.895 0.811 0.708 0.506 0.004 0.127 81.887 122.579 49.887
SEM Model 2 1.578 0.052 0.929 0.865 0.893 0.606 0.181 0.079 63.983 107.219 29.983
SEM Model 3 1.504 0.068 0.928 0.87 0.901 0.515 0.222 0.074 62.089 102.781 30.089
SEM Model 4 (2 factor-2vs3each) 1.952 0.008 0.916 0.84 0.823 0.559 0.048 0.101 71.09 114.326 37.09
SEM Model 5 (2 factor, 3 each) 2.017 0.005 0.914 0.837 0.811 0.55 0.037 0.105 72.316 115.552 38.316
SEM Model 6 (model 3 w/o WPT) 1.564 0.081 0.943 0.887 0.899 0.6 0.215 0.078 49.9 85.506 21.9
SEM Model 7 (WPT only) 0.478 0.49 0.997 0.98 1 0.333 0.538 0 10.478 23.194 0.478
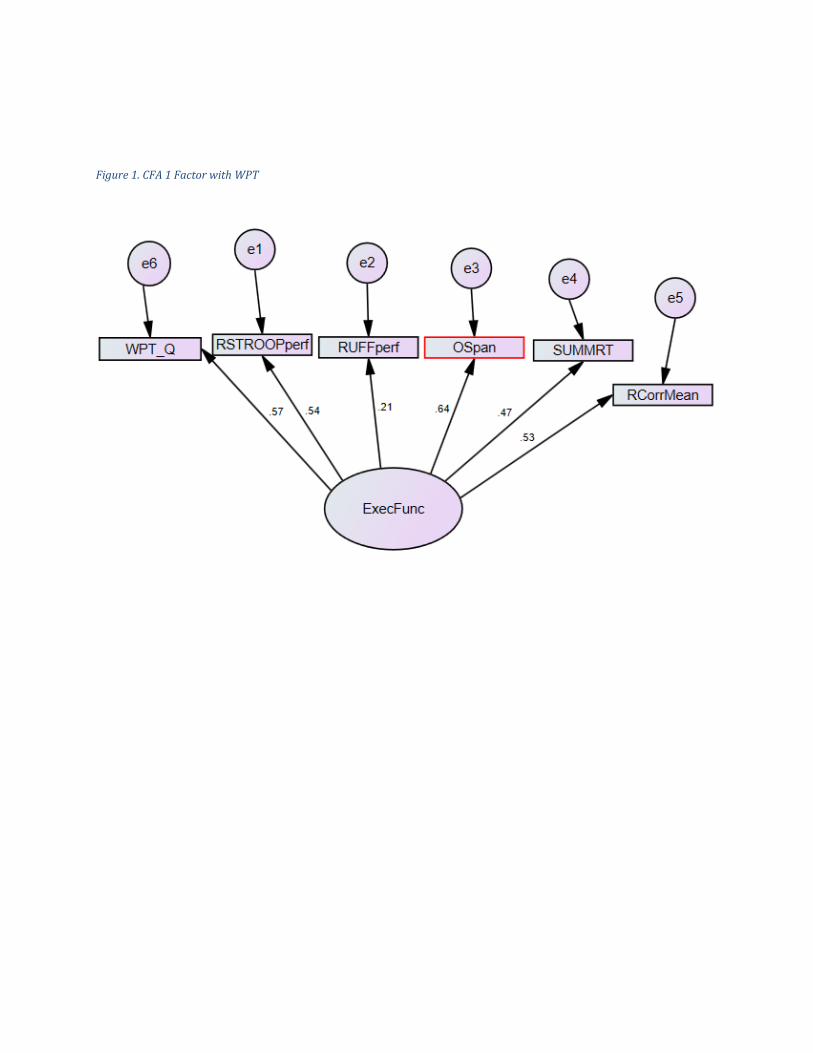
Figure 1. CFA 1 Factor with WPT

89
Figure 2. CFA 1 Factor Without WPT

90
Figure 3. CFA 2 Factor from EFA (covary)

91
Figure 4. CFA 2 Factor (3 each)

92
Figure 5. CFA All variables under 1 factor

93
Figure 6. All variables under 2 factors

94
Figure 7. All variables in 3 factors (from EFA)

95
Appendix G – Path Models
Figure 8. SEM Model 1

96
Figure 9. SEM Model 2

97
Figure 10. SEM Model 3
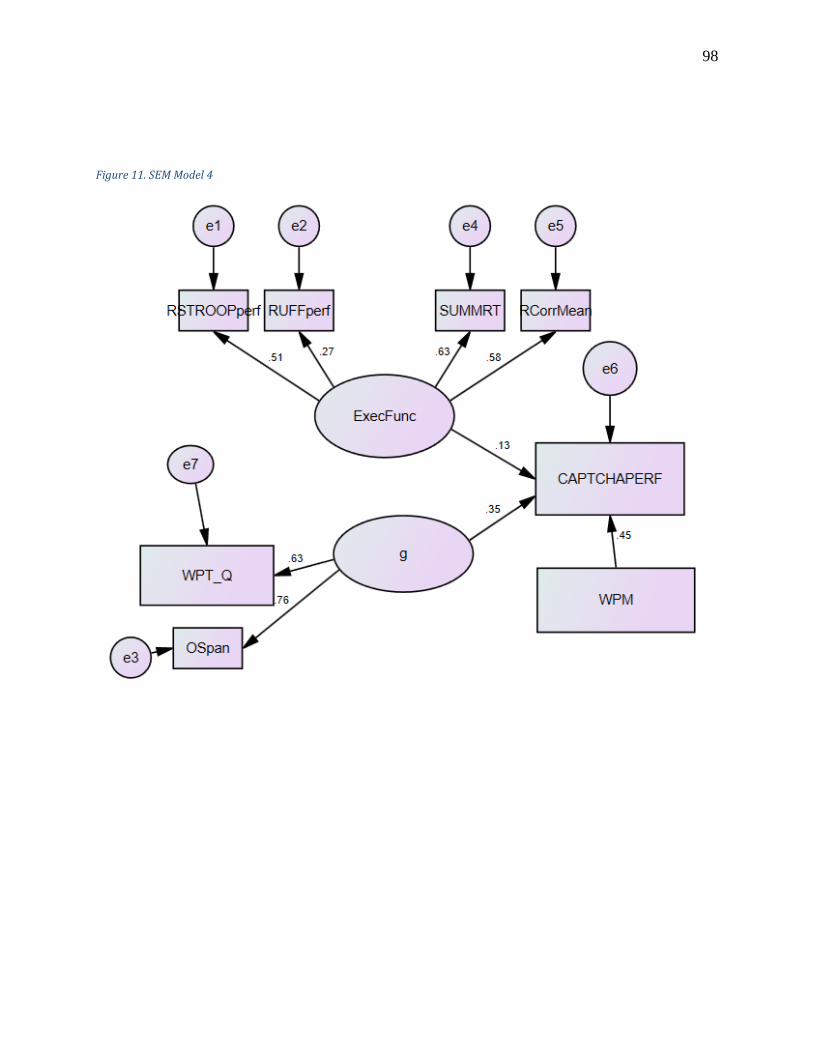
98
Figure 11. SEM Model 4

99
Figure 12. SEM Model 5

100
Figure 13. SEM Model 6

101
Figure 14. SEM Model 7

102
Figure 15. SEM Model 8

103
Figure 16. SEM Model 9

104
Appendix H
Figure 17. Layered Reference Model of the Brain

105
Figure 18. Mediation Model for Hypothesis 2

106
Figure 19. Multiple Mediation Model for Hypothesis 2