exploring the limits of the technology...
TRANSCRIPT
PRODUCTION AND OPERATIONS MANAGEMENT Vol. I. No. 4. Fall 1992
Prinrcd in U.S.A.
EXPLORING THE LIMITS OF THE TECHNOLOGY S- CURVE. PART I: COMPONENT TECHNOLOGIES *
CLAYTON M. CHRISTENSEN Harvard University Graduate School of Business Administration,
Boston, Massachusetts 02 163
The technology S-curve is a useful framework describing the substitution of new for old technologies at the industry level. In this paper I use information from the technological history of the disk drive industry to examine the usefulness of the S-curve framework for managers at thefirm level in planning for new technology development. Because improve- ments in over-all disk drive product performance result from the interaction of improved component technologies and new architectural technologies, each of these must be monitored and managed. This paper focuses on component technology S-curves, and a subsequent paper, also published in this issue of the journal, examines architectural technology S- curves. Improvement in individual components followed S-curve patterns, but I show that the flattening of S-curves is a firm-specific, rather than uniform industry phenomenon. Lack of progress in conventional technologies may be the result, rather than the stimulus, of a forecast that the conventional technology is maturing, and some firms demonstrated the ability to wring far greater levels of performance from existing component technologies than other firms. Attacking entrant firms evidenced a distinct disadvantage versus incumbent firms in developing and using new component technologies. Firms pursuing aggressive S- curve switching strategies in component technology development gained no strategic ad- vantage over firms whose strategies focused on extending the life of established component technologies. (INNOVATION; MANAGEMENT OF TECHNOLOGY, TECHNOLOGY S-CURVE; DISK DRIVE INDUSTRY; COMPONENT TECHNOLOGIES)
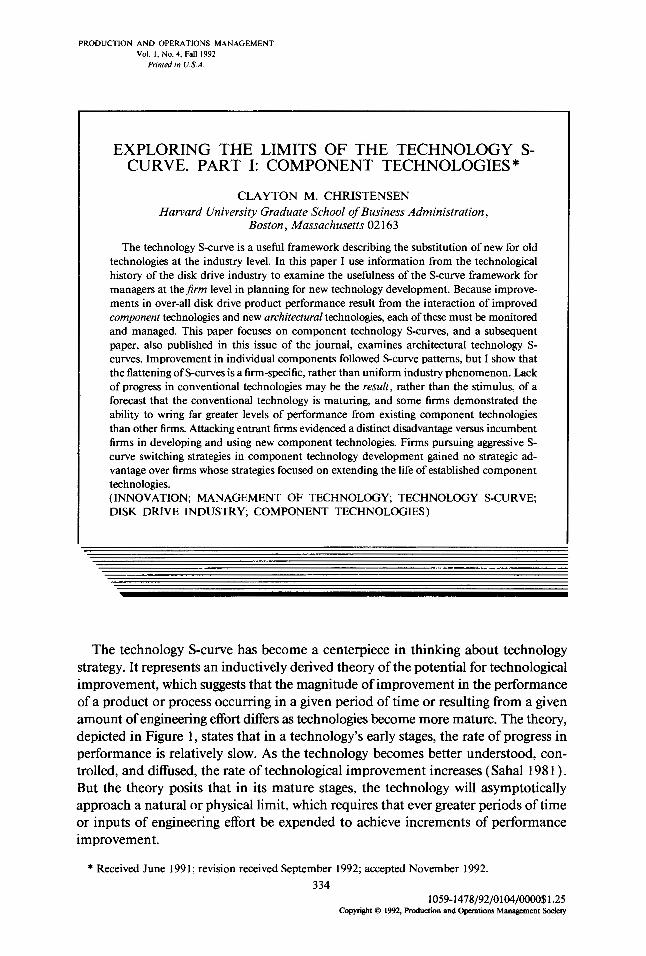
The technology S-curve has become a centerpiece in thinking about technology strategy. It represents an inductively derived theory of the potential for technological improvement, which suggests that the magnitude of improvement in the performance of a product or process occurring in a given period of time or resulting from a given amount of engineering effort differs as technologies become more mature. The theory, depicted in Figure 1, states that in a technology’s early stages, the rate of progress in performance is relatively slow. As the technology becomes better understood, con- trolled, and diffused, the rate of technological improvement increases ( Sahal 198 1) . But the theory posits that in its mature stages, the technology will asymptotically approach a natural or physical limit, which requires that ever greater periods of time or inputs of engineering effort be expended to achieve increments of performance improvement.
* Received June 199 1; revision received September 1992; accepted November 1992. 334
1059-1478/92/0104/0000$1.25 Copyri&t 0 1992, Production and Operations Management Society
LIMITS OF THE TECHNOLOGY S-CURVE: I 335
Time or engineering Effort
FIGURE 1. The Technology S-Curve
Foster ( 1986 ) used S-curves to explain a general phenomenon of the sort observed by Cooper and Schendel ( 1976) and Henderson ( 1988)-that radically new tech- nologies are frequently developed and brought into an industry by entering firms, rather than by the incumbent leaders. Foster cites the tendency of leading firms to reinforce and refine maturing technological approaches and their failure to spot new, successor technologies in a timely way as a primary reason why leading firms lose their positions of industry dominance.
The unit of analysis in most published studies of technology maturity and tech- nology S-curves has been at the industry level. For instance, Roussel ( 1984) looked at foam rubber; Constant ( 1980) examined aircraft engines; van Wyk, Haour, and Japp ( 199 1) studied permanent magnets; and Foster ( 1986) used examples from a range of industries. My purpose in this paper is to summarize a body of theoretical and empirical research, much of it relating to patterns of technological progress in the disk drive industry, to enrich our understanding of the uses and limits of tech- nology S-curve theory from the point of view of a manager within a single$rm . Given that S-curve phenomena have convincingly been shown to exist at more aggregate levels, I explore in this paper and its companion paper (Christensen 1992b), which is also published in this issue of the journal, the strengths and shortcomings of S- curve theory when managers use it within individual firms to plan technology de- velopment. I have summarized the data sources and the methodologies employed to collect and analyze it in Appendixes A and B.
Drawing upon analyses of the disk drive industry, I offer four propositions about the usefulness of technology S-curves to managers of technology development and suggest that the insights drawn from studying the disk drive industry may be arche- typical of a broader range of industries whose products are complex assemblies of components:
1. At the industry level, using a high-level measure of product performance-the recording density of magnetic disk technology, in the case studied here-S-curves can provide rather convincing explanations of why alternative technologies have made or have failed to make substantial inroads against currently dominant tech- nology.
2. To achieve improvements in the sorts of high-level measures of system perfor- mance mentioned in #1 above, managers must conceive and execute a sequence of projects to improve the component technologies used in a product and to refine or revamp the architectural system design within which the components operate. For an engineering or research manager, therefore, technology S-curves will be opera-
336 C. M. CHRISTENSEN
tionally useful if they aid in planning component and architectural technology de- velopment programs.
3. When used to assess component technologies’ improvement trajectories, S- curves may be useful in describing an individual firm’s experience, but the framework has serious shortcomings if used in a prescriptive sense to indicate the direction future research programs ought to take. The levels at which individual firms perceived component technologies to have plateaued differed across firms by nearly an order of magnitude. The industry’s leading incumbent firms were generally the most ag- gressive in switching to new component technology S-curves, but there is no evidence that they gained any sort of strategic advantage over firms that stayed longer with conventional componentry. If anything, a strategy of extending or “riding” the S- curve of conventional technology and of switching component technology S-curves behind the industry’s component technology leaders seems to have led to greater success.
4. In the disk drive industry, the technological changes in which attackers have demonstrated strategic advantage (Foster 1986) have been architectural in nature. Established firms find these technologies difficult to spot because alternative archi- tectures are often initially deployed in historically unimportant commercial appli- cations. Typical S-curve frameworks in which a new technology S-curve rises from beneath and intersects the performance obtainable from mature technologies tend to frame architectural innovation only in technological terms. In reality, architectural technology change involves an intense degree of market innovation, in addition to technological innovation. I propose an alternative S-curve framework for assessing architectural change, one which embraces both aspects of such technologies.
This paper supports the first three of these propositions; the fourth is discussed in the subsequent paper (Christensen 1992b). This paper is divided into three principal sections. In the first, I summarize key concepts treated in earlier studies of techno- logical innovation and briefly outline the technological history of the disk drive in- dustry. In the second, I evaluate the usefulness of S-curves in assessing the potential for performance improvement of magnetic recording technology versus other tech- nologies at an industry level. In the third section, I examine the value and limits of S-curve frameworks to managers in planning a sequence of projects to develop new component technologies.
Context of this Study
I define technology for the purposes of this study as a process, technique, or meth- odology-embodied in a product design or in a manufacturing or service process- which transforms inputs of labor, capital, information, material, and energy into outputs of greater value. Building upon the work of Sahal ( 198 1)) I define a tech- nological change as a change in one or more of such inputs, processes, techniques, or methodologies that improves the measured levels of performance of a product or process. Technology defined in this way is specific to particular products or processes. As such, it is distinct from knowledge, whose value may not be unique to specific products or processes. Definitions of the technical terms related to disk drives used in the following discussion can be found in Appendix B.
The vertical axis of technology S-curves is constructed to measure an important dimension of product or process performance. Choice of the units measured on the horizontal axis generally reflects the purpose of the author (O’Brien 1962). Scholars whose objective is to measure the relative efficiency or potential productivity of
LIMITS OF THE TECHNOLOGY S-CURVE: I 337
development teams’ efforts generally measure engineering effort along the horizontal axis (Foster 1986). Those attempting to assess the impact of differences in techno- logical maturity on product sales or competitive position often measure time on the horizontal axis (Becker and Speltz 1983; Roussel 1983; Thomas 1984).
Although many of the researchers cited herein simply report observations of S- curve phenomena, a few examine processes of technology maturation in considerable depth. For example;Foster ( 1986) suggests that the leveling of a technology’s tra- jectory of improvement is attributable to limits imposed by fundamental facts of nature. Foster supports this explanation of maturity with examples from several industries-one of which is the substitution of steam for wind-powered ships: he shows that the speed of wind-powered vessels was inherently limited by the physics of wind and water. Constant ( 1980) explored a single industry and technology at much greater depth, showing how the substitution of turbojet technology for piston engine technology in the aircraft industry proceeded through a series of asynchronous, discontinuous improvements in the performance of individual materials and com- ponents. Sahal ( 198 1) essentially offers a theory of technology maturity: he posits that the rate of performance improvement achievable within a given technological approach declines because of scale phenomena (things either get impossibly large or small) or because of system complexity. Because either of these problems makes further progress more difficult, Sahal suggests that the only way to maintain the pace of progress is through radical system redefinition.
Rigid disk drives are an interesting product category to which S-curve analysis might be applied. The industry has been characterized by a high degree of techno- logical turbulence since IBM invented the first disk drive at its San Jose, California, laboratories in 1956. In investigating how new technologies emerged and substituted for maturing ones in this industry, I employ the typologies of technological change proposed by Henderson and Clark ( 1990). Architectural change involves a rear- rangement of the way in which components (whose fundamental technological basis remains unchanged) relate to each other within a product’s system design. Modular innovation is a fundamental change in the technological approach employed in a component, where the product architecture is fundamentally left unchanged. Incre- mental change refers to ( 1) improvements in component performance that build upon the established technological concept or (2) refinements in system design that involve no significant changes in the technical relationships among components. Radical innovations involve both a new architecture and a new fundamental tech- nological approach at the component level.
At the architectural level, seven distinctively different architectural technologies captured a double-digit share of market units at some point between 1960 and 1990. And at the component level, there were innumerable incremental technological ad- vances, as well as several modular or “competency-destroying” ones (Tushman and Anderson 1986) in the heads, disks, actuators, motors, and controller software or firmware that constitute the drive. At the architectural and component levels, this has been an industry in which the strategic management of technology seems to have been an extraordinary challenge. Over 130 firms entered the world disk drive industry between 1960 and 1990-firms ranging from such vertically integrated computer giants such as IBM and Fujitsu, to venture capital-backed start-ups. Leadership in this industry has been tenuous: in the merchant or original equipment manufacturer (OEM) disk drive market, an entrant company emerged to lead five of the seven architecturally defined product generations.
338 C. M. CHRISTENSEN
Rigid disk drives are comprised of one or more rotating disks-polished aluminum platters coated with magnetic material-mounted on a central spindle. Data is re- corded and read on concentric tracks on the surfaces of these disks. Read/write heads, one each for the top and bottom surfaces of each disk on the spindle, are aerodynamically designed to fly a fraction of a micron over the surface of the disk. They generally rest on the disk’s surface when the drive is at rest; “take off” as the drive begins to spin; and “land” again when the disks stop. The heads are positioned over the proper track on the disk by an actuator motor, which moves the heads across the tracks in a fashion similar to the arm on a phonograph. The head is essentially a tiny electromagnet whose polarity changes when the direction of electrical current passing through it changes. Because opposite magnetic poles attract, changes in polarity of the head orient the polarity of the magnetic domain on the disk’s surface immediately beneath it, resulting in a sequence of positively and negatively oriented domains. In this manner, data is written in binary code on the disk. To read data, the drive uses changes in magnetic field on the disk as it spins beneath the head to induce changes in current flow, essentially the reverse process of writing. Disk drives also include electronic circuitry enabling computers to control and com- municate with the drive.
As in other magnetic recording products, area1 recording density (measured in megabits per square inch of disk surface area or mbpsi) is the pervasive measure of product performance in the disk drive industry. A drive’s total capacity is calculated by multiplying the total available square inches on the top and bottom surfaces of the disks mounted on the spindle of the drive by its area1 recording density.
An Aggregate, Industry-Level View of Technological Maturity in Magnetic Rigid Disk Drives
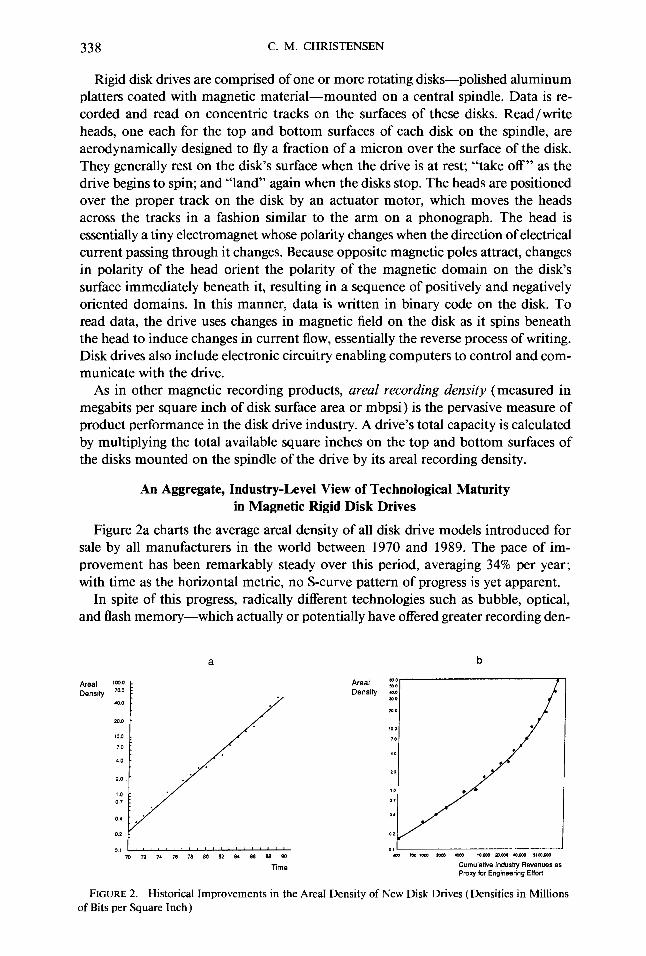
Figure 2a charts the average area1 density of all disk drive models introduced for sale by all manufacturers in the world between 1970 and 1989. The pace of im- provement has been remarkably steady over this period, averaging 34% per year; with time as the horizontal metric, no S-curve pattern of progress is yet apparent.
In spite of this progress, radically different technologies such as bubble, optical, and flash memory-which actually or potentially have offered greater recording den-
b
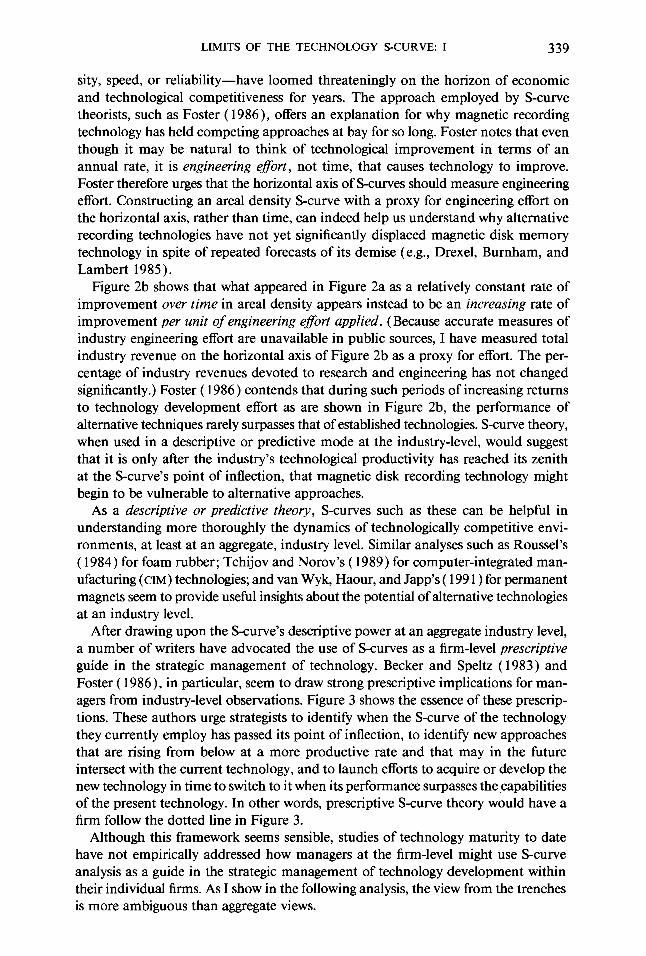
FIGURE 2. Historical Improvements in the Area1 Density of New Disk Drives (Densities in Millions of Bits per Square Inch)
LIMITS OF THE TECHNOLOGY S-CURVE: I 339
sity, speed, or reliability-have loomed threateningly on the horizon of economic and technological competitiveness for years. The approach employed by S-curve theorists, such as Foster ( 1986), offers an explanation for why magnetic recording technology has held competing approaches at bay for so long. Foster notes that even though it may be natural to think of technological improvement in terms of an annual rate, it is engineering e&t, not time, that causes technology to improve. Foster therefore urges that the horizontal axis of S-curves should measure engineering effort. Constructing an area1 density S-curve with a proxy for engineering effort on the horizontal axis, rather than time, can indeed help us understand why alternative recording technologies have not yet significantly displaced magnetic disk memory technology in spite of repeated forecasts of its demise (e.g., Drexel, Burnham, and Lambert 1985).
Figure 2b shows that what appeared in Figure 2a as a relatively constant rate of improvement over time in areal density appears instead to be an increasing rate of improvement per unit of engineering e@rt applied. (Because accurate measures of industry engineering effort are unavailable in public sources, I have measured total industry revenue on the horizontal axis of Figure 2b as a proxy for effort. The per- centage of industry revenues devoted to research and engineering has not changed significantly.) Foster ( 1986) contends that during such periods of increasing returns to technology development effort as are shown in Figure 2b, the performance of alternative techniques rarely surpasses that of established technologies. S-curve theory, when used in a descriptive or predictive mode at the industry-level, would suggest that it is only after the industry’s technological productivity has reached its zenith at the S-curve’s point of inflection, that magnetic disk recording technology might begin to be vulnerable to alternative approaches.
As a descriptive or predictive theory, S-curves such as these can be helpful in understanding more thoroughly the dynamics of technologically competitive envi- ronments, at least at an aggregate, industry level. Similar analyses such as Roussel’s ( 1984) for foam rubber; Tchijov and Norov’s ( 1989) for computer-integrated man- ufacturing ( CIM ) technologies; and van Wyk, Haour, and Japp’s ( 199 1) for permanent magnets seem to provide useful insights about the potential of alternative technologies at an industry level.
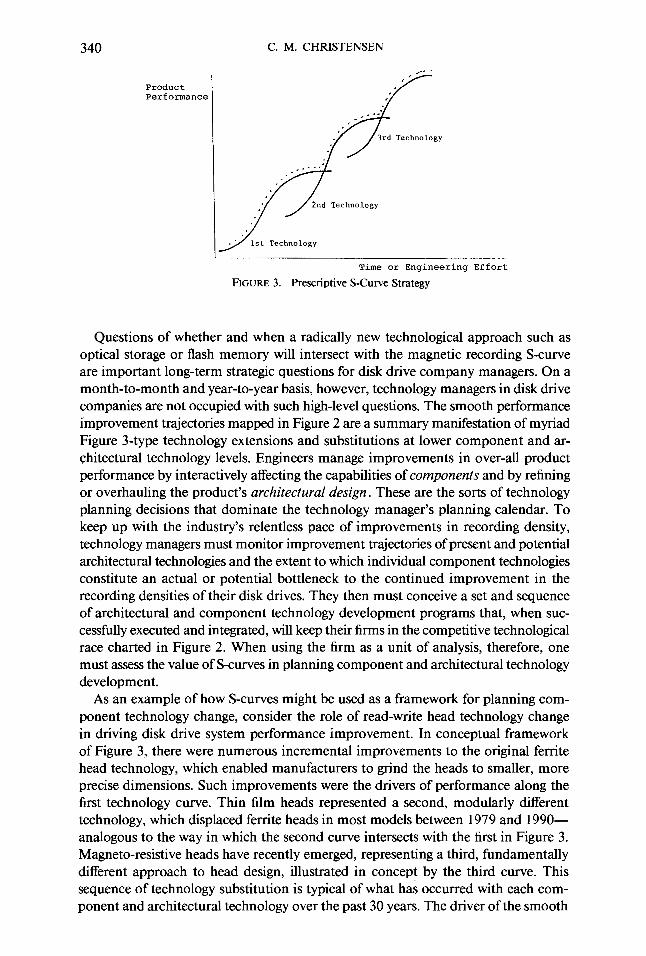
After drawing upon the S-curve’s descriptive power at an aggregate industry level, a number of writers have advocated the use of S-curves as a firm-level prescriptive guide in the strategic management of technology. Becker and Speltz ( 1983) and Foster ( 1986)) in particular, seem to draw strong prescriptive implications for man- agers from industry-level observations. Figure 3 shows the essence of these prescrip- tions. These authors urge strategists to identify when the S-curve of the technology they currently employ has passed its point of inflection, to identify new approaches that are rising from below at a more productive rate and that may in the future intersect with the current technology, and to launch efforts to acquire or develop the new technology in time to switch to it when its performance surpasses the capabilities of the present technology. In other words, prescriptive S-curve theory would have a firm follow the dotted line in Figure 3.
Although this framework seems sensible, studies of technology maturity to date have not empirically addressed how managers at the firm-level might use S-curve analysis as a guide in the strategic management of technology development within their individual firms. As I show in the following analysis, the view from the trenches is more ambiguous than aggregate views.
340 C. M. CHRISTENSEN
Product Performance
Time or Engineering Effort
FIGURE 3. Prescriptive S-Curve Strategy
Questions of whether and when a radically new technological approach such as optical storage or flash memory will intersect with the magnetic recording S-curve are important long-term strategic questions for disk drive company managers. On a month-to-month and year-to-year basis, however, technology managers in disk drive companies are not occupied with such high-level questions. The smooth performance improvement trajectories mapped in Figure 2 are a summary manifestation of myriad Figure 3-type technology extensions and substitutions at lower component and ar- chitectural technology levels. Engineers manage improvements in over-all product performance by interactively affecting the capabilities of components and by refining or overhauling the product’s architectural design. These are the sorts of technology planning decisions that dominate the technology manager’s planning calendar. To keep up with the industry’s relentless pace of improvements in recording density, technology managers must monitor improvement trajectories of present and potential architectural technologies and the extent to which individual component technologies constitute an actual or potential bottleneck to the continued improvement in the recording densities of their disk drives. They then must conceive a set and sequence of architectural and component technology development programs that, when suc- cessfully executed and integrated, will keep their firms in the competitive technological race charted in Figure 2. When using the firm as a unit of analysis, therefore, one must assess the value of S-curves in planning component and architectural technology development.
As an example of how S-curves might be used as a framework for planning com- ponent technology change, consider the role of read-write head technology change in driving disk drive system performance improvement. In conceptual framework of Figure 3, there were numerous incremental improvements to the original ferrite head technology, which enabled manufacturers to grind the heads to smaller, more precise dimensions. Such improvements were the drivers of performance along the first technology curve. Thin film heads represented a second, modularly different technology, which displaced ferrite heads in most models between 1979 and 1990- analogous to the way in which the second curve intersects with the first in Figure 3. Magneto-resistive heads have recently emerged, representing a third, fundamentally different approach to head design, illustrated in concept by the third curve. This sequence of technology substitution is typical of what has occurred with each com- ponent and architectural technology over the past 30 years. The driver of the smooth
LIMITS OF THE TECHNOLOGY S-CURVE: I 341
progression of performance at the system level has been extensive technological tur- moil at the component and architecture levels.
Analyzing technological maturity at the component and architectural levels is important in firm-level analyses such as this not only because both sorts of innovation can be sources of system performance improvement but because component and architecture are relative, not absolute concepts. For example, a read-write head can be viewed at one level as a complex system architecture, comprising component parts and materials that interact with each other within an architected system. At the next level, the head is a component in a disk drive, which itself is a complex architected system, composed of a variety of components. At a yet higher level, the disk drive is a component in a computer, in which a central processing unit, semi- conductor memory, rigid and floppy drives, and input-output peripherals interact within a designed architecture. And finally, such a computer is itself a component in an information processing system architecture, comprised of the computer, soft- ware, operators, applications, sources and uses of data, and so forth. These constitute a sort of n ested system of architectures. System performance at any given level within a nested system such as this is generally driven not only by innovations at that level but by improvements in component performance and architectural design at lower levels in the system.
For these reasons, in this paper and its companion (Christensen 1992b), I focus first on the use of S-curve theory in planning component technology development and then examine the value of S-curve theory in guiding plans for architectural technology development.
Using S-Curves to Prescribe Development of New Component Technologies
Whether S-curves can be used to guide the planning of component technology development is important because, to borrow bank robber Willie Sutton’s phrase, “That’s where the money is.” In the enterprise of disk drive research and engineering, as shown by Christensen ( 1992a), component technology development often begins with fundamental research questions, passes through applied research and product design and development, and ends in extensive process engineering. The development of thin film heads at IBM alone took longer than a decade and cost over $300 million, and the industry spent well over $1 billion on thin film disk development. Devel- opment of new product architectures, on the other hand, at most cost developers a few million dollars and often consumed less than a year of calendar time.
Evidence from the substitution patterns of successive waves of new component technologies in disk drives suggests that using S-curve analysis as a basis for prescribing new component technology development programs can be problematic at several levels. In the discussion that follows I describe in detail the substitution of new- technology thin-film read-write heads for ferrite heads and of thin film disks for particulate oxide-coated disks as an example of the difficulties individual managers may confront when managing the switch from one component technology to another. Similar accounts could be constructed for every other significant component tech- nology in the industry’s history. I then present evidence that despite these difficulties, and contrary to Foster’s (1986) observation that attacking firms often seize the advantage when new technologies invade a market, the incumbent firms quite capably used new component technologies to pre-empt competitive attacks into existing markets.
342 C. M. CHRISTENSEN
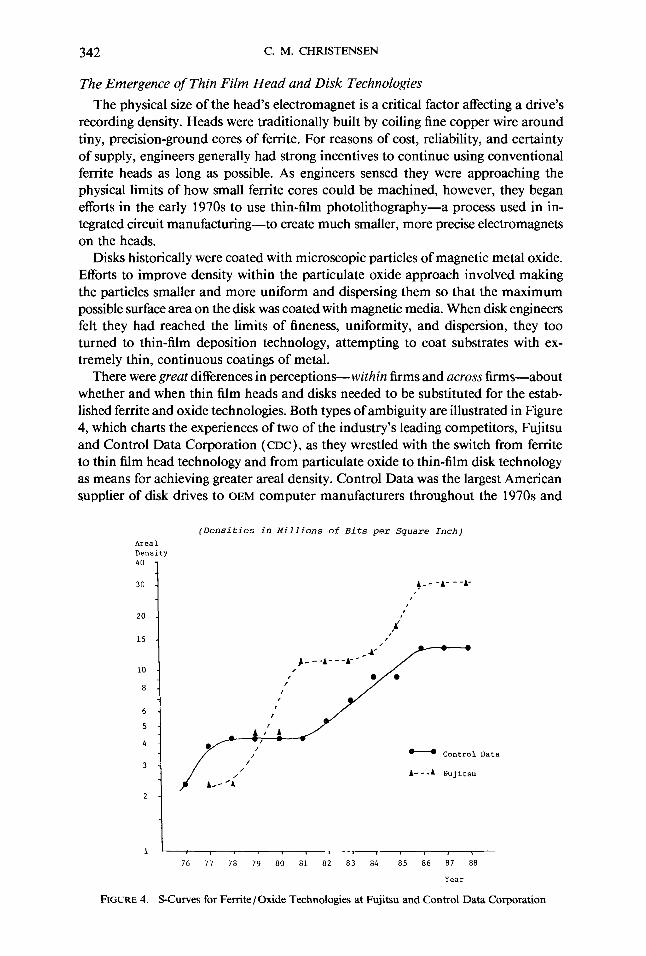
The Emergence of Thin Film Head and Disk Technologies The physical size of the head’s electromagnet is a critical factor affecting a drive’s
recording density. Heads were traditionally built by coiling fine copper wire around tiny, precision-ground cores of ferrite. For reasons of cost, reliability, and certainty of supply, engineers generally had strong incentives to continue using conventional ferrite heads as long as possible. As engineers sensed they were approaching the physical limits of how small ferrite cores could be machined, however, they began efforts in the early 1970s to use thin-film photolithography-a process used in in- tegrated circuit manufacturing-to create much smaller, more precise electromagnets on the heads.
Disks historically were coated with microscopic particles of magnetic metal oxide. Efforts to improve density within the particulate oxide approach involved making the particles smaller and more uniform and dispersing them so that the maximum possible surface area on the disk was coated with magnetic media. When disk engineers felt they had reached the limits of fineness, uniformity, and dispersion, they too turned to thin-film deposition technology, attempting to coat substrates with ex- tremely thin, continuous coatings of metal.
There were great differences in perceptions-within firms and across firms-about whether and when thin film heads and disks needed to be substituted for the estab- lished ferrite and oxide technologies. Both types of ambiguity are illustrated in Figure 4, which charts the experiences of two of the industry’s leading competitors, Fujitsu and Control Data Corporation (CDC), as they wrestled with the switch from ferrite to thin film head technology and from particulate oxide to thin-film disk technology as means for achieving greater area1 density. Control Data was the largest American supplier of disk drives to OEM computer manufacturers throughout the 1970s and
(Densities in Millions of Bits per Square Inch) (Densities in Millions of Bits per Square Inch)
Area1 Area1 Density Density 40 -
10 - , I
8 - I I
I 6. ,
,
5 -
4 - 'I - /
3. /' /
- Control Data
A---A Eujitsu
1
76 76 77 78 79 80 81 82 83 84 85 86 87 88 77 78 79 80 81 82 83 84 85 86 87 88
FIGURE 4. S-Curves for Ferrite/Oxide Technologies at Fujitsu and Control Data Corporation
LIMITS OF THE TECHNOLOGY S-CURVE: I 343
1980s with a market share in several of those years exceeding 60%. Fujitsu was the largest Japanese marker of disk drives from 1977 to the present. Figure 4 casts both firms’ performance with ferrite heads and oxide disks in an S-curve format, where the maximum area1 density of models introduced in each year is measured on the vertical axis and time is charted on the horizontal axis. (Since this analysis involves comparing two firms’ technical progress over time, rather than assessing the pro- ductivity of engineering efforts targeted at two different technologies, I have charted time rather than engineering effort on the horizontal axis.) Note that for each firm there appear to have been two, not one, ferrite/oxide S-curves. What accounts for the first plateau of ferrite/oxide technology and its subsequent second wind?
Apparently, according to the industry participants I interviewed for this study, both firms launched development efforts for thin-film heads and/or disks just prior to the onset of the plateau--cDc in about 1977 and Fujitsu in 1980. Both firms’ projects encountered a range of unforeseen problems, however, and neither could introduce these components according to their original plans. With no technological alternatives, their only choice was to wring additional performance from the ferrite/ oxide approach while they scrambled to get thin-film components ready. Both firms’ engineers met this challenge with astounding success, pushing area1 densities with ferrite/oxide technology to about triple the level at which each seems initially to have planned to abandon ferrite/ oxide technology.
The proximate cause of the temporary plateaus in Figure 4 seems to have been that engineering resources were reallocated: in both instances, these firms scaled back the engineering effort targeted at ferrite heads and oxide disks, betting that ferrite/ oxide technology was nearing its limit and that thin film was a key to future system improvement. The time-measured plateaus in the area1 density achieved with ferrite heads may have been “induced” by the appearance of the alternative thin-film ap- proach, which relieved the pressure-and usurped the resources-to push conven- tional technology further. In other words, the very forecast that the conventional technology was approaching its natural limit may in fact have been the proximate cause of a leveling in the technology’s improvement trajectory, because of the impact the forecast had on the allocation of engineering resources. Whether the 30 mbpsi plateau Fujitsu achieved in 1987 represents the “real” natural limit of recording density achievable with ferrite heads and oxide disks or is simply a self-fulfilling prophecy that the future belongs to thin film we may never know.
Steele ( 1983) examined this phenomenon, noting that executives and engineers alike often become enamored with radically new technologies-we might call them technological long shots-as solutions to product performance plateaus. Steele shows that these long shots generally require far more time and money to develop than originally believed and that most progress is achieved instead through the incremental, steady advance of conventional technology. The forecast arrivals of such technological long shots as gallium arsenide, optical disk memory, and ceramic engines have been delayed or preempted by the steady cumulation of incremental improvements to conventional technology. The cases presented here support the proposition that there can be far more latent performance potential in a conventional technology than individual firms or industry experts may perceive.
The innovations that enabled the second burst of performance improvement for each of these firms were of the incremental sort defined by Henderson and Clark ( 1990). For example, three important incremental technologies advanced the per- formance of ferrite heads. A modified barium-doped ferrite material was developed,
344 C. M. CHRISTENSEN
which had the strength to be ground to thinner dimensions. Lapping processes capable of making smaller and more precise heads supplanted grinding. And finally, placing a strip of metal in the gap separating the leading and trailing sections of the head proved to strengthen the magnetic field created by the head. Similar incremental improvements were made in the size, uniformity, and dispersion of oxide particles that coated the disks. The cumulation of these developments in ferrite heads and oxide disks pushed performance far beyond what initially had been viewed as limits.
An explanation of why Fujitsu and CDC perceived limits to be at such different levels is that nobody knows what the natural, physical performance limit is in complex engineered products, such as disk drives and their components. Since engineers do not know what they may discover or develop in the future, since the physical laws (and the relationships between laws) governing performance are imperfectly under- stood, and since possibilities for circumventing known physical limits cannot be well foreseen, the natural or physical limits cited by scholars of technological maturity, such as Foster ( 1986) and Twiss ( 1979), may in practice be moving targets rather than immovable barriers. Foster ( 1986) cites sailing ships as an example in which the physics of wind and water imposed a natural limit on the speed of sailing ships. In retrospect, given what we now know, that is probably a true statement. But to the designers of ships in the 1800s (and one might say the 1990s)) the interactive physics of wind and water were themselves being explored and defined by those practicing the art of sailing ship design. Such limits are dynamic, relative, changing concepts from the point of view of technology developers.
Even when designers confront an apparently immutable natural limit in a com- ponent within a product system as complex as that of a disk drive, there may be several engineering avenues for resolving the system-level performance problem- there is often more than one way to skin the cat. Although one component’s per- formance may be on a plateau-an actual or perceived physical limit-engineers can continue to improve system performance by applying effort to less mature ele- ments of the system design. For example, the discovery of run length-limited recording codes in the mid- 1980s contributed to the resurgence of ferrite-oxide disk drive per- formance, because it boosted the density of drives by 30% independently of which disk and head technologies were employed in a model. In an even more dramatic instance, Henderson ( 1993) has shown that the line resolution that could be achieved with step-and-repeat photolithographic equipment by 1986 was substantially less than the minimum possible resolution that had been calculated, in the early 1980s to be constrained by the wave length of light.
Because actual or perceived limits can be circumvented through advances in less mature elements of a product’s design, when designs differ significantly across firms, perceptions of technological maturity may be highly firm specific. Whether a particular component technology is perceived to be a bottleneck to further improvement and whether viable alternatives exist for circumventing such a bottleneck may depend upon firm-specific characteristics of a product’s design. Such firm specificity is ap- parent in Figure 4. Note that CDC’S initial “limit” for ferrite/oxide technology was about 4 mbpsi-one third the density at which Fujitsu encountered its initial “limit.”
Figure 5 illustrates the extent of these across-firm differences in perceptions about the limits of density achievable with ground ferrite heads and particulate oxide- coated disks across a wider range of firms. On the horizontal dimension, it shows that the timing of switching to thin-film technology differed among leading firms by a decade-a very long time in such a turbulent industry. On the vertical axis, Figure
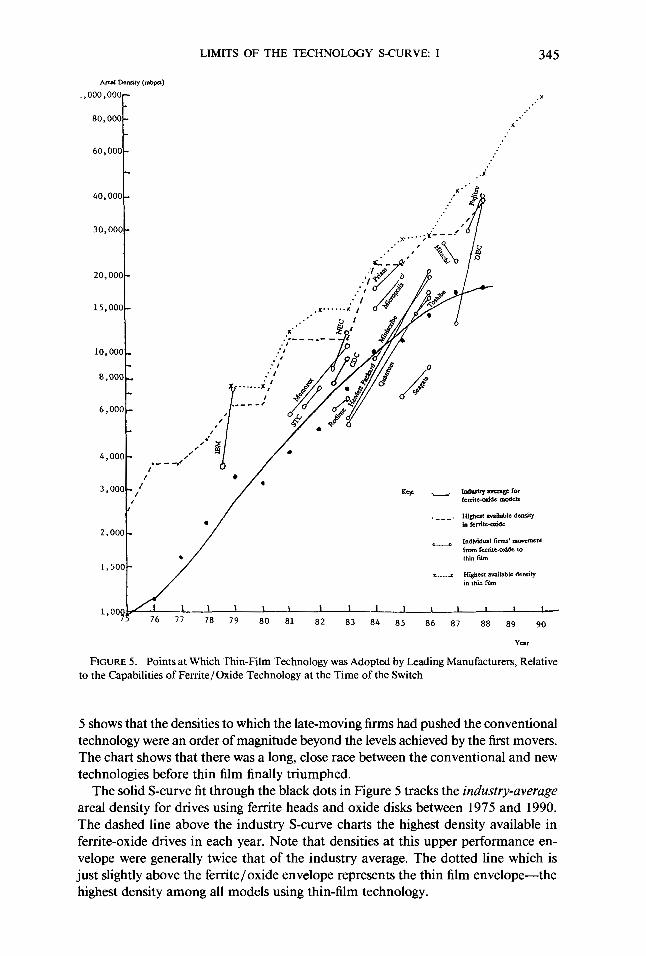
LIMITS OF THE TECHNOLOGY S-CURVE: I 345
Arcal Density (mbpbi)
.,OOO,OOOr
60,000
._--_. - - _ 10,000 I- :*, . I P #.9 fl
8,000 I-
.-I *. I x.. . . . . . . z4
Y *:.
.:..
.*
6,000
t
1 \ 1 1 1 I 1 1 I 1 I 1 I -
78 79 80 81 82 83 84 85 86 87 88 89 90
FIGURE 5. Points at Which Thin-Film Technology was Adopted by Leading Manufacturers, Relative to the Capabilities of Ferrite/Oxide Technology at the Time of the Switch
5 shows that the densities to which the late-moving firms had pushed the conventional technology were an order of magnitude beyond the levels achieved by the first movers. The chart shows that there was a long, close race between the conventional and new technologies before thin film finally triumphed.
The solid S-curve fit through the black dots in Figure 5 tracks the industry-average area1 density for drives using ferrite heads and oxide disks between 1975 and 1990. The dashed line above the industry S-curve charts the highest density available in ferrite-oxide drives in each year. Note that densities at this upper performance en- velope were generally twice that of the industry average. The dotted line which is just slightly above the ferrite/oxide envelope represents the thin film envelope-the highest density among all models using thin-film technology.
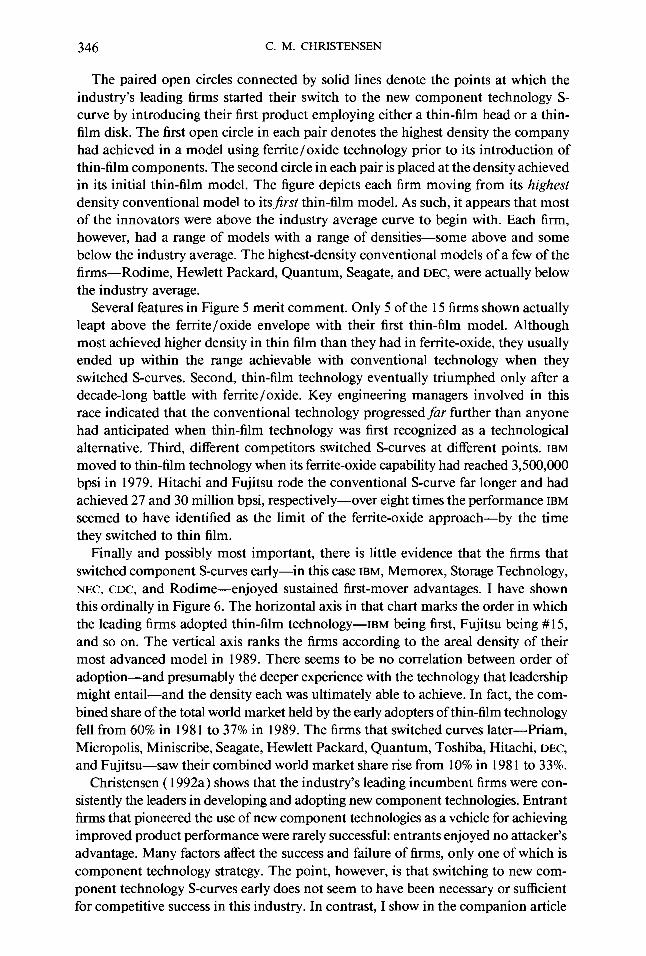
346 C. M. CHRISTENSEN
The paired open circles connected by solid lines denote the points at which the industry’s leading firms started their switch to the new component technology S- curve by introducing their first product employing either a thin-film head or a thin- film disk. The first open circle in each pair denotes the highest density the company had achieved in a model using ferrite/oxide technology prior to its introduction of thin-film components. The second circle in each pair is placed at the density achieved in its initial thin-film model. The figure depicts each firm moving from its highest density conventional model to itsfirst thin-film model. As such, it appears that most of the innovators were above the industry average curve to begin with. Each firm, however, had a range of models with a range of densities-some above and some below the industry average. The highest-density conventional models of a few of the firms-Rodime, Hewlett Packard, Quantum, Seagate, and DEC, were actually below the industry average.
Several features in Figure 5 merit comment. Only 5 of the 15 firms shown actually leapt above the ferrite/oxide envelope with their first thin-film model. Although most achieved higher density in thin film than they had in ferrite-oxide, they usually ended up within the range achievable with conventional technology when they switched S-curves. Second, thin-film technology eventually triumphed only after a decade-long battle with ferrite/oxide. Key engineering managers involved in this race indicated that the conventional technology progressed fur further than anyone had anticipated when thin-film technology was first recognized as a technological alternative. Third, different competitors switched S-curves at different points. IBM moved to thin-film technology when its ferrite-oxide capability had reached 3,500,OOO bpsi in 1979. Hitachi and Fujitsu rode the conventional S-curve far longer and had achieved 27 and 30 million bpsi, respectively-over eight times the performance IBM seemed to have identified as the limit of the ferrite-oxide approach-by the time they switched to thin film.
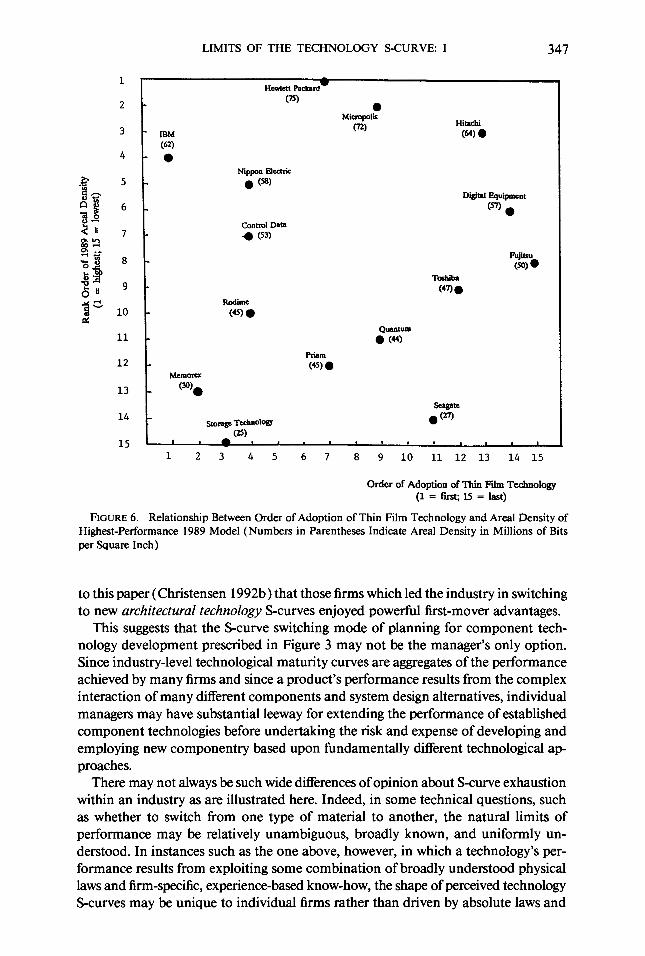
Finally and possibly most important, there is little evidence that the firms that switched component S-curves early-in this case IBM, Memorex, Storage Technology, NEC, CDC, and Rodime-enjoyed sustained first-mover advantages. I have shown this ordinally in Figure 6. The horizontal axis in that chart marks the order in which the leading firms adopted thin-film technology-IBM being first, Fujitsu being #15, and so on. The vertical axis ranks the firms according to the area1 density of their most advanced model in 1989. There seems to be no correlation between order of adoption-and presumably the deeper experience with the technology that leadership might entail-and the density each was ultimately able to achieve. In fact, the com- bined share of the total world market held by the early adopters of thin-film technology fell from 60% in 198 1 to 37% in 1989. The firms that switched curves later-Priam, Micropolis, Miniscribe, Seagate, Hewlett Packard, Quantum, Toshiba, Hitachi, DEC, and Fujitsu-saw their combined world market share rise from 10% in 198 1 to 33%.
Christensen ( 1992a) shows that the industry’s leading incumbent firms were con- sistently the leaders in developing and adopting new component technologies. Entrant firms that pioneered the use of new component technologies as a vehicle for achieving improved product performance were rarely successful: entrants enjoyed no attacker’s advantage. Many factors affect the success and failure of firms, only one of which is component technology strategy. The point, however, is that switching to new com- ponent technology S-curves early does not seem to have been necessary or sufficient for competitive success in this industry. In contrast, I show in the companion article
LIMITS OF THE TECHNOLOGY S-CURVE: I 347
1
2
3
4
.e 5 aP 13 a.$ 6
411 7 %2 a s vd3
-5 8 .&a (ju g
Id 10
11
12
13
14
15 L
Hcwim Packard-
IBM
(62) 0
Hitachi
w 0
Diitd Equipment
m 0
control Data * (53)
Rodimc
(45) 0
Quantum 0 (44)
Prism (45) 0
Memorex
e-0.
seagate
storage TeehnolW l tm (25) I I , , . I I I I
1 2 3 4 5 6 7 8 9 10 11 12 13 14 15
Order of Adoption of Thin Pii Techoology (1 = first; 15 = last)
FIGURE 6. Relationship Between Order of Adoption of Thin Film Technology and Area1 Density of Highest-Performance 1989 Model (Numbers in Parentheses Indicate Area1 Density in Millions of Bits per Square Inch)
to this paper (Christensen 1992b) that those firms which led the industry in switching to new architectural technology S-curves enjoyed powerful first-mover advantages.
This suggests that the S-curve switching mode of planning for component tech- nology development prescribed in Figure 3 may not be the manager’s only option. Since industry-level technological maturity curves are aggregates of the performance achieved by many firms and since a product’s performance results from the complex interaction of many different components and system design alternatives, individual managers may have substantial leeway for extending the performance of established component technologies before undertaking the risk and expense of developing and employing new componentry based upon fundamentally different technological ap- proaches.
There may not always be such wide differences of opinion about S-curve exhaustion within an industry as are illustrated here. Indeed, in some technical questions, such as whether to switch from one type of material to another, the natural limits of performance may be relatively unambiguous, broadly known, and uniformly un- derstood. In instances such as the one above, however, in which a technology’s per- formance results from exploiting some combination of broadly understood physical laws and firm-specific, experience-based know-how, the shape of perceived technology S-curves may be unique to individual firms rather than driven by absolute laws and
348 C. M. CHRISTENSEN
physical relationships. Descriptions and predictions based upon industry-level ma- turity curves, therefore, need not and possibly should not be taken as prescriptions of firm-level strategy.
Do Systematic Differences Exist in How Firms Respond to Potential Maturity in Component Technology?
Given this ambiguity in whether and when to switch to new component technology S-curves, it is instructive to examine whether leading disk drive manufacturers re- sponded to that ambiguity in any systematic way-to see whether some firms’ tech- nology strategies might emphasize switching component technology S-curves, while the strategies of other firms might emphasize extending the S-curves of current com- ponent technologies. To do this, I compared data on changes in the component and architectural technologies employed in each firm’s disk drive models with changes in the performance of these models over the 1976-1989 period, to trace the means by which each firm achieved performance improvement. Based on this analysis, I found that some firms, such as IBM, tended systematically to rely upon frequent switches to more advanced component technologies as a primary driver of perfor- mance improvement. Other firms, such as Hewlett Packard, tended to rely upon incremental improvements in established component technologies and upon refine- ments in system design to achieve competitive performance improvements. Most hrms’ tendencies were consistent over time, essentially reflecting conscious or de facto technology strategies.
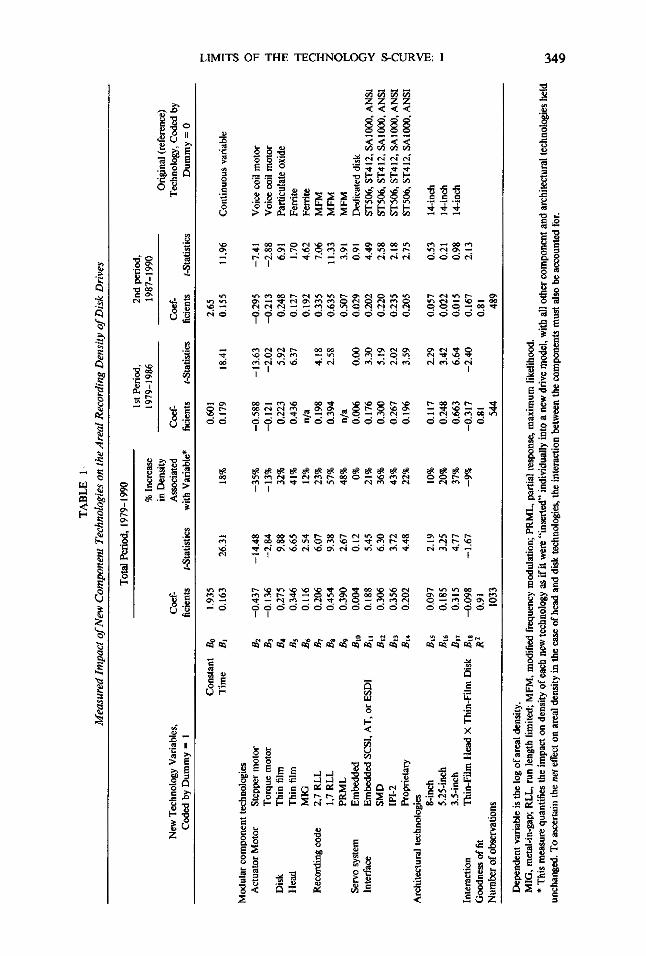
These findings emerged from a regression analysis, in which I estimated coefficients to a multivariate equation that describes the log of area1 recording density as a function of ( 1) the year in which a model was first shipped and (2) technologies employed in that model for the components that most directly determine area1 density-actuator motors, disks, heads, recording codes, interfaces, and the basic architectural tech- nologies. Data used to estimate these coefficients were the detailed product specifi- cations for every disk drive model announced in the world between 1979 and 1990. I coded the technologies used in these models by dummy variables: use of the early, dominant technology was coded as 0, and use of a new technology was coded as 1. In some components, there was a progression of new technologies over the period studied rather than a single new replacement, technology. For example, modified frequency modulation (MFM) recording codes were replaced by the sequence of 2,7RLL; 1,7RLL; and partial response, maximum likelihood ( PRML) codes. The dummy variable technique used here measures the impact on density of each of these technologies relative to the original technology ( MFM in the case of code tech- nology), rather than measuring density relative to the immediately prior technology. Table 1 describes the variables included in this exercise, along with the coefficients and t-statistics, which were estimated using multiple least squares.
The interaction between head and disk technologies was captured in an interaction term in this specification. Interviews with industry technical experts suggested that from an engineering perspective, this was the primary interaction that needed to be measured to isolate the impact of changes in individual component technologies on improvements in recording density. To gauge the stability of the measured coefficients over time, I split the sample into two periods, 1979-1986 and 1987-I 990. The coef- ficients of the equation estimated from these two subsets of the population are reported in the right-most columns of Table 1. To better understand possible differences in strategic approaches toward new component technology, I first estimated the coef-
TAB
LE
l-
Mea
sure
d Im
pact
of
New
Com
pone
nt T
echn
olog
ies
on th
e A
rea1
Rec
ordi
ng D
ensi
ty o
f Dis
k D
rives
New
Tec
hnol
ogy
Var
iabl
es,
Cod
ed b
y D
umm
y =
1
Tota
l P
erio
d, 1
979-
199
0 1s
t Per
iod,
2n
d pe
riod,
%
Incr
ease
19
79-1
986
1987
-199
0 in
Den
sity
O
rigin
al
(refe
renc
e)
Coe
f- A
ssoc
iate
d C
oef-
Coe
f- Te
chno
logy
, C
oded
by
ficie
nts
Z-S
tatis
tics
with
Var
iabl
e*
ficie
nts
r-Sta
tistic
s fic
ient
s t-S
tatis
tics
Dum
my
= 0
Con
stan
t B
0 1.
935
Tim
e B
r 0.
163
Mod
ular
co
mpo
nent
te
chno
logi
es
Act
uato
r M
otor
S
tepp
er m
otor
B
2 To
rque
m
otor
B
3 D
isk
Thin
fil
m
&
Hea
d Th
in
film
B
S
MIG
B6
Rec
ordi
ng c
ode
2,7
RLL
B7
1,7
RLL
B8
PR
ML
&
Serv
o sy
stem
E
mbe
dded
40
In
terfa
ce
Em
bedd
ed S
CS
I, A
T, o
r E
SD
I &
I SM
D
Bt2
1P
I-2
43
Prop
rieta
ry
&4
Arc
hite
ctur
al
tech
nolo
gies
8-
inch
&
5 5.
25in
ch
&6
3.5i
nch
47
Inte
ract
ion
Thin
-Film
H
ead
X T
hin-
Film
D
isk
B18
G
oodn
ess
of f
it R
2 N
umbe
r of
obs
erva
tions
-0.4
37
- 14
.48
-35%
-0
.588
-0
.136
-2
.84
-13%
-0
.121
0.
275
9.88
32
%
0.22
3 0.
346
6.65
41
%
0.43
6 0.
116
2.54
12
%
n/a
0.20
6 6.
07
23%
0.
198
0.45
4 9.
38
57%
0.
394
0.39
0 2.
67
48%
n/
a 0.
004
0.12
0%
0.
006
0.18
8 5.
45
21%
0.
176
0.30
6 6.
30
36%
0.
300
0.35
6 3.
72
43%
0.
267
0.20
2 4.
48
22%
0.
196
0.09
7 0.
185
0.31
5 -0
.098
0.
91
1033
26.3
1
2.19
3.
25
4.77
-1
.67
0.60
1 2.
65
18%
0.
179
18.4
1 0.
155
-13.
63
-2.0
2 5.
92
6.37
4.18
2.
58
0.00
3.
30
5.19
2.
02
3.59
10%
0.
117
2.29
0.
057
20%
0.
248
3.42
0.
022
37%
0.
663
6.64
0.
015
-9%
-0
.317
-2
.40
0.16
7 0.
8 1
0.8
1 54
4 48
9
11.9
6 C
ontin
uous
va
riabl
e
-0.2
95
-7.4
1 V
oice
coi
l m
otor
-0
.213
-2
.88
Voi
ce c
oil
mot
or
0.24
8 6.
91
Par
ticul
ate
oxid
e 0.
127
1.70
Fe
rrite
0.
192
4.62
Fe
rrite
0.
335
7.06
M
FM
0.63
5 11
.33
MFM
0.
507
3.91
M
FM
0.02
9 0.
91
Ded
icat
ed d
isk
0.20
2 4.
49
ST5
06,
ST4
12,
SA
lOO
O, A
NS
I 0.
220
2.58
S
T506
, S
T4 1
2, S
A 1
000,
AN
SI
0.23
5 2.
18
ST5
06,
ST4
12,
SA
100
0, A
NS
I 0.
205
2.75
S
T506
, S
T4 1
2, S
A 1
000,
AN
SI
0.53
0.
21
0.98
2.
13
14-in
ch
1Cin
ch
14-in
ch
Dep
ende
nt v
aria
ble
is th
e lo
g of
are
a1 de
nsity
. M
IG,
met
al-in
-gap
; R
LL,
run
leng
th l
imite
d;
MFM
, m
odifi
ed
frequ
ency
mod
ulat
ion;
P
RM
L,
parti
al r
espo
nse,
max
imum
lik
elih
ood.
*
This
mea
sure
qua
ntifi
es t
he im
pact
on
dens
ity o
f ea
ch n
ew te
chno
logy
as
if it
wer
e “in
serte
d”
indi
vidu
ally
in
to a
new
driv
e m
odel
, w
ith a
ll ot
her
com
pone
nt
and
arch
itect
ural
te
chno
logi
es h
eld
unch
ange
d. T
o as
certa
in t
he n
et e
ffect
on
area
1 den
sity
in
the
case
of
head
and
dis
k te
chno
logi
es,
the
inte
ract
ion
betw
een
the
com
pone
nts
mus
t als
o be
acc
ount
ed f
or.
350 C. M. CHRISTENSEN
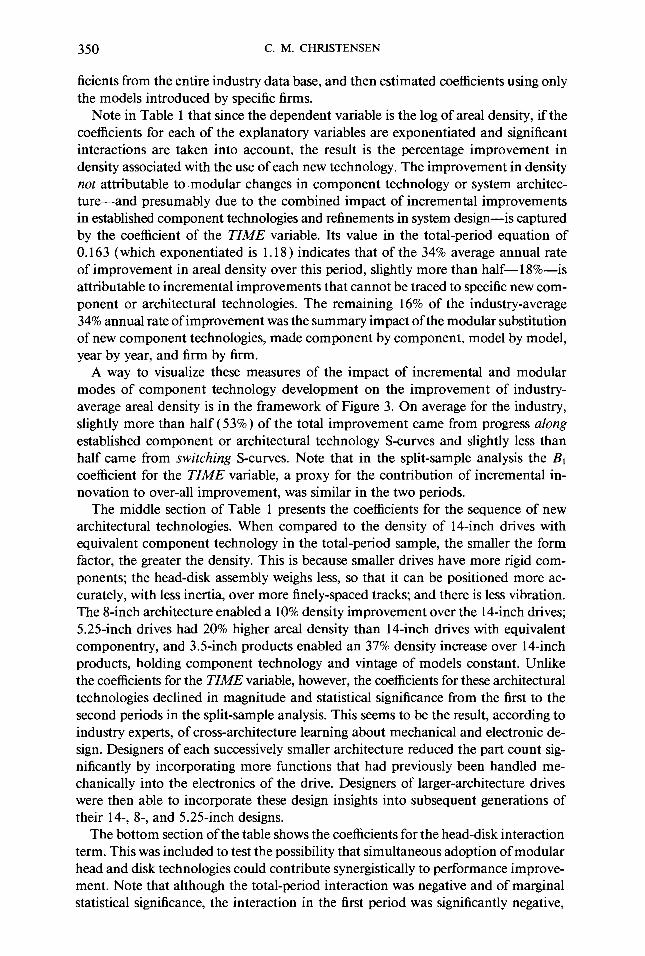
ficients from the entire industry data base, and then estimated coefficients using only the models introduced by specific firms.
Note in Table 1 that since the dependent variable is the log of area1 density, if the coefficients for each of the explanatory variables are exponentiated and significant interactions are taken into account, the result is the percentage improvement in density associated with the use of each new technology. The improvement in density not attributable to.modular changes in component technology or system architec- ture-and presumably due to the combined impact of incremental improvements in established component technologies and refinements in system design-is captured by the coefficient of the TIME variable. Its value in the total-period equation of 0.163 (which exponentiated is 1.18 ) indicates that of the 34% average annual rate of improvement in area1 density over this period, slightly more than half-18%-is attributable to incremental improvements that cannot be traced to specific new com- ponent or architectural technologies. The remaining 16% of the industry-average 34% annual rate of improvement was the summary impact of the modular substitution of new component technologies, made component by component, model by model, year by year, and firm by firm.
A way to visualize these measures of the impact of incremental and modular modes of component technology development on the improvement of industry- average area1 density is in the framework of Figure 3. On average for the industry, slightly more than half (53%) of the total improvement came from progress along established component or architectural technology S-curves and slightly less than half came from switching S-curves. Note that in the split-sample analysis the B, coefficient for the TIME variable, a proxy for the contribution of incremental in- novation to over-all improvement, was similar in the two periods.
The middle section of Table 1 presents the coefficients for the sequence of new architectural technologies. When compared to the density of 14-inch drives with equivalent component technology in the total-period sample, the smaller the form factor, the greater the density. This is because smaller drives have more rigid com- ponents; the head-disk assembly weighs less, so that it can be positioned more ac- curately, with less inertia, over more finely-spaced tracks; and there is less vibration. The 8-inch architecture enabled a 10% density improvement over the 14-inch drives; 5.25-inch drives had 20% higher areal density than 14-inch drives with equivalent componentry, and 3.5~inch products enabled an 37% density increase over 14-inch products, holding component technology and vintage of models constant. Unlike the coefficients for the TIME variable, however, the coefficients for these architectural technologies declined in magnitude and statistical significance from the first to the second periods in the split-sample analysis. This seems to be the result, according to industry experts, of cross-architecture learning about mechanical and electronic de- sign. Designers of each successively smaller architecture reduced the part count sig- nificantly by incorporating more functions that had previously been handled me- chanically into the electronics of the drive. Designers of larger-architecture drives were then able to incorporate these design insights into subsequent generations of their 14-, 8-, and 5.25-inch designs.
The bottom section of the table shows the coefficients for the head-disk interaction term. This was included to test the possibility that simultaneous adoption of modular head and disk technologies could contribute synergistically to performance improve- ment. Note that although the total-period interaction was negative and of marginal statistical significance, the interaction in the first period was significantly negative,
LIMITS OF THE TECHNOLOGY S-CURVE: I 351
while it was significantly positive in the latter period. A possible interpretation of this, which is consistent with information I obtained in interviews with company engineers, is that in the early years of a component technology’s commercial existence, the system-wide impact of incorporating it into a design is inadequately understood. Designers who used thin film heads and disks together in the early years therefore suffered a performance penalty-negative synergy-because the system-wide impact of the components was unknown. As designers learned about these technologies, they were able to optimize the design to capture the full benefits, so that use of thin- film heads and disks created positive synergy in the second period. There was not a collinearity problem in measuring the individual contribution of thin-film heads and disks to increases in recording density. Thin-film disks penetrated much more rapidly than disks, so that there were many models using ferrite heads with thin- film disks. Conversely, there were also a number of firms which used thin film heads with oxide disks.
The R* value of 0.9 1 indicates that the variables included in the equation accounted for 91% of the variation in the area1 density of the 1,033 models in the total-period data base.
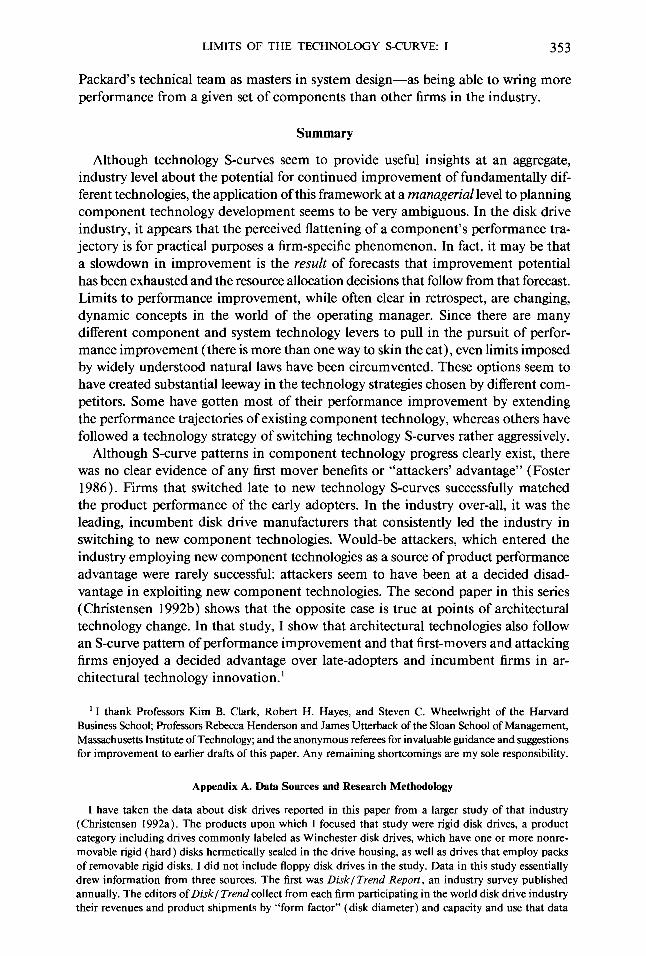
To explore whether firms’ technology strategies might differ systematically along the spectrum of relying upon incremental versus modular component technology development as the primary engine of system performance improvement, I estimated the equation specified in Table 1 separately for several of the industry’s leading firms. Table 2 presents the results for two technology/performance leaders, IBM and Hewlett Packard. The average area1 density of the product lines of both firms increased at approximately the same rate as the industry average over the period studied, 35%. The coefficients for the TIME variable shown in Table 2 indicate, however, that the source.s of that improvement were different for the two firms. For IBM, the coefficient of the TIME variable, Br , was 0.14, indicating (when the coefficient is exponentiated) that IBM realized about 15% density improvement each year from incremental in- novations. Since IBM’S total annual improvement in density was 35%, this means that the other 20% annual improvement came from switching to the new component technologies specified in the equation. In contrast, the Br coefficient for the TIME variable in the Hewlett Packard equation was 0.24. This means, when the coefficient is exponentiated, that Hewlett Packard achieved a 27% annual rate of improvement in density through incremental technological change alone, without relying on the modular adoption of new component technologies. Adoption of new, modular com- ponent technologies accounted only for 8% annual improvement (27 + 8 = 35% over-all annual rate of improvement). Indeed, there were a number of component technologies that IBM had adopted which Hewlett Packard never employed during this period.
In other words, these two firms employed very different means to achieve nearly identical’annual rates of density improvement: IBM derived most of its improvement from switching to new component technologies in the “strategic leaps” tradition noted by Hayes ( 1985), while Hewlett Packard’s performance improvement came largely from extending the efficacy of technological approaches it already employed.
This statistical finding is consistent with the views of IBM and Hewlett Packard’s technological strengths which industry engineering managers expressed in my inter- views with them. IBM managers and their competitors uniformly viewed IBM’S tech- nological strength as component technology development, while they saw Hewlett
TAB
LE
2 M
easu
red
Impa
ct
of In
crem
enta
l In
nova
tion
and
New
Com
pone
nt T
echn
olog
ies
on th
e A
rea1
Rec
ordi
ng D
ensi
ty o
f Dis
k D
rives
: A
Com
paris
on
of IB
M
and
Hew
lett
Pac
kard
Pro
duct
s
New
Tec
hnol
ogy
Var
iabl
es,
Cod
ed b
y D
umm
y =
I
Con
stan
t B
0 Ti
me
Bi
IBM
H
ewle
tt P
acka
rd
Orig
inal
(re
fere
nce)
Te
chno
logy
, C
oded
by
Coe
ffici
ents
t-S
tatis
tics
Coe
ffici
ents
f-S
tatis
tics
Dum
my
= 0
3.86
-3
.8 1
0.
140
10.4
7 0.
240
6.35
C
ontin
uous
va
riabl
e
Mod
ular
co
mpo
nent
te
chno
logi
es
Act
uato
r M
otor
S
tepp
er m
otor
&
-0
.406
-3
.96
-*
Voi
ce c
oil
mot
or
Torq
ue
mot
or
B3
Voi
ce c
oil
mot
or
Dis
k Th
in
film
B
4 0.
191
2.41
1.
12
4.88
P
artic
ulat
e ox
ide
0
Hea
d Th
in
film
B
S
1.07
0 10
.31
0.21
8 1.
41
Ferri
te
MIG
B6
0.
089
g 0.
97
Ferri
te
Rec
ordi
ng c
ode
2.7
RLL
B
7 0.
290
2.86
0.
571
3.34
M
FM
1,7
RLL
&
I 0.
348
2.83
-*
M
FM
$ P
RM
L B
9 0.
820
4.43
-*
M
FM
t;
Serv
o sy
stem
E
mbe
dded
&
I 0.
006
0.91
-0
.279
-3
.53
Ded
icat
ed d
isk
ii
Inte
rface
E
mbe
dded
SC
SI,
AT,
or
ES
DI
&I
0.19
9 1.
85
-*
ST5
06,
ST4
12,
SA
lOO
O, A
NS
I z
SMD
&
2 S
T506
, S
T412
, S
AIO
OO
, AN
SI
K
r 1P
I-2
&3
0.36
0 2.
09
ST5
06,
ST4
12,
SA
IOO
O, A
NS
I Pr
oprie
tary
B
14
-0.1
89
-1.6
7 -*
S
T506
, S
T412
, S
AIO
OO
, AN
SI
Arc
hite
ctur
al
tech
nolo
gies
g-
inch
B
IS
0.37
3 4.
17
-0.0
97
-0.4
I
ICin
ch
5.25
-inch
&
6 -0
.039
-0
.03
I 0.
151
1.20
1C
inch
3.
5-in
ch
47
0.40
6 2.
61
-0.1
32
-1.3
3 1C
inch
In
tera
ctio
ns
Thin
-Film
H
ead
X T
hin-
Film
D
isk
Bls
-0
.610
-3
.32
0.19
1 0.
03
Goo
dnes
s of
fit
R2
0.97
0.
97
Num
ber
of O
bser
vatio
ns
126
49
Dep
ende
nt v
aria
ble
is th
e lo
g of
are
a de
nsity
. Fo
r ab
brev
iatio
ns.
see
Tabl
e 1.
*
Hew
lett
Pac
kard
nev
er p
rodu
ced
mod
els
empl
oyin
g st
eppe
r m
otor
s,
I .7
RLL
an
d P
RM
L re
cord
ing
code
s, a
nd S
T506
, S
T412
, S
AIO
OO
, or
AN
SI
inte
rface
s, s
o th
e co
ntrib
utio
n of
new
int
erfa
ce
tech
nolo
gies
rel
ativ
e to
the
se s
tand
ards
cou
ld n
ot b
c ca
lcul
ated
.
LIMITS OF THE TECHNOLOGY S-CURVE: I 353
Packard’s technical team as masters in system design-as being able to wring more performance from a given set of components than other firms in the industry.
Summary
Although technology S-curves seem to provide useful insights at an aggregate, industry level about the potential for continued improvement of fundamentally dif- ferent technologies, the application of this framework at a managerial level to planning component technology development seems to be very ambiguous. In the disk drive industry, it appears that the perceived flattening of a component’s performance tra- jectory is for practical purposes a firm-specific phenomenon. In fact, it may be that a slowdown in improvement is the result of forecasts that improvement potential has been exhausted and the resource allocation decisions that follow from that forecast. Limits to performance improvement, while often clear in retrospect, are changing, dynamic concepts in the world of the operating manager. Since there are many different component and system technology levers to pull in the pursuit of perfor- mance improvement (there is more than one way to skin the cat), even limits imposed by widely understood natural laws have been circumvented. These options seem to have created substantial leeway in the technology strategies chosen by different com- petitors. Some have gotten most of their performance improvement by extending the performance trajectories of existing component technology, whereas others have followed a technology strategy of switching technology S-curves rather aggressively.
Although S-curve patterns in component technology progress clearly exist, there was no clear evidence of any first mover benefits or “attackers’ advantage” (Foster 1986). Firms that switched late to new technology S-curves successfully matched the product performance of the early adopters. In the industry over-all, it was the leading, incumbent disk drive manufacturers that consistently led the industry in switching to new component technologies. Would-be attackers, which entered the industry employing new component technologies as a source of product performance advantage were rarely successful: attackers seem to have been at a decided disad- vantage in exploiting new component technologies. The second paper in this series (Christensen 1992b) shows that the opposite case is true at points of architectural technology change. In that study, I show that architectural technologies also follow an S-curve pattern of performance improvement and that first-movers and attacking firms enjoyed a decided advantage over late-adopters and incumbent firms in ar- chitectural technology innovation.’
i I thank Professors Rim B. Clark, Robert H. Hayes, and Steven C. Wheelwright of the Harvard Business School; Professors Rebecca Henderson and James Utterback of the Sloan School of Management, Massachusetts Institute of Technology; and the anonymous referees for invaluable guidance and suggestions for improvement to earlier drafts of this paper. Any remaining shortcomings are my sole responsibility.
Appendix A. Data Sources and Research Methodology
I have taken the data about disk drives reported in this paper from a larger study of that industry (Christensen 1992a). The products upon which I focused that study were rigid disk drives, a product category including drives commonly labeled as Winchester disk drives, which have one or more nonre- movable rigid (hard) disks hermetically sealed in the drive housing, as well as drives that employ packs of removable rigid disks. I did not include floppy disk drives in the study. Data in this study essentially drew information from three sources. The first was Disk/ Trend Report, an industry survey published annually. The editors of Disk/ Trend collect from each firm participating in the world disk drive industry their revenues and product shipments by “form factor” (disk diameter) and capacity and use that data
354 C. M. CHRISTENSEN
to calculate the size of each product-market segment, as well as average pricing levels in each segment. They also report the disk drive revenues of each firm and market shares of the principal competitors in each product-market segment. In addition, Disk/ Trend publishes detailed product performance speci- fications and a listing of component technologies used in each mode1 currently offered for sale by each of the manufacturers. This listing includes the year and month of first shipment for each disk drive mode1 as well as the list price for a majority of the models. In addition, the editors of Disk/ Trend allowed me to draw additional data not published in the Report from manufacturers’ product specification sheets on file in the Disk/ Trend archives. I used this data to identify the specific models in which each new component and architectural technology was first used in the industry and to trace the patterns of diffusion for each of these new technological approaches. By charting each firm’s revenues, by size and capacity of drive over time, I could reconstruct the commercial fortunes of each firm in considerable detail. I gratefully acknowledge the generous assistance of the editors and staff of Disk/ Trend Report during this project.
The second source of data for the study were trade publications, particularly Electronic Business Magazine. I searched each monthly (and more recently, twice-monthly) issue of Electronic Business since it was first published in 1976 for notes and articles about disk drive technology, the disk drive industry, and firms participating in it. My purpose was to understand more completely the corporate histories, organizational structures, and competitive strategies pursued by the competitors in the industry, as well as to identify additional disk drive manufacturers that might not have been captured in Disk/ Trend Report (I found only one such firm). I combined this information with the data from Disk/ Trend on the sources and patterns of diffusion for each new technology to analyze which types of firms tended to pioneer the development and adoption of each new technology. This enabled me to determine the patterns of commercial success and failure among different groups of firms. Comparisons of entrants versus established firms (building on the work of Henderson and Clark 1990) proved particularly fruitful, as did comparisons of firms whose corporate forms were different: venture capital-backed start-ups, vertically integrated computer manufacturers, integrated firms that produced other magnetic recording products, and horizontally diversified firms that produced other computer peripheral products, such as printers and tape drives.
The third category of data used in the study was information from over 60 persona1 interviews with founders and key engineering and marketing executives associated with eight of the major disk drive manufacturers: IBM, CW, Digital Equipment, Micropolis, Quantum, Seagate Technology, Miniscribe, and Conner Peripherals. In addition, I interviewed executives at the three largest independent component manufacturing firms: Komag, Read-Rite, and Applied Magnetics. I also interviewed other industry experts and consultants. My purpose in these interviews was to understand and reconstruct as carefully as possible the managerial decision processes that led to these firms’ decisions whether or not to develop and deploy particular new technologies, whose importance to the industry was highlighted through work with the data described above.
I gratefully acknowledge the support of the Harvard Business School Division of Research, whose financial assistance made a study of this scope possible.
Appendix B. Glossary of Technical Terms
Actuator
The mechanism that positions the head over the proper track on the drive, The class of actuators that has become most commonly used because of its superior positioning ability is called a “voice coil” motor. This operates on a principle similar to that used in telephones: an arm is moved in and out via electro- magnetic forces. Voice coil motors have been made in linear and rotary designs, but the rotary design, which works like the arm on a phonograph, has become the dominant design because it requires less space. A much less expensive actuator mechanism is a stepper motor, in which a shaft rotates in discrete steps to new positions in response to changes in the surrounding magnetic field. Stepper motors are much less expensive than voice coil motets and were used primarily on low-capacity drives targeted to price- sensitive markets. Torque motors and DC motors were also used on a limited number of models in the low-moderate performance range.
Areal Density
The amount of information that can be stored in a square inch of disk surface, measured in megabits per square inch (mbpsi). This is determined by multiplying the number of bits of information storable along a linear inch of track (bit density) by the number of tracks per inch of disk radius (track density).
Disk The round, rigid platter on which data is magnetically recorded. It is comprised of a substrate, typically
made of aluminum polished perfectly flat, coated with particles of magnetic metal oxide or thin metal films. These magnetic coatings are, in turn, coated with lubricating and protecting materials.
LIMITS OF THE TECHNOLOGY S-CURVE: I 355
Drive
The computer industry’s term for the equipment that contains rotating magnetic media-reels of tape, flexible (floppy) disks, or rigid disks-and that controls the flow of electronic information to and from that media.
Embedded Servo System
Mechanical shocks, differential thermal expansion, and a host of other factors can affect the accuracy with which an actuator ca’n position a head over a particular track on a disk. Low-performance drives using stepper motor actuators got around this problem by spacing the tracks far enough apart that such subtle changes and misadjustments rarely caused the head to be mispositioned over the wrong track. High-performance drives, however, require a closed-loop feedback system to the actuator, so that the head can continuously be repositioned precisely over the proper track on the disk. This enables much greater track density. One way of keeping precise head-disk alignment was to dedicate one complete surface of one disk on the spindle to tracking information only. The head reading information off that track and feeding it back to the actuator motor provided such a closed-loop, continuous-adjustment mechanism. In an embedded servo system, track identification markers are written (embedded) on each individual track of each recording surface. This frees up for user information the entire surface that otherwise would have been reserved for tracking information only.
Ferrite
A magnetic compound comprised of iron and oxygen. In disk drives, the primary use of ferrite has been as the core material around which fine copper wires were coiled to form an electromagnet in the head.
Head
A device that contains a tiny electromagnet, positioned on an arm extending over the rotating disk. When the direction of current through the head changes, its polarity switches. Because opposite magnetic poles attract, changes in the polarity of the head cause an opposite change in the polarity of the magnetic material on the disk as it spins immediately beneath the head. The head writes information in binary code in this fashion. Heads read data in the opposite manner-changes in the magnetic flux field over the disk’s surface as it spins beneath the head induce changes in the direction of current in the head, reversing the information flow. In rigid disk drives, heads are aerodynamically designed to fly a few millionths of an inch above the surface of the disk, they generally rest on its surface when the drive is at rest, take off as the disk begins spinning, and land when the disk stops again. Heads in floppy disk drives generally do not fly but glide on the disk’s surface.
Interface
This refers to the electronic circuitry through which the drive and computer communicate. A description of the differences among interfaces is beyond the scope of this paper. Originally, interfaces were custom- written by each drivemaker for each customer. Although some standard interfaces such as SMD emerged as &inch drives were used with minicomputers, the trend toward standardization was accelerated by Seagate Technology’s ST4 12 interface, which required that the rate at which the drive took data off the disk was equal to the rate at which the drive could transfer data to the computer. While low-cost and efficient, this effectively put a ceiling on the bit density of the drive. Subsequent interfaces such as SCSI (used primarily with Apple computers); AT (used with IBM-compatible computers), and ESDI (used primarily with engineering workstations) decoupled these activities. With these interfaces, the drive could take data off the disk as rapidly as its designers wanted, cache it, and then transfer it to the computer as rapidly as the computer could accept it. This enabled much greater bit densities than had been possible under the ST412 interface. Other interfaces used only on a limited number of models were IPZ-I, ZPZ- 2, and ANSI.
An acronym for modified frequency modulation, an early coding technique used in writing data on disks, wherein a magnetic marker was placed on the disk to denote the beginning and ending of each individual piece of information.
MIG Heads
An acronym for metal-in-gap, a version of ferrite head wherein a strip of metal was deposited in the gap between the leading and trailing portions of the head. This strengthened the magnetic flux fields that
356 C. M. CHRISTENSEN
could be created and sensed by the head, enabling data to be written and read on smaller domains on the disk surface.
Oxide
The term used in the industry for particles made from a compound of oxygen and a magnetic metal, such as iron, cobalt, and chromium. Oxide particles were used to coat mylar substrates to create magnetic tape and floppy disks, and to coated aluminum disks used in rigid or “hard” disk drives. The oxide particles are the media in which, through changes in the particles’ magnetic polarity, data is stored magnetically. The particles are generally of an elongated, needle-like shape.
Photolithography
The manufacturing process through which a desired pattern of one material is applied onto another substrate material. Typically, the substrate is first coated (by plating or sputtering) with the material from which the final pattern is to be made. This is in turn coated with a light-sensitive monomeric material, called a photoresist. A mask of the desired pattern is then held over the photoresist, and the unmasked material is exposed to light, causing the exposed material to cure. The unexposed photoresist is then washed away. Through a subsequent series of etching and washing steps, only the desired material, in the desired pattern, is left on the substrate. Integrated circuits are built on silicon wafers, and thin film heads are built, through photolithographic processes.
PRML
An acronym for partial response, maximum likelihood, a coding technique that has followed RLL and MFM recording codes.
Recording Density
See area1 density.
RLL
An acronym for run-length limited recording codes, which enable data to be written more densely that was possible with MFM codes. Two versions of RLL codes have been used: 2,7 and 1,7.
Spin Motor
The electric motor that drives the rotation of the spindle upon which the disks are mounted. In l4- and 8-inch drives the spin motor often was situated in the corner of the drive and drove the stack of disks via a pulley. In the 5.25 and subsequent drive architectures, a flat, direct-drive “pancake” motor was positioned beneath the spindle.
SpindIe
The shaft upon which one or more disks was mounted.
Stepper Motors
See Actuators.
Thin Film
A continuous, very thin film (often only a few angstroms thick) of a material (often a metal) on another substrate material. This is generally applied through a process called sputtering, in which a substrate is placed at the bottom of a vacuum chamber. A target of the film material is then bombarded with electrons, which dislodge ions of the target material. These ions float like a vapor in the vacuum chamber and then gradually settle in a thin, continuous film on the surface of the substrate. This deposition techniquk is one of the early production steps in the manufacture of integrated circuits and thin-film heads. It is also the technique used to coat disks with very thin films of magnetic material.
Torque Motors
See Actuators.
References
BECKER, R. H. and L. M. SPELTZ ( 1983), “Putting the S-Curve Concept to Work,” Research Management, 26, September-October, 31-33.
LIMITS OF THE TECHNOLOGY S-CURVE: I 357
CHRISTENSEN, C. M. ( 1992a), The Innovator’s Challenge: Understanding the Injluence ofMarket En- vironment on Processes of Technology Development in the Rigid Disk Drive Industry, D.B.A. dissertation, Graduate School of Business Administration, Harvard University, Cambridge, MA.
CHRISTENSEN, C. M. ( 1992b), “Exploring the Limits of the Technology S-Curve. Part II: Architectural Technologies,” Production and Operations Management, 1, 4, 358-366.
CONSTANT, EDWARD W. ( 1980), The Origins ofthe Turbojet Revolution, The Johns Hopkins University Press, Baltimore.
COOPER, A. AND D. SCHENDEL ( 1976), “Strategic Responses to Technological Threats,” Business Ho- rizons, 19, February, 6 l-69.
DREXEL, BURNHAM & LAMBERT ( 1985), The Disk Drive Industry, Drexel, Burnham, and Lambert, New York.
FOSTER, R. ( 1986), Innovation: The Attacker’s Advantage, Summit Books, New York. HAYES, ROBERT ( 1985), “Strategic Planning-Forward in Reverse? Harvard Business Review, 63, No-
vember-December, 190- 197. HENDERSON, R. ( 1988), The Failure of Established Firms in the Face of Technological Change, Ph.D.
dissertation, Harvard University, Cambridge, MA. HENDERSON, R. M. ( 1993), Of Life Cycles Real and Imaginary: The Unexpected Old Age of Optical
Lithography, mimeo paper, Sloan School of Management, Massachusetts Institute of Technology, Cambridge, MA.
HENDERSON, R. AND K. B. CLARK ( 1990), “Architectural Innovation: The Reconfiguration of Existing Systems and the Failure of Established Firms,” Administrative Science Quarterly, 35, (March), 9-32.
O’BRIEN, M. P. ( 1962), “Technological Planning & Misplanning” in Technological Planning at the Corporate Level, J. R. Bright (ed.), Harvard University Press, Cambridge, MA, 73-97.
ROUSSEL, P. A. ( 1983), “Cutting Down the Guesswork in R&D,” Harvard Business Review, 61, Seg tember-October, 154- 160.
ROUSSEL, P. A. ( 1984), “Technological Maturity Proves a Valid and Important Concept,” Research Management, 27, January-February, 29-34.
SAHAL, D. ( 198 1) , Patterns of Technological Innovation, Addison-Wesley, London. STEELE, L. ( 1983), “Managers’ Misconceptions About Technology,” Harvard Business Review, 61,
November-December, 133-140. TCHIJOV, I. AND E. NOROV ( 1989), “Forecasting Methods for CIM Technologies,” Engineering Costs
and Production Economics, 15, August, 323-389. THOMAS, L. J. ( 1984), “Technology and Business Strategy-The R&D Link,” Research Management,
27, May-June, 15- 19. TUSHMAN, M. L. AND P. ANDERSON ( 1986), “Technological Discontinuities and Organizational En-
vironments,” Administrative Science Quarterly, 3 1, 3, 439-465. TWISS, B. ( 1979), Management of Technological Innovation, Longman, London. VAN WYK, R. J., G. HAOUR, AND S. JAPP ( 1991), “Permanent Magnets: A Technological Analysis,”
R&D Management, 34, October, 30 I-308.
EDITOR’S NOTE: An earlier combined version of this paper and the following paper published in this issue won the 199 1 William Abernathy Award for the best paper in management of technology.