exploring the indirect costs of litter in scotland · exploring the indirect costs of litter in...
TRANSCRIPT

Exploring the Indirect Costs of Litter in Scotland Report to Zero Waste Scotland


Exploring the Indirect Costs of Litter in Scotland
Zero Waste Scotland works with businesses, individuals, communities and local authorities to help them reduce waste, recycle more and use resources sustainably.
Find out more at www.zerowastescotland.org.uk
Written by: Dr Chris Sherrington Dr Dominic Hogg Dr Chiarina Darrah Simon Hann


Exploring the Indirect Costs of Litter in Scotland i
EXECUTIVE SUMMARY Eunomia Research & Consulting Ltd. (Eunomia) was engaged by Zero Waste Scotland to explore the indirect costs of litter in Scotland. This report outlines the approach taken, presents the findings, and makes a number of recommendations as to how further research could give more precise estimates for specific categories of indirect costs.
E.1.0 Definitions We make the following distinction between direct and indirect costs of litter:
1 Direct costs of litter are the costs to local authorities and other duty bodies of engaging in the clean-up of litter and clearance of flytipping, including additional treatment /disposal of the associated waste; and
2 Indirect costs are those costs visited on other actors in the economy (and on nature and wildlife).
We draw a further distinction between the indirect costs which are ‘internalised’ to some extent, and others which we consider to be external costs, as follows:
1 Internalised costs are those which are already experienced through market transactions (for example, the cost of dealing with injuries to the public caused by litter, or of repairing damage to vehicles from accidents caused by litter, are internalised costs); and
2 Externalities, which are the costs that are not ‘internalised’ in market transactions (for example the sense of ‘welfare loss’ associated with the visual disamenity of a park being strewn with litter).
E.2.0 Approach As the first step, a brainstorming exercise was undertaken in which the activities involved in littering and flytipping were mapped to the potential consequences of litter on amenity, residents, economic sectors, and wildlife. This was done for both litter and flytipping, and for each of the urban, rural and marine contexts. The aim was to trace through the potential impacts of litter and flytipping as a means to highlight where potential costs may arise, and to highlight what information might be needed in order to estimate those costs.
This initial exercise framed the review of literature, from which data on potential impacts identified was sought. As a desk-based study, use was made of published data, backed up by direct communication with stakeholders where necessary. In the report, for each category of indirect cost under consideration, we show the steps involved in calculating the likely scale of costs.
E.2.1 Managing Uncertainty One of the key aims of the project was that where possible, for each cost category, initial, indicative estimates should be made as to the likely scale of indirect costs. In a number of cases, for example, in respect of crime and mental wellbeing, it is clear that litter is a contributory factor, but there is a lack of explicit evidence as to the extent of the contribution.
Our approach here is to err on the side of caution. We take the total costs to society associated with the cost category (e.g. crime, poor mental health etc.) and present what we consider, based on the evidence reviewed, to be a feasible range in terms of the contribution made by litter. Typically this range extends from 0.1% to 10% of the total cost identified. Within this range, we then state broadly where we feel the true cost is likely to lie, and our confidence in the estimate is described qualitatively.
It is also worth noting that in respect of data gaps, the absence of evidence should not necessarily be taken to indicate evidence of the absence of impacts from litter. As is made clear through the report, in the

ii Exploring the Indirect Costs of Litter in Scotland cases where we identify a need for further research, this is based largely upon strong indications of litter making a contribution to overall costs.
E.2.2 Applicability of Data to Scotland Much of the evidence is drawn from studies that focus on countries outside of Scotland. For example, much of the literature on the causal links between litter and crime relates to the USA and the Netherlands. In estimating the contribution of litter to the costs of crime in Scotland, we make use of a figure from a study in Massachusetts. Such an approach is clearly open to criticism in that there may be differences in demographics, the extent of deprivation, the types of crime etc. These criticisms are not invalid. However, in the absence of more appropriate studies, this is a useful, and not necessarily inaccurate way of determining an initial estimate.
E.2.3 Extent to Which Costs Are Cumulative It is not necessarily possible to sum together all of the identified costs to arrive at a total cost. While the costs incurred in some categories are clearly separate and distinct, there are others where there may be inter-relationships. For example, there could well be an overlap between the costs of crime and of poor mental health, and the contribution that litter makes towards these. We do not, therefore, recommend the summation of these costs.
However, it is entirely consistent for all of the ‘internalised’ costs to be encompassed, and represented, within the estimates provided for externalised costs. When individuals state a willingness to pay for a reduced level of litter in their neighbourhood, they are not just registering a preference in terms of visual disamenity. They may quite reasonably take account of a number of negative attributes that they associate with litter, which could include concerns about crime, the perceived effect on mental wellbeing, and the effect on house prices.
E.3.0 Key Findings Of the internalised costs the largest categories relate to, in descending order:
• Property values (As an illustration, if 1% of Scotland’s housing stock were devalued by 2.7% due to litter this would equate to £100 million loss)
• Mental health (Approximately £53 million);
• Crime (Up to £22.5 million);
• Road Traffic Accidents (Approximately £1 million);
• Wildfires (Approximately £1 million);
• Punctures (Approximately £1 million); and
• Rats (Approximately £1 million). However, with the exception of the impacts in respect of property values, mental health and crime, these internalised costs are considerably lower than the estimates of the key external costs, which are as follows:
• Local disamenity (£73-770 million); and
• Beach litter disamenity (£50 -100 million).
E.4.0 Recommendations for Further Research We recommend that the following areas merit further consideration.

Exploring the Indirect Costs of Litter in Scotland iii E.4.1 Better Understanding of Significant Costs There are some categories where the indicative scale of the costs, and indeed the range in the costs identified, suggests that an improved understanding is required.
Disamenity Values The evidence reviewed indicates that external costs, namely the disamenity values, are the most significant cost categories. To an extent, these should also be the most straightforward categories for further investigation, as the methodological approaches required are well developed, with significant expertise available in Scottish Universities.
Obtaining a more accurate overall understanding of the disamenity value of litter will allow for better comparison of the relative merits of undertaking further actions to tackle litter. For example, a better understanding of specific types of litter, or locations for litter, that caused greatest unhappiness for the Scottish population would help target interventions to where they were most wanted.
Well-designed studies focused specifically on the Scottish population may also be less susceptible to the claim, sometimes levelled against stated preference studies, that the values derived are somehow not ‘real’.
Mental Health Impacts In the longer term developing a better understanding of the links between litter and mental health and wellbeing will be important, not least because the extent, and cost, of mental health problems is expected, in the absence of wide-scale interventions, to continue to increase in the coming years.
The bulk of the impacts of litter on mental health and wellbeing appear to be negative, relating possibly to a sense of a lack of control over one’s local environment. By contrast, one particular area of interest is the potential for voluntary litter-picking, undertaken either as a solitary activity, or as part of a group, to have a beneficial effect on mental wellbeing. There are indications that this may indeed be the case, and one can readily perceive the possible reasons why this could be. Intuitively participant satisfaction could result from one, or a combination of the following:
• Sense of purpose;
• Mindful engagement in an outdoor activity; • Knowledge of the environmental benefits;
• Feeling of contribution to the local community; and/or
• Enjoyment of the ‘teamwork’ aspect - if carrying out the activity in a group context.
Understanding Motivators of Pro-social Behaviours Of particular interest would be an understanding of the interactions between:
A: The existing extent of littering; and B: The likelihood of members of the public to voluntarily pick litter. One could envisage a situation, on a beach for example, where there is almost no litter. The small number of items of litter that are present might be reasonably likely to be picked up by people walking on the beach. However, in a more heavily-littered context, those same people might feel ‘overwhelmed’ by the sheer volume of litter, and feel they could make little difference, and that any efforts would be almost pointless.

iv Exploring the Indirect Costs of Litter in Scotland Therefore, it would be interesting to consider how future trends in litter prevention policy might motivate, or discourage such pro-social behaviours. If an effective series of measures that reduce levels of litter were put in place, this might encourage others to pick up litter not only due to the relative absence of litter, but also due to a sense of ‘being part of something bigger’, and working towards a goal shared by wider society. This putative ‘virtuous cycle’ could, through instilling a sense of ‘connecting’ with the local environment and community, and ‘giving’, act to enhance mental wellbeing.1
By contrast, those who are currently motivated to voluntarily pick up litter may become disheartened if there is no long-term, preventative approach shown on litter prevention.
Crime This is an area where we expect there to be widespread public understanding of the arguably intuitive link between levels of litter and criminal activity. Moreover, given the potential scale of the cost of crime that could be attributed to litter, and the general public willingness for crime to be tackled, this would seem to offer good prospects for subsequent application of well-designed research.
E.4.2 Informing Policy Options While an understanding of the overall impacts is important, it would also be desirable to more clearly identify the costs associated with specific types of litter that may be amenable to specific policy interventions.
Single-use Carrier Bags One example of this would be single-use carrier bags. The Scottish Government has recently announced its intention to introduce a levy on single use carrier bags. Further research on the impacts of this may help guide any future considerations of similar measures.
Used Beverage Containers Of potentially greater relevance would be an understanding of the contribution to disamenity arising from used beverage containers (UBCs), and possibly other items such as crisp packets. We suspect, especially in the case of UBCs, due to their volume, that their contribution to disamenity is greater than is indicated by the frequency with which their presence is indicated in counts alone.
Scotland has an excellent example of a privately run deposit-refund system (DRS), operated by A.G. Barr. Understanding the avoided disamenity impacts arising from DRS schemes would lead to a more informed discussion of the relative scale of associated costs and benefits. Zero Waste Scotland is currently running a number of DRS and reverse vending pilots to further explore the vaibility of such schemes for single use containers, including their potential to reduce litter.
1 New Economics Foundation (2011) Five Ways to Wellbeing: New Applications, New Ways of Thinking, 1 January 2011

Exploring the Indirect Costs of Litter in Scotland v

vi Exploring the Indirect Costs of Litter in Scotland Contents
1.0 Introduction 10
1.1 Definitions 10
1.2 Approach 10
2.0 Identification of Key Potential Impacts 10
3.0 Internalised Costs 11
3.1 Litter as a Causal Factor in Crime 11
3.1.1 The Signalling Effect 11
3.1.2 The Role of Social Norms 12
3.1.3 Case Study: Massachusetts ‘Hotspots’ 13
3.1.4 Case Study: Washington DC Metro 14
3.1.5 Modifying Surroundings to Affect Littering Behaviour 14
3.1.6 Home Office Study: Economic and Social Costs of Crime 15
3.1.7 Study by Sinclair and Taylor 16
3.1.8 Components of the Costs of Crime in Scotland 16
3.1.9 Associated Costs in Scotland 17
3.2 The Impacts of Litter on Mental Wellbeing 19
3.2.1 Costs of Anti-depressants 19
3.2.2 Indirect Costs of Poor Mental Health 19
3.2.3 Associated Costs in Scotland 20
3.3 Indirect Costs of Drug-related Litter 21
3.3.1 Perception Differs from Reality 21
3.3.2 Evidence on Infection Rates from the Health Sector 22
3.3.3 Associated Costs in Scotland 22
3.4 Cost of Litter-related Injuries 22
3.4.1 Valuation of Accidents 22
3.4.2 Frequency of Incidents 24
3.4.3 Compensation Data 26
3.4.4 Associated Costs to Scotland 27
3.5 Cost of Injuries to Duty Body Staff 27
3.5.1 ‘On the Road’ Work 27
3.5.2 Health and Safety Executive Statistics 28
3.5.3 Associated Costs to Scotland 30
Exploring the Indirect Costs of Litter in Scotland vii
3.6 Costs of Litter-related Road Traffic Accidents 30
3.6.1 American Automobile Association Study 30
3.6.2 The American State Litter Scorecard 32
3.6.3 Vulnerability of Motorcyclists 33
3.6.4 Insurance Costs 33
3.6.5 Associated Costs to Scotland 34
3.7 Costs to Repair Punctures Caused by Litter 34
3.7.1 Associated Costs to Scotland 35
3.8 Indirect Costs of Litter to the Rail Network 35
3.8.1 Rat-related Damage 35
3.8.2 Incidents Associated with Flytipping 36
3.8.3 Associated Costs to Scotland 37
3.9 Litter-related Costs of Vermin: Rats 37
3.9.1 Overall Costs of Rat Damage 37
3.9.2 Proportion of Costs Attributable to Edible Litter 38
3.9.3 Costs of Rat Control 38
3.9.4 Associated Costs to Scotland 39
3.10 Litter-related Costs of Vermin: Pigeons 40
3.10.1 Costs of Control 40
3.10.2 Associated Costs to Scotland 41
3.11 Indirect Costs to Business 41
3.11.1 Brand Value 41
3.11.2 Most Littered Brands 41
3.11.3 Case Study: McDonald’s Expenditure on Litter Clearing 42
3.11.4 Potential Loss of Investment 44
3.11.5 Associated Costs to Scotland 44
3.12 Litter as a Cause of Wildfires 44
3.12.1 Associated Costs to Scottish Fire Services 45
3.13 Loss of Material Resource 45
3.13.1 Associated Costs to Scotland 46
3.14 Costs of Dealing with Impacts of Litter on Wildlife and Livestock 47
3.14.1 Impacts of Litter on Land-based Wildlife 47
3.14.2 Impacts of Litter on Marine Wildlife 48
3.14.3 Impacts of Litter on Livestock 49
3.14.4 Associated Costs in Scotland 49

viii Exploring the Indirect Costs of Litter in Scotland
3.15 Costs of Clean-ups to Volunteer Organisations 49
3.15.1 Beachwatch 49
3.15.2 Clean Up Scotland 50
3.15.3 Associated Costs to Scotland 51
3.16 Costs of Litter-related Flooding 51
3.16.1 Surface Water and Sewer Flooding 51
3.16.2 Drains Blocked by Litter 52
3.16.3 Associated Costs to Scotland 52
3.17 Effects of Litter on House Prices 52
3.17.1 Associated Costs to Scotland 53
3.18 Impacts of Litter on Tourism 53
3.18.1 Effects on Tourism in Sweden 54
3.18.2 Displacement Elsewhere in Scotland 54
3.18.3 Patchy Evidence 55
3.18.4 Localised Impacts 55
4.0 External Costs 56
4.1 Valuing Local Environmental Improvements 56
4.1.1 Rating of Local Environmental Factors 56
4.1.2 Willingness to Pay for Improvements 57
4.1.3 Application to Scotland 58
4.1.4 Alternative Valuations 60
4.1.5 Likely Neighbourhood Litter Disamenity Impacts in Scotland 61
4.2 Valuing the Disamenity of Beach Litter 61
4.2.1 University of Stirling Study 62
4.2.2 Eftec Study for Defra 64
4.2.3 Application to Scotland 65
4.3 Disamenity of Cigarette Litter 65
4.4 Greenhouse Gas Damage Costs 66
5.0 Indicative Scale of Impacts 71
6.0 Priority Areas for Future Work 75
6.1 Better Understanding of Significant Costs 75
6.1.1 Disamenity Values 75
6.1.2 Mental Health Impacts 75
6.1.3 Understanding Motivators of Pro-social Behaviours 75

Exploring the Indirect Costs of Litter in Scotland ix
6.1.4 Crime 76
6.2 Informing Policy Options 76
6.2.1 Single-use Carrier Bags 76
6.2.2 Used Beverage Containers 76

1.0 Introduction Eunomia Research & Consulting Ltd. (Eunomia) was engaged by Zero Waste Scotland to undertake this desk-based study, exploring the indirect costs of litter in Scotland.
1.1 Definitions In this report, we make the following distinction between direct and indirect costs of litter:
1 Direct costs of litter are the costs to local authorities and other duty bodies of engaging in the clean-up of litter and clearance of flytipping, including additional treatment/disposal of the associated waste; and
2 Indirect costs are those costs visited on other actors in the economy (and on nature and wildlife).
We draw a further distinction between the indirect costs which are ‘internalised’ to some extent, and others which we consider to be external costs, as follows:
1 Internalised costs are those which are already experienced through market transactions (for example, the cost of dealing with injuries to the public caused by litter, or of repairing damage to vehicles from accidents caused by litter, are internalised costs); and
2 Externalities, which are the costs that are not ‘internalised’ in market transactions (for example the sense of ‘welfare loss’ associated with the visual disamenity of a park being strewn with litter).
1.2 Approach Using the definition of indirect costs noted above, the approach to the work can be summarised as follows:
• Identification of key potential impacts (see Section 2.0);
• Literature review to identify evidence in respect of key potential impacts (see Sections 3.0 & 4.0);
• An indication of the relative scale of impacts (see Section 5.0); and
• Identification of priorities for future work (Section 6.0).
2.0 Identification of Key Potential Impacts The approach used to identify potential impacts was to undertake a brainstorming exercise in which the activities involved in littering and flytipping were mapped to the potential consequences of litter on amenity, residents, economic sectors, and wildlife. This was done for both litter and flytipping, and for each of the urban, rural and marine contexts. The aim was to trace through the potential impacts of litter and flytipping as a means to highlight where potential costs may arise, and to highlight what information might be needed in order to estimate those costs.
Using this exercise as a starting point, data on potential impacts identified was sought. The findings from our review of the relevant literature are presented in Sections 3.0 and 4.0.
The key potential impacts identified were:

Exploring the Indirect Costs of Litter in Scotland 11 • Litter as a Causal Factor in Crime (Section 3.1);
• The Impacts of Litter on Mental Wellbeing (Section 3.2);
• The Indirect Costs of Drug-related Litter (Section 3.3);
• The Cost of Litter-related Injuries (Section 3.4);
• Costs of Injuries to Duty Body Staff (Section 3.5);
• Costs of Litter-related Road Traffic Accidents (Section 3.6)
• Costs to Repair Punctures Caused by Litter (Section 3.6.1);
• Indirect Costs of Litter to the Rail Network (Section 3.8);
• Litter-related Costs of Vermin: Rats (Section 3.9); • Litter-related Costs of Vermin: Pigeons (Section 3.10);
• Indirect Costs to Business (Section 3.11);
• Litter as a Cause of Wildfires (Section 3.12);
• Loss of Material Resource (Section 3.13);
• Costs of Dealing with Impacts of Litter on Wildlife and Livestock (Section 3.14);
• Costs of Clean-ups to Volunteer Organisations (Section 3.15);
• Costs of Litter-related Flooding (Section 3.16);
• Effects of Litter on House Prices (Section 3.17);
• Impacts of Litter on Tourism (Section 3.18); and
• External Costs of Litter (Reflecting Disamenity Impacts) (Section 4.0).
3.0 Internalised Costs
3.1 Litter as a Causal Factor in Crime
3.1.1 The Signalling Effect In Criminology there is a theory know as Broken Windows Theory first introduced in 1982 by social scientists in an article published in The Atlantic magazine; the term originating from the following example:
“…if a window in a building is broken and is left unrepaired, all the rest of the windows will soon be broken. This is as true in nice neighbourhoods as in run-down ones. Window-breaking does not necessarily occur on a large scale because some areas are inhabited by determined window-breakers whereas others are populated by window-lovers; rather, one unrepaired broken window is a signal that no one cares, and so breaking more windows costs nothing.” 2
Urban disorder and vandalism can have a ‘signalling’ effect that encourages further crime and antisocial behaviour. In the context of the current study, this means that when faced with an environment that is already littered, all things being equal, an individual is more likely to litter given the opportunity.
2 George L Kelling and James Q Wilson ( Broken Windows: The police and neighborhood safety, www.theatlantic.com/magazine/archive/1982/03/broken-windows/304465/, Date Accessed: 8 Mar. 2013

A study by DeFrances and Titus in 19943 found a statistically significant relationship between ‘neighbourhood disorder’ and burglary outcome. They looked at four signs of neighbourhood disorder; litter, broken windows, graffiti and boarded up buildings; concluding that burglaries are more likely to be completed in neighbourhoods with higher levels of disorder.
A 2008 Dutch study4 sought to add weight to this theory, not just with regard to littering, but in respect of all forms of social disorder and minor crimes. The study found that unsuspecting participants were almost twice as likely to resort to opportunistic stealing when there was a clear and obvious proliferation of litter nearby. In one scenario created for the study, 13% of passers-by stole an envelope visibly containing 5 Euros that was left conspicuously hanging from a letter box when the area was clean, whereas 25% stole the envelope when it was surrounded by litter. The authors suggested that:
“…signs of social disorder dampened people’s impulse to act for the good of the community by eroding their sense of social obligation.”
3.1.2 The Role of Social Norms A similar academic study from 19905 attempted to identify whether social norms played a significant role in affecting the likelihood of someone littering. Again, a scenario was created in which the potential participant was invited to litter. In this case, a flyer was tucked under the driver’s windscreen wiper with no bins in sight. The scene was either a littered area or a clean area. In half of the instances the participants had previously walked by an actor who littered the same flyer. This was expected to draw the participant’s attention to the cleanliness, or otherwise, of the area. As expected, the highest rate of littering was in a littered area after witnessing someone else litter (54%), with a lower rate if they had not witnessed litter dropping (32%). Interestingly, the lowest level of littering (6%) was in a clean area after witnessing litter being dropped which was less than half the incident rate if they had not seen the act of littering (14%).
This appears to support the theory that some people are happy to accept and comply with the social norm that they are presented with. In this case it was deemed acceptable to litter when litter was already present, especially if someone else is observed littering. However, if someone else is observed littering in a clean area, it might be argued that this reinforces the view that a social norm is being broken, which discourages them from also littering.
Interestingly, the act of littering is often associated with feelings of guilt as shown by a Keep Britain Tidy report from 2010.6 This study found that 75% of people feel guilty about their littering (by contrast only 64% of people felt guilty for claiming to be ill to have a day off work). People’s assessment of what constitutes the ‘descriptive norm’ for an area is able to be influenced
3 DeFrances, C. J., & Titus, R. M. (1994). The environment and residential burglary outcomes. Proceedings of the International Seminar on Environmental Criminology and Crime Analysis. Coral Gables, FL, 46-56. 4 Kees Keizer and et al. (2008) The Spreading of Disorder, 2008 5 Cialdini and et al. (1990) A Focus Theory of Normative Conduct: Recycling the Concept of Norms to Reduce Littering in Public Places, Journal of Personality and Social Psychology, Vol.58, No.6, pp.1015-1026. 6 Keep Britiain Tidy (2006) The word on the Street, 2006, http://www.keepbritaintidy.org/ImgLibrary/KBT_A5_State_of_Nation_6pp_single_pages_1447.pdf
Exploring the Indirect Costs of Litter in Scotland 13 by drawing their attention to their environment. This was highlighted in another test performed during the 19907 study involving flyers on windscreens.
A single piece of salient litter was placed in an otherwise clean environment; this actually acted as a deterrent to littering rather than encouraging it. The conclusion of the study was that because there was only one piece of litter, it drew the participants’ attention to the fact that the area was (otherwise) clean. As cleanliness was positioned as the ‘descriptive norm’ for that place, it was the single piece of litter that was breaking that norm, and hence there existed social pressure not to litter. Therefore, if these trigger factors are controlled, it would appear that there is potential to reduce littering.
3.1.3 Case Study: Massachusetts ‘Hotspots’ In a real life example in Massachusetts, USA, 34 crime ‘hotspots’ were identified by police and researchers using computerised mapping to locate the densest clusters of emergency calls made by the public.8 These hotspots suffered from litter-strewn streets, broken street lights, abandoned buildings, public drinking and loitering, along with more serious crime, and accounted for 23.5% of the total crime and disorder calls made to that police department during 2004. As the hotspots only accounted for 2.7% of the total area the police department covered, it was clear that the concentration of crime in these areas was high.
In the course of the randomized research study, officials focused on cleaning up these low level problems in half of the neighbourhoods identified with the other half remaining untouched as a control. The intervention lasted for one year and the areas were monitored for six months afterwards. The areas that were subject to the clean-up saw a 19.8% fall in calls to the police with, importantly, no associated increase in surrounding areas. Although the use of emergency calls as an indicator of overall crime rate could have the potential to under report (lack of phones in poverty stricken areas), or over report (multiple calls for the same crime), the study argues that this is more reliable than incident or arrest data due to it being less affected by police discretion. These areas also saw a 26.8% post-test reduction in litter in the hotspots, compared with an 11.4% increase in the control areas. This was based on observational data that was used to support the emergency call statistics.
The study concluded that cleaning up the physical environment has a greater effect on localised crime than misdemeanour arrests would have. Importantly, it appeared to reduce crime rather than simply displace it. From this, it is possible to suggest that the act of clearing up litter as soon as possible after it occurs would reduce the cost of clean-up, and associated negative social impacts, in the long term. This may ultimately lead to a reduction in the volume of litter that is dropped as the likelihood for people to litter should be reduced when they are in a cleaner environment.
7 Cialdini and et al. (1990) A Focus Theory of Normative Conduct: Recycling the Concept of Norms to Reduce Littering in Public Places, Journal of Personality and Social Psychology, Vol.58, No.6, pp.1015-1026. 8 Anthony Braga et al (2008) Policing Crime and Disorder Hot Spots: A radomized Controlled Trial

3.1.4 Case Study: Washington DC Metro Another practical example was demonstrated by the crime rates experienced in the Washington DC metro system since it was built in 1976.9 It has had consistently low crime rates compared to other metro systems in the US with between 75-88% less crimes per million ‘riders’. This is attributable to a combination of design characteristics, management practices, and maintenance policies that incorporate principles of situational crime prevention:10
“…Platforms, cars, and corridors are free of litter; graffiti is removed within 24 hours; and vandalism damage is repaired promptly. These actions diminish the psychic thrill for litterers, graffiti artists, and vandals because neither they nor their friends are given the chance to appreciate their work for long.”
3.1.5 Modifying Surroundings to Affect Littering Behaviour The potential to affect the likelihood of littering by modifying surroundings is further reinforced by a 2001 study by ENCAMS into littering behaviour.11 Through the use of focus groups, the study aimed to survey a particular group of people it termed ‘sympathisers’ by using segmentation to determine what sort of attitudes exist towards litter and whether these attitudes are commonly held between different groups of people. Sympathisers are defined as- “Aware of the main issues and sympathetic to the idea of sustainability but taking only small minor actions”. A hierarchy of littering acceptability was subsequently developed as part of the study as shown in Figure 1.
ENCAMS (now Keep Britain Tidy) has used this hierarchy ever since, and it remains their benchmark for litter segmentation behaviour. The two ends of the scale clearly show that there is some social pressure in action depending upon the surroundings. People are more likely to perpetuate the accepted norm, and have fewer qualms about breaking rules, if there seems to be a localised rebellion against those rules: as expressed by one interviewee:
“If an area is already dirty or run down, then generally people would be less concerned about adding to the problem. If you are in an area where there is a lot of litter anyway you’ll not feel as guilty.”12
It is perhaps a step too far to suggest there are direct links between littering and high level crime based on this evidence, but it is clear that it is one of the contributory factors in allowing an area to slowly become run down as the residents, and those who may be passing through, lose respect and a sense of pride for the area. This is crystallised in an influential study by Perkins et al. in 1992;13
9 Nancy G.La Vigne (1997) Visibility and Vigilance: Metro's Situational Approach to Preventing Subway Crime, Report for National Institute of Justice, November 1997 10 Nancy G.La Vigne (1997) Visibility and Vigilance: Metro's Situational Approach to Preventing Subway Crime, Report for National Institute of Justice, November 1997 11 ENCAMS (2001) Segmentation Research: Public Behavioural Survey into Littering, 30 October 2001 12 ENCAMS (2001) Segmentation Research: Public Behavioural Survey into Littering, 30 October 2001 13 Perkins et al (1992) The Physical Environment of Street Blocks and Resident Perceptions of Crime and Disorder: IMplications for Theory and Measurement
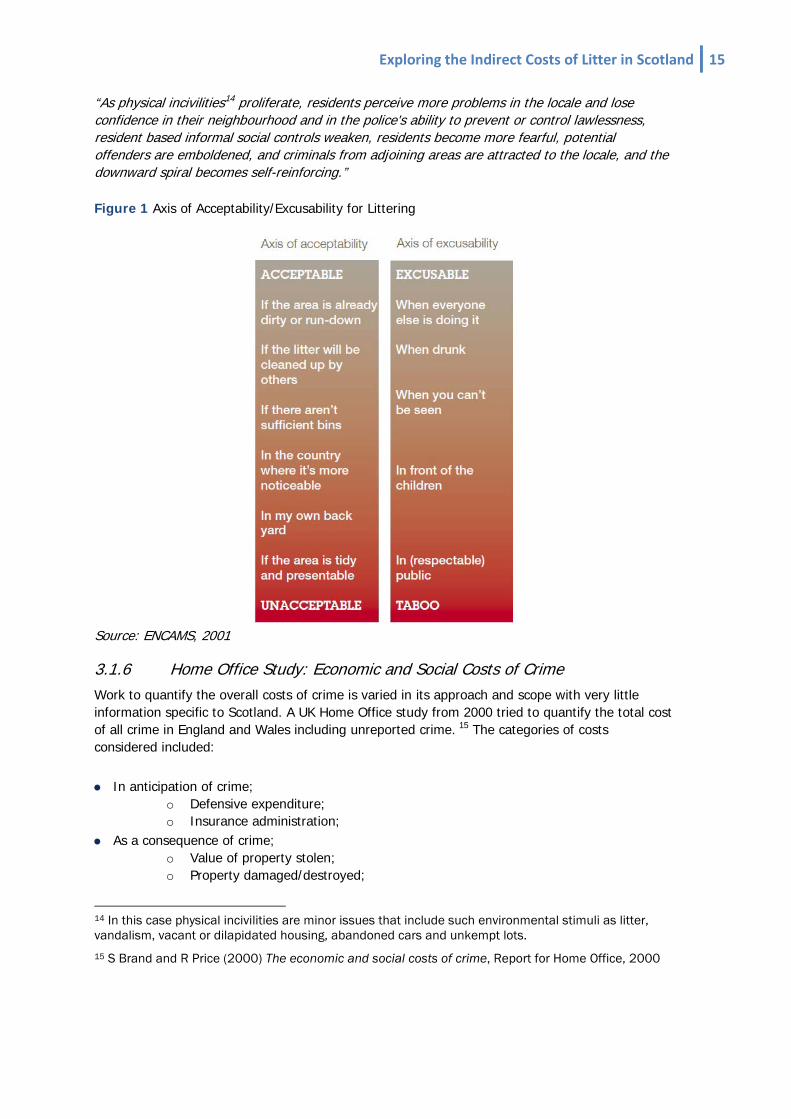
Exploring the Indirect Costs of Litter in Scotland 15 “As physical incivilities14 proliferate, residents perceive more problems in the locale and lose confidence in their neighbourhood and in the police's ability to prevent or control lawlessness, resident based informal social controls weaken, residents become more fearful, potential offenders are emboldened, and criminals from adjoining areas are attracted to the locale, and the downward spiral becomes self-reinforcing.”
Figure 1 Axis of Acceptability/Excusability for Littering
Source: ENCAMS, 2001
3.1.6 Home Office Study: Economic and Social Costs of Crime Work to quantify the overall costs of crime is varied in its approach and scope with very little information specific to Scotland. A UK Home Office study from 2000 tried to quantify the total cost of all crime in England and Wales including unreported crime. 15 The categories of costs considered included:
• In anticipation of crime; o Defensive expenditure; o Insurance administration;
• As a consequence of crime; o Value of property stolen; o Property damaged/destroyed;
14 In this case physical incivilities are minor issues that include such environmental stimuli as litter, vandalism, vacant or dilapidated housing, abandoned cars and unkempt lots. 15 S Brand and R Price (2000) The economic and social costs of crime, Report for Home Office, 2000

o Lost output; o Emotional impact; o Victim services;
• In response to crime; o Police activity; o Prosecution; o Magistrates courts; o Crown court; o Jury service; o Legal aid; o Non-legal aid defence; o Probation service; o Prison service; and o Other CJS costs.
The authors estimated these to be in the order of £60 billion per annum. This study was updated in 2005 with improved methodology and data but it only sought to update the figures related to crime against individuals and households (as opposed to commercial properties, car crime etc.). 16 Assuming no other changes and adjusting for inflation, current costs for England and Wales would be £80 billion.17 Applying this to Scotland on a proportional population basis (Scotland has 9.4% the combined population of England and Wales) the total costs of crime would be £7.6 billion. 18
3.1.7 Study by Sinclair and Taylor A more recent study by the Taxpayers Alliance presented findings that estimated the total cost of crime to be £275 per person in England and Wales.19 This equates to an overall figure of £1.4billion for the Scottish population, well below the estimate based on Home Office figures. However, this discrepancy can be explained. The Taxpayers Alliance study sought to value recorded crime only, leading to the much lower figure.
3.1.8 Components of the Costs of Crime in Scotland A report presented by the Scottish Government during the Crime and Justice Statistics User Day 2012 attempts to breakdown the costs of crime on a wider scale by endeavouring to quantify social and indirect costs. 20 Only 39% of costs were attributed to the criminal justice system in Scotland (around 50% of this being police costs). Physical and Emotional Impact was thought to account for 34% of costs (see Figure 2 for the full breakdown).
16 Richard Dubourg and et al. (2005) The economic and social costs of crime against individuals and households 2003/04, Report for Home Office, 2005 17 UK Treasury (2013) GDP Deflators, Latest Figures, available at http://www.hm-treasury.gov.uk/data_gdp_fig.htm (accessed April 2013) 18 Office for National Statistics (2012) 2011 Census, Table 2, Usual Resident Population and Population Density, Local Authorities in the United Kingdom, available at http://www.ons.gov.uk/ons/rel/census/2011-census/population-and-household-estimates-for-the-united-kingdom/rft-table-2-census-2011.xls (accessed April 2013) 19 Matthew Sinclair and Corin Taylor (2008) The Cost of Crime, Report for The Taxpayers Alliance, 4 July 2008 20 Joe Perman (2012) Economic and Social Cost of Crime: application in costing the criminal career

Exploring the Indirect Costs of Litter in Scotland 17 The total cost of policing is stated in the Scottish Policing Performance Framework annual report as £1.06billion and as this can be attributed to around 20% of the cost of crime we can say the overall cost of crime is £5.34billion. 21 This is somewhat lower than the estimate based on Home Office figures.
Figure 2 Breakdown of the Costs of Crime in Scotland
3.1.9 Associated Costs in Scotland In terms of the cost to the Scottish police of dealing with crime that may be attributable, at least in part, to the existence of litter in a specific area, we can make use of the evidence provided in the Massachusetts ‘Hot Spot’ study. 22 While it is important to bear in mind that there may be differences between Scotland and Massachusetts (e.g. demographics, levels of deprivation, degrees of relative inequality, types of crimes), in the absence of Scotland-specific studies, we believe that this represents a credible source upon which to draw. Taking the cited 19.8% drop in calls received by the police in the Massachusetts examples, there is potential to begin to apply this in the context of Scottish policing.
21 Scottish Policing Performance Development Group (2012) Scottish Policing Performance Framework, Annual Report 2011-12, Report for Scottish Government, November 2012 22 Anthony Braga et al (2008) Policing Crime and Disorder Hot Spots: A radomized Controlled Trial
Source: Scottish Government

In Scotland, during the year 2011/12, there were 524,587 reported crimes and non-motoring offences. 23 It is also known that 76% (398,686) of those crimes were reported by phone. 24 If the Scottish Police were to focus on hotspots in the same way as in the Massachusetts examples we would expect 93,691 (23.5% of the total) phone calls to emanate from those hotspots. A 19.8% reduction in these areas would therefore be a reduction of 18,550 calls which is 4.6% of the total calls made.
The capital and revenue expenditure of Scottish police call management totalled £2.25 million and £45 million respectively during 2005/06.25 No more recent figures were available, but assuming a constant level of calls, inflating to 2013/14 prices gives a cost of £2.7 million and £54 million respectively. 26 If the number of calls were reduced by 4.6% it is also reasonable to suggest a similar reduction in time required to man the lines as well as maintaining the infrastructure. Reducing the revenue spend by 4.6% would potentially save the Scottish Police £2.46 million per year. We will assume that capital expenditure would remain unchanged as investment will always be necessary. However, not all of the reduction in calls could necessarily be attributed to litter, as other factors contributed to the fall observed in Massachusetts. If the reduction in litter contributed to between 0.1% and 10% of the decline, this would save the Scottish police between £2,500 and £250,000 per annum in call management alone. On the basis of the evidence presented, we feel that a credible assumption would be that the contribution of the reduction in litter would lie towards the higher end of this range.
Beyond the potential savings in call management, attempting to quantify, and then monetise the link between the drop in calls with the overall saving on police time through attending and investigating crimes becomes slightly more problematic. One potential way is to put a value on police time based on the size of the Scottish police force. The total expenditure on salaries of the Scottish police force was £890 million during 2011-12.27 Applying the assumption, drawn from the Massachusetts example, that 4.6% of police time is taken up with incidents related to the poor quality of the local environment, such as ‘litter-strewn streets, broken street lights, abandoned buildings’ etc., the total cost of police time potentially attributable to these factors is estimated to be in the region of £40.9 million (4.6% of £890 million). It is difficult to estimate the exact impact from litter in particular as tackling litter was just one part of the strategy to reduce crime in Massachusetts. However, again, even if litter only contributes to between 0.1% and 10% of the impact, the costs in Scotland might lie between £40,000 and £4million per annum. Based on the literature reviewed, we suspect that the real contribution is closer to the higher end of this range.
Establishing the impact of litter on the overall cost of crime is fraught with uncertainty, but obtaining a ‘ball-park’ estimate is a useful exercise. We assume the overall cost of crime in
23 National Statistics (2012) Recorded Crime in Scotland 2011/12, Report for Scottish Government, 26 June 2012 24 Audit Scotland (2007) Police call management: An initial review, Report for Auditor General for Scotland and the Accounts Commission, 2007 25 Audit Scotland (2007) Police call management: An initial review, Report for Auditor General for Scotland and the Accounts Commission, 2007 26 UK Treasury (2013) GDP Deflators, Latest Figures, available at http://www.hm-treasury.gov.uk/data_gdp_fig.htm (accessed April 2013) 27 Audit Scotland (2007) Police call management: An initial review, Report for Auditor General for Scotland and the Accounts Commission, 2007

Exploring the Indirect Costs of Litter in Scotland 19 Scotland to be approximately £5billion per annum. Based on the studies in Massachusetts, we assume that 4.6% of crime can be attributed to the local environmental condition, which includes the level of litter. 4.6% of £5 billion gives a figure of £225 million. Again, if litter contributed to between 0.1% and 10% of this impact, the cost would be between £225,000 and £22.5 million per annum in Scotland. Again, given the evidence presented, we feel it likely that the contribution of litter lies in the upper half of this range.
3.2 The Impacts of Litter on Mental Wellbeing Related to the impacts of litter on levels of crime noted in Section 3.1, is the potential for the level of litter in a neighbourhood to have a direct, and indirect, bearing on an individual’s mental wellbeing. While there are clearly inter-linkages, graffiti, abandoned buildings, vandalism and street litter are all predictors of distress and depression.28
3.2.1 Costs of Anti-depressants More amenities and fewer ‘incivilities’ (such as litter and graffiti) have been associated with 32% lower rates of anti-depressant prescriptions after controlling for socio-economic status.29 The total cost of dispensing antidepressant drugs in Scotland in 2011/12 was £31.4 million.30 It has not been possible to obtain the original study by Ellaway and MacIntyre, but given the information available it is not likely that 32% of the total anti-depressant bill is attributable to litter and graffiti, as there will be other incivilities that play a role. However, there clearly is a litter-related impact, and it would be useful if further research were undertaken to understand the influence of specific factors, such as litter, on rates of anti-depressant prescriptions. Even if litter only contributed to between 0.1% and 10% of anti-depressants prescribed, it would still lead to a direct cost of between £31,400 and £3.14 million. It is difficult to be more precise than this, but we suspect that a figure of £1.57 million (based on a 5% contribution) would not be unreasonable.
3.2.2 Indirect Costs of Poor Mental Health Beyond this direct cost are the much greater indirect costs associated with depression. Mental ill health is the single largest cause of disability in the UK, contributing up to 22.8% of the total burden, compared to 15.9% for cancer, and 16.2% for cardiovascular disease.31 A 2011 study by the Scottish Association for Mental Health (SAMH) identified that the total costs to Scotland for
28 Cooper, R. B. C. C. R. (2008) Mental Capital and Well-being: Making the Most of Ourselves in the 21st Century. State-of-Science Review: S2-DR2. The effect of the Physical Environment on Mental Well-being. Foresight Mental Capital and Well-being Project., 2008 29 Ellaway and MacIntyre (undated) referenced in National Mental Well-being Impact Assessment Collaborative(2011) Mental Well-being Impact Assessment: A Toolkit for Well-being, available at www.apho.org.uk/resource/view.aspx?RID=95836 (accessed March 2013) 30 NHS Scotland (2012) Prescribing & Medicines: Medicines for Mental Health – Financial Years 2002/03 to 2011/12, 25 September 2012, available at http://www.isdscotland.org/Health-Topics/Prescribing-and-Medicines/Publications/2012-09-25/2012-09-25-PrescribingMentalHealth-Report.pdf?55453127623 (accessed March 2013) 31 World Health Organisation (2008) The Global burden of Disease: 2004 Update, 2008. Available at http://www.who.int/healthinfo/global_burden_disease/GBD_report_2004update_full.pdf

2009/10 totalled £10.7bn. The costs of mental health problems are described by SAMH under three headings: 32
• The costs of health and social care for people with mental health problems, including services provided by the NHS and local authorities (£1,920m);
• The costs of output losses in the economy that result from the adverse impact of mental health problems on work and employment (£3,228m); and
• The less tangible but crucially important human costs of mental health problems, representing their negative impact on the quality of life (£5,576m).
Good mental health and well-being, and not simply the absence of mental illness, have been shown to result in health, social and economic benefits for individuals, communities and populations.33 Such benefits include: 34
• Better physical health;
• Reductions in health-damaging behaviour;
• Greater educational achievement;
• Improved productivity;
• Higher incomes;
• Reduced absenteeism;
• Less crime;
• More participation in community life;
• Improved overall functioning; and
• Reduced mortality.
3.2.3 Associated Costs in Scotland There is a possible direct cost in terms of anti-depressants. As indicated, if the existing level of litter accounted for 5% of anti-depressants prescribed, this would mean a direct cost of £1.57m. In terms of the proportion of indirect costs of poor mental health that can be ascribed to litter, there is a lack of direct evidence at present, although it is clear that even a small contribution to such a significant area of cost would be considerable. If litter contributed to between 0.1% and 10% of the indirect costs of poor mental health, this would amount to between £10.7 million and £1.07 billion per annum). While it is not possible to be precise in such an estimate, we suspect the true figure might be closer to 0.5%, which is £53 million per annum.
32 Scottish Association for Mental Health (2011) What's It Worth Now? The Social and economic Costs of Mental Health Problems in Scotland, 2011 33 Barry, M., Friedli, L. (2008) The influence of social, demographic and physical factors on positive mental health in children, adults and older people: State of science review. Foresight SR-B3 v1 stage 1. Foresight. Mental Capital and Wellbeing: Meeting the challenge of the 21st Century. The Government Office for Science. London. 34 Department of Health (2011) No health without mental health: A cross-Government mental health strategy for people of all ages – Supporting document: The economic case for improving efficiency and quality in mental health. February 2011. Available at http://www.dh.gov.uk/en/Publicationsandstatistics/Publications/PublicationsPolicyAndGuidance/DH_123739

Exploring the Indirect Costs of Litter in Scotland 21 3.3 Indirect Costs of Drug-related Litter One type of litter that may have links to crime is that of drug-related litter. This deserves some attention due to the fear that is induced at the thought of spent needles being found in a children’s play park and the possibility of contracting various communicable diseases from them. Although the clean-up of spent needles is a direct cost covered by local councils there is potential for the indirect costs associated with injury caused by needles. The literature, however, would suggest that the reality is somewhat less extreme.
3.3.1 Perception Differs from Reality A 2005 report by DEFRA argues that the public perceives the health risk to be far higher than it actually is. In fact, several sources state that there have been no reported cases of a member of the public contracting HIV from discarded needles.35,36
A 2004 study recovered 106 spent needles over the course of four months from four South London parks. 37 Of those, evidence of Hepatitis was found on 9.4% of them. There is however, only a 1.2% chance of seroconversion when exposed to the virus via needle puncture. 38 Therefore there is only a one in a thousand chance of contracting Hepatitis from a discarded needle puncture wound.
In 2008 a study was conducted by two Scottish universities into the prevalence of drug related litter within social housing schemes.39 The study identified eight post-war social housing developments with a study area population of 23,500. The survey found little evidence of illegal drug related litter in comparison to alcohol litter. There were 1400 instances of alcohol related litter compared with only six instances of illegal drug litter; none of these involved hazardous sharps.
A more extensive, but earlier study by ENCAMS in England found the problem to be worse.40 Between April 2001 and March 2004 English local authorities reported recovering 267,008 needles from both urban and rural areas. However, it was also reported that there were only 169 recorded injuries due to discarded needles during that time. That equates to an incident rate of 0.06%. Of those, 165 were local authority employees and contractors, so the risk to the public appears to be negligible. The nature of the injuries is not specified so there is no way of understanding the cost of the treatment. If pro-rated to the Scottish population, there would have been around 16 cases in Scotland over the period (fewer than six cases per year).
35 DEFRA (2005) Tackling drug related litter: Guidance and good practice, October 2005 36 Dolan, K. and et al. (2005) Needle and Syringe Programs: A review of Evidence, Report for Australian Government Department of Health and Ageing, 2005 37 P Nyiri et al (2004) Sharps discarded in inner city parks and playgrounds – risk of bloodborne virus exposure 38 Vincenzo Puro et al (1995) Risk of hepatitis C seroconversion after occupational exposures in health care workers 39 Alasdair J.M.Forsyth et al (2010) The nature and extent of illegal drug and alcohol-related litter in Scottish social housing community: A photographic investigation 40 ENCAMS (2005) Drugs-Related Litter Survey, 2005
3.3.2 Evidence on Infection Rates from the Health Sector Statistics for needle-related injuries are better known within the health sector due to hospital workers having a higher risk of injury. The Health Protection Agency found that between 2008 and 2011 there were 1,397 reported needle injuries to healthcare workers within the UK.41 This resulted in only five Hepatitis C transmissions; three reported in England, and two in Scotland. Comparing this with the number of injuries expected in Scotland we would expect one case of infection every 46 years.
3.3.3 Associated Costs in Scotland From the evidence presented, there appear to be minimal medical costs to society from needle-related drug use. The larger issue potentially rests with public perception, and according to DEFRA, the belief that drug litter is a signifier of other, more problematic issues: 42
“The presence of drug litter in an area indicates wider problems of drug use that undermine communities throughout the country.”
One would expect a certain level of disamenity associated with drug litter, perhaps more so (proportionately) than with, for example, food litter, but there has been no work to establish public perceptions of different kinds of litter so it would be impractical to quantify the potential differences.
3.4 Cost of Litter-related Injuries
3.4.1 Valuation of Accidents DfT’s guidance on the valuation of transport accidents and casualties states that casualty related costs are made up of the following three components: 43
• Lost output;
• Medical/ambulance costs; and
• ‘Human’ costs. Notable exclusions are GP treatment, personal costs, medication and the costs of long term care.
The average casualty costs associated with fatal, serious and slight injuries are £1.7m, £186,000 and £14,000, respectively (see Table 1). We might assume that these sorts of costs are similar regardless of how the incident happened. In this case, to attribute a cost to a given type of incident, all that is necessary is to grade the incident accurately according to its severity. Slight injury is defined as:
41 Health Protection Agency (2012) Eye of the Needle: United Kingdom surveillance of significant occupational exposures to bloodborne viruses in healthcare workers, December 2012 42 DEFRA (2005) Tackling drug related litter: Guidance and good practice, October 2005 43 Department for Transport (2012) The Accidents Sub-Objective - Transport Analysis Guidance Unit 3.4.1, 2012

Exploring the Indirect Costs of Litter in Scotland 23
‘an injury of a minor character such as a sprain (including neck whiplash injury), bruise or cut which are not judged to be severe, or slight shock requiring roadside attention. This definition includes injuries not requiring medical treatment.’
Table 1 Casualty Related Costs for Road Accidents: Average Value of Prevention per Casualty by Severity and Element of Cost (2010 values and prices)
Severity Lost
output Medical/
Ambulance Human cost
Average casualty related costs by casualty severity
Fatal £568,477 £980 £1,084,230 £1,653,687
Serious £21,903 £13,267 £150,661 £185,831
Slight £2,315 £980 £11,025 £14,320
Overall average (takes into account
number of casualties of each severity type)
£10,159 £2,347 £37,277 £49,782
Source: DfT (2012) Serious injury is defined as:44
‘an injury for which a person is detained in hospital as an “in-patient”, or any of the following injuries whether or not they are detained in hospital: fractures, concussion, internal injuries, crushings, burns (excluding friction burns), severe cuts, severe general shock requiring medical treatment and injuries causing death 30 or more days after the accident.’
A 2010 report on the valuation of accidents in the home and at leisure used a similar methodology to estimate costs, using, in addition, values from Hopkins and Simpson’s 1995 study, inflated to 2010 values. 45,46 They assessed incidents as categorized in the DfT’s Home and Leisure Accident Statistics (HASS/LASS) database as to which incident severity would apply. 47 The incidents were categorised as serious or slight, as the database contains no fatalities. This allowed them to calculate an average cost per casualty that took into account the slightly different severity distribution for home accidents. However they also take into account that according to the available data, slight injuries from road accidents take longer to recover from, on average, than from home accidents, and that ambulance transport is less common for home, as opposed to
44 Department for Transport (2012) Reported Road Casualties Great Britain: 2011. Annual Report, 2012 45 Walter, L. K. and TRL (2010) Re-valuation of home accidents, Report for RoSPA, 2010 46 Hopkin, J. M., Simpson, H. F. and TRL (1995) Valuation of road accidents - TRL Report 163, Report for Road Safety Division, Department of Transport, 1995 47 See www.hassandlass.org.uk

road, accidents. Looking at their classification, litter related injury of the type the public might be risking, such as cuts from glass and other sharp objects, or trips and slips because of bottles, cans, or plastic bags are predominantly going to be in the ‘slight’ category. The following values are put on these accidents (Table 2).
Table 2 Costs for Home and Leisure Accidents: Average Value of Prevention per Casualty by Severity and Element of Cost (2009 prices)
Severity Lost output Value of
avoidance of injury
Medical & support
Total
Slight (hospital treated)
£3,200 £4,200 £900 £8,300
Slight (GP treated)
£0 £200 £0 £200
Source: Walter, L.K. and TRL (2010)
3.4.2 Frequency of Incidents The Royal Society for the Prevention of Accidents (RoSPA) provides access to the then Department of Trade and Industry’s database on Home and Leisure Accident Statistics (HASS/LASS database) for the years 2000-2002.48 The data is taken from a representative sample of hospital attendances around the UK and national estimated figures are reported. It catalogues a wide range of information about the circumstances of an accident.
The main categories of relevance to litter are as follows:
• ‘Object or product involved’ – this does not have any overarching category for litter, but has an extremely detailed list of individual items; and
• ‘Where the accident happened’ includes the subcategories: o Natural Area; o Road/parking area; o Sport area; o Education Area: Sports; o Education Area: Excluding Sports; o Leisure Facilities: Public Playground; and o Transport area: Urban foot/Cycle Path/Alley/Square.
All of the above contain further subcategories that would be relevant to litter-related accidents.
Restricting a database query as to ‘Part of body injured’ to ‘Arm’ and ‘Leg’ would help find the smallest relevant subsection of results. Similarly restricting the ‘Type of Injury’ to ‘Open Wound’, ‘Superficial injury’ or ‘Bruise/Contusion’ would be desirable. Also relevant are the categories within ‘Type of accident’ such as:
48 www.hassandlass.org.uk

Exploring the Indirect Costs of Litter in Scotland 25 • ‘Crushing/Piercing:cut/tear by sharp edges’;
• ‘Crushing/Piercing:Skin Puncture by foreign body/Spike/Shot’; and
• ‘Fall:Unspecified Fall’. Table 3 is an example of the data obtained by querying for a few circumstances that are likely to relate to litter-related accidents. Only one parameter in each category can be queried at a time (except for ‘object’, where several can be run simultaneously albeit only within the same sub-category). Therefore to run all the queries via the available internet portal would be impractical within the constraints of the current study. Further investigation into the raw data would be necessary to retrieve all the incidents likely to be relevant to litter, which we expect would be considerably larger in number than those uncovered here.
It is important to note that the occurrence of ‘slight’ injuries, as purely litter related personal injuries are likely to be, is underreported, as it does not include any casualties that did not lead to hospital attendance. Also of note is the radical difference between the figures reported from year to year in some categories, which could either be due to changes in scoring, or reflect the fact that the smaller the number of incidents for a particular combination of variables, the less statistical confidence there is in any national estimate derived from it. This could only be ascertained from a detailed investigation in close co-operation with those responsible for the data.
On average, over the three year period, there were 539 such incidents (which are of a specific nature) across the UK. Accounting for relative population size, there would be 45 such incidents per annum in Scotland. Applying a cost of £8,300 for each slight injury requiring hospital attendance gives us an overall figure of £375,000 per annum. The real figure, however, including the incidents reported in all the relevant circumstances, plus slight injury not requiring hospital attendance (and hence not reported here) (costed at around £200 per incident), will be considerably larger.
A brief review was undertaken of the ‘Inpatient Data/External Cause’ section of Hospital Episode Statistics Online.49 This identifies the cause of a patient’s attendance in hospital. The only classes of incident potentially relevant to litter are:
• “Contact with sharp glass’;
• ‘Contact with sharp object undetermined intent’; and
• ‘Falls’ of various kinds which are too unspecific and/or narrow to be any use to us in gauging the level of public injury caused by litter.
49 http://www.hesonline.nhs.uk/Ease/servlet/ContentServer?siteID=1937&categoryID=211 Accessed March 2013

Table 3 Home and Leisure Accidents that Might be Attributable to Litter, UK
Circumstances: Part of body injured: Leg/Lower Limb Accident type: Crushing/Piercing Object or product involved: Glass Bottle, Glass Jar Or Pot, Lid Only, Metal Container, Other Container, Other Metal Tin Or Can, Other Part Of Container, Plastic Bottle, Ring Pull Only, Unspecified Bottle, Unspecified Container, Unspecified Pot Canister
2000 2001 2002
Where the accident happened:
Natural Area 124 143 103
Road/Parking area 373 303 205
Sport Area (Excluding Educational) 0 18 123
Educational Area (Sports) 35 18 21
Educational Area (Excluding sports) 35 18 0
Public Playground 18 18 0
Urban foot/Cycle Path/Alley/Square 0 0 62
TOTAL 585 518 514 Source: www.hassandlass.org.uk
3.4.3 Compensation Data There is very little publicly available data on compensation in the UK generally. One example is a 2006 paper which uses Compensation Recovery Unit (CRU) statistics to estimate the number of public liability accident claims in the UK as 86,966 in 2004/5.50 The CRU administers the scheme which enables the state to recover from tort damages any social security benefit paid as a result of a relevant accident or disease. One source suggests that the most common public liability claims they deal with involve: 51
broken down fences or other obstructions to the highways or pavements including unlit skips located on the highway at night, litter and rubbish bags creating a tripping hazard in walk ing areas or badly parked vehicles on the roadway which may partially obstruct the pavement (our emphasis).
This is not, however, sufficient to estimate the proportion of the reported total of 86,966 claims that might relate to litter.
The same paper lists motor accident claims as 402,892 in 2004/5. 52 The US based ExpertLaw website, however, highlights the difficulties with bringing a case regarding road debris and
50 Lewis, R., Morris, A. and Oliphant, K. (2006) Tort Personal Injury Claims Statistics: Is There a Compensation Culture in the United Kingdom, Torts Law Journal, Vol.14 51 http://www.thompsons.law.co.uk/other-accidents/public-liability-compensation-claim-advice.htm 52 , Lewis, R., Morris, A. and Oliphant, K. (2006) Tort Personal Injury Claims Statistics: Is There a Compensation Culture in the United Kingdom, Torts Law Journal, Vol.14
Exploring the Indirect Costs of Litter in Scotland 27 accidents, namely, that it must be established that the public body had knowledge of the debris’ presence, and failed to respond to it within a reasonable amount of time. Alternatively, it can be difficult to identify the driver who is responsible for the presence of the debris.53
In theory the payment of damages merely displaces the casualty costs (as quantified above) within society, so once a value has been placed on an accident and accounted for, only legal costs should remain. In the absence of any evidence regarding successful public liability claims related to litter, we have not pursued information regarding these sorts of legal costs.
3.4.4 Associated Costs to Scotland Given the available evidence it is not possible to state, with confidence, either the extent of litter-related injuries in Scotland, or the associated costs. There may well be merit in starting to identify, in the accident statistics, which incidents are associated with litter. This would then allow, over time, for the scale of the impacts to be identified.
3.5 Cost of Injuries to Duty Body Staff There is not much publicly available data on crew injury during litter picking; though it is cited as a concern in several places.54,55
3.5.1 ‘On the Road’ Work Road safety statistics for Scotland do tell us the number of pedestrians injured during ‘on the road’ work, which in 2011 totalled 34. 56 However, this has historically included work such as postal delivery, traffic control etc. as well as road maintenance. Since September 2011, in the accident statistics report form, the relevant category is entitled ‘Pedestrian road maintenance worker’.57 Using the average figure of £68,000 per accident, the cost relevant to litter will be a fraction of the total, for the 34 accidents, of £2,312,000. 58 However, the proportion of such costs that can be attributed to injuries sustained while litter picking is not clear.
Personal communications with local authorities suggest the incidence of crews being hit by a vehicle during street cleansing duties, which include litter picking, to be one perhaps every 5 or 10 years.59 However, this data is simply anecdotal, and some other authorities say they have never experienced such incidents.
53 http://www.expertlaw.com/library/car-accidents/road-debris.html 54 http://www.birminghammail.co.uk/news/local-news/motorway-litter-danger-alert-130368 55 http://www.transportscotland.gov.uk/road/maintenance/prioritising-and-maintaining/litter+ 56 , Office of National Statistics (2011) Reported Road Casualties Scotland - 2011, Report for The Scottish Government, 2011 57 STATS19 Accident Statistics Report Form Sept 2011 http://assets.dft.gov.uk/statistics/series/road-accidents-and-safety/stats19-road-accident-injury-statistics-report-form.pdf 58 Per accident figure from Department for Transport (2010) A valuation of road accidents and casualties in Great Britain in 2010, 2010 59 Personal communication with Craig Gordon, Stirling Council

3.5.2 Health and Safety Executive Statistics Statistics related to fatalities and injuries in the workplace are available from the Health and Safety Executive. However, they are not collated in a way that allows identification of accidents that occur during litter-picking or dealing with flytipping. As can be seen in Table 4, the finest resolution of data that we have been able to obtain relates to waste collection in general.

Exploring the Indirect Costs of Litter in Scotland 29 Table 4 Injuries and Occupations Relevant to Litter Picking Crew Injury.
Industry description Injury Fatal Major
Over 3 days off
work
Total
Waste collection – non hazardous
waste – inc refuse bins, wheelie bins
Injured through cuts from sharp/coarse material or equipment or from trapped fingers. Injury is not through the weight of material, objects or equipment being handled.
0 5 47 52
Waste collection – non hazardous
waste – inc refuse bins, wheelie bins
Hit by a moving vehicle 1 30 46 77
Waste collection – non hazardous
waste – inc refuse bins, wheelie bins
Exposed to, or contact with, a harmful substance ‘during handling, dispensing, filling, mixing’ OR ‘in another way not specified above’ or ‘unknown way’
0 6 13 19
Waste collection – non hazardous
waste – inc refuse bins, wheelie bins
Hit something fixed or stationary: Step onto small items on the ground (nails etc.)
0 1 0 1
Grand total 149 Source: HSE Health and Safety Online HandS-On Statistics Data Tool 2010/2011 Data https://handson.hse.gov.uk/hse/public/home.aspx Accessed March 2013
We found only two press releases from the HSE explicitly regarding injuries while litter picking; one serious injury in 2009, and one fatality (by a road) in 2007. In both cases the employers were required to pay fines, these being £5,000 and £225,000, respectively.60 Only one other report of a litter picker’s death was found.61 It is not, however, straightforward to attribute the first and the last of the three to litter as they were more the result of the employees’ own actions, rather than ‘external forces’.
A parliamentary question on Deaths & Injuries while Litter Picking for the Highways Agency, plus the inquiries of a litter campaigner, revealed the extent of incidents for the years 2006-2010. One laceration to the finger was recorded (a handling injury), along with one bruising to the chest
60 http://www.hse.gov.uk/press/2011/coi-em-11.htm; http://www.hse.gov.uk/press/2010/coi-se-0510.htm 61 http://www.mk-news.co.uk/News/Litter-picker-died-crossing-grid-road.htm
caused by being hit by a moving vehicle on site, and two whiplash injuries sustained by a collision between the impact protection vehicle and a third party vehicle.62
3.5.3 Associated Costs to Scotland The HSE statistics, which apply to the UK, and the data from the Highways Agency, which applies to England, indicate that were we to find the proportion of the 150 or so reported incidents in Table 4 that relate to litter picking activities, and apply them to Scotland on a per capita basis, we would be looking at very small numbers indeed.
3.6 Costs of Litter-related Road Traffic Accidents The evidence regarding litter and its contribution to road accidents is quite sparse. The hazard that litter presents to motorists is often referred to by interested parties, but little data is actually available.63,64 This are no official figures available for the number of accidents caused each year on Scottish roads due to litter. In the sections below we apply two different approaches from studies undertaken in the USA to derive estimates of the costs in Scotland.
3.6.1 American Automobile Association Study The American Automobile Association (AAA) Foundation for Traffic Safety reported in a 2004 study that 25,000 accidents (0.6% of all accidents) and 80-90 fatalities occur each year in the US because of road debris. 65 This was widely reported as “accidents caused in the USA each year by litter”.66 However, the debris in the study is actually defined as ‘vehicle-related road debris’ (VRRD). It is stated that at highway speeds, even small items of debris can be deadly.67 The study related specifically to:
‘vehicle parts or cargo…that has been unintentionally discharged from a vehicle onto the roadway’,
However sometimes the authors included ‘debris for which the source could not be determined’ in their attributions to VRRD, some of which, arguably, could be littered items.
The AAA, in their literature review, attributed 0.1% - 0.95% of all accidents to ‘non-fixed objects’. Depending on the study reviewed, these included:
• Animals;
• VRRD;
• Road signage;
• Road barriers; and
62 http://www.cleanhighways.co.uk/highways-agency/litter-picking-deaths-injuries 63 http://www.birminghammail.co.uk/news/local-news/motorway-litter-danger-alert-130368
64 http://www.keepscotlandtidy.org/roadsidelitter.asp 65 Gerry Forbes (2004) The safety impact of vehicle related road debris, Report for AAA Foundation for Traffic Safety, July 2004, https://www.aaafoundation.org/sites/default/files/VRRD.pdf 66 http://www.greenecoservices.com/deadly-litter-and-car-accidents/
67 Forbes, G. and Robinson, J. (2004) The Safety Impact of Vehicle-Related Road Debris, Report for AAA Foundation for Traffic Safety, 2004

Exploring the Indirect Costs of Litter in Scotland 31 • Storm detritus. Some studies excluded incidents where the non-fixed object was successfully avoided but still provoked a crash. The AAA informed their percentage crash estimate by interrogating crash report databases from states where they were available. The crash reports they assessed showed 76% of the debris was positively identified as VRRD; litter would therefore be a proportion of the remaining 24%. It is apparent that the variation in the categorization of ‘non-fixed objects’ presents us with difficulties in comparing studies and in apportioning incidents accurately to litter.
We can estimate comparable figures, bearing in mind all the caveats above, as follows. The total volume of traffic on US roads in 2011 was 2,963 billion vehicle miles compared with 26.7 billion vehicle miles for Scotland. 68,69 Using the vehicle miles travelled per year, and assuming a comparable level of debris-related accidents per mile travelled, we can estimate the number of road accidents caused by items including litter in Scotland as shown in Table 5.
Table 5 Road Traffic Accidents Due to Litter
Vehicle Miles per annum (billion) 70,71
Accidents Due to (VRRD) – 76%
Accidents Due to other debris
(including litter) – 24%
United States 2,963 25,000 7900
Scotland 26.7 225 71 Source: AAA (2004), OHPI (2011)
The Department for Transport (DfT) uses the willingness to pay (WTP) approach in the valuation of both fatal and non-fatal casualties. This attempts to encompass all aspects of the impacts on casualties including the human costs; which reflect pain, grief, suffering; the direct economic costs of lost output; and the medical costs associated with road accident injuries. In the DfT’s 2010 report the total value associated with the prevention of accidents within Great Britain is estimated to be £15 billion.72 This can either be viewed as the potential benefit obtained from eliminating road accidents or the current loss to society. This cost estimate is based upon data provided by the police meaning that accidents not reported to the police are not taken into account. The report suggests around half of all accidents are never reported and accordingly estimates an upper limit of £32 billion when all accidents are included. More relevant is the average cost per accident which is given as £68,000. This ranges from £1.8 million for fatal accidents, down to £21,000 for ‘slight’ accidents.
68 Office of Highway Policy Information (2011) Traffic Volume Trends, Report for U. S. Department of Transportation, December 2011 69 Transport Scotland (2012) Scottish Transport Statistics, no. 31, Report for Scottish Government, 2012 70 Office of Highway Policy Information (2011) Traffic Volume Trends, Report for U. S. Department of Transportation, December 2011 71 Office of Highway Policy Information (2011) Traffic Volume Trends, Report for U. S. Department of Transportation, December 2011 72 Department for Transport (2010) A valuation of road accidents and casualties in Great Britain in 2010, 2010

Although these figures are broad and illustrative we can use them to get an idea of the costs when applied to Scottish accidents due to litter. Assuming the average figure of £68,000 per accident the total cost, based on 71 accidents related to items including litter per year as shown in Table 5, the cost could be up to £4.8 million per year. However, as stated above the proportion attributable specifically to litter is unknown.
3.6.2 The American State Litter Scorecard The American State Litter Scorecard (Spacek, 2008) used the National Highway Traffic Safety Administration’s Annual Traffic Facts Reports (2005) to estimate that 1,222 Americans died as a result of traffic accidents caused by littering/movable debris along roadways. 73 The most recent equivalent figure is 850 fatalities in 2010.74 However Spacek notes that the 2010 data refers to situations where the vehicle involved hit a ‘non-fixed, non-human, movable object’. 75 By contrast the NHTSA’s original report gives the conflicting definition of “Objects Not Fixed” as “Objects that are movable or moving but are not motor vehicles. Includes pedestrians, pedal cyclists, animals, or trains (e.g., spilled cargo in roadway)”.
When we look at the most comparable statistics for Scotland, from 2011, we likewise see that each of the relevant categories for which statistics are collected could easily relate to a large variety of scenarios not involving litter (Table 6).76 These statistics only include accidents resulting in injury that are reported to the police, so cover a subset of incidents, and not near-misses.
Table 6 Road Casualties Scotland 2011: Accidents Possibly Attributable to Litter
Category Total
1.25.2 ‘Other object in carriageway’* (Accident Data/Carriageway hazards) 126
2.1.2.11 – ‘Other object’* (Vehicle Data/Hit object in carriageway) 70
109 – Animal or object in carriageway (contributory factor) 142
510 – Distraction outside vehicle (contributory factor) 107
201 - Tyres illegal, defective or under-inflated (contributory factor)** 46
3.19.1 – ‘Yes’ (Pedestrian Injured in the course of ‘On the road’ work) 34
Total Accidents (Casualties) 9974 (12770)
*does not include animals of any kind ** may include punctures but unclear
Source: ONS (2011)
73 Spacek, S. (2008) The (First) American State Litter Scorecard (2008), Report for The 2008 American Society for Public Administration Conference, 2008 74 National Highway Traffic Safety Administration (2010) Traffic Safety Facts 2010, A Complilation of Motor Vehicle Crash Data from the Fatality Analysis Reporting System and the General Estimates System, 2010 75 Spacek, S. (2008) The (First) American State Litter Scorecard (2008), Report for The 2008 American Society for Public Administration Conference, 2008 76 Office of National Statistics (2011) Reported Road Casualties Scotland - 2011, Report for The Scottish Government, 2011

Exploring the Indirect Costs of Litter in Scotland 33 Using the DfT’s average costs of £68,000 per accident, we make the conservative assumption, because more than one contributory factor can be listed per accident, that litter-related accidents are all included in the category ‘Other object in carriageway’. 77 Of these, we further assume that only 12% of the 126 accidents are attributable to litter (based on assuming only half of the 24% of accident-causing debris from AAA study are actually litter). This gives an annual cost of £1.03 million. Further research into the specific cause of accidents, including descriptions of any objects involved, would yield improved data.
3.6.3 Vulnerability of Motorcyclists The only UK-based evidence is a brief report from the British Motorcyclists Federation (BMF).78 The report highlights the added dangers faced by motorcyclists from road debris due to the potential for even small objects to result in a serious crash. They estimate that out of 24,824 reported motorcycle accidents in 2005, 646 accidents were caused by skidding on debris, and 919 as a result of punctures (6% between them). They present no methodology for the calculation of these figures but one would expect the accident rate to be higher for motorcyclists than car drivers due to their added vulnerability. The financial impact per accident may be lower for motorbikes than cars in terms of the associated repair costs, but the human cost is likely to be substantially higher. These accidents should be included in the road casualty statistics in Section 3.6.2. so we do not account for them separately. However, it is worth bearing in mind how litter as a hazard may affect some groups more than others.
3.6.4 Insurance Costs The DfT’s guidance on the valuation of transport accidents provides figures for the insurance and associated administrative costs per road accident (2010 prices).79 These costs, shown in Table 7, are already included within the average accident costs (£68,000), of which they clearly constitute a very small proportion.
Table 7 Typical Insurance and Administrative Costs per Accident (2010 prices)
Accident Type Insurance and Administrative Cost (£)
Fatal 304
Serious 189
Slight 115
Average for injury accidents* 127
For accidents involving damage only 54
* Weighted for no of accidents of each type, 2010
77 Department for Transport (2010) A valuation of road accidents and casualties in Great Britain in 2010, 2010 78 British Motorcyclists Federation (2007) Road Debris, July 2007, http://www.bmf.co.uk/upload/documents/1196679947_road_debris.pdf 79 Department for Transport (2012) The Accidents Sub-Objective - Transport Analysis Guidance Unit 3.4.1, 2012

3.6.5 Associated Costs to Scotland Based on the two approaches above, we derive initial estimates ranging from £1.03m to £4.8m. We suggest that a figure towards the lower end of this range may be a reasonable approximation of the cost to Scotland of litter-related road traffic accidents. Further research would greatly improve the accuracy of this figure.
3.7 Costs to Repair Punctures Caused by Litter The cost of repairing a punctured car tyre may be as little as £5 or £80 depending on the position of the puncture and the particular garage used.80 A survey of 2,034 people by Kwik-Fit suggested that a third of drivers experienced a puncture or flat tyre in a year, and the incident was dealt with at an average cost of £34.81 Applying this rate to the number of drivers in Scotland leads us to estimate of about 1.2m punctures or flat tyres occurring in the country per year.82 While the cause of these punctures is not known, if we assume that between 0.1% and 10% were caused by littered glass items, the associated cost of repair would be between £40,000 and £4 million per annum.
We are only able to gauge that punctures caused by litter, typically glass, are a concern to cyclists via anecdotal references. 83,84 Therefore, we are unable to determine its extent. A typical bike puncture repair might cost up to £6 for materials and £15 for service, professionally.85 However, do-it-yourself repair is likely to be much more economical, perhaps entailing only part of a puncture repair kit (worth perhaps £0.50), tools that are already owned, and perhaps 30 minutes of time (costed at £7 according to the 2012 average hourly wage).86 The Scottish transport statistics tell us that 35% of Scottish households have at least one bicycle that an adult can use, which is about 875,000 households. In the absence of relevant information, if we assume that each of the 875,000 households is likely to experience one puncture a year, and that between 0.1% and 10% might be caused by broken glass, this gives a cost of between roughly £6,500 and £650,000 per annum.
While we are able to put a rough figure on the cost of repair of personal items, such as average prices for shoe resoling of £18-38 for half resoling, depending on the materials used, or of £3-4 for a small item of dry cleaning, 87,88,89 there is no obvious way for us to put any sort of number on the frequency of damage caused by sharp litter items or chewing gum.
80 http://www.carbidoff.com/2012/01/car-tyre-puncture-repair/ 81 http://www.telegraph.co.uk/motoring/news/7505845/Puncture-misery-for-London-drivers.html 82 Number of Scottish drivers, 3,547,650 calculated using Transport Scotland (2012) Scottish Transport Statistics, no. 31, Report for Scottish Government, 2012 83 http://www.transport.wa.gov.au/mediaFiles/AT_CYC_P_FS31_glass.pdf 84 http://www.cycling-inform.com/equipment/175-five-tips-to-help-avoid-bicycle-punctures 85 http://www.ekbikerepair.co.uk/bikerepairprices.html 86 http://www.ons.gov.uk/ons/publications/re-reference-tables.html?edition=tcm%3A77-280149 87 www.shoerepairer.info (www.shoerepairer.info (2013) Members Price Survey 2013, www.shoerepairer.info, Date Accessed: 2013 88 http://www.morrisons.co.uk/Help-and-information/Store-services/Dry-cleaning-service/ 89 http://www.iron-maids.co.uk/downloads/iron-maids-dry-cleaning-prices.pdf

Exploring the Indirect Costs of Litter in Scotland 35 3.7.1 Associated Costs to Scotland As initial estimates, the litter-related costs of punctured car tyres in Scotland might be between £40,000 and £4 million per annum, and for punctured bicycle tyres, between £6,500 and £650,000 per annum. While data is clearly sparse, as a best estimate, we would suggest the true cost may be approximately £1 million per annum. The accuracy of, and confidence in, such estimates could readily be improved through further research. For example, it might be envisaged that a sample of Scottish cyclists could be undertaken to record details of the location of, and circumstances surrounding, punctures that they experience over the course of a year (or more).
For car tyre repairs, while identifying the precise location where the puncture occurred may not always be possible, the mechanics undertaking the repair may be able to identify the cause of the puncture. Collecting such information would improve the accuracy of the figures suggested above.
3.8 Indirect Costs of Litter to the Rail Network
3.8.1 Rat-related Damage Via personal communications with Railtrack representatives, Battersby (2004) established that litter thrown from passing trains or platforms was believed to attract rats to the rail network.90 It was felt that rat-related incidents did not represent a major problem overall, but the subsequent costs for dealing with each incident could be high. It was known to be the case that cable damage and power failures caused by rats did occur. Cable chewing behaviour is attributed to the animals’ need to wear down their constantly growing incisors. 91,92 Rats also cause power outages by lying between, and closing, the circuit between live terminals.
Taking account of a number of cost components, including penalties for delays, treatment costs to tackle rats, and valuing the passenger time ‘lost’ during delays total figures ranging from £1.66m - £5.76m were identified by Battersby.93,94
The Scottish railway network is 17% the length of that of England and Wales, so using this as the basis for a Scottish-specific figure, the cost could be in the order of £282,000 - £962,000 per year.95 However, the amount of litter is likely to be more closely related to human population size.
90 Battersby, S. (2004) Public health policy – can there be an economic imperative? An examination of one such issue, Journal of Environmental Health Research, Vol.3, No.1, pp. 91 http://www.ucmp.berkeley.edu/mammal/rodentia/rodentia.html 92 http://www.erodent.co.uk/RodentsAndChewing.htm 93 Battersby, S. (2004) Public health policy – can there be an economic imperative? An examination of one such issue, Journal of Environmental Health Research, Vol.3, No.1, pp. 94 Battersby notes: ‘It was estimated that a rat gnawing a power cable might cause a major black-out of signalling systems, which could take several hours to identify and rectify. The cost could be between £2,000 and £400,000 dependent on the severity and time of the incident. It was suggested that a typical average cost would be £60,000 recorded over 10-20 incidents.’ 95 A figure taken of 10,027 route miles for Great Britain and 1,718 route miles for Scotland (http://en.wikipedia.org/wiki/Transport_in_the_United_Kingdom); Network Rail (2013) Scotland Route - Summary Route Plan

The Scottish population is 9.4% of the combined English & Welsh populations, which gives a range of £156,000 to £541,000.96
The proportion of these costs that could be attributed to litter could be 100%, if one took the view that rats would not be attracted to railway infrastructure if it was not for the presence of litter, and that their population is only sustained by litter. However one can think of two other sources of food; surrounding agricultural or wild areas (providing e.g. grains, tubers and roots), or adjacent sewage systems (the presence of kitchen waste disposal units and people disposing of food down the toilet provides plenty of food for rats in the sewage system).97
In estimating the proportion of these costs that might realistically be attributable to edible litter, the only available figure, to the best of our knowledge, states that “in some areas it is estimated that edible refuse from fast food establishments has increased the numbers of rodents and pigeons by 10-15%”.98 However, it has not been possible to track down the original source of this claim (and hence, to understand the basis for it). In the absence of any alternatives, this figure could be used to estimate the proportion of the costs above associated with edible litter in Scotland. However, we more cautiously assume 10% of the overall costs. Applying this percentage to the lower of the two ranges of costs (namely £156,000 to £541,000) gives a range from £15,600 to £54,100. If assuming a lower bound of 0.1%, this would be a cost of £156 per annum, which is effectively no impact at all. We feel the true costs are likely to lie towards the top end of this range.
3.8.2 Incidents Associated with Flytipping The safety data collated by the Office of Rail Regulation does not separate out the number of incidents caused by flytipping specifically. 99 These would be subsumed into several other categories.100 One could be ‘incidents due to irresponsibility of the public’/’other’ – which excludes incidents with malicious intent or incidents that occur at level crossings. Under this category there were 11 instances of trains running into obstructions, but no derailments, across the UK in 2007.
Across the UK ‘incidents due to miscellaneous factors or cause undetermined’ involved 17 derailments and 64 instances of ‘running into obstructions’ in 2007. These may involve some flytipping related incidents.
Another relevant incident category could be ‘injuries to members of the public’ (e.g. struck while trespassing for the purpose of flytipping). The number of fatalities due to trespassing overall in 2007 was 13 in Scotland. However most of these 13 would be accounted for by suspected as opposed to confirmed (therefore unincluded) suicides. Injuries to railway employees and contractors (e.g. in the case of staff accessing to clear track) would be included within the 5 staff injuries and fatalities ‘while working on or about the track or while authorised to walk along the
96 Office for National Statistics (2012) 2011 Census, Table 2, Usual Resident Population and Population Density, Local Authorities in the United Kingdom, available at http://www.ons.gov.uk/ons/rel/census/2011-census/population-and-household-estimates-for-the-united-kingdom/rft-table-2-census-2011.xls (accessed April 2013) 97 http://icwdm.org/handbook/rodents/NorwayRats.asp 98 http://www.picasuk.com/area_wide_control.html 99 https://dataportal.orr.gov.uk 100 Office of Rail Regulation (2007) Railway Safety Statistical Report

Exploring the Indirect Costs of Litter in Scotland 37 track’ (UK wide). We have been unable to find any explicit mention of flytipping related incidents in the Railway Safety and Standards Board Ltd’s Annual Safety Performance Reports.101
The National Audit Office’s report into train delays calculates an average of 49 delay-minutes for fatalities or trespass.102 The NAO study puts a value of £73.47 per minute of delay, taking into account willingness to pay for business travellers, commuters and other travellers, and their respective proportions and numbers on an ‘average train’, which would produce a figure of £55,600.103
This leads us to conclude that even if we attributed a small number of incidents to flytipping, it would not amount to a large economic impact, though the hazard of flytipping or even littering on railway property (even smaller items can apparently lodge in points causing points failure)104 crops up as a concern in newspaper articles and on the websites of relevant parties.105,106
3.8.3 Associated Costs to Scotland The cost to the railway network due to rats whose existence can be attributed to edible litter is likely to be somewhere between £156 and £54,100. We feel that the true figure is likely to be towards the top end of this range. It has not been possible to identify sufficient information about incidents related to flytipping.
3.9 Litter-related Costs of Vermin: Rats
3.9.1 Overall Costs of Rat Damage Intuitively, and assuming that food availability is a constraint on population size, an increase in the amount of edible litter is likely – all other things being equal – to lead to a rat population that is greater than would otherwise be the case. However, a lack of available evidence means that identifying the proportion of the rat population that can be attributed to the prevalence of edible litter is far from straightforward.
Identifying the costs associated with problems caused by rats is, therefore, a difficult exercise. Some academics have, however, attempted to estimate the size of rat populations and the amount of damage they cause each year. Battersby (2004) used a conservative figure of $15 of damage per rat per year suggested by the author of a US study, converted to £10.45 (using conversion rates of the time), and his own estimate of the England and Wales rat population of 20 million individuals, to come up with a total figure of £209m per year.107 The type of damage caused by rats that was considered included rural as well as urban sites; though mostly based on
101 http://www.rssb.co.uk/SPR/REPORTS/Pages/SPRPublishedDocuments.aspx#annual_safety 102 National Audit Office (2008) Reducing Passenger Rail Delays by Better Management of Incidents, 2008 103 National Audit Office (2008) Reducing Passenger Rail Delays by Better Management of Incidents, 2008 104 Rail Accident Investigation Branch (2005) Derailment at Phipps Bridge, Croydon Tramlink, 2005 105 http://www.networkrail.co.uk/aspx/1026.aspx 106 http://news.bbc.co.uk/1/hi/england/kent/4738383.stm 107 Battersby, S. (2004) Public health policy – can there be an economic imperative? An examination of one such issue, Journal of Environmental Health Research, Vol.3, No.1, pp.

anecdotal or sparse data. Potential damage includes food loss via both eating and spoilage (greater in rural sites), container and furniture spoilage, structural building damage, wire and plumbing damage, fire hazards and leptospirosis infection. A notable occurrence in Scotland was the outage of broadband service to customers in the east of Scotland in 2011 due to rodent cable damage.108 It is not easy to understand how rat population figures have changed over time, as there is no study applying consistent methods on an annual basis.
3.9.2 Proportion of Costs Attributable to Edible Litter In terms of the proportion of these costs that might be attributable to edible litter, the only available figure, to the best of our knowledge, states that “in some areas it is estimated that edible refuse from fast food establishments has increased the numbers of rodents and pigeons by 10-15%”.109 However, it has not been possible to track down the original source of this claim. In the absence of any alternatives, this figure could be used to estimate the costs associated with rats whose existence can be attributable to food litter in Scotland. However, applying a cautious approach, we use the 10% figure as the ‘upper end’ of our range, with the lower end being 0.1%. Assuming the England & Wales rat population to have been 20 million in 2004, and further assuming that the rat population is directly proportional to the human population, this would suggest a Scottish rat population of 1.9 million in 2004. This would give a total annual damage cost, based on Battersby’s £10.45 unit damage cost, of £19.9m. Using 10% as the proportion attributable to all food litter (not just the fast food litter to which the reference applies), gives an estimated litter-related cost of £1.99m per annum. Using the low end estimate of 0.1% leads to a litter-related cost of £19,900 per annum.
It is, however, worth noting that an alternative estimate of the UK rat population identifies a figure of approximately 10 million, which is half that identified by Battersby.110 Applying this figure reduces the likely range of costs to between £9,950 and £995,000. Taken together, the overall range is between £9,950 and £1.99m per annum. Given the uncertainties involved, it is difficult to be confident, but we feel that a mid-point estimate of around £1m per annum would not be unreasonable.
It is of interest to note that, according to statistics on the number of cases of leptospirosis (a type of bacterial infection spread by animals) for the years 1996-2006 from the Leptospirosis Reference Laboratory, the average number of cases per year in Scotland was 1.3.111 Although rats are the prevalent carriers, other species, such as cattle, also contribute to infection risk. In addition, water related leisure sites, where the water borne illness is most often contracted in the UK, are more likely to be rural, where, perhaps, a smaller proportion of the rat population is sustained by litter. The cases that could even hypothetically be apportioned by litter are therefore likely to be a small fraction of one, and it is held to be insignificant enough to disregard.
3.9.3 Costs of Rat Control In terms of calculating the costs of rat control, Battersby reports the number of infested domestic premises identified in the literature as ranging from 373,000 (in a study looking at England only)
108 http://www.theregister.co.uk/2011/10/12/dirty_rat_downs_virgin/ 109 http://www.picasuk.com/area_wide_control.html 110 http://www.bbc.co.uk/news/magazine-20716625 111 http://www.rospa.com/leisuresafety/adviceandinformation/watersafety/weils-disease.aspx

Exploring the Indirect Costs of Litter in Scotland 39 to 995,000 (in a different study considering both England and Wales). This is approximately 3% of households (taking the average of the two numbers). Battersby reports a treatment rate of 75% (i.e. three-quarters of all infestations being treated in each year, with 10% of all infestations being treated by the owners, and 65% of infestations being treated by local authorities or private contractors).112
Based on Scottish household numbers, such an infestation rate would suggest 74,400 Scottish households having an infestation incident per annum. If 75% of these were actually treated, that would be 55,800, with 48,400 being undertaken by local authorities or private contractors. A quick survey of (Scottish) local authorities’ online materials gives a rat treatment cost, where charged to the resident, of around £50.113 This would give a total cost of treatment of £2.4m.
Battersby estimates 40% of the infestations as emanating from private and public sewage systems.114 In addition there are other sources of food for rats such as food put out as part of the general refuse collection. Edible litter will, however, play some part, especially in urban areas. We therefore assume that 10% of the £2.4 million is as a result of edible litter, totalling £240,000 per annum.
Other sources indicate that Scotland has 92 pest control officers, who administered 9,435 rat treatments in 2012, which account for about 60% of all pest treatments.115 Assuming a unit cost of £50 gives a much smaller estimate of control costs at £57,000, but does not take into account privately contracted treatments. It may suggest also that the rat population, and/or the treatment rate is overestimated by the authors that Battersby cites.
Battersby also examined the size of the UK rodenticide market, and assuming that rodenticide represents 6-7% or treatment costs, gave an estimate of £34m-£40m for treatment costs (off-farm only). Scaled on a per capita basis to Scotland this would give figures between £2.9m and £3.4m. If litter contributed to 10% of this total, through sustaining the rat population at levels higher than it would otherwise be, this would represent costs of between £290,000 and £340,000. If litter contributed only 0.1% to this cost, that would be between £2,900 and £3,400 per annum.
3.9.4 Associated Costs to Scotland As initial estimates, we would suggest that the litter-related cost of rat damage in Scotland lies between £9,950 and £1.99m per annum. Given the uncertainties involved, it is difficult to be confident, but we feel that a mid-point estimate of around £1m per annum would not be unreasonable.
The treatment costs associated with rats, the existence of which we can attribute to edible litter, is estimated to lie between £2,900 and £340,000 per annum, with a central estimate of perhaps £250,000 per annum. Both of these estimates are tentative, in the absence of more detailed data.
112 Battersby, S. (2004) Public health policy – can there be an economic imperative? An examination of one such issue, Journal of Environmental Health Research, Vol.3, No.1, pp. 113 Browsing the online materials of about half the Scottish Local Authorities provided information regarding cost of pest control from eight authorities. 114 Battersby, S. (2004) Public health policy – can there be an economic imperative? An examination of one such issue, Journal of Environmental Health Research, Vol.3, No.1, pp. 115 British Pest Control Association (2012) National Survey 2012, 2012

3.10 Litter-related Costs of Vermin: Pigeons A BBC article from 1999 stated that pigeon deposits cost up to £15m to remove in the UK, but it has not been possible to find the basis for the reported figure.116 Notable isolated incidents include £50,000 worth of damage to Morely Town Hall caused by flooding after drains were blocked by bird droppings,117 or the several tonnes of bird fouling removed from the spire at the chapel of Canterbury city cemetery, and the 12 tonnes removed from the Tyne Bridge (costs for the latter two undisclosed but likely considerable given the scale of the tasks).118,119 It costs about £75,000 to clean Trafalgar Square of droppings every year.120 It appears therefore, that the costs of dealing with particular incidents can be quite high. An estimate of the average, or indeed total, building cleaning costs in Scotland would be useful to this enquiry, but this information could not be obtained.
Inflating the £15 million cost of removing pigeon deposits to the UK to current prices, and assuming no other changes, gives a 2013 cost of £20 million. Apportioning this cost to Scotland on a relative human population basis (Scotland has 8.4% of the UK’s inhabitants)121 gives £1.68 million per annum. Several sources are adamant that the bulk of the pigeon population is sustained by persistent public feeding, which is more common than may be immediately obvious for a variety of reasons. 122,123 There are, however, no figures to substantiate this.
Assuming, as for the rat population, that the existence of 10% of the Scottish pigeon population can be attributed to edible litter, this gives an annual cost of £168,000 related to cleaning up pigeon droppings. If the existence of only 0.1% of the Scottish pigeon population can be attributed to edible litter, this gives an annual cost of £1,680. We feel that the real figure is likely to be towards the top end of this range.
3.10.1 Costs of Control 1,372 bird treatments were administered in Scotland in 2012 by local authorities’ 92 pest control officers (accounting for about 9% of all treatments).124 It is rather difficult to attribute unit cost to these treatments as they could be very wide ranging in type, from pure advice only, to nest removal, to installing bird deterrent facings such as spikes, wires and netting. We have no information on the nature of the ‘treatments’ and no other unit cost information.
116 http://news.bbc.co.uk/1/hi/uk/257284.stm 117 http://www.bbc.co.uk/news/uk-england-leeds-15543924 118 http://www.ecoltd.net/news/fifty-years-bird-fouling-removed-our-bird-control-experts 119 http://www.pigeoncontrolresourcecentre.org/html/cleaning-pigeon-droppings.html 120 http://news.bbc.co.uk/1/hi/uk/257284.stm 121 Office for National Statistics (2012) 2011 Census, Table 2, Usual Resident Population and Population Density, Local Authorities in the United Kingdom, available at http://www.ons.gov.uk/ons/rel/census/2011-census/population-and-household-estimates-for-the-united-kingdom/rft-table-2-census-2011.xls (accessed April 2013) 122 http://www.pigeoncontrolresourcecentre.org/html/pigeon-problems-FAQs.html#faq1 123 http://www.picasuk.com/area_wide_control.html 124 British Pest Control Association (2012), National Survey 2012, 2012

Exploring the Indirect Costs of Litter in Scotland 41 3.10.2 Associated Costs to Scotland A rough estimate is made of the costs of pigeon-related damage due to edible litter in Scotland of between £1,680 and £168,000 per annum. We expect the true figure is likely to be towards the top end of this range. There is no available information on the scale of the costs of controlling pigeons.
3.11 Indirect Costs to Business A 1999 study into the economic impacts of litter on Florida’s businesses found 98% of the 200 businesses surveyed thought that litter has a negative effect upon them. The same proportion also thought that the presence of litter lowered house prices and increased crime.125 Such studies usually attempt to quantify the direct costs which are mostly due to the clean-up and control of litter. For example, the 2009 National Litter Study conducted in the USA states that the majority (79%) of the direct costs of litter are borne by business, estimated to total $9.1 billion per year 79%.126 . However, the indirect costs are harder to quantify especially when most businesses do not understand the direct costs; the National Litter Study reported that when interviewing businesses it took several questions for them to become aware that the business was expending resources on litter at all.
3.11.1 Brand Value One such indirect cost is the potential effect on businesses’ brand value. A study conducted in Manchester in 2012 attempted to quantify this very phenomenon by creating a fictional fast food burger brand.127 They created a 2 minute promotional film/documentary to promote the brand. The participants were separated into two groups. One saw the film unchanged and the other saw a version of the film where branded litter was clearly visible in the surrounding area. Consequently, the second group had a marked preference against the brand, and were even willing to pay 2% less than the control group for a burger. A 2% loss of turnover would be considered significant to most fast food outlets given the low margins on which such businesses may operate, and the cost to brand reputation could be even more detrimental in the long term, suggesting that the industry would see some financial gain from investing in reducing litter.
3.11.2 Most Littered Brands Interestingly, Keep Britain Tidy commissioned a survey in 2011 into branded litter.128 The survey, which was conducted in busy urban areas, such as shopping centres and high streets, discovered that McDonald’s is the most littered brand with 13% of littered items, followed by Cadbury and Greggs at 6% each. 51% of all litter items dropped during the survey related to fast food and confectionary, with fast food comprising 33% of items, followed by confectionary packaging (18%) and tobacco litter (at 17% of all items).
125 Florida Center for Solid and Hazardous Waste Management (1999) The Florida Litter Study: Economic Impacts of Litter on Florida's Businesses, Report for Florida Dept of Environmental Protection, December 1999 126 MSW Consultants (2009) 2009 National Visible Litter Survey and Litter Cost Study, Report for Keep America Beautiful inc., 2009 127 Stuart Roper and Cathy Parker (2012) Doing well by doing good: A quantitative investigation of the litter effect, Journal of Business Research 128 , Keep Britain Tidy (2011) Branded Litter Study 2010/11, 2011
A similar survey was conducted in 2010 by Litter Heroes but was less focussed on urban areas: 129
“70% of the survey sites being on rural roads, footpaths, beaches, village streets or common land; areas that are highly likely to be some distance from a McDonald’s outlet.”
The survey found that Coca-Cola was the most littered brand (4.9%) followed by Walkers Crisps (4.1%) and McDonalds (3.6%) with litter from each of these brands found in over 75% of locations surveyed. The survey concluded that most items littered had been designed to be consumed on the move, had a short lifespan and were too bulky or unpleasant to carry around if a bin was not available. The survey also noted that anti-littering markings on most branded items were either non-existent or too small to be credible. A potential interesting area of future study therefore, may be to investigate whether the prominence and/or type of anti-littering information affects consumers’ propensity to litter.
Both of these studies’ figures are based upon the number of pieces of litter dropped as opposed to their volume or weight. This makes it hard to ascertain whether the visual, or other impact created by each dropped litter item would be related to the frequency of its occurrence. Unfortunately the research does not qualify the findings with any viewpoints from the public to determine whether one form of litter leads to a greater disamenity impact per item than another. Intuitively, a fast food burger box or a crisp packet would be far more conspicuous than a cigarette butt but as the survey figures are based purely upon the number of items dropped it appears to attach the same importance to each piece when that might not be the case. Providing results by volume/size as a comparison may well deliver a more useful figure as this might better represent the visual impact of the litter which is potentially of more interest in terms of valuing the disamenity.
3.11.3 Case Study: McDonald’s Expenditure on Litter Clearing The surveys noted above have established that McDonald’s is one of the most littered brands (on a count basis). Considering that the items are likely to be relatively bulky (e.g. burger boxes, large paper cups with plastic lids etc.), their disamenity impact may well be understated in the count-based surveys. It is therefore useful to consider the investment that the company has put into litter clearing, as this may be a good indicator of the value they place upon avoiding negative connotations through the association of their brand with litter.
From the environment section of the McDonald’s website it appears that the company has committed to three initiatives: 130
1 To send employees into the street outside the restaurant at least three times a day to pick litter;
2 To sponsor council-provided litter bins; and 3 To ensure all packaging carries an anti-littering symbol.
129 Tim Barnes (2010) What's Littering Britain?, Report for LitterHeroes.co.uk, 2010, http://www.litterheroes.co.uk/WhatslitteringBritain.pdf 130 McDonalds (2012) Helping to keep Britain tidy, http://www.mcdonalds.co.uk/ukhome/Ourworld/Environment/Litter.html, Date Accessed: 8 Mar. 2013

Exploring the Indirect Costs of Litter in Scotland 43 In addition, McDonald’s sponsors Keep Britain Tidy’s ‘Love where you live’ campaign alongside others such as Imperial Tobacco and Wrigley. McDonald’s and Wrigley are also supporters of Keep Scotland Beautiful’s ‘Clean Up Scotland’ campaign.131
The cost of these initiatives is not indicated on the McDonald’s website. When contacted directly, a spokesperson from the environmental team at McDonald’s confirmed that all restaurants are asked to complete a minimum of three litter patrols per day during which they have to pick up all the litter immediately surrounding the restaurant to a minimum distance of 150 metres. 132 The spokesperson also estimated that this would take around 30-40 minutes to complete each time costing each restaurant £65-85 per week. This results in a cost to each restaurant of £3,380-£4,420 per year to provide this service. As well as this, all restaurants are also required to hold at least one litter event per year, although it was stated many would hold two or more as it is at the discretion of each franchisee. The spokesperson estimated these costs to be £300-400 per year. McDonald’s has approximately 1,200 outlets in the UK, with around 120 of these in Scotland so the total cost, estimated by McDonald’s, to provide these services in Scotland is between £441,600 and £578,400 per year. The total UK advertising budget for the company in 2010 was £49.4 million.133 On a pro rata basis, given the number of stores in Scotland, the proportion of the advertising budget that could be attributed to Scotland would be 10%, or £4.94 million. Therefore expenditure on anti-litter measures would appear to be equivalent to just over 10% of the company’s advertising budget
Worth mentioning however, are specific licensing conditions that can be applied by local authorities in Scotland regarding late night catering establishments (open between 11pm & 5am).134 Where these conditions apply, such establishments can be required to provide a litter bin immediately outside the premises and make sure it is emptied, and ensure the surrounding area is free from that establishment’s litter. Many McDonald’s outlets are open late and therefore may be subject to this requirement. However they are under no direct obligation to clean up their litter during the daytime unless the premises are the subject of a Street Litter Control Notice, which would usually only be imposed if repeated complaints were received. The McDonald’s spokesperson stated that 24 hour restaurants are required to conduct an extra litter patrol over and above the prescribed three. It is not clear how many of the company’s restaurants are open 24 hours per day. If it were all of the 120, we calculate that the extra cost of this patrol would be between £135,200 and £176,800 per annum. However, the true figure is likely to be much lower, as many restaurants would not be open 24 hours. Accordingly, we conservatively assume that only 10% of restaurants are open for 24 hours per day, with an associated cost of patrols of between £34,000 and £44,000. This brings the total calculated expenditure by McDonald’s on anti-litter measures to between £475,600 and £622,400 per year.
131 http://www.cleanupscotland.com/get-the-latest/our-supporters.aspx 132 Personal email correspondence. 133 www.bradtop100.co.uk (2013) McDonald's ad spend of £49.4m has grown by more than £10m over the past five years, http://www.bradtop100.co.uk/03-Food-Confectionery/04-mcdonalds-restaurants-ltd, Date Accessed: 26 Feb. 2013 134 Scottish Government (2013) Late Night Catering Licence Conditions, 2013, http://www.aberdeenshire.gov.uk/online/licenses/Conditions.pdf

3.11.4 Potential Loss of Investment Other issues highlighted in the literature include the potential loss of investment. As part of the US National Litter Study eleven officials from business and economic development agencies were interviewed about their impressions of litter and its effect on businesses relocating to their region.135 The survey was short and very anecdotal so the conclusions drawn from it are limited. The overarching sentiment was that it is conceivable that litter may have an impact on the decision of where to locate a business, although businesses have many other factors, such as the local taxes and the available workforce, which will affect locational decisions. No specific figures were placed upon the inherent loss to a community associated with the loss of investment; further detailed investigation may provide further insight into this, but for now there is little evidence available.
3.11.5 Associated Costs to Scotland It is difficult to estimate the costs to Scotland in this instance. There is clear evidence as to the extent to which McDonald’s is willing to invest in litter cleaning measures, but it is understood that such actions are not necessarily replicated by other providers of fast food.136 That McDonald’s was the most littered brand in a 2011 Keep Britain Tidy survey, despite the measures the firm takes to remove litter, suggests that the firm is not yet fully internalising the costs associated with the clearance of litter derived from its restaurants.137 The issue of branded litter, and the measures that the owners of the most-littered brands could take to more effectively address the costs that eventually fall to the public purse, merits further study. Given the expenditure by McDonald’s, but in the absence of data from any other companies, it is possible to state that the indirect costs to businesses are greater than £500,000 per annum.
3.12 Litter as a Cause of Wildfires Uncontrolled wildfires can use up a great deal of resources and are especially likely during periods of dry and warm weather. Litter can be responsible for the ignition of wildfires, from the discarding of lit cigarettes to glass and plastic bottles magnifying the sun’s rays.138
According to the Scottish Government there were 5,150 grassland fires in Scotland during the 2011/12 period.139 There are no specific figures available about the size of, and damage caused by, these fires but there are references to such fires in similar areas. A report by Manchester University into the costs to the fire service of attending moorland wildfires categorises the fires into two types; one day (15 hectares) and major incident (350 hectares).140 They estimate that a one day incident costs £15,000 to control whilst a major incident costs £210,000 and upwards as
135 MSW Consultants (2009) 2009 National Visible Litter Survey and Litter Cost Study, Report for Keep America Beautiful inc., 2009 136 Personal communication with Zero Waste Scotland, May 2013 137 Keep Britain Tidy (2011) Branded Litter Study 2010/11, 2011 138 London Fire Brigade (2013) Grass Fires, http://www.london-fire.gov.uk/GrassFires.asp, Date Accessed: 5 Mar. 2013 139 The Scottish Government (2012) Fire Statistics Scotland 2011-12, 2 October 2012 140 Jonathan Aylen (2009) Costs of Suppressing Wildfires, Report for Manchester Institute of Innovation Research, University of Manchester, 2009

Exploring the Indirect Costs of Litter in Scotland 45 it will involve the use of helicopter support. This does not include all the associated costs for the loss of grazing, shooting and extra water treatment costs.
In the USA, fires are split into two groups by the National Interagency Fire Centre (NIFC); lightning and human-caused. The human-caused fires tend to be closer to population centres, e.g. well-travelled footpaths and car parks, and therefore have a greater chance of causing damage to property and injury.141 There are no sources available to quantify this however. According to the NIFC there were 67,774 wildfires in the USA during 2012.142 Of those, 86% were deemed to be human caused. If taken by size however, human-caused fires only accounted for 26.8% of the total area damaged by fire. This is possibly due to the speed at which the fire was discovered and contained.
3.12.1 Associated Costs to Scottish Fire Services We can assume from this that human-caused fires would be mostly smaller scale one day incidents costing around £15,000 each. Applying this cost to 86% of the 5,150 grassland fires that occur annually gives a cost to Scottish fire services of £66.4million per year for human caused fires. Quantifying the exact size of the problem is difficult because of the problems in establishing the exact cause of a wildfire. There are no statistics that specify how many fires are caused by cigarettes being discarded (or other litter). A factsheet produced by the Department for Environment and Conservation in Australia estimates that cigarette ends are responsible for 8-10% of wildfires in rural areas.143 There appears to be no strong supporting evidence for this figure other than anecdotal estimates in news reports.144
Based on the limited substantiation available, if we estimate that between 0.1% and 10% of human related incidents were caused by litter, then the cost to Scotland could be between £66,000 and £6.6million per year. We suggest that a cautious estimate would perhaps be of the order of £1 million per annum, although there is not sufficient evidence to allow this figure to be stated with any great confidence.
3.13 Loss of Material Resource The loss of material resource can be characterised by working out the potential value of the littered material if it were to be disposed of correctly and recycled in line with current Scottish recycling rates. Litter either remains in the environment, or it is collected and (typically) managed as residual waste; either way, the material resource is likely to be lost. This is especially important owing to the ever-increasing cost of raw materials, as well as the environmental benefits of using secondary materials in preference to raw material extraction.
141 McMorrow, J. L. S. (2007) Modelling the spatial risk of moorland wildfires: Moors for the Future (MFF) 142 NIFC (2012) Wildland Fire Summary and Statistics Annual Report 2012, Report for National Interagency Coordination Center, 2012, http://www.predictiveservices.nifc.gov/intelligence/2012_statssumm/annual_report_2012.pdf 143 Keep Australia Beautiful (2009) Cigarette Butts Fact Sheet, Report for Department of Environment and Conservation, 2009 144 Daniel mercer (2012) Lazy litterbugs told to clean up their act, http://au.news.yahoo.com/thewest/a/-/breaking/15066195/lazy-litterbugs-told-to-clean-up-their-act/, Date Accessed: 5 Mar. 2013
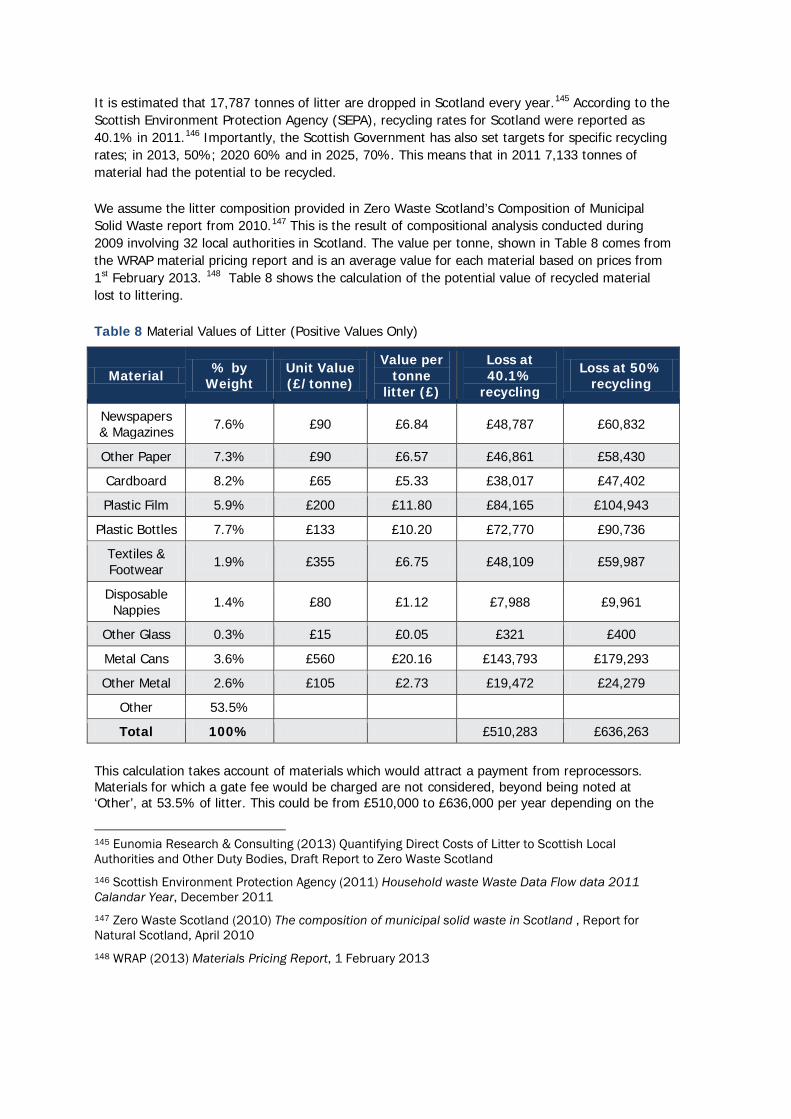
It is estimated that 17,787 tonnes of litter are dropped in Scotland every year.145 According to the Scottish Environment Protection Agency (SEPA), recycling rates for Scotland were reported as 40.1% in 2011.146 Importantly, the Scottish Government has also set targets for specific recycling rates; in 2013, 50%; 2020 60% and in 2025, 70%. This means that in 2011 7,133 tonnes of material had the potential to be recycled.
We assume the litter composition provided in Zero Waste Scotland’s Composition of Municipal Solid Waste report from 2010.147 This is the result of compositional analysis conducted during 2009 involving 32 local authorities in Scotland. The value per tonne, shown in Table 8 comes from the WRAP material pricing report and is an average value for each material based on prices from 1st February 2013. 148 Table 8 shows the calculation of the potential value of recycled material lost to littering.
Table 8 Material Values of Litter (Positive Values Only)
Material % by Weight
Unit Value (£/tonne)
Value per tonne
litter (£)
Loss at 40.1%
recycling
Loss at 50% recycling
Newspapers & Magazines 7.6% £90 £6.84 £48,787 £60,832
Other Paper 7.3% £90 £6.57 £46,861 £58,430
Cardboard 8.2% £65 £5.33 £38,017 £47,402
Plastic Film 5.9% £200 £11.80 £84,165 £104,943
Plastic Bottles 7.7% £133 £10.20 £72,770 £90,736
Textiles & Footwear 1.9% £355 £6.75 £48,109 £59,987
Disposable Nappies 1.4% £80 £1.12 £7,988 £9,961
Other Glass 0.3% £15 £0.05 £321 £400
Metal Cans 3.6% £560 £20.16 £143,793 £179,293
Other Metal 2.6% £105 £2.73 £19,472 £24,279
Other 53.5%
Total 100% £510,283 £636,263
This calculation takes account of materials which would attract a payment from reprocessors. Materials for which a gate fee would be charged are not considered, beyond being noted at ‘Other’, at 53.5% of litter. This could be from £510,000 to £636,000 per year depending on the
145 Eunomia Research & Consulting (2013) Quantifying Direct Costs of Litter to Scottish Local Authorities and Other Duty Bodies, Draft Report to Zero Waste Scotland 146 Scottish Environment Protection Agency (2011) Household waste Waste Data Flow data 2011 Calandar Year, December 2011 147 Zero Waste Scotland (2010) The composition of municipal solid waste in Scotland , Report for Natural Scotland, April 2010 148 WRAP (2013) Materials Pricing Report, 1 February 2013
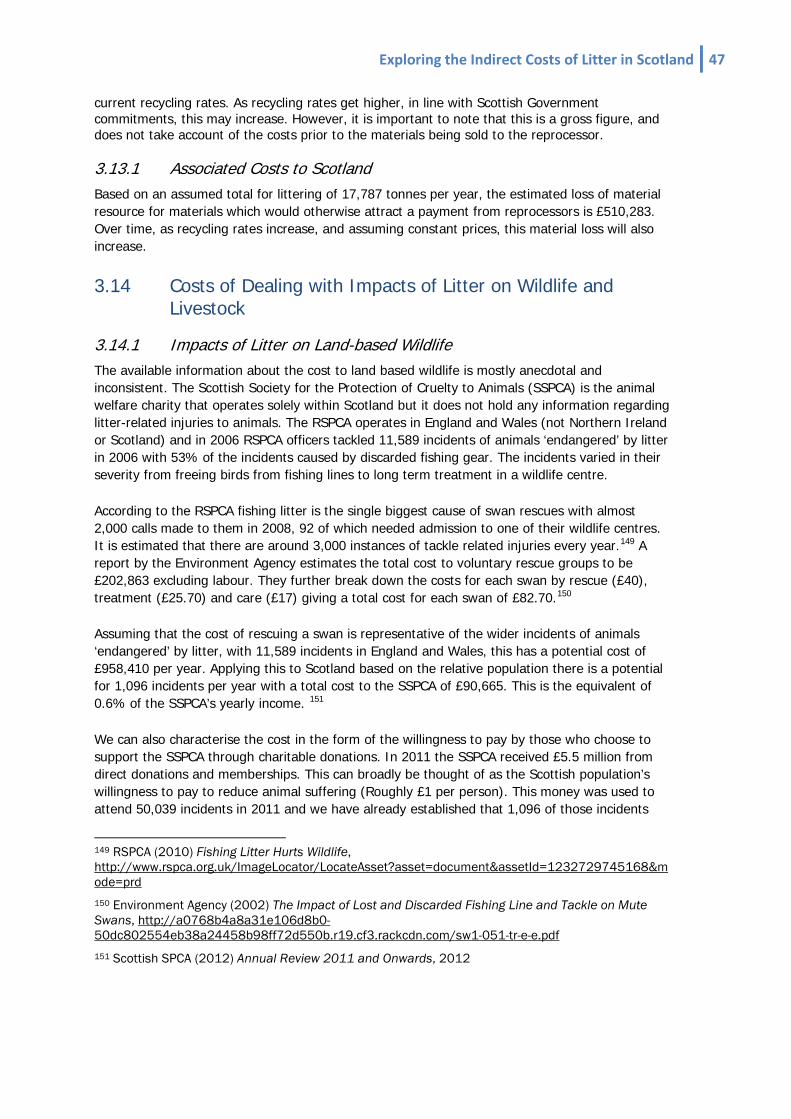
Exploring the Indirect Costs of Litter in Scotland 47 current recycling rates. As recycling rates get higher, in line with Scottish Government commitments, this may increase. However, it is important to note that this is a gross figure, and does not take account of the costs prior to the materials being sold to the reprocessor.
3.13.1 Associated Costs to Scotland Based on an assumed total for littering of 17,787 tonnes per year, the estimated loss of material resource for materials which would otherwise attract a payment from reprocessors is £510,283. Over time, as recycling rates increase, and assuming constant prices, this material loss will also increase.
3.14 Costs of Dealing with Impacts of Litter on Wildlife and Livestock
3.14.1 Impacts of Litter on Land-based Wildlife The available information about the cost to land based wildlife is mostly anecdotal and inconsistent. The Scottish Society for the Protection of Cruelty to Animals (SSPCA) is the animal welfare charity that operates solely within Scotland but it does not hold any information regarding litter-related injuries to animals. The RSPCA operates in England and Wales (not Northern Ireland or Scotland) and in 2006 RSPCA officers tackled 11,589 incidents of animals ‘endangered’ by litter in 2006 with 53% of the incidents caused by discarded fishing gear. The incidents varied in their severity from freeing birds from fishing lines to long term treatment in a wildlife centre.
According to the RSPCA fishing litter is the single biggest cause of swan rescues with almost 2,000 calls made to them in 2008, 92 of which needed admission to one of their wildlife centres. It is estimated that there are around 3,000 instances of tackle related injuries every year.149 A report by the Environment Agency estimates the total cost to voluntary rescue groups to be £202,863 excluding labour. They further break down the costs for each swan by rescue (£40), treatment (£25.70) and care (£17) giving a total cost for each swan of £82.70.150
Assuming that the cost of rescuing a swan is representative of the wider incidents of animals ‘endangered’ by litter, with 11,589 incidents in England and Wales, this has a potential cost of £958,410 per year. Applying this to Scotland based on the relative population there is a potential for 1,096 incidents per year with a total cost to the SSPCA of £90,665. This is the equivalent of 0.6% of the SSPCA’s yearly income. 151
We can also characterise the cost in the form of the willingness to pay by those who choose to support the SSPCA through charitable donations. In 2011 the SSPCA received £5.5 million from direct donations and memberships. This can broadly be thought of as the Scottish population’s willingness to pay to reduce animal suffering (Roughly £1 per person). This money was used to attend 50,039 incidents in 2011 and we have already established that 1,096 of those incidents
149 RSPCA (2010) Fishing Litter Hurts Wildlife, http://www.rspca.org.uk/ImageLocator/LocateAsset?asset=document&assetId=1232729745168&mode=prd 150 Environment Agency (2002) The Impact of Lost and Discarded Fishing Line and Tackle on Mute Swans, http://a0768b4a8a31e106d8b0-50dc802554eb38a24458b98ff72d550b.r19.cf3.rackcdn.com/sw1-051-tr-e-e.pdf 151 Scottish SPCA (2012) Annual Review 2011 and Onwards, 2012

may have been litter related; therefore, the proportion of donation money assigned to these incidents is £120,466 which can be thought of as Scotland’s willingness to pay to reduce animal suffering from litter related incidents. This is not dissimilar to the estimated actual cost to the SSPCA of treating these animals.
These estimated costs may not provide the full picture as to the extent of litter based injuries to animals, however, as not all incidents would be reported to or attended by the RSPCA/SSPCA. A substantial number of incidents would not have been attended by any wildlife charities especially when concerning pets. Charities tend to deal with incidents of cruelty or wild animals in distress and are less likely to be involved with household pets. These injuries would likely be treated by a vet but currently there is no central database for logging the types and causes of injuries treated by vets.
Moreover, knowing that litter is causing harm to animals (beyond those attended to by the SSPCA) will lead to a loss of amenity for many people. As an ‘external’ cost, this could most appropriately be accounted for through the use of non-market valuation approaches such as contingent valuation.
3.14.2 Impacts of Litter on Marine Wildlife There are a number of potential impacts of litter on marine wildlife identified in the literature, notably in respect of entanglement and/or ingestion.152 However, there is a dearth of data on the costs of assisting animals suffering from these impacts. In part this may be because the greater proportion of cases identified are where the animal in question has died, possibly as a result of, for example, entanglement, ingestion, or suffocation.
Two items that can readily affect both land-based and marine wildlife are single-use plastic bags and balloons. Action to address the former has been taken in the form of levies in Wales and Northern Ireland, with a recent announcement also to introduce a levy in Scotland. For the latter, the literature of both the Marine Conservation Society and the RSPCA highlight the potential dangers to wildlife of balloon releases.153,154 They both cite that 10% of released balloons do not burst in the atmosphere but return to the ground as litter. They suggest that the balloon fragments can become lodged in the throat or stomach of an animal eventually causing it to die. Other than a handful of examples, however, there are no specific figures available for how widespread this is, though some authorities in the UK, USA and Australia have banned the practice.
The impacts of litter on marine wildlife (to the extent that we understand them) may better be accounted for at present through non-market valuation approaches, as outlined in Section 4.2 (albeit the non-market valuation studies referenced do not focus explicitly on the impacts of litter on marine wildlife). For many people there is clearly a loss of disamenity associated with the
152 Mouat, J., Lopez Lozano, R., Bateson, H. and KIMO (2010) Economic Impacts of Marine Litter, Report for KIMO, 2010 153 Marine Conservation Society (2006) What happens to balloons after they are released?, http://www.mcsuk.org/downloads/pollution/dont%20let%20go.pdf 154 RSPCA (2005) Wildlife factsheet: Balloon Releases, http://www.rspca.org.uk/ImageLocator/LocateAsset?asset=document&assetId=1232721459630&mode=prd

Exploring the Indirect Costs of Litter in Scotland 49 knowledge that litter (particularly plastic) in the marine environment may harm or even kill marine fauna.155
3.14.3 Impacts of Litter on Livestock In terms of quantifying the impacts of litter to farming and livestock there has been very little research conducted. Most evidence is anecdotal and related to farmland being commonly used by flytippers. As part of the KIMO study156 Shetland crofters were surveyed. 41.9% said they had experienced animals being injured by marine litter being blown onto their land and estimated a total loss to the Shetland farming industry of €252,331 (approximately £215,000 at 2010 exchange rates).157 However, this is a relatively niche area of farming with very location-specific issues that cannot be applied across Scottish farming as a whole.
3.14.4 Associated Costs in Scotland We estimate that the cost of dealing with animals endangered by litter is approximately £315,000 per annum in Scotland. However, this relates to the cost of treating animals that are found while still alive, so does not necessarily reflect the full impact, especially in the case of marine wildlife.
3.15 Costs of Clean-ups to Volunteer Organisations
3.15.1 Beachwatch Every year many volunteer clean-ups or litter-picks take place across the UK, for example, Beachwatch, organised by the Marine Conservation Society. They have identified and regularly cleaned the most frequented beaches in Scotland (see Figure 3). In 2008 they cleaned up 52 Scottish beaches amounting to 22.3km (13.85 miles). They found that 37.5% of all identifiable litter items were ‘public litter’ with Scotland having the highest number of items/km in the UK. The size and volume of the litter was not recorded.158
There are significant costs to both the organisations and the volunteers participating. In many respects, however, these ‘costs’, as distinct from other internalised costs considered, arguably reflect a measure of the utility derived by volunteers from their participation in the clean-up (indeed, a valuation of their time would be expected to give a lower-bound estimate for this). A 2009 KIMO study surveyed a large number of volunteer organisations about their activities. 159 They found that Beachwatch recorded a total of 9,995 volunteer hours during 2009. If this were to be valued at the minimum wage of £6.19 per hour this is a cost of £61,869 per year. However, this is a UK-wide figure and there is no indication of the number of hours volunteered in Scotland. There are no specific financial figures available for 2009 but the MCS spent £196,768 in total on Beachwatch in 2011.160 Again this relates to the UK rather than just Scotland.
155 See http://www.isonomia.co.uk/?p=694 156 Mouat, J., Lopez Lozano, R., Bateson, H. and KIMO (2010) Economic Impacts of Marine Litter, Report for KIMO, 2010 157 http://www.x-rates.com/average/?from=EUR&to=GBP&amount=1&year=2010 158 Marine Conservation Society (2009) MCS Beachwatch results, 8 April 2009 159 Mouat, J., Lopez Lozano, R., Bateson, H. and KIMO (2010) Economic Impacts of Marine Litter, Report for KIMO, 2010 160 Marine Conservation Society (2012) MSC Annual Review, 31 March 2012

Figure 3 Beachwatch 2008 Locations
3.15.2 Clean Up Scotland The other large volunteer clean up campaign in Scotland is run by Keep Scotland Beautiful (KSB) under the banner of ‘Clean Up Scotland’ (formerly ‘National Spring Clean’). The KIMO report161 states that 4,154 adults took part in coastal clean ups organised as part of National Spring Clean in 2010, with a press release from KSB162 reporting 83,668 volunteers taking part in clean ups across Scotland with 21% of those volunteers being adult.163 While there are clearly difficulties in identifying an appropriate opportunity cost for the effort made by children in the clean-up, we can again apply a minimum wage to the 17,570 adult volunteers. Assuming an average of 2 hours is given per volunteer at minimum wage the total cost to volunteers would be at least £217,516.
A more recent evaluation by Keep Scotland Beautiful of the 2012 National Spring Clean notes that 117,000 volunteers took part, and estimates that a further 100,000 people participated but did not register.164 Using information on the economic value of volunteering from Volunteer Development Scotland, KSB estimated that the economic value of the volunteer contribution to Spring Clean 2012 was over £2.3m. This appears to be based on the assumption that the 117,000 registered volunteers each spent 1.5 hours volunteering, giving a total of 175,500 hours. At the hourly rate of approximately £13, based on the median Scottish earnings for full time
161 Mouat, J., Lopez Lozano, R., Bateson, H. and KIMO (2010) Economic Impacts of Marine Litter, Report for KIMO, 2010 162 Keep Scotland Beautiful (2010) National Spring Clean 2010 hailed Scotland's biggest volunteer litter pick ever!, May 2010 163 This is based on the numbers registered to attend, and actual attendance on the day may have varied from this. 164 Keep Scotland Beautiful (2012) National Spring Clean: Community Action for Safe and Healthy Neighbourhoods - Review 2012, 1 November 2012

Exploring the Indirect Costs of Litter in Scotland 51 employees, this gives a total of £2.3m.165 However, it is not clear whether the 117,000 registered volunteers were all adults, albeit it is noted that KSB has been conservative in not seeking to value the time of the further 100,000 people understood to have taken part.
3.15.3 Associated Costs to Scotland For the KSB ‘National Spring Clean’ campaign for 2009 and the MCS Beachwatch for 2010, the annual expenditure, including the value of the volunteer’s time would be likely to be of the order of £450,000. This might not reflect a cost, but rather, a lower bound estimate of the level of utility (the ‘warm glow’) that the participants derive from their engagement in the activity. A higher figure of £2.3m for volunteer time alone is derived from the more recent evaluation by KSB. Again, this expenditure could, to an extent, be seen as representing the utility derived from participation. What it does show is that there is a clear willingness among members of the public to spend their leisure time enhancing the local environment. Given that this event occurs just once a year, it would seem reasonable to suggest that the time spent on the National Spring Clean campaign does not come close to representing the full willingness to engage to reduce litter, as it is arguably constrained by the limited opportunity to do so.
Accordingly we feel it is reasonable to identify the £2.3m as a ‘constrained willingness-to-pay’ of the Scottish population to reduce litter.
3.16 Costs of Litter-related Flooding
3.16.1 Surface Water and Sewer Flooding SEPA highlights several different sources of flooding.166 Of relevance to litter and flytipping are surface water flooding and sewer flooding (for combined sewer systems that deal with both rainwater and sewage), because of the effect that litter can have on the ability of the drainage systems to deal with rainwater. There is also a positive feedback loop in this process, as flooding also washes littered items into drains. The sewer system however is likely to be impacted to a greater extent by people disposing of fats, oils and personal care items down sinks and toilets.167
SEPA’s maps of flood risk are only relevant to coastal and river flooding. It is stated that surface water flooding is difficult to predict or pinpoint, because of the unpredictable location and heaviness of rainfall. SEPA’s Flood Forecasting Service only takes into account rainfall when estimating surface water flood risk.168 That said, 47,500 homes are considered to be at risk of surface water flooding, with average annual cost of damages estimated at £274-323m. Surface water flooding accounts for 38% of flooding incidents in Scotland.169 Potential measures to
165 Volunteer Development Scotland: Calculating Economic Value of Volunteering, available at http://www.vds.org.uk/Portals/0/documents/Research/Economic%20value%20of%20volunteering%202011.xlsx 166 http://www.sepa.org.uk/flooding/be_flood_aware/types_of_flooding.aspx 167 This would be considered as inappropriate disposal rather than littering 168 http://www.sepa.org.uk/flooding/flood_forecasting_service.aspx 169 SEPA (2011) The National Flood Risk Assessment - December 2011, 2011
address surface water flooding do include the maintenance of road drainage for optimal performance.170
3.16.2 Drains Blocked by Litter We have found isolated reports of drain blockages caused by litter.171 One council stated “[the Council]…regularly inspect gullies to prevent the build up of materials, however supermarket trolleys, builders materials and flytipping are all problems that we encounter on a regular basis”.172 However we have been unable to find any centralized source of information on the subject. The general consensus is that litter along with organic detritus, mud and grit all contribute to the blocking of drains.173
Although in Delhi, India, legislation has been brought in banning plastic bags because flooding caused by them is perceived as of significant impact,174 in developing countries there are three factors that would increase the frequency of this happening. Firstly, the use of plastic bags is higher than elsewhere, as the use of other containers is prohibitively expensive for much of the population. Liquids and emulsions are frequently sold in bags whereas they might be sold in bottles or pots in other places. Secondly, waste infrastructure may be poor or non-existent, both in terms of litter clearance but also refuse collection. This leads to further litter from piles of waste being blown about or carried around by water. Lastly, the drainage infrastructure is likely to have a much tighter capacity margin, either to save costs, or because of poor planning.175 Flooding is a function of water input and the capacity of the system to deal with that input, the latter in turn being a function of both system design and extent of blockages, potentially caused by litter. It is easy to see why this might be more of an issue in a country like India, where monsoon rains also are notoriously intense, than in a country like Scotland.
3.16.3 Associated Costs to Scotland While annual costs of surface water flooding in Scotland are estimated at £274-323 million, there is no indication that litter or flytipping makes anything more than an incidental contribution to specific situations. Accordingly, there is insufficient evidence to attribute costs.
3.17 Effects of Litter on House Prices There is evidence to suggest that house prices could be affected by the presence of litter, from the extensive research carried out for Keep America Beautiful (KAB) in their 2009 National Litter Survey.176 KAB looked into the degree to which the existence of litter affects the perceived desirability of a neighbourhood by conducting phone interviews throughout the US. 93% of respondents said they would be influenced by the presence of litter when deciding whether or not
170 SEPA (2013) Surface Water Management Planning Guidance, 2013 171 http://www.cambridge-news.co.uk/Newmarket/Litter-filled-drain-blamed-for-floods-18052012.htm 172 http://www.preston.gov.uk/yourservices/neighbourhoods-and-community/emergencies/flooding/ 173 Personal communications with Scottish Local Authorities as part of the ZWS direct cost of litter survey 174 http://www.bbc.co.uk/news/world-asia-india-20457764 175 Ghana: http://thechronicle.com.gh/indiscriminate-littering-contributes-to-flood-disasters/ 176 MSW Consultants (2009) 2009 National Visible Litter Survey and Litter Cost Study, Report for Keep America Beautiful inc., 2009

Exploring the Indirect Costs of Litter in Scotland 53 to purchase a property. When surveying a group of real estate agents 55% said that the presence of litter would affect their valuation and hypothesised a potential 9% decrease in value although that would largely depend on the quantity and type of litter, with a distinction noted between “old cars in the yard or just some trash on the street.” It appears that litter is uniformly cited as being a notable, negative issue. The difficulty, however, has always been in quantifying the magnitude of this cost.
In 2011, in order to address this gap the National Association of House Builders (NAHB) created a hedonic pricing model based upon a survey from the US Census Bureau.177 It attempted to crystallise the effects of certain amenities and disamenities associated with the location of a home and its features. One such disamenity is the presence of litter which, the authors suggest, on average, and controlling for other factors, can reduce a suburban home’s value by between 2.7% and 11.8% depending on geographical location. It is likely that more than one disamenity highlighted in the model would appear in the same area, for example abandoned buildings might be more likely to be found in many of the same areas where litter is more prevalent, perhaps in line with the broken windows theory already discussed. As we are not certain that this model has been empirically verified, we cannot state with confidence that the percentage reductions can necessarily be attributed to the presence of litter alone. Moreover, no detail is given on the actual level of litter. However, even taking the lower end of the scale, a 2.7% reduction in value due to litter would represent a considerable loss in value for many homeowners.
3.17.1 Associated Costs to Scotland Taking the average Scottish house price from October to December 2012 of £154,810, a 2.7% reduction would equate to a loss in value of approximately £4,180.178 The difficulty arises when scaling this up to Scotland as a whole, especially as the figure from the NAHB study relates to suburban homes. It is not clear whether the same level of reduction would hold true for tenement flats, for example. There is no way of telling the extent to which house prices are affected by litter without evaluating neighbourhoods individually to ascertain whether there is a litter problem present. To give an idea of scale, however, if just 1% of the 2.37 million households within Scotland were devalued by £4,180 because of the presence of litter, the potential devaluation of the Scottish housing stock would be just under £100 million.
3.18 Impacts of Litter on Tourism Linked to the issue of disamenity is the potential impact on tourism. In 2011 tourism expenditure in Scotland totalled £4.5 billion with one third of this income coming from overseas visitors. 179 Accordingly, it is important to realise the potential impacts of litter in this area and how it affects the choice of destination for tourists. The cleanliness of Scottish beaches is an area of particular study because of the visibility of litter in an otherwise rural setting where people enjoy spending their free time. A 2005 ENCAMS survey found that the cleanliness of a beach is a critical factor for
177 Paul Emrath (2011) NAHB House Price Estimator, Report for National Association of House Builders, 2011 178 BBC (2013) UK house prices: October to December 2012. Available at http://news.bbc.co.uk/1/shared/spl/hi/in_depth/uk_house_prices/regions/html/region12.stm (accessed March 2013) 179 Visit Scotland (2011) Scotland: The key facts on tourism in 2011, 2011

visitors when choosing where to go.180 In fact a 2009 KIMO study into the effects of marine litter states:
“For most municipalities, the potential economic impact of marine litter on tourism provides the principal motivation for removing beach litter. In this respect, regularly removing beach litter costs less than the potential reduction in revenue that could result from taking no action.”181
3.18.1 Effects on Tourism in Sweden In terms of loss to the tourist trade, Swedish research suggests that beach litter reduces tourism by between 1 and 5%.182 The Great British Tourist Survey identified that visitors to Scottish beaches spent £167 million during 2011, which is less than 10% of the level of expenditure in England and half that of Wales.183 Arguably, there is potential for this figure to be on the low side, since other activities categorised in the survey, such as sightseeing, could have happened in a coastal area and therefore increase this figure substantially. However, it is worth noting that Scotland’s beaches tend to be valued for their natural beauty, rather than as ‘seaside resorts’, so the consumer spend associated with each visit may differ accordingly. Assuming a ‘worst case’ and applying the 5% reduction from the Swedish study, there would be a potential loss of £6.35 million in tourist spend which might be related to the presence of litter. However, there is a lack of clarity as to the baseline applied here, and what the marginal impacts may be. It may be that beach litter may already be reducing tourism spend to a level below that which would otherwise occur in the absence of litter, but we are unable to discern this from the literature.
3.18.2 Displacement Elsewhere in Scotland The issue with attempting to quantify tourism impacts is that there would be an expectation that a certain amount of tourism would simply be displaced to another part of Scotland and, therefore, the estimated figures are not expected to represent a loss to Scottish tourism as a whole, but purely to the specific local coastal economies. To obtain a true picture of the net reduction in Scottish tourist spend due to litter would be a complex undertaking. This is highlighted in a 1990 report into summer beach closures in Long Island, New York.184 Medical waste was found to have washed up on several beaches prompting a closure of 15 miles of beach for two days at the height of the summer season. Subsequent assessments calculated an estimated net loss of $1.4 billion due to the beach closures. The report also, quite rightly, suggests the true level of reduction was likely to be considerably less since it could be assumed that some of the tourists who did not visit the affected beaches probably participated in other activities on Long Island.
180 ENCAMS (2005) Beach User Segmentation, 28 February 2005 181 Mouat, J., Lopez Lozano, R., Bateson, H. and KIMO (2010) Economic Impacts of Marine Litter, Report for KIMO, 2010 182 Ten Brink, P. and et al. (2009) Guidelines on the Use of Market-based Instruments to Address the Problem of Marine Litter, Report for UNEP, 2009 183 Visit England, V. S. V. W. (2011) Volumes and Values of Domestic Tourism in Great Britain, 2011 184 Kathryn D.Wagne (1990) Medical Wastes and the Beach Washups of 1998: Issues and Impacts, Report for Oceans and Environment Program, 1990, http://swfsc.noaa.gov/publications/TM/SWFSC/NOAA-TM-NMFS-SWFSC-154_P811.PDF

Exploring the Indirect Costs of Litter in Scotland 55 3.18.3 Patchy Evidence Other sources suggest that litter may result in a negative perception on the part of tourists, but do little to shed light on the extent of possible impacts. For example, the AA surveyed their members in 2012 and found that 94% of them thought roadside litter gave tourists a bad impression of the UK, with 75% saying they thought roadside litter was a serious problem.185 However, there was no indication as to whether tourists would avoid visiting the UK, notwithstanding the fact that the opinion of AA members would not necessarily have provided a robust evidence base.
Evidence in respect of changes in beach visit frequency or location arising through reductions in litter was described by the authors of a recent study for the Dutch Government as ‘patchy and largely hypothetical’, and the authors determined that transfer of numerical results to the Netherlands would not be appropriate. There was also limited evidence on local economic impacts due to changes in litter and associated visitor numbers. It was noted by the authors that:186
While it appears clear that reductions in marine litter can lead to changes in visitor numbers and therefore visitor expenditures, there is no hard evidence that would allow estimation of the numerical impact [under the Dutch policy proposals].
3.18.4 Localised Impacts It appears unlikely that the presence of litter has a significant negative impact on Scottish tourism at the national level. However, at the local level, for a particular town or attraction, the presence of litter could be a significant factor in deterring expenditure by visitors. Accordingly, while reducing levels of litter would appear unlikely to lead to an increase in overall tourist expenditure in Scotland, on a local basis, a reduction in litter could bring considerable benefits.
185AA (2013) Roadside litter, http://www.theaa.com/newsroom/news-2012/roadside-litter.html, Date Accessed: 21 Feb. 2013 186 EFTEC, Enveco and InterSus (2012) Recreational Benefits of Reductions of Litter in the Marine Environment, Report for Rijkswaterstaat Waterdienst, 15 November 2012

4.0 External Costs A small number of studies have sought to identify the willingness-to-pay (WTP) for reductions in litter.
4.1 Valuing Local Environmental Improvements A 2011 study funded by Defra sought to establish the willingness to pay, in terms of an increase in council tax, for a number of improvements in a range of local environmental factors, namely: 187
• Urban quiet areas; • Flytipping;
• Litter;
• Flyposting;
• Graffiti;
• Dog-fouling;
• Discarded chewing gum;
• Trees;
• Light pollution (obscuring the stars);
• Light intrusion (into the home); and
• Odour. The emphasis was on local, or neighbourhood, effects, by which the authors mean individuals’ willingness to pay for improved conditions, as experienced in their locality. The study does not cover the benefits of improved environmental factors for those who are visitors to another area, or the respondents’ experience of these environmental factors in places other than their locality.
Surveys were carried out in late January and early February 2011 in Manchester, Coventry and London, providing a representative mix of 561 respondents across England. Within each city, surveys were conducted in three specific locations that covered inner-city, suburban and rural/semi-rural areas.
4.1.1 Rating of Local Environmental Factors Prior to questions being asked in relation to WTP, respondents were asked to identify local environmental quality in relation to the relevant factors, with a value of 1 denoting the worst condition offered, and either 3, 4 or 5 denoting the best condition depending on the number of levels offered. The results of this are shown in Table 9, from which it can be seen that chewing gum and litter score poorly.
187 Mark Wardman, Abigail Bristow, Jeremy Shires, Phani Chintakayala and John Nellthorp (2013) Estimating the Value of a Range of Local Environmental Impacts, Report for Dept. for Environment, Food and Rural Affairs, 1 April 2011

Exploring the Indirect Costs of Litter in Scotland 57 Table 9 Respondents’ Current Situation for Each Local Environmental Factor
Source: Wardman et al., 2011
4.1.2 Willingness to Pay for Improvements In terms of the willingness to pay valuations for improvements in local environmental factors, all expressed on a common 0-10 scale from bad to good, the monetary values shown in Table 10 were obtained. These again show that litter and flytipping are the factors for which respondents indicate the highest level of willingness to pay for ‘unit’ improvements (on a scale of 1 to 10). The average WTP (per person per month) for a unit improvement is £3.95 for litter, and £3.71 for flytipping. Multiplying these unit valuations by ten to establish an average monthly WTP for a move from the worst to best situation, the values are £39.50 for litter, and £37.10 for flytipping.
However, it is important to note that not everyone will rate the worst level offered by the researchers as zero and the best level offered as 10. Accordingly the use of this valuation would overstate the benefit of moving from existing levels to the best level.
Table 10 Willingness to Pay Valuations (£s per person per month) and Ranking of Importance
Source: Wardman et al., 2011

Further analysis was undertaken, to identify differences in the valuations of local environmental factors according to socio-economic, attitudinal and location factors. Rather than using the 11 point scale (0-10), this was based on four photographs showing different levels of littering. The valuations therefore represent ‘one-level’ shifts on a four level scale. The results were used to demonstrate how willingness to pay valuations (in £s per person per month) vary across circumstances. The results, by area type, are presented in Table 11. It is worth noting that this is an average value for the whole sample so may include some who are already at the best level and so place a zero value on any improvements.
Table 11 Valuations (£s per person per month) by Area Type
Source: Wardman et al., 2011
It can be seen that the difference between the valuations placed on the ‘One Level’ improvements and ‘To Best’, reduce as one moves from Inner-City, to Suburban, to Rural. This would suggest that the pre-existing level of litter is highest in inner city areas, and lowest in rural areas, which would, intuitively, make sense.
4.1.3 Application to Scotland In transferring these values to Scotland, it would appear that the most appropriate figures to use to establish the total disamenity impact for local areas would be £15.81 per month for inner city areas, £16.20 per month for suburban areas, and £12.54 per month for rural areas. Without further research it is not possible to know whether the pre-existing level of litter in Scotland is similar to the areas where the research was undertaken, but for the purposes of this benefits transfer exercise, we have assumed that it is.
The General Register Office for Scotland provides details on population according to an urban/rural split, but does not make the distinction between inner-city, suburban and rural. Urban areas are considered to be settlements of over 3,000 people, while rural areas are settlements of less than 3,000 people.188 The latest figures available, for 2011, show that there were 3,443,178
188 The Scottish Government (2012) Defining Scotland by Rurality, available at http://www.scotland.gov.uk/Topics/Statistics/About/Methodology/UrbanRuralClassification (accessed March 2013)

Exploring the Indirect Costs of Litter in Scotland 59 people aged 18 or over living in urban areas, and 775,213 in rural areas. 189 Table 12 shows the aggregate values derived from the application of these monthly WTP values to the Scottish population. Monthly WTP would be £64 million, and annual WTP would be just under £770m.
Table 12 Aggregate Willingness to Pay to Achieve ‘Best’ Status in Respect of Neighbourhood Litter
Location Population Unit WTP (per
person per month)
Total WTP (per month)
Total WTP (per annum)
Urban 3,443,178 £15.81* £54.44m £653.24m
Rural 775,213 £12.54* £9.72m £116.65m
Total 4,218,391 £64.16m £769.89m
* Based on figures for ‘Inner City’ and ‘Rural’ from Wardman et al., 2011
On a per person per annum basis, the figures shown in Table 12 equate to £190 in urban areas, and £150 in rural areas. This appears quite high given that the average Band D Council Tax figure in Scotland for 2012/13 is £1,149.190 Accounting for the fact that 38% of households are entitled to a ‘single-adult’ discount191 of 25%,192 this gives an average Band D Council Tax payment, per adult, of £684. The WTP for achieving ‘Best’ status for neighbourhood litter (in urban areas) is therefore equal to an extra 27% on top of the typical per capita Council Tax payment. While it is possible that such a figure could well reflect the importance that people attach to a litter-free local environment, it does appear to be rather high. There would certainly be merit in further work being undertaken to verify the scale of these figures in respect of the value that Scottish citizens place on a litter free local environment.
However, when considered against the reported effects of a littered environment on house prices, the WTP figures do not seem unduly excessive. As noted in Section 3.17.1, a 2.7% reduction in the value of a property due to the presence of litter in the neighbourhood would equate to a loss in value, for the average Scottish property, of approximately £4,180. Set against this potential loss, an annual payment of between £150 and £190 per person seems quite reasonable. Given the noted causality in respect of litter and crime, for example, and working on the not
189 General Register Office for Scotland (2012) Population Estimates by Urban Rural Classification, available at http://www.gro-scotland.gov.uk/statistics/theme/population/estimates/special-area/urban-rural.html (accessed March 2013) 190 The Scottish Government (2012) Council Tax Data, available at http://www.scotland.gov.uk/Topics/Statistics/Browse/Local-Government-Finance/DatasetsCouncilTax (accessed March 2013) 191 General Register Office for Scotland (2012) The Number of Households in Scotland Continues to Rise, available at http://www.gro-scotland.gov.uk/press/news2012/number-of-households.html (accessed March 2013) 192 The Scottish Government (2012) Council Tax in Scotland – A guide for People who have Special Needs and their Carers, available at http://www.scotland.gov.uk/Topics/Government/local-government/17999/counciltax/leaflets/0 (accessed March 2013)

unreasonable assumption that levels of crime must affect house prices, the calculated willingness to pay would appear to be perfectly rational from the householder’s perspective.
As a comparison, it is also of interest to value a ‘one level’ improvement (on a four level scale) as reported in Table 11 for the Scottish population. The results of this calculation are shown in Table 13. Monthly WTP would be £43million, and annual WTP would be £513 million. On a per person per annum basis, the figures shown in Table 13 equate to £117 in urban areas, and £142 in rural areas.
The calculations, focused as they are on neighbourhood environmental quality, do not value any improvements to places that individuals visit, such as beaches or the countryside. A study reflecting the disamenity impacts of beach litter is considered in Section 4.2.
Table 13 Aggregate Willingness to Pay to Achieve a ‘One Level’ Improvement in Respect of Neighbourhood Litter
Location Population Unit WTP (per
person per month)
Total WTP (per month)
Total WTP (per annum)
Urban 3,443,178 £9.75* £33.57m £402.85m
Rural 775,213 £11.83* £9.17m £110.05m
Total 4,218,391 £42.74m £512.90m
* Based on figures for ‘Inner City’ and ‘Rural’ from Wardman et al., 2011
4.1.4 Alternative Valuations The figures identified above are considerably larger than two studies undertaken in 2010. The first study, by Cambridge Economic Associates (CEA) indicated that the average household would be willing to pay an extra £37.58 per annum on their council tax to live in a neighbourhood where the streets have moved from a state of ‘Some litter’ to ‘Very little litter’ (‘Mostly clear of litter’ was the median state).193 Unfortunately this does not cover the WTP to remove litter from rural areas, and the sample was relatively small, confined as it was to one town in the North East of England.
The second, a more significant study in terms of size and scope was carried out in Australia by Pricewaterhouse Coopers (PwC) during 2010.194 Over 3,000 people were surveyed from 15 different regions across Australia. Householders stated they were willing to pay $41.5 per annum for every 10% reduction in litter. To put this into context the householders were advised that a 10% reduction would be a ‘noticeable improvement’ in litter whereas a 20% reduction corresponded to a ‘significant improvement’.
To compare the two studies we will assume that ‘very little litter’ corresponds to a ‘significant improvement’. That being the case, Australian households were willing to pay $83 which equates to £46.10 (Using the 2010 exchange rate of 1GBP = 1.8AUD). The willingness to pay figure from
193 Cambridge Economic Associates with eftec, a. C. E. (2010) Valuing the Benefits of Regeneration , Report for DCLG, December 2010 194 PricewaterhouseCoopers (2010) Estimating Consumers' Willingness to Pay for Improvements to Packaging and Beverage Container Waste Management, Report for Environmental Protection and Heritage Council of Australia, June 2010, http://www.ephc.gov.au/taxonomy/term/53

Exploring the Indirect Costs of Litter in Scotland 61 the CEA study will be used as the lower threshold and the figure from the Australian study by PwC as the upper threshold across the 2.37million households in Scotland. This gives a net figure of between £89-109 million per annum to move from the current situation to ‘very little litter’ in Scotland.
One final study was conducted by RDC in Wallonia (Belgium) and sought to elicit the willingness to pay for the removal of can related litter. The WTP approach used images of areas with litter including cans, and excluding cans. The results were that the WTP for removal of cans from litter were €9 - €22 per household per year. The study also sought to understand the benefits of eliminating all litter, the results being a range from €34 - €39 (£30 - £34 in 2011 prices) per household per year.195, 196 Inflated to 2013 values, this would be £31 - £35 per household per year.197 This figure would indicate a value slightly below the figures derived above. Applied to the 2.37 million Scottish households gives a range between £73 and £83 million per annum.
4.1.5 Likely Neighbourhood Litter Disamenity Impacts in Scotland While there are only four studies upon which we can base an estimate, and bearing in mind that the descriptions of improvements in each are different, they do at least suggest a plausible range for the total disamenity impacts for ‘neighbourhood’ litter in Scotland. With figures ranging from £73m to £770m per annum, it would seem unlikely that the true value lies outside of this range. Indeed, it might be expected that the true value lies towards the top of this range, somewhere between £513m (based on the ‘one level’ improvement) and £770m.
What is also worth noting here is that these disamenity values do not necessarily relate to a WTP to reduce litter in places that respondents may choose to visit. The Defra and CEA studies refer to local neighbourhoods (although the exact delineation of this is unclear), while the PwC study from Australia appears to refer to all litter. It would be useful to try and understand, in any subsequent research, how such preferences may vary between considering ‘local litter’ alone, and ‘all litter’ across Scotland. Intuitively one might expect the greater value to be placed on ‘local impacts’, and then a smaller value for ‘everywhere else’, but there is currently a lack of evidence in this regard.
4.2 Valuing the Disamenity of Beach Litter A recent study for the Dutch Government198 sought evidence to support the Implementation of the European Marine Strategy Framework Directive. Specifically, the authors aimed to value the benefits that would arise if the objective, of a declining trend in the amount of litter at sea and along beaches, were achieved. The study reviewed the literature on litter and recreation value, finding 458 sources in 8 European languages, of which 44 provided original evidence of relevance.
195 Rdc environment (2011) Évaluation contingente du coût des désagréments visuels causés par les canettes dans les déchets sauvages en Wallonie, Raport Final, Etude pour l’Office Wallon des Dechets, Décembre 2011. 196 Converted using historical exchange rates available at http://www.x-rates.com/average/?from=GBP&to=EUR&amount=1&year=2011 (accessed April 2013). 197 UK Treasury (2013) GDP Deflators, Latest Figures, available at http://www.hm-treasury.gov.uk/data_gdp_fig.htm (accessed April 2013) 198 EFTEC, Enveco and InterSus (2012) Recreational Benefits of Reductions of Litter in the Marine Environment, Report for Rijkswaterstaat Waterdienst, 15 November 2012

The largest group of studies reviewed reported general information on attitudes, mostly confirming the intuitive view that visitors prefer clean beaches. In addition, of the few economic valuation studies found, the majority did not fully separate litter from other more general environmental quality issues, and the authors state that this:199
Seriously reduces their suitability for value transfer to evaluation of a policy specifically focused on litter reduction. It also means that there is no real scope for meta-analysis on the specific issue of litter.
4.2.1 University of Stirling Study The authors note that recent (unpublished) work by Dugald Tinch and Nick Hanley of the University of Stirling provides the most useful source of potential value transfer results.200 Data was collected in 2011 from individuals visiting beaches in the UK and Ireland in order to identify preferences for beach management and the 2015 Revised Bathing Water Directive (rBWD). The sample covered Northern England, Scotland, Northern Ireland and the Republic of Ireland – all areas with relatively clean water and beaches on the whole.
The methodology adopted was a choice experiment with a payment vehicle of the additional cost per trip of reaching a beach with a particular set of attributes. A non-tax payment vehicle was adopted due to the range of taxation regimes in the countries considered and the ability for it to be an entirely inclusive payment alternative. Within the Irish sample only active recreational users (those entering the water) were sampled, while the other country samples included non-active recreational users (those not entering the water). The attributes considered were:
• Management of beach litter and debris;
• Health risks of entering the water; and
• The benthic health of the coastal environment. Finally a sample of the general public in Scotland was taken via a postal survey. In this instance, water rates were used as a payment vehicle as this was applicable to non-use value and was relevant given the sample. The results are shown in Table 14.
199 EFTEC, Enveco and InterSus (2012) Recreational Benefits of Reductions of Litter in the Marine Environment, Report for Rijkswaterstaat Waterdienst, 15 November 2012 200 Contact was made with Dugald Tinch of the University of Stirling to see whether the relevant papers could be made available. While the study relating to the Republic of Ireland is available, the study relating to Scotland has not yet been signed off.

Exploring the Indirect Costs of Litter in Scotland 63 Table 14 Results of UK and Eire Choice Experiments
It should be noted that different payment vehicles have been used in different parts of the study. The ‘Scotland General Public’ study uses an increase in annual water rates, covering both use and non-use values associated with the marine environment. The three other on-site studies consider the additional cost of visiting a beach, focusing on the use value of recreation.
The authors note that results are relatively consistent across groups in terms of the relative scales of the parameter values, but that WTP values are relatively lower in the Irish Republic, which is not entirely surprising given the economic difficulties in the country at the time the survey was undertaken. It is further noted that Scottish on-site values are relatively higher than the Northern Irish values. However, it is pointed out that these Scottish values were for a specific subsample (those surfing or kite surfing on the day (in Ayr and Peterhead)), and when compared to the same subsample in the Northern Irish sample, results are similar.
The specific ‘debris’ scenarios are ‘prevention’, which would reduce the levels of sewage related waste and prevent flytipping, and ‘collection and prevention’, which also includes collection of general waste from the beach. It appears that Hanley and Tinch include littering within the term flytipping, as in a related study they also refer to ‘better policing of people dumping rubbish in or near the sea’, under the prevention scenario.201 The authors of the study for the Dutch
201 Hynes, S., Tinch, D. and Hanley, N. (2013) Valuing Improvements to Coastal Waters Using Choice Experiements: An Application to Revisions of the EU Bathing Waters Directive, Marine Policy, Vol.40, 137-144.

Government suggest that a conservative assumption would be that the additional WTP for collection relates to the WTP for moving from a somewhat littered situation to a litter free situation, focusing specifically on beach litter, and excluding WTP for reductions in sewage related debris (it is conservative because some of the WTP for debris prevention will also relate to reducing beach litter).
Accordingly, a conservative value per trip for Scotland would be to apply the Northern Ireland figure of £1.35 (given that the Scottish figure relates to surfers and kitesurfers). The Scottish figures (using the same conservative approach) are higher at £3.28 per trip, and could be applied to recreation trips where beach visitors enter the water.
In 2011 there were an estimated 47 million visits by adults (aged over 16) to the ‘Seaside’.202 Applying the £1.35 figure to these visits gives a total WTP for visitors of £63.45 million per annum.
In addition, applying the same conservative approach to the ‘Scottish General Public’ survey, which includes non-use values, leads to a figure of £12.39 per person per year. Applying this to the 4.2 million people aged 18 and over in Scotland in 2011,203 gives a WTP of £52.27m per annum. Scotland has an estimated 4174204 miles of mainland coastline. Although not all of this is beach, to give a sense of scale this equates to £12,522 per mile of coastline per annum.
However, it is clear that the ‘prevention’ scenario will, to an extent, include reduced levels of litter, not just a reduction in sewage related debris. Among the general public, ‘Prevention’, at £52.97 is clearly valued more highly than ‘Collection’, at £12.39. This may incorporate a view among the general public that people should not litter in the first place, and possibly that resources should be focused on prevention. By way of example, if only a quarter of the WTP for prevention related to litter, at £13.25, this would more than double the aggregate WTP among the Scottish general public to £108m per annum.
4.2.2 Eftec Study for Defra It is useful to compare these conservative figures to results derived from a study conducted in 2002 (also by Eftec) on behalf of Defra which looked into the willingness to pay to avoid the presence of litter on beaches in the UK.205 The 809 survey participants were sampled randomly and included users and non-users of beaches from both inland and coastal areas in order to make the survey representative.
The study put forward a number of scenarios to respondents in order to determine the level of their tolerance to certain variables. However, there were only two levels of litter presence; ‘some’
202 Scottish Natural Heritage (2011) Scottish Recreation Survey: Annual Summary Report 2011 203 General Register Office for Scotland (2012) Population Estimates by Urban Rural Classification, available at http://www.gro-scotland.gov.uk/statistics/theme/population/estimates/special-area/urban-rural.html (accessed March 2013) 204 The British Cartographic Society (2013) How long is the UK coastline, http://www.cartography.org.uk/default.asp?contentID=749, Date Accessed: 22 Feb. 2013 205 Economics for the Environment Consultancy Ltd (2002) Valuation of Benefits to England and Wales of a Revised
Bathing Water Quality Directive, Report for DEFRA, June 2002

Exploring the Indirect Costs of Litter in Scotland 65 and ‘none’. Using a baseline of litter being present (some) on the beach may have been emotive enough to increase the amount they are willing to pay as the alternative was the certainty that litter would be present. With this in mind the results showed that the respondents were willing to pay between £6 and £11 per household (in 2002 prices) to see litter free beaches. There are around 2.37 million households in Scotland as of 2011 so by taking the mean value at £8.50 per household there is a potential willingness to pay of £20.15 million.206 Uplifted to 2011/12 values this is £25 million, which is some way short of the more recent estimate of £52 million.207 Arguably this may be due to increased public awareness of the problems of marine litter, notably plastics, and of the heightened prominence of concerns specifically relating to the marine environment in recent years.
4.2.3 Application to Scotland Applying the £1.35 per visit to each of the 47 million annual beach visits gives a total WTP for clean beaches for visitors of £63.45 million per annum. Applying the figure of £12.39 per person per year to the 4.2 million people aged 18 and over in Scotland in 2011 gives a WTP of £52.27m per annum.
What is not clear, however, is the extent of the overlap between use values from the survey of beach users, and the combination of use and non-use values from the survey of the general public. It seems likely that for the general public some of the £12.39 per person per year, totalling £52.27m per annum, will be associated with use values. However, the assumed total use value alone, associated with the 47 million visits per annum, at £63.45 million, is greater than the reported combined use and non-use values.
Again, these figures are considered by the authors to be conservative (i.e. at the low end of the range), and more work is required to better understand the valuation of marginal reductions in levels of beach litter. However, it seems reasonably safe to suggest that the total disamenity value of beach litter in Scotland is between £50 million and £100 million per annum, and perhaps more when taking fuller account of the preferences of those who enter the water.
4.3 Disamenity of Cigarette Litter A Regulatory Impact Assessment (RIA) published by Defra in 2007 includes an estimate for the disamenity impact of cigarette litter.208 For the purposes of their assessment, the authors, who note the lack of appropriate data, make what they feel to be a number of very conservative assumptions, including:
• The disamenity cost imposed per viewing is 2p; and
• The site is viewed 30 times per day.
206 The General Register Office for Scotland (2013) The Number of Households in Scotland Continues to Rise, http://www.gro-scotland.gov.uk/press/news2012/number-of-households.html, Date Accessed: 22 Feb. 2013 207 Using UK Treasury GDP Deflators: Financial Year at Market Prices, available at http://www.hm-treasury.gov.uk/data_gdp_fig.htm (accessed March 2013) 208 DEFRA (2007) Final Regulatory Impact Assessment on Extension of Street Litter Control Notices, 1 June 2007

The authors state that:209
A valuation of 2p is unlikely to be an overestimate as research shows that clean streets are regarded as being in the top 5 most important issues to people’s quality of life. There is also a growing body of evidence that well-maintained environments free from litter and refuse can increase inward investment and attract workers and new residents to an area.
Unfortunately, the authors do not provide any supporting references for this assertion. They also state, with reference to the number of viewings, that:
It may be that the viewings of the litter may be made by different people or by the same person. We assume here that there is no diminishing marginal disutility per viewing such that each consecutive viewing to an individual causes the same level of disamenity.
In the absence of further research this is not a figure in which we would place much confidence. However, this may well be worthy of further study, especially given the emphasis in litter surveys on ‘counts’. We suspect that disamenity is more closely related to volume, or at least visibility, of litter rather than counts. Accordingly the disamenity impact of 5 littered used beverage containers (UBCs) is probably greater than 5 littered cigarette ends (in the same, or an equivalent, location).
Moreover, such disamenity will already be incorporated within the wider estimates of neighbourhood disamenity discussed in Section 4.1.5.
4.4 Greenhouse Gas Damage Costs When littered items are collected, it is likely that they will end up in the residual stream, rather than being recycled. While recycling typically leads to a greenhouse gas (GHG) saving, due primarily to the avoided requirement for virgin materials, residual routes typically lead to an increase in GHG emissions.
It is estimated that 17,787 tonnes of litter are dropped in Scotland every year.210 According to the Scottish Environment Protection Agency (SEPA), recycling rates for Scotland were reported as 40.1% in 2011.211 Importantly, the Scottish Government has also set targets for specific recycling rates; in 2013, 50%; 2020 60% and in 2025, 70%. This means that in 2011 7,133 tonnes of material had the potential to be recycled.
We assume the litter composition provided in Zero Waste Scotland’s Composition of Municipal Solid Waste report from 2010.212 This is the result of compositional analysis conducted during 2009 involving 32 local authorities in Scotland. The GHG impacts associated with recycling, landfill and incineration for of each of these materials is shown in Table 15. We then apply a damage
209 DEFRA (2007) Final Regulatory Impact Assessment on Extension of Street Litter Control Notices, 1 June 2007 210 Eunomia Research & Consulting (2013) Quantifying Direct Costs of Litter to Scottish Local Authorities and Other Duty Bodies, Draft Report to Zero Waste Scotland 211 Zero Waste Scotland (2010) The composition of municipal solid waste in Scotland , Report for Natural Scotland, April 2010 212 Zero Waste Scotland (2010) The composition of municipal solid waste in Scotland , Report for Natural Scotland, April 2010

Exploring the Indirect Costs of Litter in Scotland 67 cost to these emissions in line with Government guidance.213 This shows that the avoided damage cost for each tonne of material that is recycled, rather than being inappropriately discarded via flytipping or littering and then collected and sent for residual treatment, is £19.44. Applying this currently foregone benefit to the 17,787 tonnes of material from flytipping and littering each year, gives an overall figure of £345,745. However, at the 2011 recycling rates of 40.1%, the benefit foregone would be £138,643.
213 HM Treasury / DECC (2012) Valuation of Energy Use and Greenhouse Gas (GHG) Emissions, October 2012

Table 15 Greenhouse Gas Emissions and Associated Damage Costs – Switching from Residual to Recycling
Material Composition
GHG benefit from
recycling (tonne CO2
/ tonne material)*
Damage cost saving - GHGs from
recycling
Residual waste
impacts - 1 tonne to landfill**
Residual waste
impacts - 1 tonne to
incineration **
1 tonne Scottish residual
waste***
Per tonne of material
switched to recycling
Per tonne of litter
Newspapers & Magazines 7.6% -0.389 -£2.33 £36.18 -£0.63 £33.24 -£35.57 -£2.70
Other Paper 7.3% -0.389 -£2.33 £36.18 -£0.63 £33.24 -£35.57 -£2.60
Cardboard 8.2% -0.052 -£0.31 £34.06 -£0.71 £31.28 -£31.59 -£2.59
Plastic Film 5.9% £0.09 £117.46 £9.48 -£9.48 -£0.56
Plastic Bottles 7.7% -1.182 -£7.09 £0.09 £128.29 £10.35 -£17.44 -£1.34
Textiles & Footwear 1.9% -4.452 -£26.71 £20.01 £128.29 £28.67 -£55.38 -£1.05
Disposable Nappies 1.4% £24.99 £17.30 £24.37 -£24.37 -£0.34
Other Glass 0.3% -0.127 -£0.76 £0.09 £1.08 £0.17 -£0.93 -£0.00
Metal Cans 3.6% -4.3795 -£26.28 £0.09 -£6.94 -£0.47 -£25.80 -£0.93
Other Metal 2.6% -4.3795 -£26.28 £0.09 -£6.94 -£0.47 -£25.80 -£0.67
Food/kitchen Waste 12.8% -0.1 -£0.60 £21.21 £0.65 £19.57 -£20.17 -£2.58
Garden Waste 5.9% -0.03 -£0.18 £19.83 £0.13 £18.25 -£18.43 -£1.09
Other Organics 5.1% -0.1 -£0.60 £21.21 £0.65 £19.57 -£20.17 -£1.03
HHW 0.1% £0.09 £0.09 -£0.09 -£0.00
WEEE 3.6% £21.21 £21.21 -£21.21 -£0.76

Exploring the Indirect Costs of Litter in Scotland 69
Material Composition
GHG benefit from
recycling (tonne CO2
/ tonne material)*
Damage cost saving - GHGs from
recycling
Residual waste
impacts - 1 tonne to landfill**
Residual waste
impacts - 1 tonne to
incineration **
1 tonne Scottish residual
waste***
Per tonne of material
switched to recycling
Per tonne of litter
Fines 1.5% £15.93 £15.93 -£15.93 -£0.24
Other Plastic Packaging 3.6% -1.075 -£6.45 £0.09 £128.29 £10.35 -£16.80 -£0.60
Other Dense Plastic 1.1% -1.075 -£6.45 £0.09 £128.29 £10.35 -£16.80 -£0.18
Wood 0.6% £16.70 -£1.06 £15.28 -£15.28 -£0.09
Furniture 0.5% £0.00 £0.00 £0.00
Other Combustibles 10.0% £0.00 £0.00 £0.00
Packaging Glass 8.1% -0.127 -£0.76 £1.08 £0.09 -£0.85 -£0.07
Rubble (C&D waste) 0.2% £0.00 £0.00 £0.00
Other Non-Combustibles 0.6% £0.00 £0.00 £0.00
Total 100% -£19.44
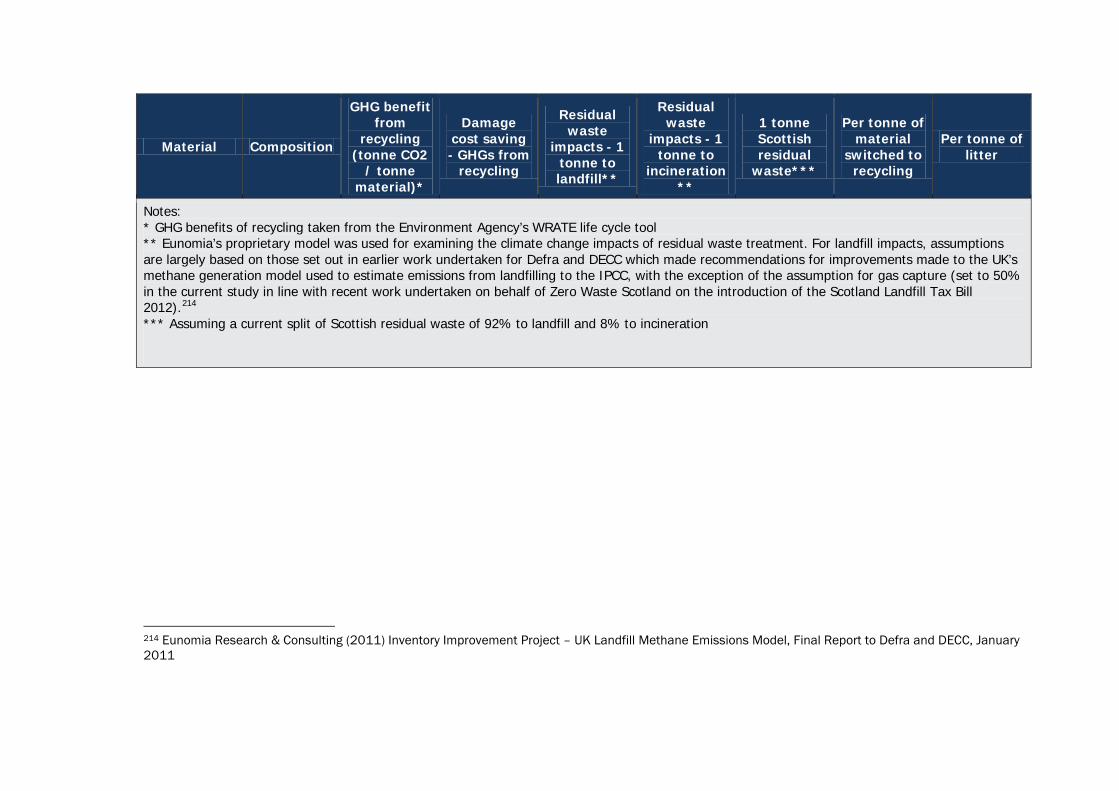
Material Composition
GHG benefit from
recycling (tonne CO2
/ tonne material)*
Damage cost saving - GHGs from
recycling
Residual waste
impacts - 1 tonne to landfill**
Residual waste
impacts - 1 tonne to
incineration **
1 tonne Scottish residual
waste***
Per tonne of material
switched to recycling
Per tonne of litter
Notes: * GHG benefits of recycling taken from the Environment Agency’s WRATE life cycle tool ** Eunomia’s proprietary model was used for examining the climate change impacts of residual waste treatment. For landfill impacts, assumptions are largely based on those set out in earlier work undertaken for Defra and DECC which made recommendations for improvements made to the UK’s methane generation model used to estimate emissions from landfilling to the IPCC, with the exception of the assumption for gas capture (set to 50% in the current study in line with recent work undertaken on behalf of Zero Waste Scotland on the introduction of the Scotland Landfill Tax Bill 2012).214 *** Assuming a current split of Scottish residual waste of 92% to landfill and 8% to incineration
214 Eunomia Research & Consulting (2011) Inventory Improvement Project – UK Landfill Methane Emissions Model, Final Report to Defra and DECC, January 2011

Exploring the Indirect Costs of Litter in Scotland 71
5.0 Indicative Scale of Impacts Based on the calculations undertaken in Sections 3.0 and 4.0, a number of estimates have been made, for specific impact areas, as to the likely scale of the indirect costs of litter. These figures are shown in Table 16, where the possible range is also discussed. The figures below represent the point estimates considered to be most likely.
Of the internalised costs it can be seen that the largest categories relate to, in descending order:
• Property values (As an illustration, if 1% of Scotland’s housing stock were devalued by 2.7% due to litter this would equate to £100 million loss)
• Mental health (Approximately £53 million);
• Crime (Up to £22.5 million);
• Road Traffic Accidents (Approximately £1 million);
• Wildfires (Approximately £1 million);
• Punctures (Approximately £1 million); and
• Rats (Approximately £1 million). However, with the exception of the impacts in respect of property values, mental health and crime, these internalised costs are considerably lower than the estimates of the key external costs, which are as follows:
• Local disamenity (£73-770 million); and
• Beach litter disamenity (£50 -100 million). There are a number of categories where it was not possible to identify any costs. For the following we believe that the lack of evidence accurately reflects the fact that costs are negligible.
• Drug-related litter;
• Litter-related injuries;
• Injuries to Duty Body Staff; and
• Litter-related flooding. For tourism we expect that there is no overall loss of income to Scotland as a whole as a result of litter. We therefore do not recommend that this should be a priority for further study. By contrast, for individual locations, the presence of litter may have a strong impact upon whether tourists decide to remain in that location, or move, and spend money, elsewhere. However, our perception is that this argument is already accepted by local authorities, and that further research in this area would not provide as great a motivation to undertake action as might research in other areas such as crime and mental health.

Table 16 Estimates of Annual Indirect Costs of Litter by Category
Impact Area Headline
Figures (£ per annum)
Best Estimate (£ per annum) Comments
Internalised Costs
Crime (Overall Costs)
Between £225,000 and £22.5 million
Given the studies reviewed we feel it likely that the contribution of litter to these costs lies in the upper half of this range.
Based on evidence associated with litter as a causal factor in crime
Of which Police Time
Between £42,500 and £4.25 million
We suspect the cost is likely to be closer to the higher end of this range
Based on evidence associated with litter as a causal factor in crime
Mental Wellbeing (Overall Costs)
Between £10.7m (0.1% of total costs) and £1.07bn (10% of total costs) per annum
While it is very difficult to be precise we suspect the true figure might be closer towards 0.5% of total costs, i.e. £53 million
Based on assumptions linking local environmental quality to mental wellbeing
Of which Anti-depressants
Between £31,400 (0.1% of total costs) and £3.14m (10% of total costs) per annum
We suspect a figure of £1.57 million, based on a 5% contribution, would not be unreasonable
The proportion of the costs of anti-depressants that could reasonably be considered to be attributable to a littered environment
Road Traffic Accident Costs
Between £1.03 million and £4.8 million
We suggest that a figure towards the lower end of this range may be a reasonable approximation of costs
Based on assumptions due to litter as a cause of accidents
Punctures (Car and Bike)
Between £46,500 and £4.65 million
Evidence is sparse but we would imagine the real cost may be closer to £1 million per annum
Due to litter (typically glass)
Rail Network Between no impact at all and £54,100
We feel the true costs are likely to be towards the top end of this range
Based on evidence of damage to rail infrastructure, and associated delays, due rats whose existence can be attributed to edible litter
Vermin – Damage from Rats
Between £9,950 and £1.99 million
We feel that a mid-point estimate of £1 million would not be unreasonable
Based on evidence relating to the damage caused by rats, and the proportion of the population whose existence can be attributed to edible litter

Exploring the Indirect Costs of Litter in Scotland 73
Impact Area Headline
Figures (£ per annum)
Best Estimate (£ per annum) Comments
Vermin – Treatment Costs
of Rats
Between £2,900 and £340,000
We suggest that £250,000 might be an appropriate estimate
Based on evidence relating to the expenditure on tackling rats, and the proportion of the population whose existence can be attributed to edible litter
Vermin – Damage from Pigeons
Between £1,680 and £168,000
We feel that the real figure is likely to be towards the top end of this range.
Based on evidence relating to the damage caused by pigeons, and the proportion of the population whose existence can be attributed to edible litter
Indirect Costs to Business Above £500,000
We calculate that McDonald’s alone spends between £475,600 and £622,400 per annum
This is based solely on the expenditure of McDonald’s restaurants on anti-litter activities
Wildfires
Between £66,000 (0.1% of total cost) and £6.6 million (10% of total cost)
Approximately £1 million Due to limited data it is not possible to place a high level of confidence in this figure
Loss of Material Resource
Approximately £510,000
We have calculated a figure of £510,283 but there are uncertainties over composition
Figure will vary based on material prices and recycling rate
Wildlife and Livestock
Approximately £315,000
Based on circa £100,000 for wildlife rescue across Scotland and £215,000 for impacts on livestock (Shetland only)
Limited data available for impacts on livestock elsewhere in Scotland
Voluntary Clean-ups Over £2.3 million
Rather than a cost per se, this can be seen as a lower bound estimate of the utility derived by participants. Could reasonably be considered as a ‘constrained willingness to pay’
Based on valuation of volunteer time involved in the National Spring Clean
House Prices £100 million (illustrative only)
If 1% of Scotland’s housing stock were devalued by 2.7% due to litter
External Costs

Impact Area Headline
Figures (£ per annum)
Best Estimate (£ per annum) Comments
Local Disamenity £73 -770 million
Towards the top end of the range, perhaps close to the £513 million estimate based on the valuation of a ‘one level’ improvement in the amount of local litter.
Intuitively this would be higher than the valuation of the disamenity of beach litter alone. In the absence of further research it is not possible to reduce this range. We would suggest, however, that the true value is likely to be closer to the higher end of the range.
Beach Litter Disamenity £50-100 million
Given the available evidence we feel that the true value lies towards the top end of this range
Encompassing both use and non-use values. Based on conservative estimates, so may be higher. Further research to provide greater understanding on the relative weight of use and non-use values would be helpful
Greenhouse Gas Damage Costs
£139,000 This figure assumes a 40.1% recycling rate. As the recycling rate rises, the benefit foregone will similarly increase
GHG benefits foregone from material that is currently littered and sent for disposal, rather than being appropriately discarded and sent for recycling

Exploring the Indirect Costs of Litter in Scotland 75
6.0 Priority Areas for Future Work Given the findings identified above, we recommend that the following areas merit further consideration.
6.1 Better Understanding of Significant Costs There are some categories where the indicative scale of the costs, and indeed the range in the costs identified, suggests that an improved understanding is required.
6.1.1 Disamenity Values The evidence reviewed indicates that external costs, namely the disamenity values, are the most significant cost categories. To an extent, these should also be the most straightforward categories for further investigation, as the methodological approaches required are well developed, with significant expertise available in Scottish Universities.
Obtaining a more accurate overall understanding of the disamenity value of litter will allow for better comparison of the relative merits of undertaking further actions to tackle litter. For example, a better understanding of specific types of litter, or locations for litter, that caused greatest unhappiness for the Scottish population would help target interventions to where they were most wanted.
Well-designed studies focused specifically on the Scottish population may also be less susceptible to the claim, sometimes levelled against stated preference studies, that the values derived are somehow not ‘real’.
By contrast, seeking to understand the impacts of litter on mental health, or indeed crime, with any great degree of certainty is likely to be a far more demanding task, and it would not be expected that results would be forthcoming so swiftly.
6.1.2 Mental Health Impacts In the longer term developing a better understanding of the links between litter and mental health and wellbeing will be important, not least because the extent, and cost, of mental health problems is expected, in the absence of wide-scale interventions, to continue to increase in the coming years.
The bulk of the impacts of litter on mental health and wellbeing appear to be negative, relating possibly to a sense of a lack of control over one’s local environment. By contrast, one particular area of interest is the potential for voluntary litter-picking, undertaken either as a solitary activity, or as part of a group, to have a beneficial effect on mental wellbeing. There are indications that this may indeed the case, and one can readily perceive the possible reasons why this could be. Intuitively participant satisfaction could result from one, or a combination of the following:
• Sense of purpose;
• Mindful engagement in an outdoor activity;
• Knowledge of the environmental benefits;
• Feeling of contribution to the local community; and/or
• Enjoyment of the ‘teamwork’ aspect - if carrying out the activity in a group context.
6.1.3 Understanding Motivators of Pro-social Behaviours Of particular interest would be an understanding of the interactions between:
A: The existing extent of littering; and

B: The likelihood of members of the public to voluntarily pick litter.
One could envisage a situation, on a beach for example, where there is almost no litter. The small number of items of litter that are present might be reasonably likely to be picked up by people walking on the beach. However, in a more heavily-littered context, those same people might feel ‘overwhelmed’ by the sheer volume of litter, and feel they could make little difference, and that any efforts would be almost pointless.
Therefore, it would be interesting to consider how future trends in litter prevention might motivate, or discourage such pro-social behaviours. If an effective series of measures that reduce levels of litter were put in place, this might encourage others to pick up litter not only due to the relative absence of litter, but also due to a sense of ‘being part of something bigger’, and working towards a goal shared by wider society. This putative ‘virtuous cycle’ could, through instilling a sense of ‘connecting’ with the local environment and community, and ‘giving’, should act to enhance mental wellbeing.215
By contrast, those who are currently motivated to voluntarily pick up litter may become disheartened if there is no long-term, preventative approach shown on litter prevention.
6.1.4 Crime This is an area where we expect there to be widespread public understanding of the arguably intuitive link between levels of litter and criminal activity. Moreover, given the potential scale of the cost of crime that could be attributed to litter, and the general public willingness for crime to be tackled, this would seem to offer good prospects for subsequent application of well-designed research.
6.2 Informing Policy Options While an understanding of the overall impacts is important, it would also be desirable to more clearly identify the costs associated with specific types of litter that may be amenable to specific policy interventions.
6.2.1 Single-use Carrier Bags One example of this would be single-use carrier bags. The Scottish Government has recently announced its intention to introduce a levy on single-use carrier bags. Further research on the impacts of this may help guide any future considerations of similar measures.
6.2.2 Used Beverage Containers Of potentially greater relevance would be an understanding of the contribution to disamenity arising from used beverage containers (UBCs), and possibly other items such as crisp packets. We suspect, especially in the case of UBCs, due to their volume, that their contribution to disamenity is greater than is indicated by the frequency with which their presence is indicated in counts alone.
Scotland has an excellent example of a privately run deposit-refund system (DRS), operated by A.G. Barr. Understanding the avoided disamenity impacts arising from DRS schemes would lead to a more informed discussion of the relative scale of associated costs and benefits. Zero Waste Scotland is currently running a number of DRS and reverse vending pilots to further explore the viability of such schemes for single use containers, including their potential to reduce litter.
215 New Economics Foundation (2011) Five Ways to Wellbeing: New Applications, New Ways of Thinking, 1 January 2011

Exploring the Indirect Costs of Litter in Scotland 77

Exploring the Indirect Costs of Litter in Scotland 78