exploring the impact of foreign direct investment
TRANSCRIPT

49
International Journal of Social Inquiry Volume 6 Number 1 2013 pp. 49-72
Exploring the Impact of Foreign Direct Investment Accumulation on National Innovation Capability and the Mediating Role of Human Development Level
Ufuk TÜREN1, Hakan DİLEK2, Yunus GÖKMEN3
ABSTRACT
In this study, we scrutinize the effect of inward Foreign Direct Investment (FDI) and Human Development Level (HDL) on National Innovation Capability (NIC). Data from 123 countries are employed for multivariate statistical analyses. We find that both FDI accumulation and HDL significantly and positively influence NIC, and HDL has a mediating effect between FDI accumulation and NIC. Mediating role of HDL vanishes when we divide the data into four HDL groups which are suggested by UNDP. In very high human developed group FDI accumulation and HDL both have a positive and significant effect on NIC. In high human developed group only HDL has a positive and significant effect on NIC while NIC is insensitive to FDI accumulation. In medium human developed and low human developed groups we see that NIC is insensitive to both FDI accumulation and HDL.
Keywords: Foreign Direct Investment (FDI), Human Development Level (HDL), National Innovation Capability (NIC), Multivariate Statistical Analysis.
1 Ph.D., Turkish Military Academy, Department of Industrial Engineering, Kara Harp Okulu
Dekanlığı Endüstri ve Sistem Mühendisliği Bölümü –ANKARA [email protected] 2 Ph.D., Turkish Military Academy, Department of Business Administration, Kara Harp Okulu
Dekanlığı Endüstri ve Sistem Mühendisliği Bölümü –ANKARA [email protected] 3 Ph.D., Turkish Military Academy, Department of Industrial Engineering, Kara Harp Okulu
Dekanlığı Endüstri ve Sistem Mühendisliği Bölümü –ANKARA [email protected]

50
1. INTRODUCTION
Many economists believe that freely traveling capital without borders has several benefits both for investors and host countries. It not only may minimize the investors’ risks by letting them to spread their investment portfolio but also maximize return on investment by means of globally integrated capital markets which mediate better practices of business and public administration, accounting standards and legal structures. Besides, the globally mobilized capital canalizes the governments of the host nations to pursue more democratic and freedom chasing politics.
Cross-country capital flow has three different main types such as Foreign Direct Investment (FDI), Foreign Portfolio Investment and Loans. Among these three, FDI, which provides a long term relationship, interest and control, attracts great interest (Razin and Sadka, 2007: xi). From the host nation side point of view, FDI is recognized as a compelling argument of investment bringing with it sources, technology, access to markets, training and human capital enhancement. The nature of FDI is assumed to be less volatile and consequently less disruptive than short term capital flows (Stiglitz, 2000: 1076). FDI, having spillover benefits for the host country, is often considered as one of the important ways of technology transfer (Globerman, 1979; Mansfield and Romeo, 1980; Wang and Blomström, 1992; Kokko, 1994; Kokko and Blomström, 1995; Razin and Sadka, 2007: 124; Quazi, 2007). FDI is also considered as the cheapest way of technology transfer from the perspective of many scholars (Blomström and Kokko, 1997).
It is generally theorized that the know-how, technology and innovation capability transfer by the way of FDI realizes directly through interactions between a foreign company and its foreign subsidiaries or indirectly by the way of spillovers from foreign subsidiaries to domestic companies. This spillover may follow a vertical (inter-industry) or horizontal (intra-industry) patterns (Bucara, Rojeca and Starea, 2009).
Adversely, dependency school scholars, such as Lenin, Karl Marks, Paul Baran, Andre Gunder Frank and Samir Amin regard FDI as extensions of the developed countries and as harmful to economic growth of developing nation in the long run (Chilcote, 2002). Large global companies’ penetration into host nations’ economies may allow them to control national resources on behalf of developed nations that might otherwise have been used for development of host nation (Cardoso, 1973; Evans, 1979:16-17; Cardoso and Dornbusch, 1989; Fan, 2002). For example, Hilferding (1986: 418-419) tells

51
about Scandinavian Nations’ being exploited by English, French and German Industries and consequently their industrial development being retarded as a result of foreign capital accumulation and decision authority handover to foreigners. Weeks (1981) briefly explains the difference between dependency and liberal school lenses. The dispute on beneficiary and harmful effects of capital movement still goes on.
2. THEORETICAL FRAMEWORK AND HYPOTHESES
Most studies in the literature focus on the sample of firms or sectors in different countries and few works use macro-economic variables in order to investigate the effects of inward FDI. But we have not encountered any research handling the association among national inward FDI accumulation, Human Development Level (HDL) and National Innovation Capability (NIC). So, we have decided to investigate the associations among these variables.
2.1. Foreign Direct Investment and Technology Transfer
In the literature, the effect of FDI is traced by many studies conducted in different countries. Most of the studies report some other factors facilitating the association between FDI and technology transfer in the host country. These factors are host country characteristics such as education level of labor force, domestic R&D expenditures, quality of infrastructure and sector characteristics such as industry concentration (Kinoshita, 2000; Kathuria, 2002; Wooster and Diebel, 2010).
Some scholars give the responsibility of roughness in technology transfer processes to attributes of the firms or sectors in the host country. The theory behind these studies is technology transfer through FDI not only requires the source of higher technology but also receiving capacity of the receiver side namely (lack of) absorptive capability of host nations. For example; Yokota and Tomohara (2010) report that technology transfer through FDI is related to host countries’ skilled work force capital (in their study including analyses based on the data from eight Asian developing countries; Myanmar, Cambodia, Indonesia, China, Thailand, Malaysia, Republic of Korea, Singapore). They claim that nations having highly skilled labor force may get the spillover effect in high-tech industries while others may get the same effect only in low-tech industries. Similarly, a significant effect of technological distance between investing nation and host nation, and internalization capacity of host nation in the processes of technology transfer by the way of FDI are reported by Monastiriotis and Alegria (2011). Sinani

52
and Klaus (2004) investigate the relationship between foreign presence and productivity through host nation’s human capital and emphasize human capital’s catalyst effect to this association. These studied factors are found to be crucial for establishing a proper interface between emitter and receiver parties.
Zhang et al. (2010) emphasize not only the role of the diversity of FDI country origins in an industry but also the impact of learning capacity of domestic firms on the productivity levels of domestic firms as a spillover effect. They also report that the size of the domestic firms and the intermediateness of technology gap between foreign and domestic firms have a mediating effect on this association.
There are also some works dealing with the impact of FDI on productivity and the growth of a host country based on macro level data. Especially, Xu (2000) provides a study comparing FDI impacts caused by US multinational enterprises (MNEs) on a host country’s national productivity level between developed and developing countries. After performing a longitudinal analysis using the data collected from 40 countries from 1966 to 1994 in which US MNEs have been operating, she finds that US MNEs contributes to the productivity growth in developed countries but not in low developed countries. She claims that a country needs to reach a minimum human capital threshold level in order to be a receiver of US MNEs originated technology transfer; however, most low developed countries cannot fulfill this threshold requirement.
In addition, some of micro empirical studies claim that FDIs provide limited or no technology transfer. For example, Damijan et al., (2003) analyze the association between inward FDI and technology transfer based on productivity raise using firm level data from eight transition countries. They find that technology transfer is realized through FDI only to direct subordinate firms and no trace of positive intra-industry spillovers for domestic firms. Their findings back up the theory of the source of higher technology may be selective and conservative in emitting technology. Vahter and Masso (2007) also address in their study based on sectoral data from Estonia that there is no spillover effect caused by FDI. Le and Pomfret (2011) reports that FDI originated technology transfer is positive only through vertical interaction, presence of foreign actors does not provide horizontal technology spillover, in contrast it impairs the productivity of local firms through harsh competition.
53
2.2. National Innovation Capability
It is widely considered that a nation’s competitive power in global development challenge is particularly affected by NIC. Innovation has been seen as an important and critical factor for relative success of nations in terms of economics, intellectuality, and sociality (Furman, Porter and Stern, 2002; Verwaayen, 2011). In order to measure NIC we decide to employ Global Innovation Index Scores (GIIS) which has been prepared by Institut Européen d'administration des Affaires (INSEAD) since 2009 with the principle objective of determining metrics and measures for innovation capability of nations.
The Global Innovation Index has two dimensions called sub-indices, the Innovation Input Sub-Index and the Innovation Output Sub-Index, each relies on pillars. Five pillars which are carrying Innovation Input Sub-Index are associated with the national economy: (1) Institutions, (2) Human capital and research, (3) Infrastructure, (4) Market sophistication, and (5) Business sophistication. Those five pillars are important for establishing a prerequisite environment for NIC. Two output pillars display actual evidence of national innovation outputs: (6) Scientific outputs and (7) Creative outputs. Each pillar is divided into sub-pillars and each sub-pillar is composed of individual indicators. Detailed information can be found in INSEAD (2011).
2.3. Human Development Level
Human development means an environment in which humans can develop their capabilities to participate in production. This environment lets them to create lives in accord with their desires and interest. In this paradigm, human beings are considered as the most important and valuable assets of nations. Thus, empowering people in order to reach much more alternatives, to make decisions with freewill, to access knowledge, better nutrition and health services are important aspects but not enough. Human development paradigm also requires providing people with a secure livelihoods, physical security against crime and violence, leisure hours to refresh, political and cultural freedoms. The aim of human development concept is to provide people with a proper environment making them to enjoy long, healthy and satisfactory lives (UNDP, 2011).
Since nobody can predict that national income is fairly divided and distributed to population or investments are optimized on behalf of living and future population in a country, the rise or fall in national incomes is not a robust indicator of human development level. In order to explore and track
54
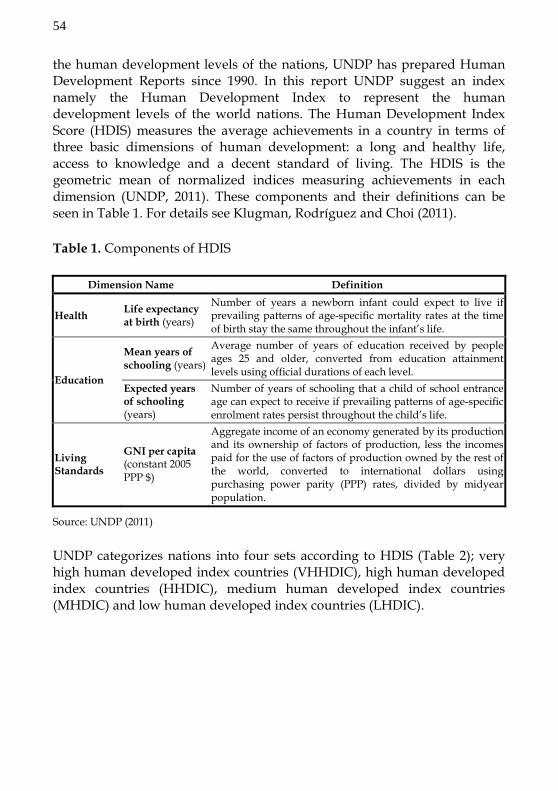
the human development levels of the nations, UNDP has prepared Human Development Reports since 1990. In this report UNDP suggest an index namely the Human Development Index to represent the human development levels of the world nations. The Human Development Index Score (HDIS) measures the average achievements in a country in terms of three basic dimensions of human development: a long and healthy life, access to knowledge and a decent standard of living. The HDIS is the geometric mean of normalized indices measuring achievements in each dimension (UNDP, 2011). These components and their definitions can be seen in Table 1. For details see Klugman, Rodríguez and Choi (2011).
Table 1. Components of HDIS
Dimension Name Definition
Health Life expectancy at birth (years)
Number of years a newborn infant could expect to live if prevailing patterns of age-specific mortality rates at the time of birth stay the same throughout the infant’s life.
Education
Mean years of schooling (years)
Average number of years of education received by people ages 25 and older, converted from education attainment levels using official durations of each level.
Expected years of schooling (years)
Number of years of schooling that a child of school entrance age can expect to receive if prevailing patterns of age-specific enrolment rates persist throughout the child’s life.
Living Standards
GNI per capita (constant 2005 PPP $)
Aggregate income of an economy generated by its production and its ownership of factors of production, less the incomes paid for the use of factors of production owned by the rest of the world, converted to international dollars using purchasing power parity (PPP) rates, divided by midyear population.
Source: UNDP (2011)
UNDP categorizes nations into four sets according to HDIS (Table 2); very high human developed index countries (VHHDIC), high human developed index countries (HHDIC), medium human developed index countries (MHDIC) and low human developed index countries (LHDIC).

55
Table 2. Four Sets of Countries Grouped by HDI (2010)
VHHDIC HHDIC MHDIC LHDIC 1 Norway Chile China Kenya 2 Australia Lithuania El Salvador Bangladesh 3 New Zealand Argentina Sri Lanka Ghana 4 United States Kuwait Thailand Cameroon 5 Ireland Latvia Bolivia Yemen 6 The Netherlands Croatia Paraguay Benin 7 Canada Romania The Philippines Madagascar 8 Germany Uruguay Botswana Nigeria 9 Sweden Panama Moldova Uganda
10 Japan Saudi Arabia Mongolia Senegal 11 South Korea Mexico Egypt Tanzania 12 Switzerland Malaysia Guyana Côte-d’Ivoire 13 France Bulgaria Namibia Zambia 14 Israel Trinidad and Tobago Honduras Malawi 15 Finland Serbia Indonesia Rwanda 16 Iceland Costa Rica South Africa Sudan 17 Belgium Peru Syrian Arab Republic Ethiopia 18 Denmark Albania Tajikistan Mali 19 Spain Russian Federation Vietnam Burkina Faso 20 Hong Kong Kazakhstan Morocco Burundi 21 Greece Azerbaijan Nicaragua Niger 22 Italy Bosnia and Herzegovina Guatemala Zimbabwe 23 Luxembourg Ukraine India 24 Austria Iran Swaziland 25 United Kingdom Macedonia Pakistan 26 Singapore Mauritius 27 Czech Republic Brazil 28 Slovenia Georgia 29 Slovakia Venezuela 30 United Arab Emirates Armenia 31 Estonia Ecuador 32 Cyprus Colombia 33 Brunei-Darussalam Jamaica 34 Hungary Tunisia 35 Qatar Jordan 36 Bahrain Turkey 37 Poland Algeria 38 Portugal
Source: UNDP (2011)
56
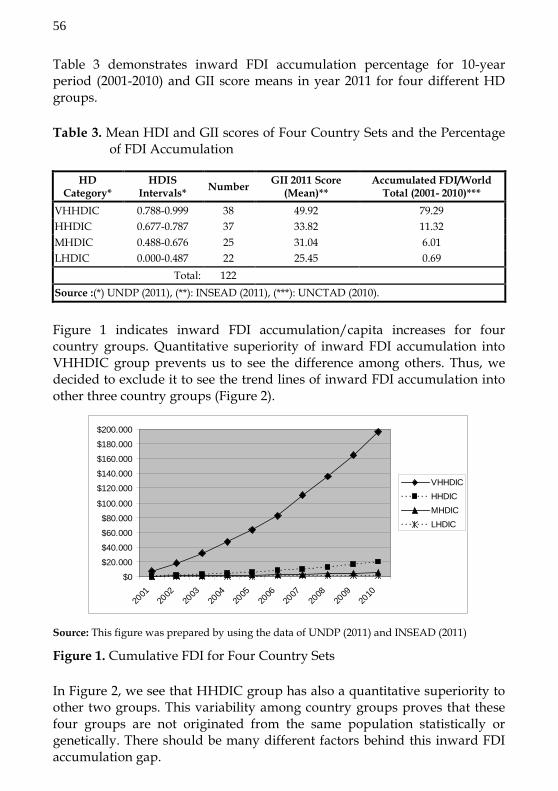
Table 3 demonstrates inward FDI accumulation percentage for 10-year period (2001-2010) and GII score means in year 2011 for four different HD groups.
Table 3. Mean HDI and GII scores of Four Country Sets and the Percentage of FDI Accumulation
HD Category*
HDIS Intervals* Number GII 2011 Score
(Mean)** Accumulated FDI/World
Total (2001- 2010)*** VHHDIC 0.788-0.999 38 49.92 79.29 HHDIC 0.677-0.787 37 33.82 11.32 MHDIC 0.488-0.676 25 31.04 6.01 LHDIC 0.000-0.487 22 25.45 0.69
Total: 122 Source :(*) UNDP (2011), (**): INSEAD (2011), (***): UNCTAD (2010).
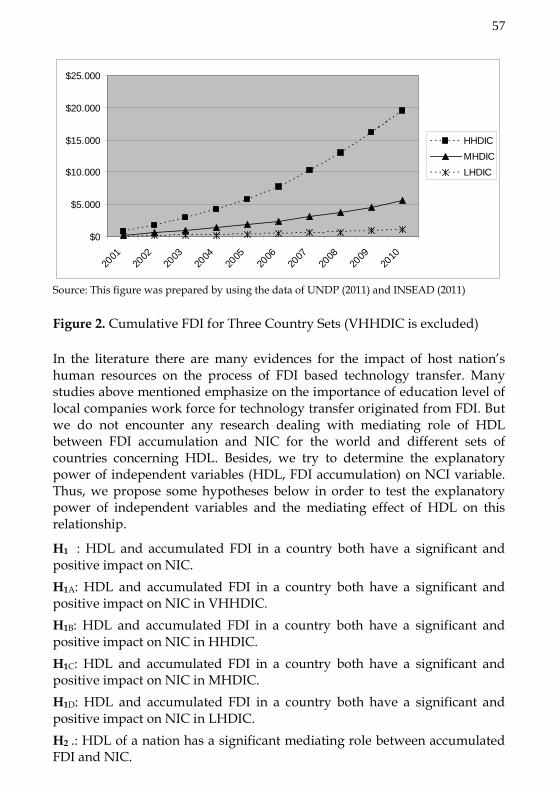
Figure 1 indicates inward FDI accumulation/capita increases for four country groups. Quantitative superiority of inward FDI accumulation into VHHDIC group prevents us to see the difference among others. Thus, we decided to exclude it to see the trend lines of inward FDI accumulation into other three country groups (Figure 2).
Source: This figure was prepared by using the data of UNDP (2011) and INSEAD (2011)
Figure 1. Cumulative FDI for Four Country Sets
In Figure 2, we see that HHDIC group has also a quantitative superiority to other two groups. This variability among country groups proves that these four groups are not originated from the same population statistically or genetically. There should be many different factors behind this inward FDI accumulation gap.
$0
$20.000
$40.000
$60.000
$80.000
$100.000
$120.000
$140.000
$160.000
$180.000
$200.000
2001
2002
2003
2004
2005
2006
2007
2008
2009
2010
VHHDICHHDICMHDICLHDIC
57
Source: This figure was prepared by using the data of UNDP (2011) and INSEAD (2011)
Figure 2. Cumulative FDI for Three Country Sets (VHHDIC is excluded)
In the literature there are many evidences for the impact of host nation’s human resources on the process of FDI based technology transfer. Many studies above mentioned emphasize on the importance of education level of local companies work force for technology transfer originated from FDI. But we do not encounter any research dealing with mediating role of HDL between FDI accumulation and NIC for the world and different sets of countries concerning HDL. Besides, we try to determine the explanatory power of independent variables (HDL, FDI accumulation) on NCI variable. Thus, we propose some hypotheses below in order to test the explanatory power of independent variables and the mediating effect of HDL on this relationship.
H1 : HDL and accumulated FDI in a country both have a significant and positive impact on NIC. H1A: HDL and accumulated FDI in a country both have a significant and positive impact on NIC in VHHDIC. H1B: HDL and accumulated FDI in a country both have a significant and positive impact on NIC in HHDIC. H1C: HDL and accumulated FDI in a country both have a significant and positive impact on NIC in MHDIC. H1D: HDL and accumulated FDI in a country both have a significant and positive impact on NIC in LHDIC. H2 .: HDL of a nation has a significant mediating role between accumulated FDI and NIC.
$0
$5.000
$10.000
$15.000
$20.000
$25.000
2001
2002
2003
2004
2005
2006
2007
2008
2009
2010
HHDICMHDICLHDIC
58
H2A : HDL of a nation has a significant mediating role between accumulated FDI and NIC in VHHDIC. H2B : HDL of a nation has a significant mediating role between accumulated FDI and NIC in HHDIC. H2C : HDL of a nation has a significant mediating role between accumulated FDI and NIC in MHDIC. H2D : HDL of a nation has a significant mediating role between accumulated FDI and NIC in LHDIC.
3. METHODOLOGY
Although many factors influencing the association between FDI and technology transfer process have been mentioned in the literature, the importance of the technology gap between investing firm and the host counterpart, and the quality of the employees in the host companies or sectors for technology transfer process is widely reported by many scholars.
In this study, we use HDIS to measure the preparedness level of host nation for FDI oriented technology transfer. For measuring the true results of overall technology transfer process, we use GIIS 2011 in order to see NIC. We know that panel data analysis should be preferred to capture the time based interactions among variables. Since GIIS is calculated and published since 2009, data is not adequate for longitudinal analysis. So, we decided to conduct a cross-country/cross sectional analysis. We use FDI accumulation for ten years (2001-2010) in terms of dollars per capita to measure the foreign presence in host countries since we believe that FDI has a cumulative effect on the other variables.
In this study, we employ analyses to explore causality among variables by cross-country dimension then scrutinize whether there is a mediating effect of HDL. In order to deepen our insight upon the issue, we divide our database into four sets according to Human Development Index (HDI) classification: VHHDIC, HHDIC, MHDIC and LHDIC. We practice the same procedure for four data sets.
3.1. Data Collection, Variables and Model
The data of NIC are collected from INSEAD published annual GIIS ranking including 2009, 2010 and 2011 in The Global Innovation Index 2011 Report. We gather the data of GIIS from this report by accessing its formal website (http://www.globalinnovationindex.org/gii/main/fullreport/ index.html).
59
The data about HDL (2010) are collected from Human Development Reports 2011 of UNDP by accessing its formal website (http://hdr.undp.org/en/ reports/global/hdr2011). For FDI data we employ UNCTAD database collecting and publishing FDI data belonging to most of the countries yearly. The data of countries’ FDI comprising of 2001-2010 term are gathered from UNCTAD formal website (http://unctadstat.unctad.org/ UnctadStatMetadata/Documentation/UNCTADstatContent.html. Then we divided FDI accumulation value by nation’s capita which are gathered from 2010 CIA World Factbook (http://cia-world-fact-book.findthedata.org/ d/d/2010).
We conduct a multiple regression analysis for cross-section data related to 2011. Therefore, GIIS data belonging to 2011 are collected. But we devise that the effects of HDIS and FDI over GIIS cannot occur simultaneously, so that, in order to choose the appropriate lag length, we use Akaike Information Criterion (AIC) and Schwarz Information Criterion (SIC) that are widely used to determine proper lag length (Gujarati, 2004: 537, 690). The test results are indicated in Table 4.
Tablo 4. Determining Lag Lenght
Lag Length (k) 1 2 3 AIC 3.653745 3.701673 3.734107 SIC 3.746168 3.864277 3.967647
The appropriate lag length is chosen with respect to the minimum AIC and SIC values (Gujarati, 2004: 537). Thus, according to results in Table 4, we choose one year lag as appropriate lag length and we use the data of HDIS belonging to 2010 and FDI accumulation per capita data of 2001-2010 term for regression model along with GIIS 2011 data.
While GIIS 2011 comprises of 123 countries, HDIS 2010 data includes 169 countries and FDI data belonging to 2001-2010 term comprises of 224 countries. Some countries, especially from medium and low human developed lists, are excluded from the analysis due to lack of data. Thus, we incorporate 122 countries’ data that are set of intersection of three variables data in this analysis. Since the variables in the regression model have different measurement units (e.g. HDIS (0-100 point), FDI accumulation per capita ($/capita)), we suggest a multiple logarithmic regression model for cross-section data as indicated in Equation 1.

60
iiii uFDIHDISGIIS +++= lnlnln 210 βββ (1)
ln GIISi: The natural logarithm of 2011 GII Score of ith country
ln HDISi: The natural logarithm of 2010 HDI Score of ith country
ln FDIi: The natural logarithm of FDI accumulation per capita including 2001-2010 term for ith country
ui: is the error (residual) term in the regression model.
3.2. Analyses and Findings
The multiple regression models using cross sectional data have some basic assumptions such as normality, homoscedasticity and multi-collinearity. If any of these assumptions is violated, then the prediction of parameters, confidence intervals, and economic apprehensions yielded by a regression model may be inefficient or seriously biased or misleading. We conduct some tests for basic regression assumptions in following steps.
First of all, we conduct One-Sample Kolmogorov-Smirnov Normality Test to variables of general and HDL categories’ models. Table 5 shows that all variables are distributed normally.
Table 5. One-Sample Kolmogorov-Smirnov Test
Variable HDI Categories N
Normal Parameters Kolmogorov-Smirnov Z
Asymp, Sig, (2-tailed) Mean Std. Deviation
lnGIIS VHHDIC 38 3.898 0.167 0.777 0.582* HHDIC 37 3.541 0.1392 0.587 0.881* MHDIC 25 3.456 0.1509 0.698 0.715*
LHHDIC 22 3.270 0.1087 0.614 0.846* General 122 3.563 0.286 0.957 0.318*
lnHDIS VHHDIC 38 -0.156 0.044 0.664 0.771* HHDIC 37 0.5449 0.0190 0.782 0.574* MHDIC 25 0.4699 0.0305 0.580 0.890*
LHHDIC 22 0.321 0.061 1.054 0 .217* General 122 -0.431 0.319 0.833 0.293*
lnFDI VHHDIC 38 11.677 1.004 0.707 0.700* HHDIC 37 12.005 1.3836 0.536 0.936* MHDIC 25 11.254 1.744 0.648 0.795*
LHHDIC 22 9.709 1.441 0.475 0.978* General 122 9.425 2.051 0.493 0.968*
(*): The test values are significant at α=0.05 level.
61
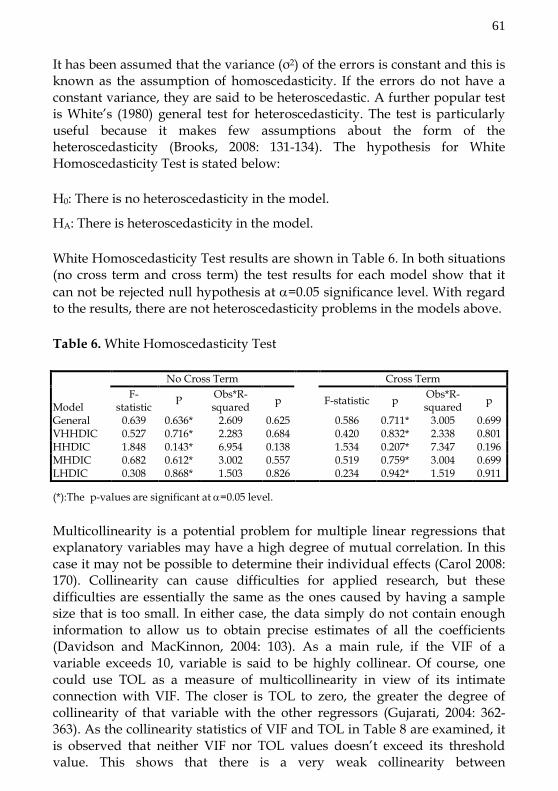
It has been assumed that the variance (σ2) of the errors is constant and this is known as the assumption of homoscedasticity. If the errors do not have a constant variance, they are said to be heteroscedastic. A further popular test is White’s (1980) general test for heteroscedasticity. The test is particularly useful because it makes few assumptions about the form of the heteroscedasticity (Brooks, 2008: 131-134). The hypothesis for White Homoscedasticity Test is stated below:
H0: There is no heteroscedasticity in the model.
HA: There is heteroscedasticity in the model.
White Homoscedasticity Test results are shown in Table 6. In both situations (no cross term and cross term) the test results for each model show that it can not be rejected null hypothesis at α=0.05 significance level. With regard to the results, there are not heteroscedasticity problems in the models above.
Table 6. White Homoscedasticity Test
No Cross Term Cross Term
Model F-
statistic P Obs*R-squared p F-statistic p Obs*R-
squared p
General 0.639 0.636* 2.609 0.625 0.586 0.711* 3.005 0.699 VHHDIC 0.527 0.716* 2.283 0.684 0.420 0.832* 2.338 0.801 HHDIC 1.848 0.143* 6.954 0.138 1.534 0.207* 7.347 0.196 MHDIC 0.682 0.612* 3.002 0.557 0.519 0.759* 3.004 0.699 LHDIC 0.308 0.868* 1.503 0.826 0.234 0.942* 1.519 0.911
(*):The p-values are significant at α=0.05 level.
Multicollinearity is a potential problem for multiple linear regressions that explanatory variables may have a high degree of mutual correlation. In this case it may not be possible to determine their individual effects (Carol 2008: 170). Collinearity can cause difficulties for applied research, but these difficulties are essentially the same as the ones caused by having a sample size that is too small. In either case, the data simply do not contain enough information to allow us to obtain precise estimates of all the coefficients (Davidson and MacKinnon, 2004: 103). As a main rule, if the VIF of a variable exceeds 10, variable is said to be highly collinear. Of course, one could use TOL as a measure of multicollinearity in view of its intimate connection with VIF. The closer is TOL to zero, the greater the degree of collinearity of that variable with the other regressors (Gujarati, 2004: 362-363). As the collinearity statistics of VIF and TOL in Table 8 are examined, it is observed that neither VIF nor TOL values doesn’t exceed its threshold value. This shows that there is a very weak collinearity between

62
independent variables which is in the acceptable limits. After fulfilling the assumptions we employ multiple regression analysis, the regression model’s summary is given in Table 7.
Table 7. Model Summary
Model R R Square Adjusted R Square
Std. Error of the
Estimate
Change Statistics R
Square Change
F Change df1 df2 Sig. F Change
General 0.838 0.702 0.697 0.157 0.702 140.013 2 119 0.000**
HD
I C
ateg
orie
s VHHDIC 0.679 0.460 0.430 0.126 0.460 14.931 2 35 0.000** HHDIC 0.566 0.320 0.280 0.122 0.320 8.017 2 34 0.001** MHDIC 0.341 0.117 0.036 0.153 0.117 1.452 2 22 0.256 LHHDIC 0.406 0.165 0.077 0.108 0.165 1.876 2 19 0.181
Dependent Variable: lnGIIS (*)The regression coefficients are significant at α=0.05 level. (**)The regression coefficients are significant at α=0.01 level.
General, VHHDIC and HHDIC’s regression models are significant at α=0.01 level, whereas the others are not significant. The results support the presumption that HDIS and FDI accumulation have an impact on GIIS in VHHDIC and HHDIC. On the other side, the adjusted R2 values of four HDL categories’ model diminish pursuant to HDIS level. While HDIS level decreases, the adjusted R2 values diminish. It emphasizes that HDIS and FDI variables causes to more impact on GIIS variable at high HDIS countries. For examining the effects of HDIS and FDI variables over GIIS comprehensively, the coefficients of regression models are indicated in Table 8. The coefficients in General and VHHDIC regression models’ coefficients are significant but some parameters in the others regression models are not significant at α=0.05 level.
In General regression model, one percent change in HDIS induces 0.215 percent change in GIIS and one percent change in FDI induces 0.088 percent change in GII in the same direction. Similarly, in VHHDIC regression model, one percent change in HDIS induces 2.018 percent change in GIIS and one percent change in FDI induces 0.054 percent change in GII in the same direction.

63
Table 8. Coefficients
Model Variable Unstandardized
Coefficients Standardized Coefficients t Sig.
Collinearity Statistics
B Std.Error Beta Tolerance VIF General (Constant) 2.828 0.143 19.746 0.000**
lnHDIS 0.215 0.078 0.240 2.774 0.006** 0.334 2,998 lnFDI 0.088 0.012 0.630 7.268 0.000** 0.334 2.998
VHHDIC (Constant) 3.587 0.271 13.232 0.000** lnHDIS 2.018 0.477 0.536 4.228 0.000** 0.960 1.042 lnFDI 0.054 0.021 0.323 2.547 0.015* 0.960 1.042
HHDIC (Constant) 3.359 0.400 8.405 0.000** lnHDIS 1.146 0.518 0.360 2.212 0.034* 0.756 1.322 lnFDI 0.055 0.030 0.294 1.810 0.079 0.756 1.322
MHDIC (Constant) 3.523 0.403 8.737 0.000** lnHDIS 0.529 0.392 0.283 1.349 0.191 0.910 1.099 lnFDI 0.021 0.035 0.124 .589 0.562 0.910 1.099
LHDIC (Constant) 3.445 0.193 17.808 0.000** lnHDIS 0.170 0.088 0.413 1.935 0.068 0.963 1.039 lnFDI -0.007 0.024 -0.062 -.290 0.775 0.963 1.039
Dependent Variable: lnGIIS (*) The regression coefficients are significant at α=0.05 level. (**)The regression coefficients are significant at α=0.01 level.
3.3. The Mediating Effect of Human Development Level
One of the widespread methods for testing mediation effect is Sobel Test (Sobel, 1982). In addition to Sobel test we employ two other tests namely Aroian (1944/1947) test and Goodman (1960) test which is popularized by Baron & Kenny (1986). The results of three mediation effect tests are shown in Table 9.
Table 9. The Mediation of Effect of HDIS
Statistic Model General VHHDIC HHDIC MHDIC LHHDIC
R 0.8377 0.6785 0.5661 0.3414 0.4061 R Square 0.7018 0.4604 0.3205 0.1166 0.1649 Adjusted R Square 0.6968 0.4296 0.2805 0.0363 0.0770
Sobel Test Test statistic 2.7301 1.1753 1.8474 1.0052 0.8002 SE 0.0100 0.0151 0.0178 0.0142 0.0110 p-value 0.0063* 0.2399 0.0647 0.3148 0.4236
Aroian Test Test statistic 2.7246 1.1461 1.7928 0.9011 0.7241 SE 0.0100 0.0155 0.0184 0.0159 0.0122 p-value 0.0064* 0.2518 0.0730 0.3675 0.4690
Goodman Test Test statistic 2.7356 1.2068 1.9073 1.1564 0.9069 SE 0.0100 0.0147 0.0173 0.0124 0.0097 p-value 0.0062* 0.2275 0.0565 0.2475 0.3645
(*): The p values are significant at α=0.05 level.
64
The hypothesis for mediation effect of HDIS is indicated below:
H0: HDIS variable doesn’t have mediation effect.
HA: HDIS variable has mediation effect.
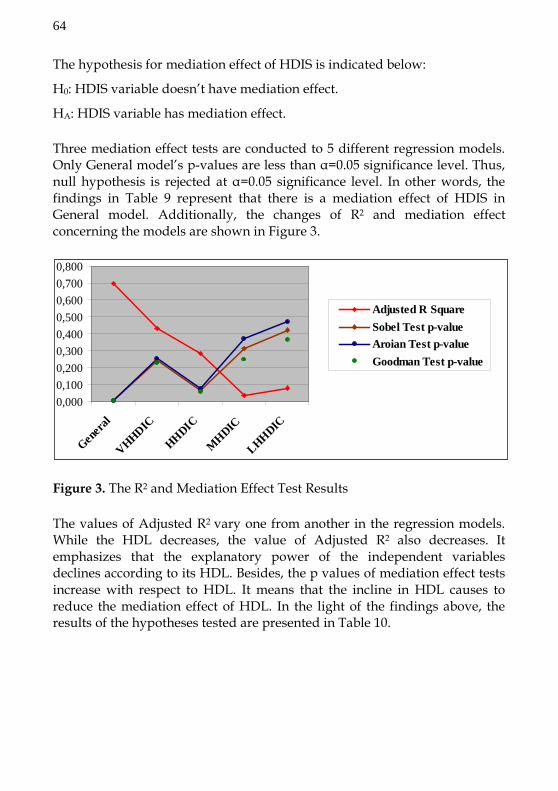
Three mediation effect tests are conducted to 5 different regression models. Only General model’s p-values are less than α=0.05 significance level. Thus, null hypothesis is rejected at α=0.05 significance level. In other words, the findings in Table 9 represent that there is a mediation effect of HDIS in General model. Additionally, the changes of R2 and mediation effect concerning the models are shown in Figure 3.
Figure 3. The R2 and Mediation Effect Test Results
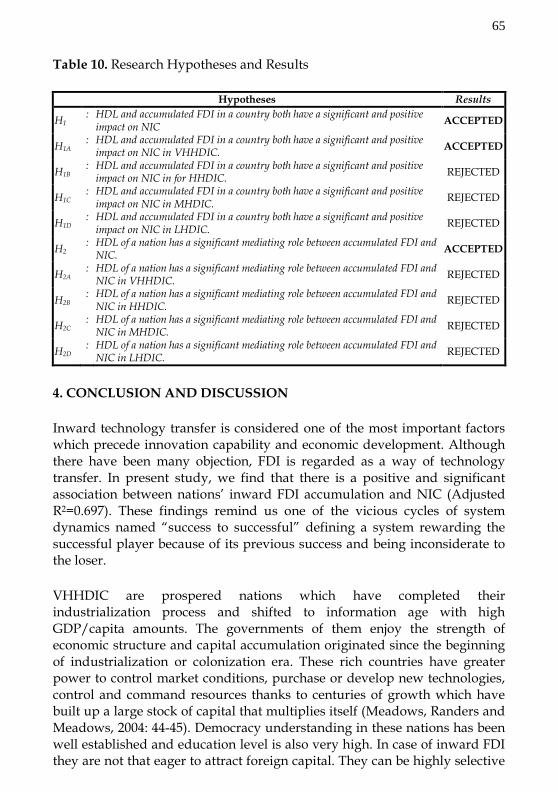
The values of Adjusted R2 vary one from another in the regression models. While the HDL decreases, the value of Adjusted R2 also decreases. It emphasizes that the explanatory power of the independent variables declines according to its HDL. Besides, the p values of mediation effect tests increase with respect to HDL. It means that the incline in HDL causes to reduce the mediation effect of HDL. In the light of the findings above, the results of the hypotheses tested are presented in Table 10.
0,0000,1000,2000,3000,4000,5000,6000,7000,800
Genera
l
VHHDIC
HHDIC
MHDIC
LHHDIC
Adjusted R SquareSobel Test p-valueAroian Test p-valueGoodman Test p-value
65
Table 10. Research Hypotheses and Results
Hypotheses Results
H1 : HDL and accumulated FDI in a country both have a significant and positive
impact on NIC ACCEPTED
H1A : HDL and accumulated FDI in a country both have a significant and positive impact on NIC in VHHDIC. ACCEPTED
H1B : HDL and accumulated FDI in a country both have a significant and positive impact on NIC in for HHDIC. REJECTED
H1C : HDL and accumulated FDI in a country both have a significant and positive impact on NIC in MHDIC. REJECTED
H1D : HDL and accumulated FDI in a country both have a significant and positive impact on NIC in LHDIC. REJECTED
H2 : HDL of a nation has a significant mediating role between accumulated FDI and
NIC. ACCEPTED
H2A : HDL of a nation has a significant mediating role between accumulated FDI and NIC in VHHDIC. REJECTED
H2B : HDL of a nation has a significant mediating role between accumulated FDI and NIC in HHDIC. REJECTED
H2C : HDL of a nation has a significant mediating role between accumulated FDI and NIC in MHDIC. REJECTED
H2D : HDL of a nation has a significant mediating role between accumulated FDI and NIC in LHDIC. REJECTED
4. CONCLUSION AND DISCUSSION
Inward technology transfer is considered one of the most important factors which precede innovation capability and economic development. Although there have been many objection, FDI is regarded as a way of technology transfer. In present study, we find that there is a positive and significant association between nations’ inward FDI accumulation and NIC (Adjusted R2=0.697). These findings remind us one of the vicious cycles of system dynamics named “success to successful” defining a system rewarding the successful player because of its previous success and being inconsiderate to the loser.
VHHDIC are prospered nations which have completed their industrialization process and shifted to information age with high GDP/capita amounts. The governments of them enjoy the strength of economic structure and capital accumulation originated since the beginning of industrialization or colonization era. These rich countries have greater power to control market conditions, purchase or develop new technologies, control and command resources thanks to centuries of growth which have built up a large stock of capital that multiplies itself (Meadows, Randers and Meadows, 2004: 44-45). Democracy understanding in these nations has been well established and education level is also very high. In case of inward FDI they are not that eager to attract foreign capital. They can be highly selective

66
in assessing the FDI applicants. Those nations do not have to put legal regulations favoring foreign capital against local ones. They are more powerful in decisions of choosing which industry to get FDI and where to locate, and defining conditions of the investment (esp. setting the partnership percentages to participate decision processes), determining the level of technology to be transferred, the amount of training or education to be given, and choosing material or service providers, contractors and dealers (local vs. international).
The citizens of the countries in this set have high average income and social security opportunity. The governments don’t strive to attract foreign capital to establish basic infrastructures. Under these circumstances FDI, which enters a country of this set, cannot behave like what ever it likes. Foreign investors have to obey the frame drawn by the host. They also enjoy local high quality human capital to employ and reliable firms to cooperate with. As a matter of fact FDI is not the mere instrument to increase innovation power in this set of countries. Thus, we can say that technology transfer and improvement in a very high human developed nation’s innovation capability can be realized with contributions from FDI. It can be said that the dynamic relationship between these two behaves like a reinforcing loop.
In the second set named HHDIC, we see the intensity of transition economies (n=14/37). It also includes some socialist nations in South America and richer Arab States in MENA (Middle East and North Africa) having decent amount of oil income. The association between NIC and FDI-HDL is lower than very high human developed countries level (Adjusted R2=0.430). After collapse of Eastern Block, freed nations have started to modify their world view and try to adapt liberal market economic order of the West from centrally planned previous one. They have decent level of education average as a heritage from communism. They have been lack of sufficient capital, industry and infrastructure since the politics of iron curtain design of economic interdependency among different national regions.
On the other hand nations in South America had long been scene for the sphere of influence conflict between liberal and communist block. They have limited capital stock and industrialization with social and educational problems decorated with illegal organizations, weak state structures, civil wars, etc. After the collapse of East Block they have been obliged to turn their face to West. Now they had to play a game which was not accustomed to them. Under these conditions they have to make up shortages in different areas and accordingly restock the lack of capital which is inevitable for any

67
type of investment. They have strived to attract FDI under any circumstances and accumulated considerable amount of foreign capital especially by the way of FDI. They make legal and political regulations in order to make domestic environment economic freedom level higher. As global capital has been playing very freely and has not been very generous in technology transfer business, similarly, host nations are not that considered about technology transfer which can be realized through FDI. With a myopic view they have thought about much more imminent perils of governing. Although this set of countries accumulate high amounts of foreign capital, because of above mentioned reasons they have not been able to realize expected level of technology transfer and consequently they cannot improve innovation power of themselves.
Oil rich Arab states are mostly ruled by dynasties such as kingdoms or principality. People do not have a clear understanding of democracy and freedom to choose. Rulers have good relation with Western World. But they are not that considered about empowering people, instead they practice suppression upon people. They have capital surplus, but have difficulty in project development and realization because of knowledge lack.
Lack of opportunity equity is another big problem in this set of countries. Many of the need of citizens are provided by the state budget but education is not a big deal for making money. Once a FDI comes to a country of this set, the lack of the social interface between foreign and local firms can mostly curbs the interaction. The data coming from the cosmopolite set shows that NIC is sensitive to HDL but not sensitive to FDI accumulation. Since one of the independent variables does not have association with dependent variable, mediating effect of HDL can not be traced between FDI accumulation and NIC here.
Thirdly, MHDIC are generally mentioned as third world countries. These countries can not achieve fundamental requirements of modern life of human beings such as democracy and basic rights. Especially, during last two centuries most of MHDIC have been controlled by colonial (imperialist) powers in all aspects. Colonial (imperialist) powers exploited entire sources of these countries. They suppressed public’s demand and they implement rigid and tyrant administration. As stated previous sections, HDIS has three dimensions; health, education and living standards. Nations that were ruled by imperialist powers couldn’t care these dimensions. Since economy, which is considered one of the components of living standards dimension of HDIS, was controlled by an imperialist power, they couldn’t improve their living standards that are basic requirements of modern life. Besides, they couldn’t
68
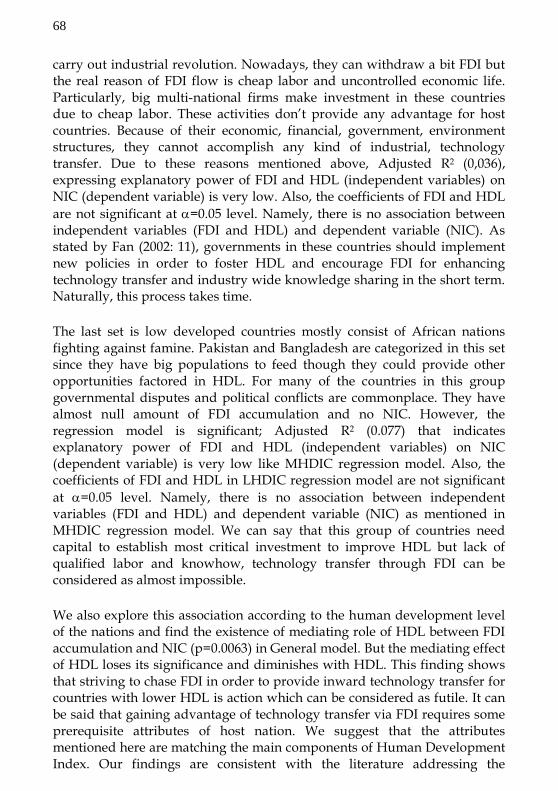
carry out industrial revolution. Nowadays, they can withdraw a bit FDI but the real reason of FDI flow is cheap labor and uncontrolled economic life. Particularly, big multi-national firms make investment in these countries due to cheap labor. These activities don’t provide any advantage for host countries. Because of their economic, financial, government, environment structures, they cannot accomplish any kind of industrial, technology transfer. Due to these reasons mentioned above, Adjusted R2 (0,036), expressing explanatory power of FDI and HDL (independent variables) on NIC (dependent variable) is very low. Also, the coefficients of FDI and HDL are not significant at α=0.05 level. Namely, there is no association between independent variables (FDI and HDL) and dependent variable (NIC). As stated by Fan (2002: 11), governments in these countries should implement new policies in order to foster HDL and encourage FDI for enhancing technology transfer and industry wide knowledge sharing in the short term. Naturally, this process takes time.
The last set is low developed countries mostly consist of African nations fighting against famine. Pakistan and Bangladesh are categorized in this set since they have big populations to feed though they could provide other opportunities factored in HDL. For many of the countries in this group governmental disputes and political conflicts are commonplace. They have almost null amount of FDI accumulation and no NIC. However, the regression model is significant; Adjusted R2 (0.077) that indicates explanatory power of FDI and HDL (independent variables) on NIC (dependent variable) is very low like MHDIC regression model. Also, the coefficients of FDI and HDL in LHDIC regression model are not significant at α=0.05 level. Namely, there is no association between independent variables (FDI and HDL) and dependent variable (NIC) as mentioned in MHDIC regression model. We can say that this group of countries need capital to establish most critical investment to improve HDL but lack of qualified labor and knowhow, technology transfer through FDI can be considered as almost impossible.
We also explore this association according to the human development level of the nations and find the existence of mediating role of HDL between FDI accumulation and NIC (p=0.0063) in General model. But the mediating effect of HDL loses its significance and diminishes with HDL. This finding shows that striving to chase FDI in order to provide inward technology transfer for countries with lower HDL is action which can be considered as futile. It can be said that gaining advantage of technology transfer via FDI requires some prerequisite attributes of host nation. We suggest that the attributes mentioned here are matching the main components of Human Development Index. Our findings are consistent with the literature addressing the

69
importance of human capital mediating effect in the association between FDI and technology transfer (e.g. Xu, 2000; Sinani and Klaus, 2004; Zhang et al., 2010; Yokota and Tomohara, 2010; Monastiriotis and Alegria, 2011). Our work provides a global insight for determining the association among these variables.
At the end we can say that FDI accumulation and HDL are important predecessors of NIC, and HDL has a mediating role between FDI and NIC if we employ the worldwide data. But we divide our data into four groups according to HDL and we see that NIC is sensitive to FDI and HDL for VHHDIC, but in the lower human developed groups NIC is not sensitive to FDI and HDL. Thus, the theory promoting FDI as the cheapest and easiest way of technology transfer fails here at least for most of the nations.
In present study as an original contribution we use NIC as a dependent variable and track the deviation in association between country sets which are established in terms of HDL. This research has also some limitations to be mentioned here; it contains cross-sectional analysis valid at a particular point in time and conclusions are probabilistic. So, those limitations should be considered before making generalizations.
REFERENCES
Aroian, L. A., 1944/1947. The Probability Functions of the Product of Two Normally Distributed Variables. Annals of Mathematical Statistics, 18: 265-271.
Baron, R. M., and Kenny, D. A., 1986. The Moderator-Mediator Variable Distinction in Social Psychological Research: Conceptual, Strategic, and Statistical Considerations. Journal of Personality and Social Psychology, 51: 1173-1182.
Blomström, M. and Kokko, A., 1997. How Foreign Investment Affects Countries’ Policy, Research Working Paper No. 1745, World Bank.
Brooks, C., 2008, Introductory Econometrics for Finance, Second Edition, Cambridge University Press, New York.
Bucara, M., Rojeca, M. and Starea, M., 2009. Backward FDI Linkages as a Channel for Transferring Technology and Building Innovation Capability: The Case of Slovenia, European Journal of Development Research, 21(1): 137–153.
Cardoso, E. A. and Dornbusch, R., 1989. Foreign Private Capital Flows in: H. B. Chenery, T. N. Srinivasan eds., Handbook of Development Economics, Vol. 2, Elsevier, Amsterdam.
Cardoso, F. H., 1973. Associated-dependent Development,” in Alfred Stepan, ed., Authoritarian Brazil: Origins, Policies, and Future, Yale University Press, New Haven.

70
Carol, A., 2008. Market Risk Analysis Volume I Quantitative Methods in Finance, John Wiley & Sons Ltd., England
Chilcote, R.H., 2002. Globalization or Imperializm? Latin American Perspectives, 29(6): 80-84.
CIA, 2010. 2010 CIA World Factbook, http://cia-world-fact-book.findthedata.org/d/d/2010, Access date: 06.03.2012.
Davidson, R. and MacKinnon, J.G. 2004. Econometric Theory and Methods, Oxford University Press Inc., England.
Damijan, J.P., Knell, M., Majcen, B. and Rojec, M., 2003. Technology Transfer Through FDI in Top-10 Transition Countries: How Important Are Direct Effects, Horizontal and Vertical Spillovers?, Working Paper No. 17, 2003, Institute for Economic Research, Ljubljana,
Evans, P., 1979. Dependent Development: The Alliance of Multinational: State, and Local Capital in Brazil, Princeton University Press, New Jersey.
Fan, E. X., 2002. Technological Spillovers from Foreign Direct Investment - A survey, ERD Working Paper No. 33, Asian Development Bank, (http://www.adb.org/ Documents/ERD/Working_Papers/wp033.pdf, Access date: 27.12.2011).
Furman, J.L., Porter, M.E. and Stern, S., 2002. The Determinants of National Innovative Capacity, Research Policy, 31: 899–933.
Globerman, S., 1979. Foreign Direct Investment and Spillover Efficiency Benefits in Canadian Manufacturing Industries, the Canadian Journal of Economics, 12(1): 42-56
Goodman, L. A., 1960. On the Exact Variance of Products. Journal of the American Statistical Association, 55: 708-713.
Gujarati, D.N., 2004. Basic Econometrics, 4th Ed., Mcgraw-Hill. USA.
Hilferding, R., 1986. Finance Capital: A Study of The Latest Phase of Capitalist Development (Economic History), Routledge, USA. (Originally Published with The Name of “Das Finanzkapital” in 1910).
INSEAD (Institut Européen d'administration des Affaires), 2011. The Global Innovation Index 2011 Report, http://www.globalinnovationindex.org/gii/main/fullreport/ index. html, Access date: 09.02.2012.
Kathuria, V., 2002. Liberalization, FDI, and Productivity Spillovers—an Analysis of Indian Manufacturing Firms, Oxford Economic Papers, 54: 688–718.
Kinoshita, Y., 2000. R&D and Technology Spillovers via FDI: Innovation and Absorptive Capacity, William Davidson Institute Working Paper No.349.
Klugman, J.; Rodríguez F., and Choi, H.-J., 2011. The HDI 2010: New Controversies, Old Critiques, United Nations Development Programme, Human Development Reports, Research Paper 2011/01, April 2011, (http://hdr.undp.org/en/reports/ global/hdr2011/papers/HDRP_2011_01.pdf, Access date: 29.09.2012)

71
Kokko, A., 1994. Technology, Market Characteristics and Spillover, Journal of Development Economics, 43: 279-93.
Kokko, A., and M. Blomström, 1995. Policies to Encourage Inflows of Technology through Foreign Multinationals, World Development, 23(3):495-68.
Le, Q.H. and Pomfret, R., 2011. Technology Spillovers from Foreign Direct Investment in Vietnam: Horizontal or Vertical Spillovers? Journal of the Asia Pacific Economy, 16 (2): 183-201
Mansfield, E. and Romeo, A., 1980. Technology Transfer to Overseas Subsidiaries by US-Based Firms, Quarterly Journal of Economics, 95: 737-750.
Meadows, D., Randers, J. and Meadows, Dennis, 2004. Limits to Growth: The 30-Year Update, Chelsea Green Publishing, USA.
Monastiriotis, V. and Alegria, R., 2011. Origin of FDI and Intra-Industry Domestic Spillovers: The Case of Greek and European FDI in Bulgaria, Review of Development Economics, 15(2): 2326-339.
Quazi, R. 2007. Economic Freedom and Foreign Direct Investment in East Asia, Journal of the Asia Pacific Economy, 12(3): 329-344.
Razin, A. and Sadka, E., 2007. Foreign Direct Investment: Analysis of Aggregate Flows, Princeton University Press, USA.
Sinani, E. and Klaus M., 2004. Spillovers of Technology Transfer from FDI: The Case of Estonia, Journal of Comparative Economics, 32: 445–66.
Sobel, M. E., (1982). Asymptotic confidence intervals for indirect effects in structural equation models. In S. Leinhardt (Ed.), Sociological Methodology 1982 (290-312). Washington, DC: American Sociological Association.
Stiglitz, J. J., 2000. Capital Market Liberalization, Economic Growth, and Instability, World Development, 28(6): 1075-1086
UNCTAD (United Nations Conference on Trade and Development), 2010. Foreign Direct Investment Data, (http://unctadstat.unctad.org/ReportFolders/reportFolders.aspx, Access date: 11.12.2011).
UNDP, 2011. Human Development Report 2011-Sustainability and Equity: A Better Future for All, (http://hdr.undp.org/en/media/HDR_2011_EN_Complete.pdf, Access date: 25.02.2012).
Vahter, P. and Masso, J. 2007. Home versus Host Country Effects of FDI : Searching for New Evidence Productivity Spillovers, Applied Economics Quarterly, 53(2): 165-196.
Verwaayen, B. 2011. Foreword: The World Needs Open Innovation, The Global Innovation Index 2011 Accelerating Growth and Development, Ed.: Soumitra Dutta, INSEAD.
Wang, J.Y. and Blomström, M., 1992. Foreign Investment and Technology Transfer: A Simple Model, European Economic Review, 36(1): 137-155.

72
Weeks, J., 1981. The Differences between Materialist Theory and Dependency Theory and Why They Matter, Latin American Perspectives, 8; 118-123.
White, H., 1980. A Heteroskedasticity-Consistent Covariance Matrix Estimator and a Direct Test for Heteroskedasticity, Econometrica, 48: 817-38.
Wooster, R.B. and Diebel, D.S., 2010. Productivity Spillovers from Foreign Direct Investment in Developing Countries: A Meta-Regression Analysis, Review of Development Economics, 14(1): 640-655.
Xu, B., 2000. Multinational Enterprises, Technology Diffusion, and Host Country Productivity Growth, Journal of Development Economics, 62: 477-493.
Yokota, K. and Tomohara, A., 2010. Modeling FDI-Induced Technology Spillovers, International Trade Journal, 24(1): 5-34.
Zhang, Y., Li, H., Li, Y. and Zhou, L., 2010. FDI Spillovers in an Emerging Market: The Role of Foreign Firms’ Country Origin Diversity and Domestic Firms’ Absorptive Capacity, Strategic Management Journal, 31: 969–989.