exploring the composition and characteristics of …
TRANSCRIPT

1
EXPLORING THE COMPOSITION AND CHARACTERISTICS OF YOUNG
PEOPLE NOT IN EMPLOYMENT, EDUCATION, OR TRAINING IN THE
EASTERN CAPE LABOUR MARKET1
Kambale Kavese & Andiswa Mbali
ECSECC Report - January 2021
1. Introduction
This document provides a nuanced appraisal of the young people not in employment, education, or training
(NEET) in the Eastern Cape. It uses Statistics South Africa’s Quarterly Labour Force Survey (QLFS) data to
describe the composition and characteristics of the Eastern Cape youth NEET aged 15 to 34. The report
explores the diversity of youth NEET, covering both youth demographics and youth labour market dynamics.
This study goes beyond the homogeneity approach of analysing youth NEET by further disaggregating youth
NEET in various sub-categories with the aim to unpack the heterogeneous nature of the NEET youth in the
province. It provides a synthetised overview of NEETs profiles for the Eastern Cape. Youth NEET, as a socio-
economic indicator, is an essential tool that policymaker can use to better understand the extent of the
multifaceted vulnerability of youth residing the province, in terms of their labour market participation and risk
of social exclusion2.
1.1 Background and problem statement
Evidence from the ILO (2020) and Eurofound (2016) suggests that remaining within NEET group for an
extended period has negative socio-economic outcomes, like: precarious employment prospects,
discouragement, social and economic exclusion, increased risk of crime potential, moral behaviour
deteriorating, physical and mental health, substance abuse, etc. Youth NEET has adverse effects on fiscus. It
erodes tax base and lowers both productivity and economic growth through economically inactive people.
Youth NEETs are regarded as main determinants of poverty and income inequality.
Hence, the question3 of how to effectively integrate or re-integrate young people into the labour market,
education, or training institutions should be prominent in the provincial labour policy agendas and not take
the back seat in the youth program of action. The first step towards addressing this question requires a
thorough investigation of the composition and characteristics of Youth NEET subcategories, and an in-depth
diagnostic of challenges and needs facing each subgroup. Such tailored approach is paramount for effective
youth policy design, appropriate interventions, and successful reintegration of youth NEET.
Moreover, the NEET concept as alluded to in the Eastern Cape Provincial Development Plan lacks
heterogeneity in the sense that it does not disaggregate various demographic and labour NEET sub-groups.
This has important consequences for policy responses. Since each population sub-category has different
characteristics and needs, government targets to reduce the overall NEET rate, and subsequent interventions
may fall short unless some attempt is made to understand the subgroups covered by the concept and to meet
their specific needs (Yates, S., & Payne, M., 2006).
1 Acknowledgment: The authors acknowledge inputs from staffs from the International Labour Organisation, Statistics South Africa’s Quarterly Labour Force Survey, National Department of Labour and Nelson Mandela University. 2 International Labor Office. (ILO, 2015). Global employment trends for youth 2015: Scaling up investments in decent jobs for youth. International Labor Organization, Geneva. 3 European Foundation for the Improvement of Living and Working Conditions. Eurofound (2016), Exploring the diversity of NEETs, Publications Office of the European Union, Luxembourg.

2
1.2 Aim of the study
The aim of this document is four-fold. Firstly, it is to provide a more detailed understanding of the composition
and characteristics of young people not in employment, education, or training (NEET). Secondly, to explore
the diversity of youth NEET and provide a synthesised overview of NEETs profiles for the Eastern Cape. Thirdly,
the report seeks to illustrate the heterogeneity of the youth NEET sub-group so that their different needs and
traits can be taken into consideration in designing labour and youth policies. Fourthly, the study provides
policy responses towards NEET, and appropriate interventions that can be implemented to better unlock
youth potential and reintegrate them into labour and education institutions.
1.3 This study seeks to respond to the following policy questions
• What are the numbers of (youth and adult) NEET in South Africa and in the Eastern Cape? Who are these
youth NEETs? Or what are the profiles and specific features of NEETs in the province?
• Why many young people in the Eastern Cape become NEETs? Or why the province has high prospects of
becoming NEETs
• What are underlying reasons that keep young people out of education, training, and employment?
• What are the main risk factors for being a NEET?
• What is the labour market status of NEETs?
• What are NEET policy responses?
1.4 Structure of the report
The report is structured as follows:
• Introduction
• Definition, composition, characteristics, and trends of youth NEET in SA and in the Eastern Cape
• Spatial overview of young people unemployed and youth NEET: NEET in urban and non-urban areas; NEET
in RSA Metros and non-Metros
• Performance and trend analysis of “Youth NEET Rate” and “Youth Inactivity Rate” in South Africa and in
the Eastern Cape
• Heterogeneity of Youth NEET: Disaggregating youth NEET in various subcategory for better youth policy
design and appropriate interventions in the Eastern Cape
• NEET policy responses: An overview of policy measures that target youth NEET subgroups, and
government policy interventions
• Conclusion
2. Definition, composition, characteristics, and trends of Youth NEET in the Eastern Cape
2.1 NEET concept
2.1.1 Definition
The acronym “NEET”, Not in Education, Employment, or Training” refers to a person who is unemployed and
not receiving an education or vocational training. In Statistics South Africa’s Labour Force Survey, all young
people who did not work in the reference week of the survey and were not enrolled in either formal education
or non-formal education in the four reference weeks of the survey were classified as youth NEET.

3
2.1.2 Why is the NEET concept important?
Youth NEET covers both the unemployed and inactive young people not enrolled in any formal education.
Historically, youth-oriented policies were concentrated mainly on a single indicator, namely, youth
unemployment, which highlights only a fraction of youth issues. The concept of NEET and youth vulnerability
extends far beyond the issue of unemployment. Looking at Table 1, for example, the number of young people
unemployed (651 253) in the Eastern Cape, is far short of the overall number of young people in the NEET
(1 138750), which includes the youth unemployed, youth inactive as well as those young people who find
themselves out of education and training at an early age.
The NEET concept expands the analysis of youth agenda in a broader context that allows to monitor other
aspects of the prevalence of labour market vulnerability among young people. Youth NEET are trapped
“vulnerable youth at risk” since they face disadvantages in labour market (Ranzani, M., & Rosati, F. C., 2013).
The important feature of the youth NEET indicator is that it refers to a very heterogeneous population.
2.1.3 Shortcoming and criticism of the NEET Concept
The fact that the NEET concept gathers all the vulnerable categories of youth together under one label is
criticised by some researchers. For example, the ILO report4 by Sarah Elder (2015: 1) refers to NEET as an
ambiguous indicator. The author suggests that unemployment indicator is much clear and useful than NEET
indicator. To overcome this criticism, the ILO proposes a slightly different way of looking at NEET, suggesting
rather the use of NELF which refers to people who are Not in Education nor in the Labour Force. The NELF
indicator only looks at inactive youth (i.e., family carers, discouraged youth, the sick or disabled and those
voluntarily out of the labour force), while the unemployed youth are treated as a separate group.
NEET concept is also criticised in terms of embracing heterogeneous youth who may or may not be at risk for
vulnerability, for example voluntary NEETs who chose to remain inactive (Bynner and Parsons, 2002).
Another shortcoming is that NEET concept ignores employment vulnerability. Most employed young people
work in low-paid; precarious and informal jobs, making them as vulnerable as those who are unemployed or
inactive out of choice. Thus, it is important that young people’s employment vulnerabilities are not forgotten
in labour market analyses and in the NEET analysis.
The consensus, however, remains that the NEET indicator is useful only when it is disaggregated by sub-groups
(OECD, 2020). The OECD argues that the attractiveness or benefit of using the NEET label is linked to the fact
that it puts (potential) vulnerable youth under one heading and one composite indicator. Nevertheless, it only
becomes useful when the analysis of the fused indicator is disaggregated into sub-groups (unemployed,
discouraged, family carers, inactive) that allow us to understand the reasons behind such a classification and
design targeted policies to address them. Therefore, it is important to use NEET indicator alongside other
demographic and labour market indicators; and to break them down into subgroups according to the reasons
for their vulnerability to ensure better-targeted policies.
4 ILO report by Sarah Elder (2015: 1) What does NEETs mean and why is the concept so easily misinterpreted?

4
2.2 Composition, characteristics, and trends of Youth NEET in the Eastern Cape
2.2.1 Youth5 NEET at a glance – A statistical analysis
Table 1 presents a snapshot that illustrates the composition and characteristics of youth NEET in the Eastern
Cape. Performance is measured by comparing the Eastern Cape with South Africa between 3Q2015 and
3Q2020.
The following findings emerge from Table 1:
• Shrinking youth population in the Eastern Cape: According to Statistics South Africa’s 2020 Mid-Year
Population Estimates (MYPE), the Eastern Cape had a total population of 6.7 million people, of which 2.1
million or 31.3% were youth between the ages of 15-34 years. Between 2015 and 2020, the population of
young people aged 15 to 34 declined significantly by 7.0% in the Eastern Cape compared to 1.6% in the
country as a whole (RSA). Although youth population is declining due to outmigration, it is important to
underline that youth still make up the largest portion of the provincial population. Hence, analysis of an
indicator such as youth NEET that directly affect the youth policy is important.
• Uneven youth labour market characterised by a large share of youth unemployed (65.5% official
definition) and a small share of youth employed (35.5% formal and informal). Drawing from the
Quarterly Labour Force Survey (QLFS) data, in 3Q2020, there were 430 914 young people employed in the
Eastern Cape (35.5% of total employment), 651 253 youth unemployed (65.5% of total unemployment),
and 100 573 youth discouraged work seekers (61.9% of total discouraged work seekers). Between 3Q2015
and 3Q2020, the number of young people employed fell by 27.2%, while the number of youth
unemployment skyrocketed by 71.9% in the Eastern Cape (compared to 9.1% for South Africa). This
unemployed performance gap for RSA and EC is significant and should be further investigated in future.
• 54.1% of all young people in the province are youth NEET. The Eastern Cape youth NEET is growing
amidst a shrinking youth population. In 3Q2020, the Eastern Cape had about 2.1 million people NEET of
which 1.1 million (54.1%) were youth NEET. Between 3Q2015 and 3Q2020, growth in youth NEET (14.0%)
outpaced growth of youth population (7.0%). This is an indication that youth NEET is growing amidst a
shrinking youth population.
• The majority of youth NEET are female and Black/Africans. Of the 1.1 million youth NEET in the province,
53.5% were female. However, the growth was more pronounced for male (15.3%) than for female (12.9%).
Of the 1.1 million youth NEET, 91.5% were Black/Africans and 7.1% coloured.
• More than half of all young NEET have not completed secondary education and about a quarter of all
youth NEET have “secondary completed”. Interventions for both sub-groups of youth should have their
targets toward further education with the aim to improve their employability prospects (ETF, 2015). The
focus should be to reintegrate this group either into a formal (or informal) education or vocational training
5 Officially, South Africa defines the youth as people in the 14-35 age range. Definitions of the youth vary in research and development circles, for instance, the United Nations Population Fund (UNFPA) and most contemporary demographic and public health researchers classify the youth as people aged 15-24 years. While this paper uses South African definition of youth (14 – 35 years of age), the standard definition (15-24 years) will also be provided in order to facilitate easy comparison with data and conclusions in population and international research.

5
• In the Eastern Cape, young NEET are mostly concentrated in non-urban areas (49.5%), but in South
Africa as a whole, youth NEET is an urban (59.9%) phenomenon. This justify reason why unemployment
rate in Eastern Cape non-metro is the highest in the country.
Table 1. Youth NEET at a Glance (Growth Rate 2015-2020, South Africa and Eastern Cape)
Source: Statistics South Africa (2020), Own calculations derived from Quarterly Labour Force Surveys (QLFS) and Mid-Year Population
Estimates (MYPE)

6
It is anticipated that the number of youth NEET and young people unemployed might continue to rise due to
the twin challenge of economic meltdown (recession) and Covid19 global health pandemic that have affected
economies world-wide, restricting job creation in certain industries, like tourism, which employ young people.
The second wave of the pandemic have strongly surged in the Eastern Cape. The prolonged disaster
management measures in the province may contribute to the rise in the levels of unemployment among the
youth and cause emerging youth to join the pool of youth NEET which rate is already high in the province.
2.2.2 Background and main determinant for being NEET
Historically, the acronym NEET first emerged in the United Kingdom in the late 1980s. The concept was
developed with the aim to provide an alternative way of categorising the youth population. Furlong (2006)
noticed that young people were constrained not only by unemployment but also by awful challenges related
to personal circumstances, like: personal and family issues linked to poverty and unemployment;
environmental issues; fiscal and socioeconomic issues. Furlong (2006) refers to these constraints as
determinants for being NEET. These challenges contributed to the vulnerability of young people and to the
early school leavers, which led young people to either experience an initial period of being NEETs or move
quickly into insecure jobs (Furlong, 2006).
2.2.3 Risk factors that increase the probability of young people becoming NEETs
The European Union has identified several risk factors that increase the probability of young people becoming
NEETs (European Commission, 2015). These risks factors are: Low education, living in remote areas,
immigration background, difficult family environment, low household income, gender, disability, early school
leaving, and poor socio-economic background.
All the above determinants and risk factors for being NEET are relevant to the Eastern Cape. These factors
and determinants justify why many young people in the Eastern Cape become NEETs. They are valid reasons
why the province has high prospects of becoming NEETs? Let us quantify the facts by putting numbers as
evidence based to illustrate the situation that our young people find themselves in and increase their
prospects of becoming NEETs.
• Individual circumstances including gender and health. Three examples are provided. The first one is high
prevalence of adolescent pregnancy in the Eastern Cape. In East London6, 5183 schoolgirls were pregnant
in 2012 and the number continue to increase. The second one is the number of female adolescents headed
household is a rapidly growing in the Eastern Cape. The province has the highest rate of child/youth
headed household in the country. The third one is the high proportion (34.6%) of youth not living with
either parent, a phenomenon which is most common in Eastern Cape (Stats SA - 2018 Household Survey).
The adolescents pregnant, teenage heading the households, and adolescent not staying with either parent
affect their vulnerability. Most of these young people are often not at school and are responsible for
domestic chores (Mlatsheni, C., 2014).
• Family circumstances, including high level of poverty. In 2019, there were 38% of people below the food
poverty line (StatsSA defined). The European Commission (2015) argues that poverty increased the
likelihood of young people becoming NEETs. Also echoed by Tamesberger, D., & Bacher, J. (2014).
• Provincial education systems and infrastructure. The minister of basic education indicated that the
province has the most schools without proper sanitation or electricity (Department of Education, 2017). In
terms of access to education, the Eastern Cape has the highest deprivation7 intensity of 39, 1% in the
country.
6 http://www.dispatch.co.za/pregnant-girls-abandon-school/ According to the statistics Education report, 5183 schoolgirls in East London were pregnant during 2012 academic year. 7 For more information, read Stats SA report on “Education report focusing on the Eastern Cape” www.statssa.gov.za

7
• Labour market conditions. According to Stats SA, the labour absorption8 rate in the province has declined
from 42.8% in 3Q2019 to 36.2% in 3Q2020, signifying a lack of job opportunity and the inability of the
economy to absorb people into employment. Young graduates who cannot get job end up in NEET.
• Economy condition and government social security net (SSN)9. The low economic growth path, which has
recently been worsened by global health Covid19 pandemic, has adverse effect on the fiscus needed to
boot social security net of vulnerable young people.
2.2.4 Other challenges and underlying reasons that keep young people out of education, training, and
employment
• Working experience: Many job opportunities require prior working experience to ensure that you can
perform at a certain level and have the required skills and expertise.
• Lack of higher education. It gives an individual a higher competitive advantage compared to an individual
who is less educated.
• Lack of Funding for studies or business: due to lack of money, a lot of young people cannot proceed to
further their studies even if they still wish to do so or start a business.
• Limited access to information on available work/study opportunities, especially for those living in remote
and rural areas. They are not well informed or exposed to appropriate opportunities and resources.
Limited exposure to work opportunities cause young people to remain in NEET for a long period.
• Limited networking skills. Some young people or their parent do not have money to buy data. Others stay
in area where internet connection is a challenge. Other simply lack networking skills.
• Loss of motivation and limited support structure. Many young people have given up the search due to
lengthy periods of unemployment and numerous rejections. Being unemployed or idle for a long time can
affect the individual’s motivation.
The next section of this paper presents a spatial overview of youth unemployed and youth NEET in RSA and in
the Eastern Cape. It focuses on youth NEET located in urban, non-urban, metros and non-metros.
3 Spatial overview of young people unemployed and youth NEET
3.2 Snapshot of youth unemployment in South Africa’s provinces
Figure 1 shows that the Eastern Cape has the highest youth unemployment rate in the country. During the
third quarter of 2020, youth unemployment rate ranged between 60% in the Eastern Cape (the highest) and
32% in the Western Cape (the lowest). Data from the QLFS reveals that youth unemployment rate in the
province increased dramatically from 39% in 3Q2015 to 60% in 3Q2020. However, an opposite trend was
observed in the Northern Cape, where youth unemployment rate dropped from 46% in 3Q2015 to 33% in
2Q2020.
8 The labour absorption rate provides an alternative indication to the unemployment rate regarding the lack of job opportunities in the labour market. The labour absorption rate is the proportion of the working-age population aged 15-65 years that is employed 9 The social safety net (SSN) consists of non-contributory assistance existing to improve lives of vulnerable families and individuals experiencing poverty and destitution.

8
Figure 1. The Eastern Cape has the highest youth unemployment rate in the country
Source: Statistics South Africa (2020), Own calculations derived from Quarterly Labour Force Surveys
High levels of unemployment in the province are often associated with low demand for goods and services,
low tax base, low consumption, and low economic growth. Therefore, an inclusive labour policy is critical
because the rising and persisting youth unemployment rate in the province trigger adverse effects on
economic growth. Young NEETs are at high risk of drifting into long-term unemployment, social exclusion, and
deprivation.
3.3 Snapshot of youth unemployment in South Africa’s Metros and non-Metros
Table 2 contrasts youth unemployment rate in both, South Africa’s Metros, and South Africa’s non-Metros. It
shows that in 3Q2020, high youth unemployment rates (above 50%) were most prevalent in three areas,
namely, the Eastern Cape non-metro (63.5%), Nelson Mandela Bay Metro (56.1%), and in the City of Tshwane
(51.8%). High rate of youth unemployment is due to a lack of demand in the labour market to address the
increasing number of young job seekers.
It is further noticed that, for the same period, youth unemployment rate grew exponentially (above 10
percentage points) in three areas, namely, in the Eastern Cape non-metro (27.8 percentage points), in the city
of Tshwane (15.6 percentage points), and in KZN non-metros (13.3 percentage points).
The Eastern Cape non-metro is singled out, emerging as one area which present both high youth
unemployment prevalence and high growth rate of youth unemployed. In addition to this labour challenge, it
is known also that these non-metro areas are predominantly rural and stricken by poverty. This suggest that
government could select such areas to pilot an experiment of youth-oriented policies.
EC FS GT RSA LMP MPL NC KZN NC WC
3Q2015 39% 43% 40% 36% 28% 37% 34% 30% 46% 30%
2Q2020 53% 35% 37% 34% 33% 18% 32% 29% 41% 26%
3Q2020 60% 47% 46% 43% 41% 40% 39% 38% 33% 32%
0%
10%
20%
30%
40%
50%
60%
Per
cen
tage

9
Table 2. High youth (15-34) unemployment rate is shown in the Eastern Cape non-metro Youth (15 - 34)
Unemployment rate
in RSA Metros
and Non-Metros 3Q2015 3Q2019 4Q2019 1Q2020 2Q2020 3Q2020
Changes
3Q2015
3Q2020
WC - Non-Metro 25.9% 31.5% 25.2% 24.9% 17.5% 26.4% 0.5%
WC - City of Cape Town 32.5% 34.7% 34.6% 33.1% 30.7% 35.3% 2.8%
EC - Non-Metro 35.7% 52.2% 55.6% 57.2% 53.3% 63.5% 27.8%
EC - Buffalo City 37.9% 51.2% 53.0% 45.9% 41.1% 47.9% 10.0%
EC - Nelson Mandela Bay 48.5% 48.4% 46.7% 47.6% 59.2% 56.1% 7.6%
NC - Non-Metro 45.5% 42.4% 38.2% 38.2% 40.6% 33.3% -12.2%
FS - Non-Metro 44.5% 48.4% 52.6% 55.1% 37.1% 47.9% 3.5%
FS - Mangaung 40.9% 43.8% 41.7% 45.7% 31.3% 46.4% 5.4%
KZN - Non-Metro 33.1% 40.4% 38.6% 43.2% 37.8% 46.4% 13.3%
KZN - eThekwini 25.6% 32.7% 31.9% 35.5% 10.3% 21.1% -4.5%
NW - Non-Metro 33.6% 43.9% 42.0% 47.3% 31.7% 39.2% 5.6%
GP - Non-Metro 43.7% 45.9% 42.1% 44.4% 28.2% 34.4% -9.4%
GP - Ekurhuleni 41.2% 45.5% 45.7% 45.6% 40.3% 47.3% 6.0%
GP - City of JHB 40.0% 44.3% 43.9% 45.2% 37.1% 43.8% 3.8%
GP - City of Tshwane 36.2% 40.4% 39.4% 43.3% 37.6% 51.8% 15.6%
MP - Non-Metro 37.0% 48.3% 46.8% 47.0% 18.1% 39.8% 2.9%
Source: Statistics South Africa (2020), Own calculations derived from Quarterly Labour Force Surveys
The EC labour-market systems have failed to provide opportunities for large numbers of young people: Youth
participation in employment, education or training is important because it establishes young people in the
labour market and cause them to be self-sufficiency. Vulnerability and high levels of youth NEET in the Eastern
Cape are not simply a consequence of individual or family characteristics, but also the result of education and
labour-market systems that fail to provide opportunities for large numbers of young people. Moreover, the
vulnerability of youth is also a consequence of weak demand for skilled labour in the Eastern Cape economy.
3.4 Snapshot of youth NEET in South Africa’s provinces
While the youth unemployment rate is high in the Eastern Cape (concentrated mainly in non-metros), in
numerical terms, youth NEET is rather largely found in Gauteng (23%), KwaZulu-Natal (22%) and Eastern Cape
(13%). This is evidenced in Figure 2 and Table 3 below.
Youth unemployment and the question of how to effectively engage the youth not in employment, education,
or training institution (NEET) has, for the past decade, been at the heart of the National & Provincial Youth
Policy Agenda, especially youth-oriented policies. Youth NEET indicator has brought more insight to youth
unemployment policy debate. It has helped redefine policy objectives in the youth area and has become a
crucial addition to key monitoring frameworks in the EC province’s economic and social sphere.

10
Figure 2 Provincial overview of youth NEET (RSA, 3Q2015, 2Q2020 and 3Q2020)
Source: Statistics South Africa (2020)
Table 3: Growth rate and distribution of youth NEET in South Africa’s provinces
Number of Young People (15-34) in NEET Growth Rate (%) Distribution (%)
3Q2008 3Q2015 3Q2019 1Q2020 2Q2020 3Q2020 3Q2019-
3Q2020
3Q2008-
3Q2020
3Q2008 3Q2020
1: Western Cape 435 337 632 500 720 719 693 623 771 823 778 496 8% 79% 8% 9%
2: Eastern Cape 857 166 999 187 1 121 843 1 142 559 1 220 159 1 138 750 2% 33% 15% 13%
3: Northern Cape 92 914 179 157 192 375 187 225 223 637 207 335 8% 123% 2% 2%
4: Free State 295 372 401 414 419 073 432 177 449 325 399 592 -5% 35% 5% 5%
5: KwaZulu-Natal 1 141 486 1 495 975 1 762 302 1 872 148 2 008 847 1 951 373 11% 71% 20% 22%
6: North West 336 333 531 709 606 105 635 030 641 560 603 358 0% 79% 6% 7%
7: Gauteng 1 024 296 1 595 123 1 806 396 1 904 612 2 101 207 2 050 736 14% 100% 18% 23%
8: Mpumalanga 493 568 602 629 709 646 719 359 715 904 695 814 -2% 41% 9% 8%
9: Limpopo 910 923 780 545 905 272 942 264 1 027 954 985 874 9% 8% 16% 11%
NEET RSA 5 587 395 7 218 237 8 243 730 8 528 998 9 160 415 8 811 329 7% 58% 100% 100%
Source: Statistics South Africa (2020), Own calculations derived from Quarterly Labour Force Surveys
3.5 Snapshot of youth NEET in South Africa’s Metros and non-Metros
This section contrasts Youth NEET in South Africa’s metros against non-metros for 3Q2015 and 3Q2020.
Results are presented in Table 4, and Figure 3. The analysis delineates the extent to which Youth NEET profile
in the Eastern Cape non-metro, BCM metro, and NMB metro contrasts those in other metros (non-metros) in
the rest of the country. From Table 4, and Figure 3, the following observations are noted:
• Half of total NEET in the country are youth NEET. Statistics South Africa’s Quarterly labour Force Survey
data reveals for 3Q2020 that South Africa had in total 17.8 million people Not in Education, Employment,
or Training of which 8,8 million (49.5%) were youth NEET. Of the 8.8 million youth NEET in the country,
1,1 million were in the Eastern Cape.
• The majority of youth NEET live in non- metropolitan areas. Table 4 reveals that of the 8.8 million youth
NEET in the country, 36.1% were in metropolitan areas and 63.9% in non- metropolitan areas. Overall,
GT KZN EC LMP WC MPL NW FS NC
3Q2015 1 595 123 1 495 975 999 187 780 545 632 500 602 629 531 709 401 414 179 157
2Q2020 2 101 207 2 008 847 1 220 159 1 027 954 771 823 715 904 641 560 449 325 223 637
3Q2020 2 050 736 1 951 373 1 138 750 985 874 778 496 695 814 603 358 399 592 207 335
-
500 000
1 000 000
1 500 000
2 000 000
2 500 000N
um
ber

11
total NEET in South Africa grew from 7.2 million in 3Q2015 to 8.8 million in 3Q2020, a 22.1% growth in
half decade.
• However, in the Eastern Cape, three quarter (75%) of youth NEET reside in non-metropolitan areas. Of
the 1.1 million youth NEET in the Eastern Cape, 859 672 (75%) reside in non-metropolitan areas, 165 847
(15%) in NMB metro, and only 113 231 (10%) in the BCM metro. The two metros (NMB & BCM) account
for a quarter of all youth NEET in the province.
• There are 3 Metros in South Africa with high youth NEET growth rate (above 30%): BCM, City of
Tshwane, and City of Johannesburg. Table 4 shows that between 3Q2015 and 3Q2020, Youth NEET grew
by 36.8% in the BCM, 36.7% in the City of Tshwane, 33.6% in the City of Johannesburg. Among the non-
metro areas, growth above 30% was noticed in KwaZulu-Natal non-metro.
• Overall, youth NEET growth rate in south Africa’s metropolitan areas outpaced that of non-
metropolitan areas. As shown at the bottom of Table 4 below, During the third quarter of 2015, there
were 2.4 million Youth NEET in all South Africa’s metros. The number grew by 28.4% in 3Q2020 to 3.2
million. In non-metro areas, it grew by 18.7% from 4.7 million to 5.6 million.
Table 4. Snapshot of youth NEET in South Africa’s Metro and non-Metros
Source: Statistics South Africa (2020), Own calculations derived from Quarterly Labour Force Surveys
Looking at youth NEET in a global perceptive, it is generally acknowledged, both nationally and
internationally, that NEETs constitute one of the greatest threats to social stability. According to the
International Labour Organisation (ILO, 2020), the number of young people NEET stood at 267 million globally,
representing 20% of the global youth population (ILO 2020). The ILO describes the young NEET people as not
contributing to self- development or national development.
The number of young people in NEET is expected to increase to approximately 273 million in 2021. The ILO
(2020) report finds that a narrow focus on vocational training, a lack of jobs to match qualifications, and
increasing automation are creating a “precarious future in the labour market” for young people.
The report recommended that an integrated policy framework to support young people's ascent into decent
jobs and to assure that new technologies positively impact on youth employment.
3Q2015 1Q2020 2Q2020 3Q2020 3Q2015 3Q2020
WC - Non Metro 230 284 280 467 282 548 286 306 3.2% 3.2% 24.3%
WC - City of Cape Town 402 215 413 157 489 274 492 190 5.6% 5.6% 22.4%
EC - Non Metro 769 690 876 881 915 441 859 672 10.7% 9.8% 11.7%
EC - Buffalo City 82 798 107 150 115 222 113 231 1.1% 1.3% 36.8%
EC - Nelson Mandela Bay 146 699 158 527 189 495 165 847 2.0% 1.9% 13.1%
NC - Non Metro 179 157 187 225 223 637 207 335 2.5% 2.4% 15.7%
NW - Non Metro 531 709 635 030 641 560 603 358 7.4% 6.8% 13.5%
FS - Non Metro 291 054 322 451 323 576 283 789 4.0% 3.2% -2.5%
FS - Mangaung 110 360 109 726 125 748 115 803 1.5% 1.3% 4.9%
KZN - Non Metro 1 086 351 1 396 738 1 445 883 1 419 859 15.1% 16.1% 30.7%
KZN - eThekwini 409 624 475 409 562 964 531 514 5.7% 6.0% 29.8%
GP - Non Metro 266 996 265 140 298 752 284 821 3.7% 3.2% 6.7%
GP - Ekurhuleni 411 124 484 166 567 450 530 421 5.7% 6.0% 29.0%
GP - City of Johannesburg 576 466 718 134 786 020 769 911 8.0% 8.7% 33.6%
GP - City of Tshwane 340 537 437 172 448 985 465 584 4.7% 5.3% 36.7%
MP - Non Metro 602 629 719 359 715 904 695 814 8.3% 7.9% 15.5%
LP - Non Metro 780 545 942 264 1 027 954 985 874 10.8% 11.2% 26.3%
RSA (Total) Metropolitans 2 479 823 2 903 442 3 285 159 3 184 501 34.4% 36.1% 28.4%
RSA Non-metro 4 738 414 5 625 555 5 875 255 5 626 827 65.6% 63.9% 18.7%
TOTAL NEET - RSA 7 218 237 8 528 998 9 160 415 8 811 329 100.0% 100.0% 22.1%
Youth NEET (Number) Distribution (%) % Change
3Q2015 to
3Q2020

12
Figure 3. Spatial concentration of youth NEET in South Africa’s Metropolitan Areas
Source: Statistics South Africa (2020)
Figure 4. Spatial concentration of youth NEET in South Africa’s NON-Metropolitan areas
Source: Statistics South Africa (2020)
3.6 Youth NEET, young people unemployment, and youth inactivity are key determinants of migration
Young NEET people who are unemployed, economically inactive, are most likely to migrate to more developed
& prosperous regions to seek for greener pastures. According to Stats SA’s Mid-Year Population Estimates
(MYPE), the Eastern Cape province had, over the past decade, the highest out migration rate, while Gauteng10
province had the highest in-migration rate in the country. As shown in Table 1, youth population in the Eastern
Cape continue to decline. The International Labour Organisation consider unemployment, inactivity, and NEET
as key determinants of migration (ILO, 2015).
10 High youth NEET in Gauteng is partially attributed to high in-migration patterns caused by high opportunities that the province has which appeal to young people searching for greener pastures, especially jobs.
769 911
531 514 530 421 492 190
465 584
165 847
115 803 113 231
-
100 000
200 000
300 000
400 000
500 000
600 000
700 000
800 000
900 000
GP - City ofJohannesburg
KZN - eThekwini GP - Ekurhuleni WC - City of CapeTown
GP - City ofTshwane
EC - NelsonMandela Bay
FS - Mangaung EC - Buffalo City
3Q2015 1Q2020 2Q2020 3Q2020
-
200 000
400 000
600 000
800 000
1 000 000
1 200 000
1 400 000
1 600 000
KZN - NonMetro
LP - NonMetro
EC - NonMetro
MP - NonMetro
NW - NonMetro
WC - NonMetro
GP - NonMetro
FS - NonMetro
NC - NonMetro
3Q2015 1Q2020 2Q2020 3Q2020

13
Since the equitable share allocations received by provinces are based on population numbers, unfortunately,
this decline in the EC population has negatively affected government fiscal allocations to the province.
Consequently, reduced resources allocation, especially in times such as these of severe fiscal austerities,
recession and covid19, and economic slump has perilous repercussion on budget available to deliver on macro-
economic objectives and targets set by government including service delivery.
It is concluded that high youth NEET and high out-migration experienced in the Eastern Cape has had adverse
effects on the provincial fiscus, and other developmental indicators. The next section shows how youth NEET
rate and youth inactivity rate are estimated using labour force survey data.
4. Youth NEET rate and Youth Inactivity rate in the Eastern Cape
4.1 Difference between Unemployed and Inactive Youth
There is a huge difference between youth unemployed, and youth economically inactive (or Youth Not
Economically Active).
• Youth Not Economically Active (YNEA) refers to young people in the age category 15 to 34 years who
are out of the labour market11 and are not available for work. This category includes full-time scholars
and students, too ill to work, full-time homemakers, those who are in early retirement, and those who
are unable or unwilling to work.
• However, youth unemployed are in the labour market but not working, looking for work, and are
available to start working as soon as the get a work.
• Youth NEET are the young people who are not employment, education, or training institution.
4.2 How youth NEET rate and youth inactivity12 rate are estimated?
Youth NEET rate is an indicator that presents the share of young people who are not in employment,
education, or training (NEET), as a percentage of the total number of young (OECD, 2020). Youth Inactivity rate
is an indicator that presents the share of young people who are economically inactive, as a percentage of the
total number of young (OECD, 2020).
In South Africa, these concepts are estimated using data from the Labour Force Survey. Youth & Adult NEET
rates (See Figure 5) and Youth & Adult Inactivity rates (See Figure 6) were estimated using the following
formula.
Youth NEET Rate = Number of young people not in employment, education or training
Total population of young people
During the third quarter of 2020, youth NEET rate reached 54.1% in the Eastern Cape and 42.6% for South
Africa (See Figure 5).
11 Together, employed, and unemployed people are classed as “economically active” and make up what’s called the “labour force”. 12 In QLFS, Stats SA consider inactive youth as those who did not work in the reference week; did not look for work or try to start a business in the four weeks preceding the survey; and were not available to start work or a business in the reference week.
14
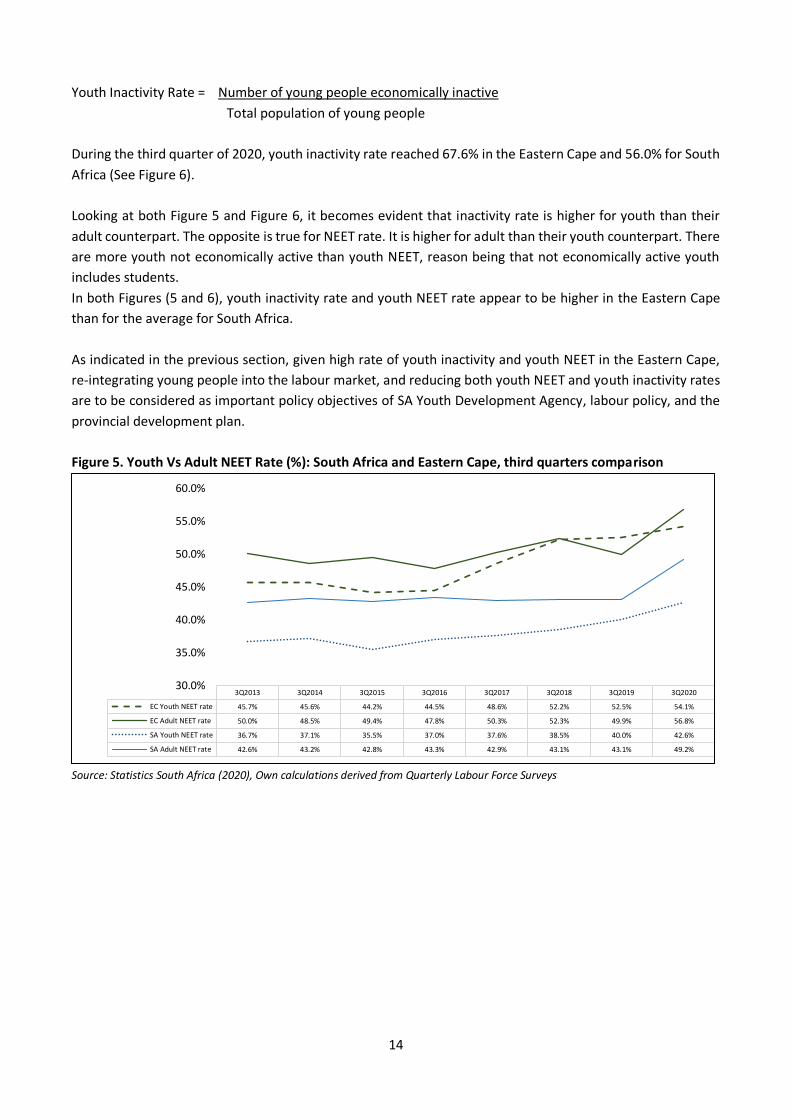
Youth Inactivity Rate = Number of young people economically inactive
Total population of young people
During the third quarter of 2020, youth inactivity rate reached 67.6% in the Eastern Cape and 56.0% for South
Africa (See Figure 6).
Looking at both Figure 5 and Figure 6, it becomes evident that inactivity rate is higher for youth than their
adult counterpart. The opposite is true for NEET rate. It is higher for adult than their youth counterpart. There
are more youth not economically active than youth NEET, reason being that not economically active youth
includes students.
In both Figures (5 and 6), youth inactivity rate and youth NEET rate appear to be higher in the Eastern Cape
than for the average for South Africa.
As indicated in the previous section, given high rate of youth inactivity and youth NEET in the Eastern Cape,
re-integrating young people into the labour market, and reducing both youth NEET and youth inactivity rates
are to be considered as important policy objectives of SA Youth Development Agency, labour policy, and the
provincial development plan.
Figure 5. Youth Vs Adult NEET Rate (%): South Africa and Eastern Cape, third quarters comparison
Source: Statistics South Africa (2020), Own calculations derived from Quarterly Labour Force Surveys
3Q2013 3Q2014 3Q2015 3Q2016 3Q2017 3Q2018 3Q2019 3Q2020
EC Youth NEET rate 45.7% 45.6% 44.2% 44.5% 48.6% 52.2% 52.5% 54.1%
EC Adult NEET rate 50.0% 48.5% 49.4% 47.8% 50.3% 52.3% 49.9% 56.8%
SA Youth NEET rate 36.7% 37.1% 35.5% 37.0% 37.6% 38.5% 40.0% 42.6%
SA Adult NEET rate 42.6% 43.2% 42.8% 43.3% 42.9% 43.1% 43.1% 49.2%
30.0%
35.0%
40.0%
45.0%
50.0%
55.0%
60.0%

15
Figure 6. Youth vs Adult Inactivity Rates (%): South Africa and Eastern Cape
Source: Statistics South Africa (2020), Own calculations derived from Quarterly Labour Force Surveys
The International Labour Organisation distinguish between two kind of young NEETs:
• Those who are considered to have a continued orientation to or engagement with the labour market even
though they may have become discouraged, and
• Those who are completely detached from the labour market and are not available for work, and not
searching for work. Under this category, youth NEET are inactive due to reason like illness and disability,
household reasons, pregnancy, too young to work, lack of money to pay for transport to look for work,
voluntarily not working.
These distinctions are important as they capture different status that young people find themselves in and
they require different type of strategic interventions. Hence, the one-size-fits-all approach must be avoided.
For example, young people who are inactive due to disability requires different intervention from inactive
youth who voluntarily chose not to work.
5. Heterogeneity of Youth NEET in the Eastern Cape
It has been acknowledged world-wide that the approach of perceiving the overall NEET rate as one single
homogenous indicator often hinders the ability to understand their situation and their specific needs for
support. As indicated in section two of this study, various categories of youth require different kinds of
interventions and support to help them to successfully navigate their transitions through the education and
training environment, into the labour market and entrepreneurial world.
This section goes beyond the homogeneity approach of analysing NEET. It goes further by disaggregating youth
NEET in various categories, exploring the diversity of youth NEET, and unpacking the heterogeneous nature of
the NEET youth sub-groups.
3Q2013 3Q2014 3Q2015 3Q2016 3Q2017 3Q2018 3Q2019 3Q2020
SA Youth Inactivity Rate 50.3% 50.3% 48.7% 48.9% 49.0% 49.7% 49.7% 56.0%
SA Adult Inactivity Rate 32.4% 32.8% 31.3% 31.0% 29.5% 30.1% 29.5% 34.9%
EC Youth Inactivity Rate 66.0% 63.6% 66.8% 67.1% 63.1% 64.3% 66.9% 67.6%
EC Adult Inactivity Rate 39.4% 39.6% 38.9% 37.3% 34.6% 39.0% 36.4% 36.9%
25.0%
30.0%
35.0%
40.0%
45.0%
50.0%
55.0%
60.0%
65.0%
70.0%

16
5.1 Youth NEET in the Eastern Cape: Development and trends, 1Q2008 to 3Q2020
From the previous recession in 2008 until 2012, the number of youth NEET in the province remained below
one million. Thereafter, it fluctuated between 1.0 million and 1.1 million, reaching 1 188 705 in the first quarter
of 2020 (See Figure 7).
Figure 7. Youth NEET in the Eastern Cape: Development and trends, 1Q2008 to 3Q2020
Source: Statistics South Africa (2020)
As the COVID-19 pandemic surged and government put strict lockdown restrictions to curb the spread of the
coronavirus, youth NEET in the province peaked at 1.2 million in 2Q2020 (See Figure 7).
With the recent COVID-19 epidemic, which has disrupted economic activities in all regions around the world,
business is not as usual, especially in South Africa where the pandemic has worsened the economic depression.
Consequently, it is very difficult for young people, especially those with low level of education13 and
inappropriate working experience to come out of the NEET status (Chen, Y.-W., 2011). The current situation
requires further concerted efforts, integrated policies, developmental strategies, and investments from both
public and private sectors to support the transition of young people into productive employment.
5.2 Eastern Cape youth NEET disaggregated in 10 different age groups
The QLFS data allows us to disaggregate NEET in various age groups. The analysis reveals that the number of
NEETs increases with age. Table 5 and Figure 8 show how it peaks at age 25-29 and thereafter decline. This is
a global phenomenon, and it is also observed in South Africa and in the Eastern Cape.
13 The largest group of NEETs is composed of young people who did not complete secondary level of education (55.6% in 3Q2015 and 53.1% in 3Q2020), often excluded from the policy discourse.
857 166
960 355
1 056 044
1 116 496
1 078 699
1 220 159
1 138 750
700 000
800 000
900 000
1 000 000
1 100 000
1 200 000
1 300 000
1Q
20
08
2Q
20
08
3Q
20
08
4Q
20
08
1Q
20
09
2Q
20
09
3Q
20
09
4Q
20
09
1Q
20
10
2Q
20
10
3Q
20
10
4Q
20
10
1Q
20
11
2Q
20
11
3Q
20
11
4Q
20
11
1Q
20
12
2Q
20
12
3Q
20
12
4Q
20
12
1Q
20
13
2Q
20
13
3Q
20
13
4Q
20
13
1Q
20
14
2Q
20
14
3Q
20
14
4Q
20
14
1Q
20
15
2Q
20
15
3Q
20
15
4Q
20
15
1Q
20
16
2Q
20
16
3Q
20
16
4Q
20
16
1Q
20
17
2Q
20
17
3Q
20
17
4Q
20
17
1Q
20
18
2Q
20
18
3Q
20
18
4Q
20
18
1Q
20
19
2Q
20
19
3Q
20
19
4Q
20
19
1Q
20
20
2Q
20
20
3Q
20
20

17
Table 5. NEET by age group in the Eastern Cape: Distribution and growth rates (3Q2015 – 3Q2020)
Number Distribution Number Number Distribution % Change
3Q2015 3Q2015 (%) 1Q2020 2Q2020 3Q2020 3Q2020 (%)
3Q2015 to
3Q2020
Age 15-19 102 597 6% 117 929 80 672 72 899 3% -29%
Age 20-24 318 121 17% 369 059 371 654 330 774 15% 4%
Age 25-29 342 887 19% 359 734 440 830 434 613 20% 27%
Age 30-34 235 582 13% 295 836 327 002 300 465 14% 28%
Youth NEET 999 187 54% 1 142 559 1 220 159 1 138 750 52% 14%
Age 35-39 168 581 9% 196 751 214 914 213 975 10% 27%
Age 40-44 161 600 9% 167 388 185 415 175 296 8% 8%
Age 45-49 111 075 6% 173 558 186 397 185 695 8% 67%
Age 50-54 137 899 7% 131 301 133 091 150 123 7% 9%
Age 55-59 128 392 7% 123 868 138 537 141 868 6% 10%
Age 60-64 140 889 8% 170 452 193 604 190 869 9% 35%
Adult NEET 848 437 46% 963 317 1 051 958 1 057 828 48% 25%
Total NEET 1 847 623 100% 2 105 876 2 272 117 2 196 578 100% 19%
Source: Statistics South Africa (2020), Own calculations derived from Quarterly Labour Force Surveys
An interesting observation is noted in Table 5. It reveals that between 3Q2015 and 3Q2020, the number of
youth NEET aged 15-19 dropped by 29%, while that of those aged 45-49 increased by 67%.
Figure 8. NEET by age group in the Eastern Cape
Source: Statistics South Africa (2020)
5.3 Gender and spatial disparities of youth NEET in the Eastern Cape
Looking at the gender dynamics, QLFS data record more female than male NEETs. This implies that NEET has
a gender dimension, meaning that female youth have a higher chance of being NEET than male youth.
-
50 000
100 000
150 000
200 000
250 000
300 000
350 000
400 000
450 000
500 000
Age 15-19 Age 20-24 Age 25-29 Age 30-34 Age 35-39 Age 40-44 Age 45-49 Age 50-54 Age 55-59 Age 60-64
Eastern Cape NEET by Age Group
3Q2015 1Q2020 2Q2020 3Q2020

18
Table 6. Gender disparity in the Youth NEET
South Africa Eastern Cape
3Q2015 3Q2020 %
Change 3Q2015 3Q2020 % Change
Total NEET 13 981 287 17 801 782 27% 1 847 623 2 196 578 19%
Male 5 779 790 7 825 498 35% 805 697 958 351 19%
Female 8 201 497 9 976 284 22% 1 041 926 1 238 227 19%
Youth NEET 7 218 237 8 811 329 22% 999 187 1 138 750 14%
Age: 15- 24 3 043 693 3 272 024 8% 420 718 403 673 -4%
Age: 25- 34 4 174 544 5 539 305 33% 578 469 735 078 27%
Youth NEET (%)
of Total 51.60% 49.50% 54.10% 51.80%
Source: Statistics South Africa (2020), Own calculations derived from Quarterly Labour Force Surveys
Table 6 illustrated this with 56% of youth NEET in the Eastern Cape being female. Hight rate of teenage14
pregnancy among young girls could contribute to having more female youth NEET as these young girls may
drop from school due to pregnancy (Henderson, et al., 2017).
Table 7. Gender disparity in the Youth NEET
Geo-Type
Eastern
Cape
Gender
Number of Youth NEET Growth rate (%)
Gender
Disparity
3Q2015 1Q2020 2Q2020 3Q2020
3Q2015
to
3Q2020
1Q2020
to
3Q2020
3Q2015 3Q2020
(%)
Urban Total 396 325 503 871 559 757 547 605 38% 9% 100% 100%
Male 185 797 227 846 259 573 247 431 33% 9% 47% 45%
Female 210 528 276 025 300 184 300 174 43% 9% 53% 55%
Traditional
/Tribal Total 587 790 620 859 636 684 563 246 -4% -9% 100% 100%
Male 267 557 295 270 306 521 275 561 3% -7% 46% 49%
Female 320 233 325 589 330 163 287 685 -10% -12% 54% 51%
Farms/Rural
formal Total 15 072 17 829 23 718 27 899 85% 56% 100% 100%
Male 6 256 2 363 6 656 6 777 8% 187% 42% 24%
Female 8 815 15 466 17 061 21 122 140% 37% 58% 76%
TOTAL 999 187 1 142 559 1 220 159 1 138 750 14% -0.3%
Source: Statistics South Africa (2020), Own calculations derived from Quarterly Labour Force Surveys
As shown in Table 7, in 3Q2020, gender disparity was pronounced in farms areas with 76% female youth NEET
(24% male youth NEET). It was almost balanced in traditional/tribal areas with 51% female youth NEET (49%
male youth NEET); and slightly predominated for female youth NEET (55%) in urban area (45% male youth
NEET).
5.4 Level of education of youth NEET in the Eastern Cape
The largest group of NEETs is made up of young people who did not complete secondary level of education
(55.6% in 3Q2015 and 53.1% in 3Q2020), often excluded from the policy discourse. The opposite occurs in
developed countries which tend to have a large proportion of well-educated NEETs. However, in South Africa,
14 According to the South Africa Demographic and Health Survey of 2017, teenage pregnancy statistics in South Africa paint a worrying trend. In 2017, for example, about 1 million babies were born in South Africa and staggering 6.8% were delivered by women between 10 and 17 years.

19
the probability of becoming NEET still decreases as educational level increases. When youth leave school with
minimal skills, they are unable to enter the job market and therefore struggle to become independent.
Table 8. Level of education of youth NEET in the Eastern Cape
Number of NEET Youth by Education Level Distribution (%)
3Q2015 1Q2020 2Q2020 3Q2020 3Q2015 1Q2020 2Q2020 3Q2020
No schooling 23 453 23 792 15 378 15 619 2.3% 2.1% 1.3% 1.4%
Less than primary completed 135 536 97 607 116 095 104 131 13.6% 8.5% 9.5% 9.1%
Primary completed 64 081 61 142 69 272 49 906 6.4% 5.4% 5.7% 4.4%
Secondary not completed 555 442 636 954 640 641 605 102 55.6% 55.7% 52.5% 53.1%
Secondary completed 187 810 271 781 296 784 304 780 18.8% 23.8% 24.3% 26.8%
Tertiary 28 689 47 378 75 845 56 882 2.9% 4.1% 6.2% 5.0%
Other 4 175 3 904 6 143 2 329 0.4% 0.3% 0.5% 0.2%
Total 999 187 1 142 559 1 220 159 1 138 750 100.0% 100.0% 100.0% 100.0%
Source: Statistics South Africa (2020), Own calculations derived from Quarterly Labour Force Surveys
Serious concerns have been raised in the literature and in the public debate about those young people who
have a low level of education, and little or no work experience. These are the NEET group that is very difficult
to reach and, as a result, hard to integrate into the labour market. They are at risk of becoming deeply
alienated.
In South Africa, the impact of youth NEET is brought to the fore by crime statistics that reveal that the average
age of a house robber is between 19 and 25 years and that of all arrested robbers, 90% had not passed Grade
12 and/or were unemployed. Therefore, the rise in youth NEET may cause a spike in crime rates. High crime
rate is disincentive for investment promotion and tourism growth. Consequently, the monitoring of NEET
trends and strong interventions to address the challenge of NEETs are key to promoting peace and stability in
a society.
What need to be done? Government need to invest more in human capital. The human capital theory sheds
light on the positive relationship between educational qualifications and higher earnings during a person's
time of employment. This encourages people to invest in education because of their returns. The fundamental
concept of human capital theory is that education and training strengthen the human capital of the individual
and, as a result, increases the ability of the individual to be effective at work. The theory of human capital
assumes that schooling enhances the capacity of workers to be productive.
5.5 Unemployment status of young people in the Eastern Cape
Young people who are unemployed and disengaged from both work and education do not share the same
status or swim in the same pool (Furlong, A.,2006). Fortunately, QLFS data from Stats SA allows unemployed
people to be categorised in different sub-groups, also refers to as unemployment status15, like: Job loser, Job
15 • Job losers: refers to unemployed persons who were working when they became unemployed and had lost their job; they were laid off; the business in which they had previously worked had been sold or had closed down.
• Job leavers: refers to unemployed persons who were working when they became unemployed and had stopped working at their last job for any of the following reasons: Caring for own children/relatives; Pregnancy; Other household/community responsibilities; Going to school; Changed residence; Retired; or Other reasons. • New entrants: refers to unemployed during the reference period, that had never worked before and that were currently looking for work. • Re-entrants: refers to unemployed persons who worked before and who were currently looking for work, and whose main activity before looking for work was any of the following: managing a home; going to school; other reason. • Other unemployed persons who last worked more than 5 years ago.

20
leaver, New entrant, Re-entrant, and Other who last worked more than 5 years ago. These peculiarities are
important as each status necessitates a unique strategic intervention. Table 9 shows that the majority of youth
NEET 72.2% never worked before, and therefore, falls under the category of new entrant. This is the group
that require more attention for effective youth-orientated policy. It is obvious that programs designed to
integrate new entrant should differ from that designed for job leaver.
Table 9. Unemployment Status of NEET
3Q2015 1Q2020 2Q2020 3Q2020
Number % share Number Number Number % share
Job loser 100 356 10.0% 103 098 96 980 111 635 9.8%
Job leaver 29 989 3.0% 20 692 25 030 26 079 2.3%
New entrant 676 497 67.7% 844 239 853 640 821 828 72.2%
Re-entrant 134 037 13.4% 94 194 173 927 104 910 9.2%
Other - last worked >5 years ago 58 307 5.8% 80 335 70 582 74 298 6.5%
Total 999 187 100.0% 1 142 559 1 220 159 1 138 750 100.0%
Source: Statistics South Africa (2020), Own calculations derived from Quarterly Labour Force Surveys
6. Government youth policy and initiatives & NEET policy responses
6.1 Government youth policy and initiatives
The country has initiated several youth programs with one common objective in mind, to address
unemployment among the young people and unlock their full potential. The aim of this study is not to analyse
youth policy or youth program. This section highlights very briefly selected youth programs, and government
youth policy.
• The National Youth Policy (NYP 2015-2020)
The policy acknowledges that large portions of youth are not in education, employment, or training. The
NYP advocates that involvement in re-integration of marginalized youth NEET groups, through second
chance measures and other supportive actions is a good strategy, and it must use multi-sectoral approach
that involves all spheres of society. The policy places employment creation at the center of all youth
development interventions.
• Harambee: it means “all pull together"
Harambee Youth Employment Accelerator helps thousands of young South Africans get the skills required
to get and keep a job. Harambee strives to find young people's jobs through numeracy and literacy
screening; and to determine which sector they will be better suited to. Harambee accomplished this goal
by linking employers searching for entry-level talent to young, high-potential jobseekers who are currently
shut out of the formal economy.
• National Youth Development (NYD):
The NYD was initiated by the National Youth Development Agency in 2009 to bring the Integrated Youth
Development Strategy (IYDS) into effect. This was primarily aimed at ensuring that youth employment
grows in government and in private sector. Again, one wonders where these policy mechanisms have
botched to resolve the alarming rate of unemployed graduates.

21
• National Treasury’s youth grant (2011).
The National Treasury acknowledged that the high rate of youth unemployment is due to a lack of demand
in the labour market to address the increasing number of young job seekers. It was then that the idea for
a youth grant came forward. The goal of the youth employment grant was primarily to build jobs for young
people. Whether its introduction has resulted in a reduction in jobs needs a further investigation.
• Youth Employment Service (YES) Programme
The “YES Programme” is particularly targeted at black youth. It defines the youth employment service as
“a business-led collaboration with government and labor. The objective of “YES Program” is to stimulate
demand side job creation through company investment and by leveraging government’s existing
recognitions such as the Employment Tax Incentive and BBBEE recognition for broad-based
transformation”. The YES programme has three main focus areas, namely,
(1) Creating new job opportunities in existing firms, jobs intended explicitly for youth.
(2) Promoting the capacity of SMMEs, South Africa’s largest employers for youth labour.
(3) Creating new cohorts of SMMEs, through creative value chain initiatives and knowledge spill over in
collaboration with industry champions.
• The Employment Tax Incentive Act, 26 of 2013
The South African government promulgated the Employment Tax Incentive Act, 2013 aimed at reducing
the employers’ cost in hiring young individuals between the ages of 18 and 29 years. The Act was
presented as a “cost sharing mechanism between the private and public sectors”
• The Extended Public Works Programme (EPWP)
The purpose of this programme was to employ large numbers of poorly educated youth who would
otherwise be unemployed by government. It is implemented by government departments based on
funding from the fiscus. Some scholars have criticized the programme as lacking the skilled manpower to
provide youth with training that equips them for meaningful employment
6.2 NEET policy responses
What are the policy responses towards the NEETs? What types of intervention and policy measures are needed
to address people in NEET? And what policy lessons can we learn from these interventions? Let us start by
highlighting the preliminary steps towards developing a NEET policy.
Initial steps in developing NEET policy measure should consist of the following (Eurofound, 2012):
(1) Identify the excluded groups of young people,
(2) Identify the most vulnerable sub-group and investigate the root cause of their vulnerability, and then
intervening with the most effective type of support,
(3) Identify the main determinants and risk factors for being a NEET, and come up with targeted policy
interventions
After the diagnostic vulnerable sub-groups, it is important to know the type of policy responses for
implementation purposes.

22
6.2.1 There are three type of policy responses.
The aim of NEET policy responses two-folds. Firstly, it is to reintegrate young people into education, training,
and the labour market. Secondly, it is to address the issue of social exclusion.
The three main type of policy responses are:
• Prevention policies. The aim of preventative measures is to tackle young people’s risk of exclusion from
education and training or the labour market before such exclusion takes place. Preventing the long-term
negative effects of dropping out of the education system appears to be the most effective way to tackle
the NEETs issue. It helps to avoid an uncontrolled increase in the number of young people becoming NEETs
and to break the cycle of social exclusion among the youth.
• Reintegration policies. Also refers to as “employability policies” which aim at supporting young people re-
entering the educational system or the labour market. Reintegration policy is achieved through “Active
Labour Market Programmes” (ALMPs)16
• Compensation policies. Also called “social inclusion strategy” which focus mainly on social assistance to
marginalised subgroups. The policy aims at tackling the most extreme situations, where reintegration
seems to be particularly difficult and social assistance measures appear as the last resort in alleviating
exclusion.
NEET policy requires a participatory and coordinated action plan involving families, early child educators,
schools (especially secondary and vocational schools), training providers, public employment services, youth
organisations, private sector, etc. to ensure early tracking of disengagement and provide ample intervention.
6.2.2 NEET Policy interventions
Based on international experience, the following action plan recommended by the European Commission
(2015: 75) provides a checklist that policy makers can use for enhancing the inclusion of NEETS.
Policy makers involved in Youth NEET should:
1. Ensure regular collection and analysis of information and data on who are included in the NEET groups
(disaggregated by sub-groups) and the reasons for their becoming NEETs.
2. Target policy measures on single sub-groups of NEETs based on sound evidence of the reasons for their
exclusion, for example young women.
3. Promote integrated strategies to protect young people from exclusion and discrimination,
4. Develop partnerships and cooperation among all relevant actors and institutions and allow different
stakeholders to play a role in the design and implementation of policies.
5. Promote decentralisation of competences from central to local authorities to allow a more participatory
and sustainable approach in education and TVET provision and employment matters.
6. Design integrated programmes that combine several elements, such as training, work experience, life
skills, jobs subsidies and wider anti-discrimination measures.
7. Ensure that monitoring and evaluation of policies are embedded in the system and are used to improve
future interventions to support the inclusion of NEETs.
Below are NEET policy interventions or strategic measures recommended by the Counsel of European Union
(2013). These policy recommendations are also applicable to the Eastern Cape.
16 ALMPs include job search assistance; counselling and placement services; labour market training and retraining; employment subsidies (hiring incentives for the private sector); self-employment and entrepreneurship support; public works and community services, specific training programmes including internships, traineeships, public works and incentives for employers

23
6.2.2.2 Prevention measures
a. Invest as much as possible in early intervention through developing good quality education for all at
primary and secondary levels
b. Reduce early school leaving by creating open and alternative pathways through education, fostering
innovative teaching methods and providing good-quality TVET.
c. Develop early warning systems for detecting pupil disengagement, especially for at-risk groups, so that
every young person acquires at least an upper secondary qualification.
d. Encourage and widen the access of drop-outs to second-chance education opportunities and promote the
acquisition of skills and competences that meet labour market needs.
e. Increase access to career guidance and harnessing the potential of the internet, social networks while
also ensuring that these services are gender sensitive.
f. Improve Public Employment Services (PES) to provide tailor-made individual support at an early stage,
making sure that services are adapted to the needs of vulnerable young men and women. Promote gender
equality and anti-discrimination actions.
g. Develop mechanisms for the validation of non-formal and informal learning, which enable individuals to
make use of their learning in terms of career progression and further learning.
6.2.2.3 Reintegration measures
a. Promote work-based learning schemes such as apprenticeships, internships and traineeships, and involve
private-sector enterprises and youth organisations in these programmes.
b. Develop more systematic Active Labour Market Programmes (ALMPs), particularly more human-capital-
based interventions, which have higher positive impacts in both the medium and long term.
c. Establish comprehensive entrepreneurship support systems in schools and universities for young
entrepreneurs, including specific training, mentoring and access to finance.
d. Promote reconciliation between work and private and family life for women through such measures as
part-time work, parental leave, telework, e-work, and providing childcare and elderly care facilities.
e. Make labour markets more ‘youth/women friendly’ by eliminating barriers to labour market entry.
f. Make a systematic monitoring and evaluation of ALMPs and their beneficiary groups to improve future
interventions and targeting.
6.2.2.4 Compensation measures
a. Combine social assistance programmes with human capital investments to help economically and socially
vulnerable groups of young people avoid exclusion.
b. Train teachers in specific competences regarding social inclusion techniques and encourage the
implementation of social inclusion practices in schools.
c. Accept that fighting social exclusion is a long-term and costly intervention requiring joint actions and
holistic approaches;
d. Conduct regular monitoring and evaluation of social assistance programmes and their beneficiaries with a
view to improving their situations.
e. Developing more qualitative, effective, labour market-relevant and balanced education and training
systems is essential to tackle the issue at source.

24
Conclusion
The aim of this study was to provide a detailed understanding of the composition and characteristics
of young people not in employment, education, or training institutions in the Eastern Cape. It sought
to provide a synopsis of NEETs profiles, explore the diversity of youth NEET, and unpack the
heterogeneous nature of the youth NEET sub-group so that their different needs and traits can be
taken into consideration in designing labour and youth policies. An attempt was made to respond to
various policy questions, such as, what are the determinants and risk factors for being NEET; why the
province has high prospects of becoming NEETs; What are underlying reasons that keep young people
out of education, training, and employment; What is the labour market status of NEETs; and What
are NEET policy responses that can be implemented in the province to better unlock youth potential
and allow their integrate (re-integration) into the labour market and/or into education institutions.
The main finding of the study was a growing number of youth NEET amidst a shrinking youth
population. The study highlighted that high rates of youth NEET and high out-migration experienced
in the Eastern Cape has had adverse effects on the provincial fiscus, labour, economic growth, and
other developmental indicators. It also found that the province had the highest number of
unemployed young people in the country, and the highest number of vulnerable youth in South
Africa.
Most key findings in this study correlate with study results by the OECD (2020). For example, this
study found that the majority of youth NEETs in the Eastern Cape are unemployed; Female;
Back/Africans; and with “secondary not completed” level of education. Age had a nonlinear effect of
NEET.
Contrary to ILO (2015) findings, according to which education has protective effects against being in
NEET; this study showed that due to the current economic meltdown and COVID-19 pandemic, the
positive effect of education in lowering the numbers of NEETs in the Eastern Cape is not hundred
percent guaranteed.
Young NEETs are at high risk of drifting into long-term unemployment, social exclusion and
deprivation, poverty, and poor human capital. Hence, the study proposed three main policy
interventions. The aim of NEET policies is to reintegrate young people into education, training, and
the labour market; and, to address the issue of youth social exclusion. These NEET youth policies are:
“Prevention Policy” (preventive measures with pro-active interventions); “Reintegration Policy”
(intervention to integrate youth into education and labour market); and “Compensation Policy” (a
Social Security Net intervention that targets vulnerable youth sub-groups withing the NEET.
It is anticipated that findings from this study will contribute to current policy debates in the country
and in the province, especially the National Youth Policy (NYP 2015-2020) & Eastern Cape Youth
Policy; the National & Provincial Youth Development Plans; the Provincial Development Plan (EC
PDP), Harambee, and other provincial labour policy developments.

25
References
Bynner, J. and Parsons, S., (2002) ‘Social exclusion and the transition from school to work: The case of young people not in education, employment or training’, Journal of Vocational Behaviour, Vol. 60, No 2, 2002, pp. 289–309 Chen, Y.-W. (2011). Once a NEET always a NEET? Experiences of employment and unemployment among youth in a job training programme in Taiwan. International Journal of Social Welfare, 20(1), 33–42. Council of the European Union (2013), Council conclusions on enhancing the social inclusion of young people not in employment, education or training, Brussels, November 2013. Council of the European Union, ‘Council recommendation of 22 April 2013 on establishing a Youth Guarantee’, Official Journal of the European Union, C 120, Luxembourg, 2013b, pp. 1–6. Department of Higher Education and Training. (2017). FACT SHEET ON “NEETs”, Persons who are not in employment, education or training. European Foundation for the Improvement of Living and Working Conditions. (Eurofound ,2016), Exploring the diversity of NEETs, Publications Office of the European Union, Luxembourg. European Foundation for the Improvement of Living and Working Conditions (Eurofound, 2012). NEETs: Young people not in employment, education or training: Characteristics, costs and policy responses in Europe (Dublin) ETF (2015), The challenge of youth employability in Arab Mediterranean countries: The role of active labour market programmes, Publications Office of the European Union, Luxembourg, 2015e. Last accessed 13 September 2015 at: www.etf.europa.eu/web.nsf/pages/Youth_employability_AMCs Elder, S., ILO school-to-work transition survey: A methodological guide. Module 4 – Key indicators of youth labour markets: Concepts, definitions and tabulations, International Labour Office, Geneva, 2009. Last accessed 13 September 2015 Furlong, A. (2006). Not a very NEET solution: representing problematic labour market transitions among early school-leavers”, in Work, Employment and Society, Vol. 20, No. 3, September Henderson, J. L., Hawke, L. D., Chaim, G., & Network, N. Y. S. P. (2017). Not in employment, education or training: Mental health, substance use, and disengagement in a multi-sectoral sample of service-seeking Canadian youth. Children and Youth Services Review, 75, 138–145 International Labor Office. (ILO, 2015). Global employment trends for youth 2015: Scaling up investments in decent jobs for youth. International Labor Organization, Geneva. International Labor Office (ILO, 2015) Global employment trends 2014: Risk of a jobless recovery?, International Labour Office, Geneva, 2014a. http://www.dispatch.co.za/pregnant-girls-abandon-school/ Mlatsheni, C. (2014). Youth unemployment and the transition from school to work in Cape Town. Thesis towards Doctor of Philosophy. University of Cape Town Ranzani, M., & Rosati, F. C. (2013). The NEET trap: A dynamic analysis for Mexico. Background Paper for the WDR

26
OECD (2020), Youth not in employment, education or training (NEET) (indicator). doi: 10.1787/72d1033a-en (Accessed on 05 September 2020) Sarah, E. (2015). What does NEETs mean and why is the concept so easily misinterpreted Statistics South Africa. (2020). Quarterly labour force survey. Statistics South Africa. Statistics South Africa. (2020). Mid-year population estimates. Statistics South Africa. Tamesberger, D., & Bacher, J. (2014). NEET youth in Austria: a typology including socio-demography, labour market behaviour and permanence. Journal of Youth Studies, 17(9), 1239–1259 Yates, S., & Payne, M. (2006). Not so NEET? A critique of the use of “NEET” in setting targets for interventions with young people. Journal of Youth Studies, 9(3), 329–344.