exploring pre-service elementary science teachers ... · coherent answers to the items on the pnmt...
TRANSCRIPT

International Journal of Education in Mathematics, Science and Technology
Volume 5, Number 3, 2017 DOI:10.18404/ijemst.296036
Exploring Pre-Service Elementary Science Teachers’ Conceptual
Understanding of Particulate Nature of Matter through Three-Tier
Diagnostic Test
Mehmet Aydeniz, Kader Bilican, Zubeyde Demet Kirbulut
Article Info Abstract Article History
Received:
29 January 2016
The purpose of this study was to explore Pre-service Elementary Science
Teachers‟ (PSTs) conceptual understanding of Particulate Nature of Matter
(PNM) through a three-tier diagnostic test. Participants were 215 PSTs from
Turkey. Data consisted of participants‟ responses to the Particulate Nature of
Matter Test (PNMT). The PNMT consists of three-tier items. Students were
asked to choose the correct choice in the first tier, and then to justify their choice
of the answer provided in the second tier. Finally, they were asked to indicate the
confidence level of their responses in the third tier. Results showed that the PSTs
were not competent in their understanding of the PNM concepts. Moreover,
some had strongly held misconceptions. Finally, the PSTs struggled to provide
coherent answers to the items on the PNMT across three tiers.
Accepted:
16 November 2016
Keywords Elementary science
learning
Assessment
Pre-service teachers
Three-tier test
Introduction
One of the challenges of assessing students‟ conceptual understanding in science is the scarcity of reliable
assessment tools and methods (Briggs, Alonzo, Schwab, & Wilson, 2006; Caleon & Subramaniam, 2010; Chu,
Treagust, & Chandrasegaran, 2009; Hudson & Treagust, 2013; Kirbulut & Beeth, 2014). Historically, educators
have attempted to measure students‟ conceptual understanding in science through multiple-choice assessments,
with a single correct answer choice and two or more incorrect options (Linn & Gronlund, 2000; Treagust, 1986).
The assumption behind these assessments is that by giving students the opportunity to eliminate the distracting
answer choices, and measuring students‟ ability to identify the correct answer choice, one can gather reliable
information about students‟ conceptual understanding of the target scientific ideas (Briggs et al., 2006; Kirbulut
& Beeth, 2014). While these assessments have been widely used in science education, they have been heavily
criticized in recent years. These assessments have been criticized because they have certain limitations in
helping educators to access and understand students‟ reasoning behind their answer choices (Pesman &
Eryilmaz, 2010; Tan, Goh, Chia, & Treagust, 2002; Voska & Heikkinen, 2000). Critics who have voiced their
concerns about the limitations of multiple-choice assessments, developed, used and promoted the use of such
assessment tools as open-ended questionnaires (Khalid, 2003) and interviews (Griffiths & Preston, 1992;
Osborne & Gilbert, 1980) to assess students‟ conceptual understanding.
Although these assessment tools give students opportunity to elaborate on and justify their responses, they have
several drawbacks (Adadan & Savasci, 2012; Briggs et al., 2006; Kirbulut & Beeth, 2014; Tan et al., 2002).
First, scoring student responses to open-ended questions takes significant amount of time, which many teachers
lack, especially if they are teaching large classes and assessing students‟ understanding frequently (Briggs et al.,
2006). Second, while it is true that student responses to open-ended questions or interviews can provide more
reliable information about student thinking and knowledge structure, it is hard to get a comprehensive
evaluation of students‟ cognitive structure related to core scientific ideas (Briggs et al., 2006; Wang, 2004).
More precisely, due to time it takes to answer, it is difficult to administer as many questions as necessary, thus
to gather a wide range of information on students‟ knowledge structure related to the topic of interest (Haladyna,
1997).
To overcome the limitations of multiple-choice tests, and the challenges of using tools such as interviews and
open-ended questions, science educators have developed a new model of assessment called two-tier tests
(Haslam & Treagust, 1987; Hudson & Treagust, 2013; Odom & Barrow, 1995; Sia, Treagust, &

222 Aydeniz, Bilican & Kirbulut
Chandrasegaran, 2012; Tamir, 1989; Tan et al., 2002; Treagust, 1986; Voska & Heikkinen, 2000; Wandersee,
1983). These types of assessments are advantageous because they ensure the reliability and efficiency of
multiple-choice assessments, as well as the capability to diagnose student understanding and reasoning at a
deeper level. However, since two-tier tests do not discriminate students‟ lack of knowledge from the
misconceptions they hold, educators have come up with three-tier tests, tests that include an additional tier
checking on students‟ confidence level in their responses to addres this issue (Arslan, Cigdemoglu, & Moseley,
2012; Caleon & Subramaniam, 2010; Kiray, Aktan, Kaynar, Kilinc & Gorkemli, 2015; Kirbulut & Beeth, 2014;
Pesman & Eryilmaz, 2010).
While both students‟ and PST‟s understanding of particulate nature of matter has been studied by several
science educators (Banda, Mumba, Chabalengula, & Mbewe, 2011; Nakhleh, Samarampungavan, & Saglam,
2005; Özalp & Kahveci, 2015; Özmen & Kenan, 2007; Yezierski & Berk, 2006), only few of these studies have
used two-tier or three-tier assessments in their attempts to measure the PST’s conceptual understanding of the
PNM. We focused on the PST‟s conceptual understanding of the PNM, because this topic is taught first at the
elementary school and thus the most relevant topic for pre-service elementary science teachers. Similarly,
science education literature has reported problems with pre-service and in-service science teachers’ conceptual
understanding of the PNM (Chang, 1999; De Jong, Van Driel, & Verloop, 2005; Haidar, 1997; Kahveci, 2009;
Özalp &Kahveci, 2015; Özmen, Ayas, & Coştu, 2002; Tatar, 2000; Valanides, 2000). Therefore, an
investigation of pre-service elementary science teachers’ conceptual understanding of the PNM merits further
exploration. In this study, we used a three-tier diagnostic test to assess the PST‟s understanding of particulate
nature of matter.
Review of Relevant Literature
Pre-service science teachers‟ and students‟ conceptual understanding of the PNM has become subject of
scholarly investigations for quite sometimes. We discuss a few of these studies in this section. For example,
Valanides (2000) investigated pre-service teachers‟ understanding of the macroscopic and microscopic
properties of matter. The results of Valadines‟s study showed that majority of the pre-service teachers exhibited
limited understanding of the particulate nature of matter. More specifically, they failed to understand the
connection between the observable macroscopic changes in matter and the interactions between atoms and
molecules at the microscopic level. They also failed to understand how molecules in solutions moved in relation
to one another and how they molecules are held together in solutions and gaseous state.
Kahveci (2009) conducted a study with pre-service chemistry teachers in Turkey in which she challenged pre-
service teachers to reason about the particulate nature of matter at sub-microscopic level. She found that nearly
half of the first year and 20–26% of the fourth and fifth (final) year students could not differentiate between an
element and a compound illustrated at sub-microscopic level. Kahveci reasoned that pre-service chemistry
teachers develop these misconceptions mainly because they are taught through teacher-centered instructional
methods. These methods are not effective at helping students develop meaningful and robust conceptual
knowledge. As a result, students end up developing misconceptions. She further argued that if we want pre-
service chemistry teachers to develop robust, scientifically accurate knowledge of chemical concepts, we need
to adopt effective instructional methods such as inquiry-based instruction.
Özalp and Kahveci (2015) conducted a study in which they investigated middle and high school students‟
conceptual understanding of the PNM through an instrument that consisted of 25 distractor-driven, multiple-
choice items: fifteen of which were two-tier and 10 were one-tier diagnostic items. They reported several
misconceptions held by the students. Some of the reported misconceptions were: „since ice is solid its
molecules are solid and since water is liquid its molecules are liquid‟, “since iron heats during it melts, its atoms
also heat and so atoms melt and their volume increases”, “water molecules break up into oxygen and hydrogen
atoms when water evaporates”. The prevalence of these misconceptions among primary and high school
students suggests that teachers themselves might hold onto the same misconceptions. Lemma (2013) reported
such a connection between Ethiopian science teachers and their students. Lemma (2013) studied 192 8th grade
Ethiopian students‟ and their six teachers‟ conceptual understanding of particulate nature of matter using a
multi-tiered assessment. She found that 50% of the teachers and 79.16% of the students considered bubbles
from boiling water as gases like oxygen, hydrogen, and carbon dioxide. Moreover, she found that 33.34% of the
teachers and 50% of the students held the misconception that water molecules change to air when they
evaporate.

223
Int J Educ Math Sci Technol
Collectively, the results of these studies suggest that: 1) both teachers and students harbor several
misconceptions related to the particulate nature of matter, 2) teachers‟ can pass their misconceptions onto their
students, 3) two-tier multiple-choice items provide an in-depth understanding of learners‟ thinking, thus allows
educators to identify and address learners‟ misconceptions through effective interventions such as inquiry-based
instruction. While all of these studies have used one or another form of two-tiered assessments, none has used
three- tiered assessments.
In this study, taking the advantages of three-tier test into consideration, we used a three-tier diagnostic test to
assess the PST‟s conceptual understanding of the particulate nature of matter. The research questions guiding
our inquiry were:
1. How competent are pre-service elementary science teachers (PSTs) in understanding particulate nature of
matter concepts?
2. How consistent are the PST‟s answers in the Particulate Matter of Nature Test (PNMT) across three tiers?
3. What are the strongly held misconceptions about the particulate nature of matter by the PSTs?
Method
This is a descriptive quantitative study, goal of which is to reliably measure a particular phenomenon and
develop assertions that can potentially be generalizable to the whole population (Creswell, 2012). In this study,
we measured Turkish PSTs‟ conceptual understanding of the PNM through a three-tier assessment to identify
the PST misconceptions.
The sample was drawn from the elementary science pre-service teachers from second tier universities in Turkey.
This study took place at four regional universities in Turkey. These are the universities that have been
established within the last 20 years and with a heavy focus on teaching with relatively limited research facilities
for basic sciences. The participants of the study were 215 PSTs enrolled in four science teacher education
programs at four state universities in Turkey. Of the 215 total participants, 89 were sophomores (3rd year) and
of 126 were junior (2nd year) students, 165 females and 50 males. All participants had similar background in
science content based on the number of mandatory science courses taken in their program areas. The elementary
science education program requires students to take 92 mandatory course credits. Of these, 45 credits consist of
content courses, such as fundamentals of physics, chemistry, and biology. The participants had taken these
science courses in their first and second year of the elementary science education program. These fundamental
science courses consisted of two parts: lectures that focus on relevant theories of the science field and laboratory
that focus on hands-on lab investigations.
Data Collection
Data consist of the PSTs‟ responses to the PNMT (see Appendix A and Kirbulut & Beeth, 2014 for the
instrument). The PNMT consists of three-tier items. Students are asked to choose the correct choice in the first
tier, and to justify their choice of the answer with a blank space where students are asked to write an explanation
of their reasoning if different from the given reasons is presented in the second tier. Finally, they are asked to
indicate their confidence in their responses using a scale ranging from 1-7. The PNMT examines the conceptual
areas of Charles Law (3 items), Boyle Law (2 items), Gay-Lussac Law (2 items), conservation of matter (2
items), evaporation (3 items), condensation (2 items), boiling (3 items), and vapor pressure (2 items). The
Cronbach alpha reliability coefficient was estimated to be .78 for the PNMT. Participants were informed of the
purpose of the study and their consent was sought prior to data collection. Then, the PNMT was administered to
the participants at the end of spring semester. They were not given time or instructions to study before they were
asked to take the test. They used an entire class period (45 minutes) to complete the test. A sample question
from the PNMT is presented below.
1.1 When an amount of water is boiling, you see bubbles coming from the boiling water. What do you think
that the bubbles are made of?
A) Air
B) Oxygen gas
C) Oxygen and hydrogen gas
D) Water vapor

224 Aydeniz, Bilican & Kirbulut
1.2 Which one of the followings is the reason of your answer for the previous question?
A) When water evaporates, it breaks into oxygen and hydrogen gas.
B) There is air in water and bubbles are made of air.
C) When water evaporates, the distance between water molecules increases.
D) ………………………………………………………………………………..
1.3 How sure you are about your answers for the previous two questions?
Unconfident Confident
Confidence Rating: 1 2 3 4 5 6 7
Data Analyses
We used quantitative techniques in analyzing the data. We primarily relied on frequency and percent analyses in
reporting our results. Our analyses focused on calculating students‟ correct answers across three tiers of items.
Tier I scores were created by using student answers to the first tier of items, students‟ correct answers were
coded as 1 and others were coded as 0. Tier II scores were calculated based on student responses to the first and
second tiers of items. When student answers to both the first and the second tier of items were correct, they were
coded as 1, otherwise 0.
Tier III scores were calculated based on student answers to all three-tier items. The third tier is the confidence
tier. When student answers to the first two tier of items were correct, and his/her confidence level was above 4
on a 1-7 scale, they were coded as 1; otherwise 0 (Turker, 2005). The PSTs‟ overall test scores and descriptive
statistics were calculated using Microsoft Excel. The maximum possible score for the PNMT is 19. After we
calculated frequencies of correct responses for the first tier, the second tier and the confidence tier, we
calculated the percentages of students who performed correctly at each tier to compare their answers‟
consistency across all tiers.
We also calculated misconception scores for all tiers based on the list of identified misconceptions presented in
Appendix B. While calculating misconception scores, we used a three variable-misconception framework: first-
tier, both-tier, and all-tier scores. The first-tier misconception score was produced based on a student‟s answer
for the first tiers of the items which constitute related misconceptions as indicated in Appendix B. When a
student‟s answer to the first tier was a misconception, it was coded as 1; otherwise 0. The both-tier
misconception score was created according to a student‟s answer to the both the first and the second tiers for
each misconception. When a student‟s answer to both tiers was a misconception as indicated in Appendix B, it
was coded as 1; otherwise 0. Misconception all-tier was created based on a student‟s answer to all tiers for each
misconception in Appendix B. When a student‟s answer to both tiers was misconceptions and when a student
was confident about his/her answers, it was coded as 1; otherwise 0.
Results
The PST‟s test scores on the PNMT showed that they are not competent in understanding the PNM. The
percentage of the PSTs who correctly answered all item tiers ranged from 0.9 to 43.3 (Please see Table 1).The
maximum score of the PNMT was 9.0 and the minimum score was 0.0. The mean scores of the PNMT were 2.9
with 2.1 standard deviation.
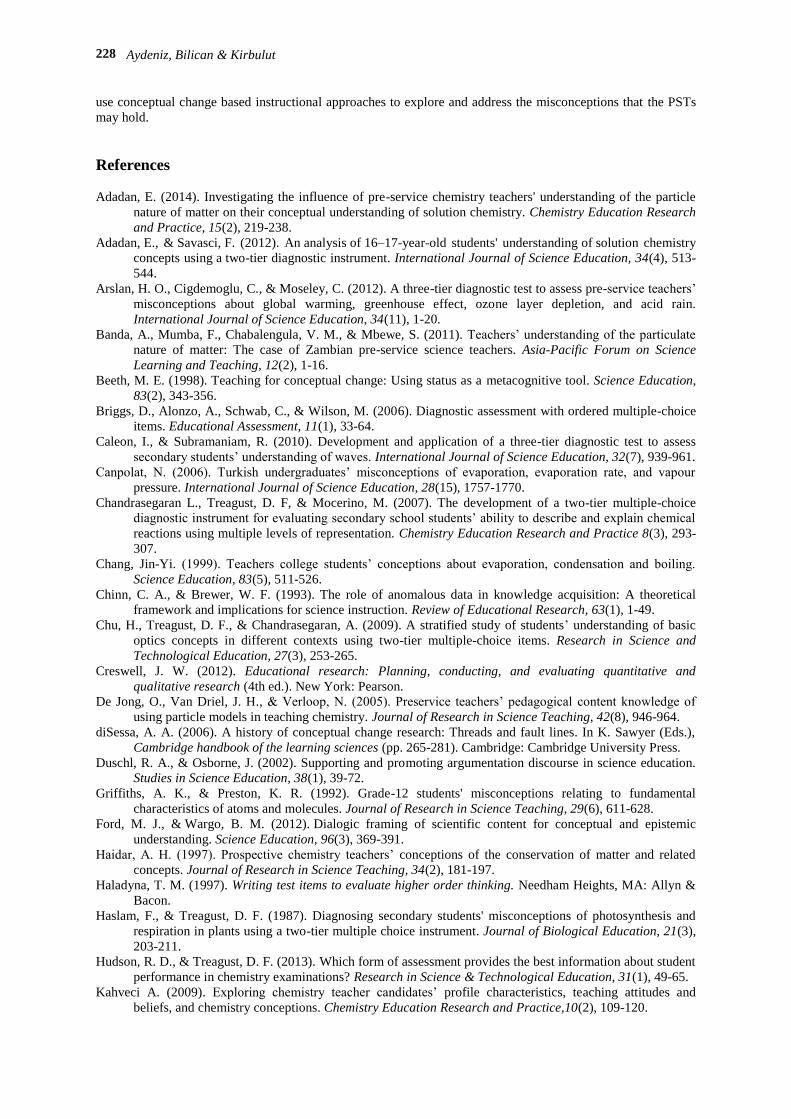
Results showed that the PSTs struggled to provide consistent answers across all tiers. Participants performed
well only on two questions: Q1 (90.2%) and Q5 (81.4%) at the first tier. They performed fairly well on five
questions: Q3 (54.9%), Q4 (47.9%), Q9 (50.7%), Q12 (61.4%) and Q13 (48.4%) and they performed poorly or
very poorly on 12 questions that were on the PNMT. Meaning less than 45% of the participants were able to
answer these questions. When participants were challenged to justify their answers in the second tier, even those
who performed well on the first tier items, failed to show the same performance.
The percent of students who answered Q1 correctly dropped from 90.2% to 23.3% at the second tier, from
81.4% to 13.5% for Q5. Furthermore, only 19.1% of the participants felt confident about their answers to Q1
and 9.5% about their answers to Q5. Participants‟ performance on other questions varied; however, this trend
among the first tier, second tier, and confidence tier continued to be the same across all questions.

225
Int J Educ Math Sci Technol
Table 1. Summary of students‟ performance for the PNMT (%)
Question# Tier III
Q1 9.3
Q2 10.7
Q3 43.3
Q4 24.7
Q5 13.0
Q6 1.9
Q7 27.4
Q8 0.9
Q9 18.6
Q10 6.9
Q11 18.1
Q12 25.1
Q13 16.7
Q14 7.9
Q15 2.8
Q16 5.6
Q17 7.4
Q18 23.7
Q19 22.3
Participants performed very poorly on nine questions (i.e. Q2, Q6, Q7, Q10, Q11, Q14, Q15, Q16, and Q17,
even at Tier I). They performed poorly on six questions (i.e. Q4, Q8, Q9, Q13, Q18 and Q19). No matter how
well or how poor students performed on the first tier of the questions, the PSTs did not provide consistent
answers across all tiers. The PSTs struggled to justify the responses that they provided in the first tier.
Moreover, the majority of the PSTs did not feel confident in their responses. (Please see Table 2 for details).
Table 2. Summary of students‟ competency across question tiers (%)
Question# First Tier Second Tier Confidence Tier
Q1 90.2 23.3 19.1
Q2 22.3 11.2 7.9
Q3 54.9 46.0 38.6
Q4 47.9 32.6 19.1
Q5 81.4 13.5 9.8
Q6 6.0 2.8 1.9
Q7 37.2 29.3 23.7
Q8 42.3 35.3 25.6
Q9 50.7 22.8 14.4
Q10 21.9 7.9 5.6
Q11 29.8 10.7 16.3
Q12 61.4 31.6 20.5
Q13 48.4 23.7 13.5
Q14 28.4 10.7 6.0
Q15 28.4 7.9 4.7
Q16 19.5 8.4 4.2
Q17 28.4 8.4 5.6
Q18 40.0 28.8 18.6
Q19 42.3 24.2 20.9

226 Aydeniz, Bilican & Kirbulut
Figure 1. Participant performance across question tiers
Our analyses also revealed that the PSTs held several misconceptions ranging from „Vapor or gas has no
weight‟ to „When the gas pressure increases, the weight of the gas also increases‟ (see Appendix B). We
summarize the prevalence of each of the misconceptions reported in Appendix B for each tier in Table 3. Tan et
al. (2002) reported that misconceptions that are selected by at least 10% of the sample could be considered as
strongly-held misconceptions. Table 3 shows that there were eight (misconceptions 2, 3, 7, 14, 16, 17, 18 and
20) strongly-held misconceptions.
Table 3. The percentages of misconceptions for the first-tier, both-tier, and all-tier scores
Misconceptions Percentages of Misconceptions
Misconception first-tier Misconception both-tier Misconception all-tier
Misconception1 48 11 9
Misconception 2 76 26 24
Misconception 3 45 13 11
Misconception 4 28 1 1
Misconception 5 16 7 5
Misconception 6 20 10 7
Misconception 7 47 23 19
Misconception 8 38 8 5
Misconception 9 37 10 9
Misconception 10 31 6 4
Misconception 11 23 6 5
Misconception 12 30 7 5
Misconception 13 30 7 6
Misconception 14 39 15 12
Misconception 15 14 3 2
Misconception 16 54 20 17
Misconception 17 32 24 20
Misconception 18 34 20 17
Misconception 19 37 4 3
Misconception 20 33 14 10
*Percentages indicate the percentage of sample that held that particular misconception
0,0
10,0
20,0
30,0
40,0
50,0
60,0
70,0
80,0
90,0
100,0
Q1
Q2
Q3
Q4
Q5
Q6
Q7
Q8
Q9
Q10
Q11
Q12
Q13
Q14
Q15
Q16
Q17
Q18
Q19
Per
cen
t C
orr
ect
Questions
Participants' Performance Across Questions
Tier1
Tier2
Tier3

227
Int J Educ Math Sci Technol
Discussion and Conclusion
Science educators have investigated students‟ and teachers‟ conceptual understanding of various scientific ideas
for quite sometimes (Adadan, 2014; Kahveci, 2009; Özmen et al., 2002). Researchers conducting conceptual
change studies have identified several misconceptions in different domains of science among students and
teachers (Canpolat, 2006; Chinn & Brewer, 1993; diSessa, 2006; Peterson, Treagust, & Garnett, 1986; Songer &
Mintzes, 1994; Tytler, 2000). Despite the progress achieved in misconception studies, effective identification of
students‟ misconceptions continues to be an area of concern (Briggs et al., 2006). In this study, we explored the
power of a three-tiered assessment in identifying the PST misconceptions related to the PNM.
Exploring the PSTs‟ misconceptions related to the PNM is important because, the PNM makes up the majority
of science curriculum at the elementary school level. Therefore, it is important that the PSTs develop a coherent
and scientifically accurate conceptual understanding of the PNM. One way to assure that the PSTs develop such
knowledge is by reliably measuring their conceptual understanding of the PNM. In this study, we measured the
PSTs‟ conceptual understanding of the PNM through a three-tier assessment. Three-tier assessments provide
more reliable information about students‟ level of understanding because they force students to justify their
answers; thus allowing teachers to judge whether students can support their answers with confidence (Adadan &
Savasci, 2012; Chandrasegaran, Treagust, & Mocerino, 2007; Tan et al., 2002; Wang, 2004). The results from
this study along with the results reported in similar studies (Odom & Barrow, 1995) confirm this claim.
The PSTs‟ answers to the three-tier test provided an in-depth understanding of learners‟ cognitive structure
related the structure of matter, thus allowing us to detect the PSTs‟ misconceptions related to the PNM. The
PNMT scores revealed that the PSTs did not have sufficient conceptual understanding of the PNM. Participants
showed several misconceptions such as „Vapor or gas has no weight‟ and „When the gas pressure increases, the
weight of the gas also increases‟ in their responses to the PNMT. Moreover, the results showed that the PSTs
had some strongly-held misconceptions. Also, regardless of participants‟ performance on tier I items, they
showed inconsistency in their responses for tier II and tier III. That is, they mostly could not provide valid
justifications for their responses in tier I and they did not feel confident in their responses to the PNMT items.
In short, current research provided evidence for the PSTs‟ misconceptions of the PNM as well as identifying the
way of the PSTs‟ justifications behind their thinking allowing the science educators to map an effective route to
overcome these alternative conceptions.
Recommendations
The majority of the PSTs failed to correctly justify their answers to multiple choice questions asked of them in
the first tier. Furthermore, they also failed to show confidence in their responses even when they answered the
question correctly. While students can recognize the factual scientific knowledge related to the PNM, they could
not elaborate or justify the reasons behind their answers. These findings imply that the instruction that the PSTs
receive in their chemistry content courses is not effective. We need to reconsider the ways in which we teach the
PSTs fundamental science courses, and adopt student-centered instruction methods that engage students in
inquiry-based learning and argumentation. These types of instructional methods are likely to result in better
outcomes because they create a context for meaningful learning, engage students in questioning their own and
their peers‟ knowledge, and bring students‟ ideas under scrutiny (Duschl & Osborne, 2002; Ford & Wargo,
2011) and allow teachers to intervene and address misconceptions or the gaps in students‟ knowledge (Beeth,
1998).
Another implication of this finding for teacher educators is that the results of multiple-choice questions may not
always be a reliable measure of students‟ conceptual understanding. Three-tier assessments should be
incorporated in all assessments throughout the course and not just used for summative purposes. When three-tier
assessments are used in midterm exams, the results can guide teacher educators‟ instructional decisions, at least
in countries where teacher educators teach content courses. While the idea of using three-tier assessments in all
science courses sounds appealing, such assessments are not easily accessible because science educators have not
developed such assessments in the majority of concepts covered in college science content courses. The
challenge waiting science educators is to make a concerted effort: 1) to develop three-tier assessments for
fundamental science concepts and 2) to encourage and motivate college science educators to use these
assessments for both summative and formative purposes. Finally, the prevalence of misconceptions among
science PSTs calls for integration of more effective instructional approaches in science content courses. When
the PSTs take content courses in the college of arts and sciences, we should build on these misconceptions and
228 Aydeniz, Bilican & Kirbulut
use conceptual change based instructional approaches to explore and address the misconceptions that the PSTs
may hold.
References
Adadan, E. (2014). Investigating the influence of pre-service chemistry teachers' understanding of the particle
nature of matter on their conceptual understanding of solution chemistry. Chemistry Education Research
and Practice, 15(2), 219-238.
Adadan, E., & Savasci, F. (2012). An analysis of 16–17-year-old students' understanding of solution chemistry
concepts using a two-tier diagnostic instrument. International Journal of Science Education, 34(4), 513-
544.
Arslan, H. O., Cigdemoglu, C., & Moseley, C. (2012). A three-tier diagnostic test to assess pre-service teachers‟
misconceptions about global warming, greenhouse effect, ozone layer depletion, and acid rain.
International Journal of Science Education, 34(11), 1-20.
Banda, A., Mumba, F., Chabalengula, V. M., & Mbewe, S. (2011). Teachers‟ understanding of the particulate
nature of matter: The case of Zambian pre-service science teachers. Asia-Pacific Forum on Science
Learning and Teaching, 12(2), 1-16.
Beeth, M. E. (1998). Teaching for conceptual change: Using status as a metacognitive tool. Science Education,
83(2), 343-356.
Briggs, D., Alonzo, A., Schwab, C., & Wilson, M. (2006). Diagnostic assessment with ordered multiple-choice
items. Educational Assessment, 11(1), 33-64.
Caleon, I., & Subramaniam, R. (2010). Development and application of a three-tier diagnostic test to assess
secondary students‟ understanding of waves. International Journal of Science Education, 32(7), 939-961.
Canpolat, N. (2006). Turkish undergraduates‟ misconceptions of evaporation, evaporation rate, and vapour
pressure. International Journal of Science Education, 28(15), 1757-1770.
Chandrasegaran L., Treagust, D. F, & Mocerino, M. (2007). The development of a two-tier multiple-choice
diagnostic instrument for evaluating secondary school students‟ ability to describe and explain chemical
reactions using multiple levels of representation. Chemistry Education Research and Practice 8(3), 293-
307.
Chang, Jin-Yi. (1999). Teachers college students‟ conceptions about evaporation, condensation and boiling.
Science Education, 83(5), 511-526.
Chinn, C. A., & Brewer, W. F. (1993). The role of anomalous data in knowledge acquisition: A theoretical
framework and implications for science instruction. Review of Educational Research, 63(1), 1-49.
Chu, H., Treagust, D. F., & Chandrasegaran, A. (2009). A stratified study of students‟ understanding of basic
optics concepts in different contexts using two-tier multiple-choice items. Research in Science and
Technological Education, 27(3), 253-265.
Creswell, J. W. (2012). Educational research: Planning, conducting, and evaluating quantitative and
qualitative research (4th ed.). New York: Pearson.
De Jong, O., Van Driel, J. H., & Verloop, N. (2005). Preservice teachers‟ pedagogical content knowledge of
using particle models in teaching chemistry. Journal of Research in Science Teaching, 42(8), 946-964.
diSessa, A. A. (2006). A history of conceptual change research: Threads and fault lines. In K. Sawyer (Eds.),
Cambridge handbook of the learning sciences (pp. 265-281). Cambridge: Cambridge University Press.
Duschl, R. A., & Osborne, J. (2002). Supporting and promoting argumentation discourse in science education.
Studies in Science Education, 38(1), 39-72.
Griffiths, A. K., & Preston, K. R. (1992). Grade-12 students' misconceptions relating to fundamental
characteristics of atoms and molecules. Journal of Research in Science Teaching, 29(6), 611-628.
Ford, M. J., & Wargo, B. M. (2012). Dialogic framing of scientific content for conceptual and epistemic
understanding. Science Education, 96(3), 369-391.
Haidar, A. H. (1997). Prospective chemistry teachers‟ conceptions of the conservation of matter and related
concepts. Journal of Research in Science Teaching, 34(2), 181-197.
Haladyna, T. M. (1997). Writing test items to evaluate higher order thinking. Needham Heights, MA: Allyn &
Bacon.
Haslam, F., & Treagust, D. F. (1987). Diagnosing secondary students' misconceptions of photosynthesis and
respiration in plants using a two-tier multiple choice instrument. Journal of Biological Education, 21(3),
203-211.
Hudson, R. D., & Treagust, D. F. (2013). Which form of assessment provides the best information about student
performance in chemistry examinations? Research in Science & Technological Education, 31(1), 49-65.
Kahveci A. (2009). Exploring chemistry teacher candidates‟ profile characteristics, teaching attitudes and
beliefs, and chemistry conceptions. Chemistry Education Research and Practice,10(2), 109-120.

229
Int J Educ Math Sci Technol
Khalid, T. (2003). Pre-service high school teachers‟ perceptions of three environmental phenomena.
Environmental Education Research, 9(1), 35-50.
Kiray, S. A., Aktan, F., Kaynar, H., Kilinc, S., & Gorkemli, T. (2015). A descriptive study of pre-service
science teachers‟ misconceptions about sinking-floating. Asia-Pacific Forum on Science Learning and
Teaching, 16(2), Article2.
Kirbulut, Z. D., & Geban, O. (2014). Using three-tier diagnostic test to assess students‟ misconceptions of states
of matter. Eurasia Journal of Mathematics, Science and Technology Education, 10(5), 509-521.
Lemma, A. (2013). A diagnostic assessment of eighth grade students‟ and their teachers‟ misconceptions about
basic chemical concepts. African Journal of Chemical Education, 3(1), 39-59.
Linn R. L., & Gronlund N. E. (2000). Measurement and assessment in teaching (8th ed.). Upper Saddle River,
NJ: Prentice Hall, Inc.
Nakhleh, M. B., Samarampungavan, A., & Saglam, Y. (2005). Middle school students‟ beliefs about matter.
Journal of Research in Science Teaching, 42(5), 581-612.
Odom, A. L., & Barrow, L. H. (1995). Development and application of a two-tier diagnostic test measuring
college biology students' understanding of diffusion and osmosis after a course of instruction. Journal of
Research in Science Teaching, 32(1), 45-61.
Osborne, R. J., & Gilbert, J. K. (1980). A technique for exploring students' views of the world. Physics
Education, 15(6), 376-379.
Özalp, D., & Kahveci, A. (2015). Diagnostic assessment of student misconceptions about the particulate nature
of matter from ontological perspective. Chemistry Education Research and Practice, 16(3), 619-639.
Özmen, H., Ayas, A., & Coştu, B. (2002). Determination of the science student teachers‟ understanding level
and misunderstandings about the particulate nature of the matter. Educational Sciences: Theory and
Practice, 2(2), 507-529.
Özmen, H., & Kenan, O. (2007). Determination of the Turkish primary students‟ views about the particulate
nature of matter. Asia-Pacific Forum in Science Learning and Teaching, 8(1), 1-15
Pesman, H., & Eryilmaz, A. (2010). Development of a three-tier test to assess misconceptions about simple
electric circuits. The Journal of Educational Research, 103(3), 208-222.
Peterson, R., Treagust, D. F., & Garnett, P. (1986). Identification of secondary students‟ misconceptions of
covalent bonding and structure concepts using a diagnostic instrument. Research in Science Education,
16(1), 40-48.
Sia, D. T., Treagust, D. F., & Chandrasegaran, A. L. (2012). High school students‟ proficiency and confidence
levels in displaying their understanding of basic electrolysis concepts. International Journal of Science
and Mathematics Education, 10(6), 1325-1345.
Songer, C. J., & Mintzes, J. J. (1994). Understanding cellular respiration: An analysis of conceptual change in
college biology. Journal of Research in Science Teaching, 31(6), 621-637.
Tamir, P. (1989). History and philosophy of science and biological education in Israel. Interchange, 20(2), 95-
98.
Tan, K. C. D., Goh, N. K., Chia, L. S., & Treagust, D. F. (2002). Development and application of a two-tier
multiple choice diagnostic instrument to assess high school students' understanding of inorganic
chemistry qualitative analysis. Journal of Research in Science Teaching, 39(4), 283-301.
Tatar, E. (2000). Prospective primary school teachers‟ misconceptions about state of matter. Educational
Research and Reviews, 6(2), 197-200.
Treagust, D. F. (1986). Evaluating students‟ misconceptions by means of diagnostic multiple choice items.
Research in Science Education, 16(1), 199-207.
Turker, F. (2005). Developing a three-tier test to assess high school students’ misconceptions concerning force
and motion. Unpublished master‟s thesis, Middle East Technical University, Ankara, Turkey.
Tytler, R. (2000). A comparison of year 1 and year 6 students‟ conceptions of evaporation and condensation:
Dimensions of conceptual progression. International Journal of Science Education, 22(5), 447-467.
Valanides, N. (2000). Primary student teachers‟ understanding of the particulate nature of matter and its
transformations during dissolving. Chemistry Education: Research and Practice in Europe, 1(2), 249-
262.
Voska, K. W., & Heikkinen, H. W. (2000). Identification and analysis of student conceptions used to solve
chemical equilibrium problems. Journal of Research in Science Teaching, 37(2), 160-176.
Wandersee, J. H. (1983). Suppose a world without science educators. Journal of Research in Science Teaching,
20(7), 711-712.
Wang, J. R. (2004). Development and validation of a two-tier instrument to examine understanding of internal
transport in plants and the human circulatory system. International Journal of Science and Mathematics
Education, 2(2), 131-157.
Yezierski, E. J., & Birk, J. P. (2006). Misconceptions about the particulate nature of matter. Using animations to
close the gender gap. Journal of Chemical Education, 83(6), 954-960.

230 Aydeniz, Bilican & Kirbulut
Author Information Mehmet Aydeniz The University of Tennessee
Department of Theory and Practice in Teacher Education
A 408 Jane & David Bailey Education Complex
Knoxville, TN 37996-3442
Contact e-mail: [email protected]
Kader Bilican Kirikkale University Kirikkale University, Department of Elementary Education,
Kirikkale, Turkey
Zubeyde Demet Kirbulut Harran University
Harran University, Osmanbey Campus, Department of
Elementary Education, Sanliurfa, Turkey

231
Int J Educ Math Sci Technol
Appendix A. Sample Questions from the States of Matter Diagnostic Test
1.1
A) It would decrease.
B) It would not change.
C) It would increase.
1.2 Which one of the followings is the reason of your answer for the previous question?
A) If the temperature was decreased, air particles in the system would shrink.
B) If the temperature was decreased, the pressure in the system would decrease.
C) If the temperature was decreased, the pressure in the system would increase.
D) If the temperature was decreased, the distance between air particles would decrease.
E) Atmospheric pressure is constant.
F) ………………………………………………………………..
1.3 How sure you are about your answers for the previous two questions?
Unconfident Confident
Confidence Rating: 1 2 3 4 5 6 7
2.1
A) The weight of cold and hot air is the same and equal to zero.
B) The weight of cold and hot air is the same and greater than zero.
C) Cold air is heavier than hot air.
D) Hot air is heavier than cold air.
2.2 Which one of the followings is the reason of your answer for the previous question?
A) Gases are weightless.
B) If you heat a gas, the particles of the gas expand.
C) When air is warmed up, it rises up.
D) When air is cooled down, it becomes dense and its particles get closer to each other.
E) There is no substance which goes out or goes into the jar.
F) When a gas is warmed up, the movement and pressure of the gas particles increase and the number of
collisions on the walls of the jar increases.
G) Hot air is more moisturized than cold air.
H) ..................................................................................................................................
2.3 How sure you are about your answers for the previous two questions?
Unconfident Confident
Confidence Rating: 1 2 3 4 5 6 7
3.1
The system shown on the left figure represents a closed flask connected with a
balloon and filled with air at 40 0C. If the temperature of the system was decreased
from 40 0C to 5
0C, how would the volume of the balloon change? (Atmospheric
pressure is 1 atm for both temperatures.)
Buket weighs a closed jar filled with cold air as shown on the left figure. Then, she
exposes the jar to the sun and weighs it again. Buket also knows the weight of the jar
after it is vacuumed and subtracts the weight of the container from the weight results
of cold and hot air in the jar. What could be said about the weight of cold and hot air
in the jar?
An elastic balloon is filled with helium gas at 15 0C in a room. Then, this balloon is
put into another room at 30 0C. The pressures of the rooms are the same. If the picture
of the gas particles in the balloon at 15 0C is like the figure shown on the left, which
one of the followings shows the picture of the gas particles at 30 0C? (Note: The
tensile force of the balloon is omitted. Helium gas particles were shown as “ ” in
the drawings.)

232 Aydeniz, Bilican & Kirbulut
A) B) C)
3.2 Which one of the followings is the reason of your answer for the previous question?
A) If the temperature increases, the pressure of helium gas in the balloon increases.
B) If the temperature increases, the distance between helium gas particles increases.
C) If the temperature increases, helium gas particles expand.
D) If the temperature increases, the distance between helium gas particles decrease.
E) ...................................................................................................................................
3.3 How sure you are about your answers for the previous two questions?
Unconfident Confident
Confidence Rating: 1 2 3 4 5 6 7
6.1
A) B) C) D)
6.2 Which one of the followings is the reason of your answer for the previous question?
A) If the temperature was decreased, the distance between hydrogen molecules and the volume of the gas
would decrease.
B) If the temperature was decreased, hydrogen molecules would shrink.
C) If the temperature was decreased, hydrogen molecules would become heavy and sink to the bottom of
the tank.
D) If the temperature was decreased, the movement of hydrogen molecules would slow down and the
pressure of the gas would decrease.
E) .........................................................................................................................
6.3 How sure you are about your answers for the previous two questions?
Unconfident Confident
Confidence Rating: 1 2 3 4 5 6 7
10.1 When an amount of water is boiling, you see bubbles coming from the boiling water. What do you think
that the bubbles are made of?
E) Air
F) Oxygen gas
G) Oxygen and hydrogen gas
H) Water vapor
10.2 Which one of the followings is the reason of your answer for the previous question?
E) When water evaporates, it breaks into oxygen and hydrogen gas.
F) There is air in water and bubbles are made of air.
The figure shown on the left represents a closed steel tank containing hydrogen
gas at 20 0C and 3 atm. The balls in the drawings represent the distribution of
hydrogen molecules. Which one of the followings represents the distribution of
hydrogen molecules if the temperature is lowered to -5 0C? (Note: At -5
0C,
hydrogen is still a gas.)

233
Int J Educ Math Sci Technol
G) When water evaporates, the distance between water molecules increases.
H) ………………………………………………………………………………..
10.3 How sure you are about your answers for the previous two questions?
Unconfident Confident
Confidence Rating: 1 2 3 4 5 6 7
12.1 At room temperature (25 0C), there is an open plastic bottle half-filled with water. If this bottle were left for
several days in this room, what would happen to the level of water in the bottle? (Note: The humidity in the
air should be considered too little.)
A) The level of water decreases.
B) The level of water stays the same.
C) The level of water increases.
12.2 Which one of the followings is the reason of your answer for the previous question?
A) In order for evaporation to take place, temperature has to be increased.
B) Water evaporates with its own energy at every temperature.
C) Water evaporates at or above its boiling point, which is 100 0C.
D) In order for evaporation to take place, a liquid has to take heat from its environment.
E) Hot air condenses in the bottle.
F) ……………………………………………………………………………………..
12.3 How sure you are about your answers for the previous two questions?
Unconfident Confident
Confidence Rating: 1 2 3 4 5 6 7

234 Aydeniz, Bilican & Kirbulut
Appendix B . List of Alternative Conceptions
Alternative Conceptions Item Choices
1. When heated, particles expand; when cooled, they
shrink.
(1.1.A, 1.2.A, 1.3.A), (5.1.C, 5.2.B, 5.3.A),
(2.1.D, 2.2.B, 2.3.A), (3.1.B, 3.2.C,
3.3.A), (6.1.C, 6.2.B, 6.3.A)
2. In a closed container filled with a gas, when
temperature increases/decreases, the gas pressure
always increases/decreases.
(1.1.A, 1.2.B, 1.3.A), (5.1.C, 5.2.A, 5.3.A),
(3.1.C, 3.2.A, 3.3.A)
3. Hot air is lighter than cold air. (5.1.C, 5.2.C, 5.3.A), (2.1.C, 2.2.C, 2.2.A),
(2.1.C, 2.2.D, 2.3.A), (6.1.B, 6.2.C,
6.3.A)
4. Gas always weighs less than liquid (or solid). (2.1.D, 2.2.G, 2.3.A), (8.1.B, 8.2.E, 8.3.A)
5. Vapor or gas has no weight. (2.1.A, 2.2.A, 2.3.A), (8.1.A, 8.2.A, 8.3.A)
6. When the gas pressure increases, the weight of the
gas increases.
(2.1.D, 2.2.F, 2.3.A)
7. In a closed container filled with a gas the volume
of a gas always decreases when the temperature
decreases.
(4.1.A, 4.2.C, 4.3.A), (6.1.A, 6.2.A, 6.3.A)
8. When air is compressed, the particles stick
together.
(7.1.C, 7.2.A, 7.3.A), (9.1.A, 9.2.A, 9.3.A)
9. When air is compressed, the particles are all
pushed to the end of the syringe.
(7.1.D, 7.2.D, 7.3.A), (9.1.A, 9.2.C, 9.3.A)
10. When air is compressed, the particles change its
shape.
(7.1.A, 7.2.B, 7.3.A), (9.1.A, 9.2.B, 9.3.A)
11. When water boils/evaporates, it breaks into its
components hydrogen and oxygen molecules.
(8.1.B, 8.2.B, 8.3.A), (11.1.B, 11.2.B, 11.3.A)
12. In order for evaporation to take place, a liquid has
to take heat from its environment.
(12.1.B, 12.2.D, 12.3.A), (13.1.B, 13.2.D,
13.3.A)
13. Vaporization starts with boiling. (12.1.B, 12.2.C, 12.3.A), (13.1.B, 13.2.A,
13.3.A)
14. Condensation or evaporation requires a
temperature gradient.
(12.1.B, 12.2.A, 12.3.A), (13.1.B, 13.2.B,
13.3.A), (16.1.A, 16.2.B, 16.3.A)
15. Condensation is when air turns into a liquid. (12.1.C, 12.2.E, 12.3.A), (13.1.C, 13.2.E,
13.3.A), (16.1.B, 16.2.C, 16.3.A)
16. The cold surface of the closed container and dry air
react to form water via the combination of
hydrogen and oxygen on the surface.
(14.1.A, 14.2.A, 14.3.A), (16.1.A, 16.2.A,
16.3.A)
17. When water boils and bubbles come up, the
bubbles are oxygen and hydrogen, air, or heat.
(10.1.C, 10.2.A, 10.3.A), (10.1.A, 10.2.B,
10.3.A)
18. Boiling liquids at atmospheric pressure have
different vapor pressures.
(17.1.C, 17.2.A, 17.3.A), (17.1.B, 17.2.B,
17.3.A)
19. Vapor pressure increases/decreases with height and
this cause the water boil at lower/higher
temperatures.
(19.1.A, 19.2.D, 19.3.A), (19.1.C, 19.2.E,
19.3.A)
20. At constant temperature, the value of the vapor
pressure changes with changes in the volume of the
vapor in equilibrium with its liquid and in the
amount of liquid.
(15.1.C, 15.2.A, 15.3.A), (15.1.C, 15.2.C,
15.3.A), (15.1.B, 15.2.B, 15.3.A),
(18.1.A, 18.2.A, 18.3.A), (18.1.C,
18.2.B, 18.3.A)