exploring mek5/erk5 signaling and mirnas as therapeutic...
TRANSCRIPT

UNIVERSIDADE DE LISBOA
FACULDADE DE CIÊNCIAS
DEPARTAMENTO DE QUÍMICA E BIOQUÍMICA
Exploring MEK5/ERK5 Signaling and miRNAs
as Therapeutic Strategies in Colon Cancer
André Gonçalo do Espírito Santo Simões
Mestrado em Bioquímica
2011

UNIVERSIDADE DE LISBOA
FACULDADE DE CIÊNCIAS
DEPARTAMENTO DE QUÍMICA E BIOQUÍMICA
Exploring MEK5/ERK5 Signaling and miRNAs
as Therapeutic Strategies in Colon Cancer
André Gonçalo do Espírito Santo Simões
Mestrado em Bioquímica
Dissertação de Mestrado orientada por:
Prof.ª Doutora Cecília M. P. Rodrigues
Prof.ª Doutora Luísa Cyrne
Lisboa
2011

The studies presented in this thesis were performed in the Molecular and Cell Biology of
Eukaryotic Systems research group, at the Research Institute for Medicines and
Pharmaceutical Sciences (iMed.UL), Faculty of Pharmacy, University of Lisbon, under the
supervision of Cecília M. P. Rodrigues, Ph.D.
This work was supported by grant PTDC/SAU-GMG/099161/2008 from FCT (to C.M.P.R.).

iii
The studies presented in this thesis were developed under the frame of the following
publications:
Paper:
Borralho PM, Simões AE, Gomes SE, Lima RT, Carvalho T, Ferreira DM, Vasconcelos MH, Castro
RE, Rodrigues CM. MiR-143 overexpression impairs growth of human colon carcinoma
xenografts in mice with induction of apoptosis and inhibition of proliferation. PLoS One2011;
6(8): e23787.
Abstracts:
Borralho PM, Simões AES, Gomes SE, Lima RT, Carvalho T, Castro RE, Vasconcelos
MH,Rodrigues CMP. O microRNA-143 aumenta a apoptose e reduz a proliferação de células de
cancro colorectal in vivo. Jornal Português de Gastrenterologia 2011; 18: 4.
[Selected oral communication]
Borralho PM, Simões AES, Gomes SE, Lima RT, Carvalho T, Ferreira DMS,Vasconcelos MH,
Castro RE,Rodrigues CMP. miR-143 overexpression impairs growth of human colon carcinoma
xenografts in mice with induction of apoptosis and inhibition of
proliferation.19th
Euroconference on Apoptosis “Metabolism, Epigenetics and Cell Death”,
Stockholm, Sweden, 2011.
[Poster presentation]
Borralho PM,Simões AES, Gomes SE, Lima RT, Carvalho T, Vasconcelos MH, Castro
RE,Rodrigues CMP.miR-143 overexpression reduces the growth of xenograft Tumors from
colon carcinoma cells, increasing tumor cell apoptosis and decreasing proliferation. XX Porto
Cancer Meeting, Drug Resistance in Cancer: from Biology to Molecular Drugs and Targets,
Porto, Portugal, 2011.
[Poster presentation]
Best Poster Award for the Basic Research session.


v
Agradecimentos
Em primeiro lugar, gostava de agradecer à professora Cecília Rodrigues pela
oportunidade que me proporcionou, ao aceitar-me no seu grupo, e me continua a
proporcionar, ao permitir-me continuar, contribuindo muito directamente para a minha
realização profissional e pessoal. Não podendo deixar de referir que a sua dedicação e
capacidade de trabalho espelham o percurso a percorrer para o sucesso neste mundo da
investigação.
Queria também agradecer à professora Luísa Cyrne, minha orientadora interna, pela
sua disponibilidade em possibilitar-me a realização da minha tese de mestrado fora da
instituição em que me encontro inscrito. Contribuindo directamente na minha demanda pela
minha concretização no mundo profissional.
Gostava também de expressar a minha gratidão ao professor João Gonçalves e ao seu
grupo por nos terem fornecido o anticorpo α-FITC-protamine, fulcral para o desenvolvimento e
progressão de um dos objectivos do presente estudo.
Ao Pedro, o “chefe”, quero agradecer-lhe a dobrar e com um grande abraço forte! Em
primeiro lugar, agradeço-te Pedro pela pessoa fantástica que és e que tens sido comigo, pela
amizade que sinto termos desenvolvido, que transcedeu muito a relação meramente
profissional. Acho que nunca te disse, mas trabalhar contigo foi uma experência da qual estou
enormemente grato, não conseguindo sequer imaginar de que forma poderia ter tido mais
sorte. Para além de seres um exemplo que considero a seguir a nível profissional, és também
uma pessoa que sempre se monstrou disponível, que da melhor forma que sabes procuraste
sempre ajudar e que espalha e espelha boa disposição e sorrisos em todos os que te rodeiam.
Muito agradecido por tudo Pedro.
Desejo também fazer um agradecimento especial aos meus compinchas do lab,
Duarte, Beni e Daniela, que muito perto estiveram quando muito precisei, que mostrando-me
quem são, fizeram-me reconstruir novamente e mais forte. Duarte, agradeço-te pela tua
incondicionalidade, paciência e amizade. Beni, agradeço-te o teu sorriso, a tua força e a tua
paz. Daniela, agradeço-te o teu abraço, o teu bem-estar e alegria. Fizeram um amigo!
Ao chavalo, o Miguel, agradeço a louca boa disposição e a serenidade. A tua
contagiante boa disposição e a serenidade com que sempre te mostraste disponível para
ajudar fazem de ti...um chavalo especial! E eu pergunto..”Are you gonna be my girl?”!

vi
Quero com um grande sorriso agradecer aos restantes, mas não menos importantes,
membros do grupo molcellbiol, Filipa, Rita, Joana Amaral, Joana Xavier, Maria, Rui, Susana,
Elsa, Maria João e Andreia, destacando também a Simone que durante uns tempos também
nos pertence. Agradeço o incrível bom ambiente, existente no laboratório, que por vocês é
suscitado e pela prestabilidade que todos demonstraram em ajudar-me quando necessário.
Destaco agora um agradecimento também muito especial ao gangue da cave, que
mesmo na ausência de janelas, tornou este lugar mais luminoso. Não esquecendo de destacar
os sempre característicos espirros e massagens da menina Cátia, que desejo que consiga
alcançar os seus objectivos, e a boa disposição e carinho da Filipa Sol.
À Ana, a minha oliverinha pgeta, canto uma cantiga especial...mas não agora!
Agradeço-te a tua capacidade de me fazer rir e de dançares comigo! As palavras fogem-me
para descrever como a amizade que se criou é especial e não agradeço nada perder-te daqui
da minha beira. Mas é com grande desejo que procurarei sempre ajudar-te a encontrares
aquilo que procuras. Agradeço-te minha amiga.
Inês, a ti agradeço-te toda a partilha...todo o apoio, carinho, bem-estar, amizade e
amor. Guardo tudo o que me deste, tudo o que me proporcionás-te e fizeste sentir. Ajudáste-
me a voltar a acreditar...em mim e na vida e só espero ter conseguido e conseguir mostrar e
fazer-te sentir tão especial, como tu me tens feito sentir. Especialmente te sinto. Também
gosti.
Agradeço também, sem esquecer, a dois amigos muito especiais. À minha amiga do
coração, Mariana, que já me acompanha à 11 anos e que por mais conflitos que já tenhamos
vivido é uma amizade que perdura e perdurará. E ao Cadota, o alentejano, que é das pessoas
que mais paz e sossego dá em cada passo, mostrando-me que na vida está sempre tudo bem.
Por último, quero agradecer aos meus pais e ao meu irmão. Agradeço todo o apoio
incondicional que me têm dado e todo o amor com que o têm feito. Mãe agradeço-te o amor
que transmites em cada toque, em cada palavra e em cada preocupação tua. Pai agradeço-te
a tua presença constante, a tua paz transcendente e as nossas longas conversas. E por fim,
agradeço-te a ti mano, por irremediavelmente me conseguires fazer abstrair de tudo e todos,
assim como me tirar do sério! És o meu puto, o ser que mais valor dou na minha vida, por isso
porta-te bem! Amo-vos!
vii
Table of Contents
Resumo .......................................................................................................................................... ix
Abstract ....................................................................................................................................... xiii
Abbreviations ............................................................................................................................... xv
I. INTRODUCTION ...................................................................................................... 1
1. Colorectal Cancer ....................................................................................................................... 3
1.1. Colon Structure .................................................................................................................. 3
1.2. Cancer Development .......................................................................................................... 4
1.2.1. Genomic instability .................................................................................................... 5
1.2.2. Epigenetic instability ................................................................................................. 6
1.3. Cancer Progression ............................................................................................................. 6
1.4. Signaling Pathways in Cancer ............................................................................................. 9
1.4.1. EGFR pathway .......................................................................................................... 11
1.4.2. PI3K/AKT pathway ................................................................................................... 12
1.4.3. NF-κB pathway ........................................................................................................ 14
1.4.4. MAPK pathways ....................................................................................................... 15
1.5. Colorectal Cancer Treatment ........................................................................................... 16
2. MicroRNAs ................................................................................................................................ 18
2.1. MicroRNAs in Cancer ........................................................................................................ 18
2.1.1. miRNA biogenesis .................................................................................................... 18
2.1.2. miRNA function ....................................................................................................... 19
2.2. Role of miRNA-143 ........................................................................................................... 20
3. Aims .......................................................................................................................................... 21
II. MATERIALS AND METHODS ................................................................................... 23
1. Colon cancer samples ............................................................................................................... 25
2. DNA mismatch repair status ..................................................................................................... 25
3. Total protein isolation .............................................................................................................. 25
4. Western blot ............................................................................................................................. 26
5. Cell culture................................................................................................................................ 26
6. Evaluation of cell viability ......................................................................................................... 27
7. Cetuximab-FITC labeling ........................................................................................................... 27
8. Immunocytochemistry and fluorescence microscopy .............................................................. 28
9. Fluorescence activated cell sorting (FACS) analysis ................................................................. 29
10. Cloning, expression and purification of α-FITC-protamine scFv ............................................... 29
11. ELISA assay for the evaluation of α-FITC-protamine scFv binding to cetuximab-FITC ............. 30
12. Delivery of α-FITC-protamine scFv conjugated with cetuximab-FITC to HCT116 cells ............. 30

viii
13. Densitometry and statistical analysis ....................................................................................... 30
III. RESULTS AND DISCUSSION ................................................................................. 33
1. Selected Protein Expression Profiles in Human Colon Cancer ................................................. 35
1.1. ERK5 and MEK5 ................................................................................................................ 35
1.2. NF-κB and IκB .................................................................................................................. 37
1.3. p-AKT and AKT .................................................................................................................. 39
1.4. p53 ................................................................................................................................... 39
2. Development of a Small Non-coding RNA Delivery Tool .......................................................... 41
2.1. Cell Sensitivity to Cetuximab ............................................................................................ 43
2.2. Cetuximab-FITC Labeling and Function ............................................................................ 43
2.3. α-FITC-protamine scFV Binding to Cetuximab-FITC ......................................................... 47
2.4. Delivery of α-FITC-protamine scFv Conjugated with Cetuximab-FITC Complex .............. 47
3. Conclusions and Future Work .................................................................................................. 49
IV. REFERENCES ...................................................................................................... 51

ix
Resumo
O cancro é, actualmente, a segunda causa de morte no mundo ocidental, sendo o
cancro colorectal, a terceira forma de cancro mais commumente diagnosticada, tanto no
homem, como na mulher. Mais ainda, o cancro colorectal é a terceiraprincipal causa de morte
relacionada com o cancro.A transformação do tecido colónico normal e o desenvolvimento do
cancro colorectal é considerado um processo faseado, com acumulação de diferentes
alterações genéticas e epigenéticas, que levam à transformação do epitélio normal em
adenoma e, mais tarde, em carcinoma. Adenomas ou pólipos são neoplasmas que, embora
apresentem vantagem proliferativa inerente e redução de diferenciação, progridem para
formas malignas em apenas 10% dos casos. Um dos principais eventos moleculares que pode
conduzir ao desenvolvimento e progressão do cancro é a perda de estabilidade genómica que,
no caso do cancro colorectal, está associada à instabilidade de microssatélites e à instabilidade
cromossómica. A instabilidade de microssatélites é caracterizada pela presença de mutações
em genes do sistema de reparação de mismatchesno DNA, as quais podem resultar na inserção
ou delecção de repetições em microssatélites. Os microssatélites, por sua vez, são pequenas
repetições de sequências de nucleótidos, contendo cerca de uma dúzia de repetições de 4 a 6
sequências nucleótidicas. As mutações geradas em cancros com instabilidade de
microssatélites são, inicialmente, aleatórias, afectando qualquer repetição de microssatélite.
Alguns clones podem, no entanto, adquirir mutações em genes chave, conferindo à
célulavantagem proliferativa. A instabilidade cromossómica é o tipo de instabilidade genómica
mais comum, ocorrendo em cerca de 80 a 85% dos tumores colorectais esporádicos, que não
apresentam deficiências no sistema de reparação de mismatches noDNA. Tumores com
instabilidade cromossómica estão associados a uma elevada frequência de aneuploidias e
desequilíbrios alélicos, apresentando em geral, um prognóstico pior do que tumores com
deficiências no sistema de reparação demismatchesnoDNA. Nos neoplasmas colorectais é,
ainda, comum a instabilidade epigenética, a qual resulta da metilação aberrante de genes
supressores de tumores. Dentro dos tumores esporáricos com instabilidade de
microssatélites, a instabilidade epigenética manifesta-se através da metilação do promotor de
genes envolvidos na reparação do DNA, nomeadamente do gene MLH1.
Várias vias de sinalização que regulam o ciclo celular e a apoptose encontram-se
desreguladas na transformação, desenvolvimento e progressão tumoral, levando a um
aumento descontrolado da proliferação celular e à quase completa insensibilidade a estímulos
pro-apoptóticos. Destacam-se a sobreactivação das vias de sinalização das MAPKs, do NF-κB e
do PI3/AKT, que promovem a proliferação celular, bem como a mutação do p53, que inibe a
apoptose numa elevada percentagem de carcinomas.
A desregulação da expressão de microRNAs (miRNAs) tem sido associada ao
desenvolvimento de vários tipos de cancro, incluindo o cancro colorectal, através da alteração
dos níveis de produção dos vários mediadores envolvidos nestas vias de sinalização celular. Os
miRNAs são pequenas moléculas de RNA não codificante que regulam negativamente a
expressão génica, a nível pós-transcricional, através da repressão da tradução do mRNA alvo,
ou da clivagem e degradação do mesmo, estando este processo dependente do grau de
complementaridade entre o miRNA maduro e o mRNA alvo. A acção dos miRNAs está
x
envolvida na regulação de inúmeros processos biológicos, nomeadamente na proliferação
celular e na apoptose. Curiosamente, observou-se que o miRNA-143 (miR-143) apresenta
expressão reduzida no cancro colorectal, assim como em outros tipos de cancro, sendo que
um dos seus principais alvos biológicos é a ERK5. A acção do miR-143 na inibição do
crescimento tumoral, com modulação da expressão de ERK5, foi já demonstrada pelo nosso
grupo, tanto in vitro, como in vivo.
Não existe, actualmente, qualquer informação disponível na literatura relativa à
produção da proteína ERK5, ou da sua proteína activadora directa, a MEK5, no cancro
colorectal. No entanto, o aumentonos níveis destas duas cinases foi já observado em outros
tipos de cancro, estando associado ao aumento de proliferação, progressão tumoral e
resistência à terapêutica,para além de se correlacionar com um pior prognóstico da doença.
Um dos objectivos do presente trabalho foi analisar a produçãodas proteína ERK5 e MEK5
durante o desenvolvimento e progressão do cancro colorectal, por forma a determinar se esta
via de sinalização pode constituir um novo alvo terapêutico no cancro colorectal. Foi estudado
um conjunto bem definido de 197 amostras humanas, incluindo tecido normal, adenomas e
carcinomas, com e sem instabilidade de microsatélites. Os resultados demonstram,
inequivocamente, que as cinases ERK5 e MEK5 se encontram aumentadas no cancro colorectal
e que, possivelmente, a sinalização via ERK5 é um evento importante na iniciação da
transformação tumoral. De facto, verificou-se um aumento significativo de ERK5 e MEK5 em
adenomas, bem como em carcinomas, de forma independente da integridade do sistema de
reparação de mismatchesno DNA, relativamente ao tecido colónico normal. Sugere-se, assim,
que a ERK5 poderá representar um alvo terapêutico novo e relevante no cancro colorectal,
possivelmente através da redução da sua produção induzida pelo miR-143. O estudo de
mediadores de outras vias de sinalização, importantes no desenvolvimento tumoral, como o
NF-κB e o AKT, revelou que estão alteradosdurante o desenvolvimento do cancro colorectal,
tanto nos pólipos, como nos carcinomas com e sem instabilidade de microsatélites.
Confirmou-se, ainda, que a perda de função da proteína p53 está envolvida na transição de
adenoma para carcinoma e que a frequência de ocorrência de mutações no p53 está
relacionada com a funcionalidade do sistema de reparação de mismatches no DNA.
Tendo em conta o conhecimento actual do potencial anti-proliferativo, pro-apoptótico
e quimiosensibilizador do miR-143, possivelmente através da repressão da via de sinalização
da ERK5, outro objectivo do presente trabalho consistiu no desenvolvimento de uma
estratégia eficiente de entrega do miR-143, tendo em vista o seu uso como ferramenta
terapêutica no tratamento do cancro colorectal. O maior obstáculo na aplicação terapêutica
dos miRNAs está relacionado com o seu direcionamento para as células alvoin vivo, bem como
com a sua estabilidade, uma vez que os miRNAs, não modificados e desprotegidos, são
instáveis em circulação. O sistema de entrega em desenvolvimento neste estudo baseia-se na
conjugação do miR-143 com o cetuximab, já utilizado no cancro colorectal como terapia
dirigida. O cetuximab é um anticorpo monoclonal que se liga ao receptor EGFR,
frequentemente aumentado no cancro colorectal, promovendo a sua internalização e
degradação. O tratamento com este anticorpo melhora significativamente a sobrevivência dos
doentes e a progressão livre de doença, sendo, no entanto, a sua eficácia dependenteda
ausência de mutações no KRAS.

xi
Sabendo que o miR-143 apresenta efectores específicos a jusante na via do EGFR,
KRAS e ERK5, como principais alvos, o potencial terapêutico do miR-143 é elevado e poderá
aumentar a eficácia do cetuximab. O objectivo último é tirar partido da especificidade do
cetuximab para direccionar o miR-143 para as células com produção aumentada de EGFR. A
estratégia de entrega desenvolvida baseou-se na conjugação do cetuximab com fluoresceína
5(6)-isotiocianato (FITC). De seguida, o anticorpo conjugado foi complexado com um
anticorpo anti-FITC, conjugado com protamina (anti-FITC-protamina), numa proporção
superior ao número de moléculas de FITC conjugadas com o cetuximab, para garantir que
todos os resíduos de FITC no cetuximab estejam ocupados e, desta forma, maximizar a carga
de miRNA em cada molécula de cetuximab. Por fim, o miR-143 será marcado com o fluoróforo
Cy3 e carregado nas protaminas. A protamina é uma proteína carregada positivamente, com
afinidade para ácidos nucleícos, que apresenta um grande potencial para a entrega de
pequenos RNAs em células de cancro, já demonstrado in vitro e in vivo. O progresso
conseguido no desenvolvimento desta ferramenta permitiu demonstrar que o cetuximab
conjugado com FITC manteve a capacidade de ligação ao EGFR, para além de que o complexo
terapêutico constituído por cetuximab-FITC e anti-FITC-protamina foi entregue em células de
cancro colorectal com níveis elevados de EGFR. Uma vez que a eficiência desta ferramenta
depende, em grande medida, da ligação e internalização do complexo nas células alvo, os
resultados obtidos até agora reforçam o potencial desta estratégia de entrega, para além de
estimularem estudos futuros com vista à sua utilização terapêutica .
Palavras-chave: Cancro colorectal; Cetuximab; ERK5; Ferramenta de entrega; miR-143

xiii
Abstract
Colorectal cancer (CRC) is a major health problem worldwide, with high incidence,
representing a major cause of cancer related deaths. The development of CRC is considered a
stepwise process, with the accumulation of genetic and epigenetic alterations, which
contribute to transformation of normal colonic epithelium into adenoma, and eventually to
carcinoma. The overexpression of ERK5 and MEK5 have been reported in many types of
human cancer and correlated with increased cell survival, proliferation, chemoresistance and
poor disease prognosis. Curiously, no information is available on ERK5 or MEK5 expression
profiles in CRC. However, ERK5 expression is directly regulated by microRNA-143 (miR-143),
typically downregulated in CRC. The aim of the present work was to evaluate the expression
levels of ERK5 and MEK5 in normal colon, colon adenomas, and colon carcinomas. In addition,
we aimed to develop an efficient delivery strategy for future use of miR-143 in CRC therapy,
using cetuximab as a delivery vehicle. Our results provide the first human data demonstrating
the aberrant overexpression of ERK5 and MEK5 in adenomas and, to a lesser extent,
carcinomas. This suggests ERK5 as a potential target for the development of novel cancer
therapies. Further, we confirmed a significant deregulation of NF-κB and AKT signaling
pathways, thought to be involved in cancer development and progression. p53, a key player in
adenoma-carcinoma transition was also deregulated. Finally, we built an effective delivery
complex, delivered to target cells with high affinity, highlighting the potential of this strategy
for cancer cell delivery of miRNA therapeutics.
Keywords: Cetuximab; Colorectal cancer; Delivery tool;ERK5; miR-143

xv
Abbreviations
5-FU 5-fluorouracil
AGO argonaute
APC adenomatous polyposis coli
BSA bovine serum albumin
CRC colorectal cancer
DMEM Dulbecco’s modified Eagle’s medium
dMMR defective DNA mismatch repair
DPBS Dulbecco's phosphate-buffered saline
EGFR epidermal growth factor receptor
ERK extracellular-regulated protein kinase
FACS fluorescence activated cell sorting
FAP familial adenomatous polyposis
FBS fetal bovine serum
FITC fluorescein 5(6)-isothiocyanate
IgG immunoglobulin G
IκκκκB nuclear factor κB inhibitor
KRAS V-Ki-ras2 Kirsten rat sarcoma viral oncogene homolog
MAPK mitogen-activated protein kinase
Mdm-2 mouse double minute 2
MEK MAPK/ERK kinase
MEKK MEK kinase
miR-143 microRNA-143
miR/miRNA microRNA
MLH1 mutL homolog 1, colon cancer, nonpolyposis type 2 (E. coli)
MMR DNA mismatch repair
MSH2 mutS homolog 2
MSI microsatellite instability
MSS microsatellite stability
MTS 3-(4,5-dimethylthiazol-2-yl)-5-(3-carboxymethoxyphenyl)-2-(4-
sulfophenyl)-2H-tetrazolium, inner salt

xvi
NF-κκκκB nuclear factor κB
p-bodies processing bodies
PBS phosphate buffered saline
PI3K phosphatidylinositide 3’-OH kinase
pMMR proficient DNA mismatch repair
pre-miRNA precursor miRNA
pri-miRNA primary miRNA
PTEN phosphatase and tensin homologue
Ras rat sarcoma
RISC RNA-induced silencing complex
RNP ribonucleoprotein
scFv single chain variable fragment
SDS sodium dodecyl sulfate
TNM tumor-node-metastasis
Wnt wingless

I. INTRODUCTION

I. Introduction
3
1. Colorectal Cancer
1.1. Colon Structure
The large intestine is the last section of the gastrointestinaltract,and is composed by
four sequential sections: cecum, colon, rectum and anus. The colon is the longest portion of
the large intestine, a muscular tube that extends for about 1.5 m, followed bythe rectum,
approximately0.15 m long.The main biological function of the colon is toabsorb water and
minerals, and to conduct the waste products (feces) into the rectum, where they will be
expelled from the anus. The colon is further divided in four sections, although histologically
indistinct; the first section is the ascending colon, which connects tothe cecum and extends
upward in the right abdomen;the second section, the transverse colon, crosses the abdomen
from the right to the left side; the third section, the descending colon, continues downward in
the left side of the abdomen; and the final section, the sigmoid colon, connects to the rectum,
which in turn connects to the anus(American Cancer Society, 2011).
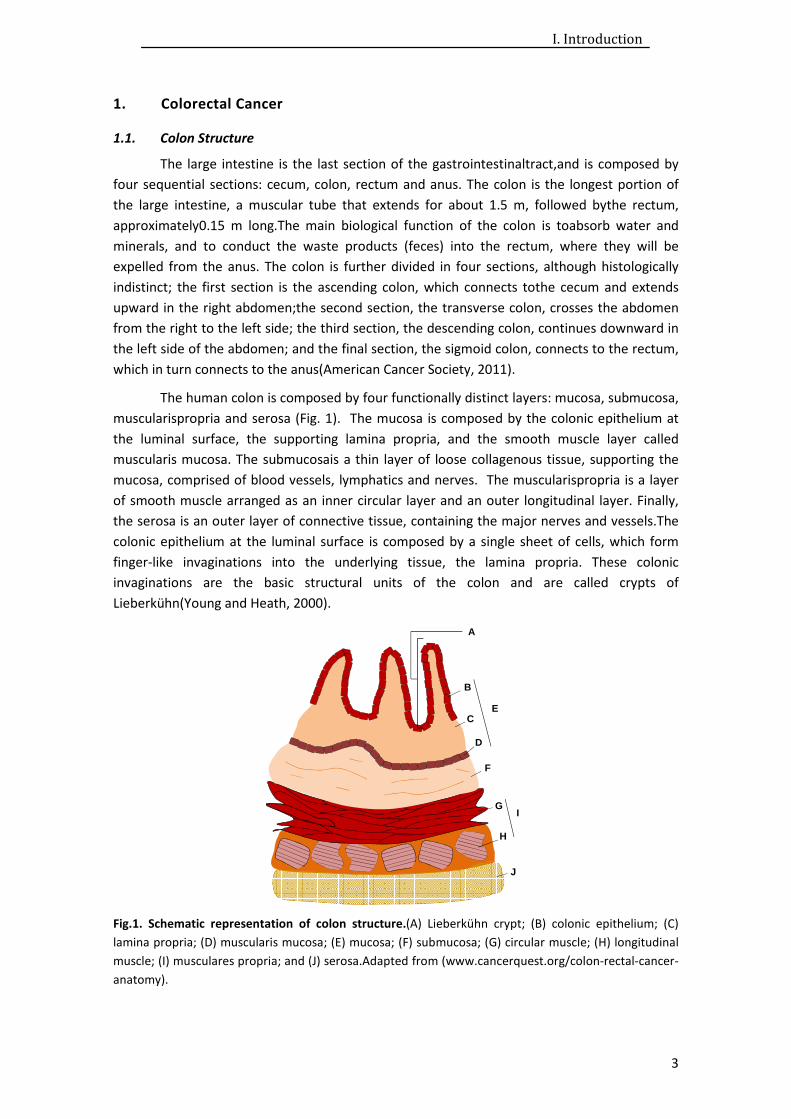
The human colon is composed by four functionally distinct layers: mucosa, submucosa,
muscularispropria and serosa (Fig. 1). The mucosa is composed by the colonic epithelium at
the luminal surface, the supporting lamina propria, and the smooth muscle layer called
muscularis mucosa. The submucosais a thin layer of loose collagenous tissue, supporting the
mucosa, comprised of blood vessels, lymphatics and nerves. The muscularispropria is a layer
of smooth muscle arranged as an inner circular layer and an outer longitudinal layer. Finally,
the serosa is an outer layer of connective tissue, containing the major nerves and vessels.The
colonic epithelium at the luminal surface is composed by a single sheet of cells, which form
finger-like invaginations into the underlying tissue, the lamina propria. These colonic
invaginations are the basic structural units of the colon and are called crypts of
Lieberkühn(Young and Heath, 2000).
Fig.1. Schematic representation of colon structure.(A) Lieberkühn crypt; (B) colonic epithelium; (C)
lamina propria; (D) muscularis mucosa; (E) mucosa; (F) submucosa; (G) circular muscle; (H) longitudinal
muscle; (I) musculares propria; and (J) serosa.Adapted from (www.cancerquest.org/colon-rectal-cancer-
anatomy).
B
C
D
F
G
H
I
E
J
A
I. Introduction
4
Colonic epithelium lining and maintenance is assured by stem cells located near or at
the bottom of each crypt, within the stem cell niche. It is characterized by a high rate of
cellular turnover, with complete cellular replacement every week, except for stem cells that
are long-lived (Potten et al., 1992).The structure of the crypt and the dynamics of cell
replication ensure that, under normal conditions, crypt stem cells and immediate daughter
cells replicate in the lowest third of the crypt. Subsequently, they terminally differentiate into
colonocytes or absorptive cells, the mucus-secreting goblet cells, and peptide hormone-
secreting endocrine cells, as they migrate to the top of the crypt(Wright, 2000). Once cells
reach the top of the crypt,they have stopped dividing and differentiating, and may begin to
undergo apoptosis. This highly ordered series of events contributes to the notion that any
mutagenic alterations acquired in non-stem cells would have no major impact on the integrity
of the crypt cell population. However,alterations acquired by crypt stem cells or very early
daughter cells will contribute to the onset of cancer(Potter, 1996).
1.2. Cancer Development
Cancer is the second most common cause of death in the United States and
Europe.Colorectal cancer (CRC)is the third most commonly diagnosednon-cutaneous cancer in
both sexes, after lung and prostate cancer in men, and lung and breast cancer in
women.Importantly, CRCis also the third leading cause of cancer-related death(American
Cancer Society, 2011).
CRC usually develops slowly over the course of many years. Thisis considered a
stepwise process, with the accumulation of different genetic and epigenetic alterations,
leading to the transformation from normal colonic epithelium to adenoma, and later to
carcinoma. Polyps (adenomas) are neoplasms, whichresult from increasedproliferationand
reduced differentiation of the epithelial cells lining the colon or rectum, as they migrate to the
top of the crypts. However, despite this gain of proliferative advantage and loss of
differentiation capacity, only fewer than 10% of adenomas actually become cancerous.
Curiously, more than half of all individuals will eventually develop one or more
adenomasthroughout life (American Cancer Society, 2011).Polyp type, size, and degree of
dysplasia are correlated with the malignancy potential of an adenoma; higher grades of
dysplasia or size greater than 1 cm in diameter are associated with increased risk of developing
into carcinoma(Winawer et al., 2006).
The sequential events that lead to CRC development are associated with aprogressive
accumulation of genetic and epigenetic changes, which affect signaling pathways that regulate
key hallmarks of cancer, thus creating a clonal growth advantage that leads to the outgrowth
of malignant cells.These genetic changesare associated with the inactivation of tumor
suppressor genes, activation of oncogenes andacquisition of mismatch repair defects, viagene
mutations or gene amplification, and epigenetic silencing, viaaberrant DNA methylation or
chromatin modifications(Gayet et al., 2001; Grady and Carethers, 2008). However, to date,
the molecular events leading to CRC initiation arestill not fully elucidated, particularly those
that underlie adenoma progression to carcinoma.Nevertheless, these events have been the
target of intense research in the last decades.
I. Introduction
5
1.2.1. Genomic instability
Important contributions for the current knowledge of the pathogenesis of CRC derived
from studies on hereditary colorectal cancer syndromes, such as familial adenomatous
polyposis (FAP) and Lynch syndrome (also called HNPCC or hereditary non-polyposis colon
cancer).These autosomal dominant diseases represent a small proportion of total CRC cases, (1
and 2-5% for FAP and Lynch syndrome, respectively), but are not considered rare events, due
to the high incidence of CRC (Lynch et al., 2006).
FAP is an autosomal dominant disease, associated with agermline mutation in the
adenomatous polyposis coli (APC) gene.FAP patients usually develop over 100 colorectal
polyps, typically during puberty, which carries a risk of developing colorectal cancer of 100% by
the second or third decade of life, if prophylactic colectomy is not performed (Al-Sukhni et al.,
2008). TheAPC gene is a tumor suppressor involved in the control of many biological processes
related with cell division and cell motility. Furthermore, there isstrong evidence that the
increased potential for cells presenting APC mutation to progress to CRC may not only result
from the overactivation of the Wingless(Wnt) signaling pathway, but also from the induction of
chromosome instabilitydue to the function of APC protein in spindle formation(Al-Sukhni et al.,
2008; Grady and Carethers, 2008; Nathke, 2004).The elucidation of the role of APC mutations
in the development of FAP, led to the discovery that somatic APC gene mutations are also an
important early event in 60 to 80% of sporadic CRC (Al-Sukhni et al., 2008).The loss of
functional APC can lead to increased proliferation and lack of differentiation, mainly due to
decreasedβ-catenin degradation, one of the major functions of the APC protein. The resulting
accumulation and increased nuclear translocation of β-catenin leads to the transcriptional
activation of many target genes involved in the regulation of cellular proliferation and
differentiation, including c-myc andcyclin-D1(Nathke, 2004).
The Lynch syndrome is an autosomal dominant condition with incomplete
penetrance,characterized by mutations in mismatch repair (MMR) genes, primarily in MLH1,
MSH2, MSH6 and PMS2.Mutations in MLH1 and MSH2 genes have a higher incidence inCRC
and are associated with a more severe phenotype, when compared to MSH6 and PMS2,
presenting an incidence between 80 to 90% in Lynch syndrome patients (Al-Sukhni et al., 2008;
Lynch et al., 2006). Importantly, MMR genes have a major role in correcting and recognizing
errors during DNA replication.Mutations in these genes lead to deletion or insertion of repeats
in microsatellites, polymorphic stretches of DNA consisting of up to a dozen repeats of 4 to 6
nucleotide sequences(Al-Sukhni et al., 2008).This form of genomic instability, termed
microsatellite instability (MSI), occurs either through the aberrant methylation of CpG islands
of MLH1 gene or by point mutations in MLH1, MSH2 and other members of the MMR
family.TheseDNA mutations are initially random in MSI cancers, affecting any susceptible
microsatellite repeat. However, some clones ultimately acquire mutations in key regulatory
genes that induce growth imbalances,leading to growth advantage(Grady and Carethers,
2008).MSI status of a particular tumor may be evaluated through the analysis of the expansion
or contraction of microsatellites,in comparison to non-tumor DNA from the same individual.It
may also be ascertained through the evaluation of expression of protein products of MMR
genes. From this analysis, a tumor may then be categorized as MSI-high (MSI-H), if over 30 to
40% of the markers are unstable;MSI-low (MSI-L), if under 30 to 40% of the markers are
unstable; or microsatellite stable (MSS), if none of the markers display instability(Boland et al.,

I. Introduction
6
1998). Importantly, colon tumors presenting defective DNA mismatch repair (dMMR)
represent 15 to 20% of sporadic human colon tumors, and more than 95% of colon cancer
arising in patients with Lynch syndrome(Grady and Carethers, 2008).
Therefore, it becomes clear that one of the key molecular steps that may lead to
cancer formation is the loss of genomic stability. In this case, gain of mutations is increasingly
facilitated, and the acquisition of a sufficient number of gene alterationsthat may transform
cells and promote tumor progression is facilitated.So far, two predominant forms of genomic
instability have been identified in colon cancer: MSIand chromosome instability (CIN).CIN is the
most common type of genomic instability and occurs in 80 to 85% of sporadic colorectal
tumors, which displayproficient DNA mismatch repair (pMMR) system. In addition, sporadic
pMMRtumors are associated with high frequency of aneuploidy and allelic imbalance, and
present an overall poorer prognosis compared to dMMRtumors (Grady and Carethers, 2008).In
turn, sporadic dMMR colon tumors display distinct clinicopathologic features compared to
sporadic pMMRcolon tumors, including proximal colon predominance, lymphocytic infiltration,
mucinous histology, diploid DNA content, and have a better overall survival (Baudhuin et al.,
2005).
1.2.2. Epigenetic instability
In addition to genomic instability, another common feature observed in colorectal
neoplasms is epigenetic instability. This phenomenon results, among others, from the aberrant
methylation of tumor suppressor genes. Within MSI sporadic tumors, the most common
mechanism of MLH1 gene inactivation is promoter hypermethylation, which occurs in more
than 80% of cases. The recovery of MLH1 expression and function can be achieved by
demethylation of the MLH1 promoter (Grady and Carethers, 2008).
1.3. Cancer Progression
Colon tumors represent a heterogeneous group of neoplasms, since not all tumors
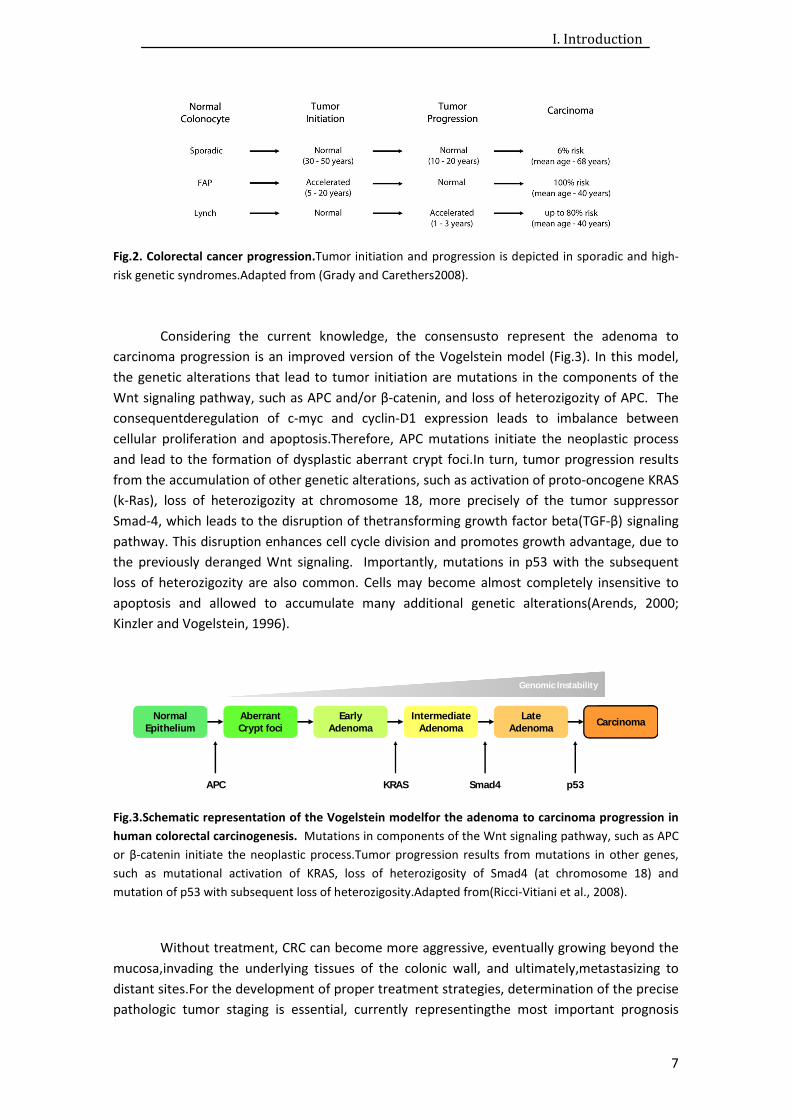
present the same genetic defects/alterations (Gayet et al., 2001). Importantly, in FAP, in
contrast with Lynch syndrome, tumor initiation is significantly accelerated due to the
inheritance of a germline APC mutation. In turn, in Lynch syndrome, tumor initiation can be
normal or slightly accelerated,with tumor progression greatly accelerated due to the
hypermutable phenotype that results from the loss of function of the DNA MMR system.In
marked contrast, sporadic colon cancers develop and progress at a slower pace when
compared with hereditary CRC syndromes, FAP and Lynch (Fig. 2) (Grady and Carethers, 2008).
I. Introduction
7
Fig.2. Colorectal cancer progression.Tumor initiation and progression is depicted in sporadic and high-
risk genetic syndromes.Adapted from (Grady and Carethers2008).
Considering the current knowledge, the consensusto represent the adenoma to
carcinoma progression is an improved version of the Vogelstein model (Fig.3). In this model,
the genetic alterations that lead to tumor initiation are mutations in the components of the
Wnt signaling pathway, such as APC and/or β-catenin, and loss of heterozigozity of APC. The
consequentderegulation of c-myc and cyclin-D1 expression leads to imbalance between
cellular proliferation and apoptosis.Therefore, APC mutations initiate the neoplastic process
and lead to the formation of dysplastic aberrant crypt foci.In turn, tumor progression results
from the accumulation of other genetic alterations, such as activation of proto-oncogene KRAS
(k-Ras), loss of heterozigozity at chromosome 18, more precisely of the tumor suppressor
Smad-4, which leads to the disruption of thetransforming growth factor beta(TGF-β) signaling
pathway. This disruption enhances cell cycle division and promotes growth advantage, due to
the previously deranged Wnt signaling. Importantly, mutations in p53 with the subsequent
loss of heterozigozity are also common. Cells may become almost completely insensitive to
apoptosis and allowed to accumulate many additional genetic alterations(Arends, 2000;
Kinzler and Vogelstein, 1996).
Fig.3.Schematic representation of the Vogelstein modelfor the adenoma to carcinoma progression in
human colorectal carcinogenesis. Mutations in components of the Wnt signaling pathway, such as APC
or β-catenin initiate the neoplastic process.Tumor progression results from mutations in other genes,
such as mutational activation of KRAS, loss of heterozigosity of Smad4 (at chromosome 18) and
mutation of p53 with subsequent loss of heterozigosity.Adapted from(Ricci-Vitiani et al., 2008).
Without treatment, CRC can become more aggressive, eventually growing beyond the
mucosa,invading the underlying tissues of the colonic wall, and ultimately,metastasizing to
distant sites.For the development of proper treatment strategies, determination of the precise
pathologic tumor staging is essential, currently representingthe most important prognosis
NormalEpithelium
AberrantCrypt foci
EarlyAdenoma
IntermediateAdenoma
LateAdenoma Carcinoma
APC KRAS Smad4 p53
Genomic Instability

I. Introduction
8
factor in CRC. In addition,MSI and loss of heterozygosity at chromosome 18q are
relevantprognostic markers, and the two best characterizedthus far (Wolpin and Mayer, 2008).
Tumors with increased MSI have a more favorable prognosis than MSS tumors. Further,
tumors with loss of heterozygosity at chromosome 18q present a poorer prognosis(Walther et
al., 2009).
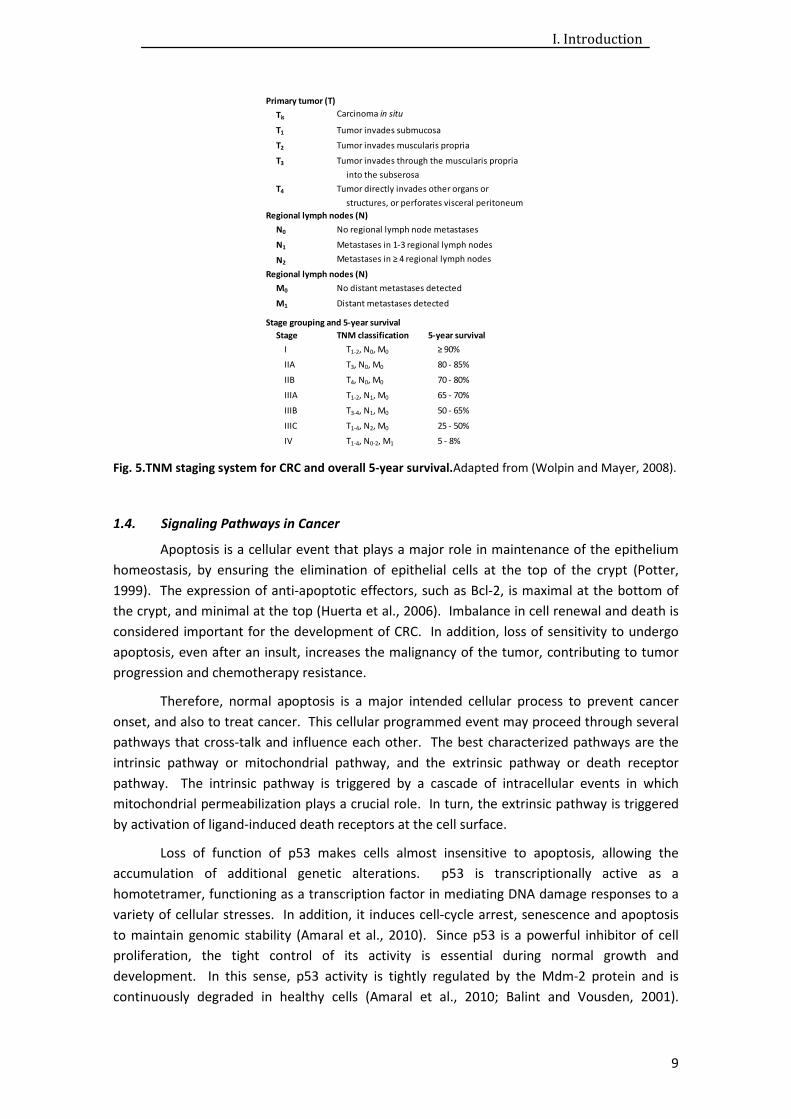
Currently, the tumor-node-metastasis (TNM) system is the most commonly used for
colon cancer staging. This system grades tumors based on the extent of invasion of the bowel
wall (T), extent of the involvement of regional lymph nodes (N), and presence of metastatic
cancerous cells in distant sites (M)(Wolpin and Mayer, 2008).Tumors are usually further
categorized by stage grouping 0-IV. Stage 0 is the earliest cancer stage, also defined as
carcinoma in situ (Tis), with tumor growth confined to the mucosa. Stage I is associated with
tumor growth through the mucosa into the submucosa (T1), or into the muscularispropria (T2).
At this stage, there is no spread into nearby lymph nodes (N0) or distant sites (M0). In stage II,
the tumor has grown into the outermost layers of the colorectal wall (T3), or through it
intoneighboring tissues (T4), without spreading to nearby lymph nodes(N0),nor distant sites
(M0).At stage III, the tumor has grown into all the layers of the colorectal wall or even into
nearby tissues (T1-4). In addition, the tumor has also spread to 1-3, or 4 or more,nearby lymph
nodes (N1-2), but not to distant sites (M0). The last stage, stage IV, is the most advanced stage
of CRC and besides the invasion of all colorectal wall layers and nearby tissues (T1-4), and the
spread to nearby lymph nodes (N1-2), metastasis at distant sites are also detectable
(M1)(Wolpin and Mayer, 2008) (Fig.4).
Fig.4.Representation of colorectal cancer growth.Tumor progression from stage 0 to IV, with sequential
invasion of nearby tissues, spread to lymph nodes and ultimately to other organs.Adapted from
(American Cancer Society, 2011).
As CRCprogresses from stage I to IV, the overall survival rates decrease abruptly due to
increased aggressiveness of the disease (Fig. 5).
00I
II
III
IV
I. Introduction
9
Fig. 5.TNM staging system for CRC and overall 5-year survival.Adapted from (Wolpin and Mayer, 2008).
1.4. Signaling Pathways in Cancer
Apoptosis is a cellular event that plays a major role in maintenance of the epithelium
homeostasis, by ensuring the elimination of epithelial cells at the top of the crypt (Potter,
1999). The expression of anti-apoptotic effectors, such as Bcl-2, is maximal at the bottom of
the crypt, and minimal at the top (Huerta et al., 2006). Imbalance in cell renewal and death is
considered important for the development of CRC. In addition, loss of sensitivity to undergo
apoptosis, even after an insult, increases the malignancy of the tumor, contributing to tumor
progression and chemotherapy resistance.
Therefore, normal apoptosis is a major intended cellular process to prevent cancer
onset, and also to treat cancer. This cellular programmed event may proceed through several
pathways that cross-talk and influence each other. The best characterized pathways are the
intrinsic pathway or mitochondrial pathway, and the extrinsic pathway or death receptor
pathway. The intrinsic pathway is triggered by a cascade of intracellular events in which
mitochondrial permeabilization plays a crucial role. In turn, the extrinsic pathway is triggered
by activation of ligand-induced death receptors at the cell surface.
Loss of function of p53 makes cells almost insensitive to apoptosis, allowing the
accumulation of additional genetic alterations. p53 is transcriptionally active as a
homotetramer, functioning as a transcription factor in mediating DNA damage responses to a
variety of cellular stresses. In addition, it induces cell-cycle arrest, senescence and apoptosis
to maintain genomic stability (Amaral et al., 2010). Since p53 is a powerful inhibitor of cell
proliferation, the tight control of its activity is essential during normal growth and
development. In this sense, p53 activity is tightly regulated by the Mdm-2 protein and is
continuously degraded in healthy cells (Amaral et al., 2010; Balint and Vousden, 2001).
Primary tumor (T)
Tis Carcinoma in situ
T1 Tumor invades submucosa
T2 Tumor invades muscularis propria
T3 Tumor invades through the muscularis propria
into the subserosa
T4 Tumor directly invades other organs or
structures, or perforates visceral peritoneum
Regional lymph nodes (N)
N0 No regional lymph node metastases
N1 Metastases in 1-3 regional lymph nodes
N2 Metastases in ≥ 4 regional lymph nodes
Regional lymph nodes (N)
M0 No distant metastases detected
M1 Distant metastases detected
Stage grouping and 5-year survival
Stage TNM classification 5-year survival
I T1-2, N0, M0 ≥ 90%
IIA T3, N0, M0 80 - 85%
IIB T4, N0, M0 70 - 80%
IIIA T1-2, N1, M0 65 - 70%
IIIB T3-4, N1, M0 50 - 65%
IIIC T1-4, N2, M0 25 - 50%
IV T1-4, N0-2, M1 5 - 8%

I. Introduction
10
TheMdm-2 protein binds to p53 transactivation domain and restrains p53 activity, thus
targeting p53 for ubiquitination, by inhibiting its acetylation and by shuttling p53 to cytoplasm.
Importantly, Mdm-2 inhibition, mainly during stress conditions, allows p53 activation and
stabilization in the active conformation (Balint and Vousden, 2001). The engagement of p53
signaling pathway occurs in response to cellular stress, which stabilizes and alters p53 by
several post-translational modifications. Phosphorylation is a classical and crucial first step in
p53 activation, whereas acetylation has recently been shown to prevent interaction with
Mdm-2, leading to increased p53 stability. Finally methylation, sumoylation and neddylation
have also been associated with regulation of p53 stability and transcriptional activation
(Amaral et al., 2010).
Induction of apoptosis driven by p53 is an important event in the maintenance of
homeostasis in response to multiple toxic stimuli, and occurs mainly through the mitochondrial
pathway. Nevertheless, p53 can also modulate this process via the death receptor pathway
(Fig.6). The permeability of the mitochondrial outer membrane is a tightly regulated process
effected by proteins of the Bcl-2 family, with some of its members being regulated by p53, via
transcription-dependent and independent events (Elmore, 2007).
Fig. 6.Main routes of p53-induced apoptosis.p53 induces apoptosis by activating target genes such as
p53-induced genes (PIGs) that modulate reactive oxygen species (ROS) production, Bax, Noxa, p53
upregulated modulator of apoptosis (PUMA), p53-regulated apoptosis-inducing protein 1 (p53AIP1),
death receptor 5 (DR5), FAS, p53-induced protein with death domain (PIDD) and insulin-like growth
factor-binding protein 3 (IGF-BP3). p53-induced apoptosis involves changes in mitochondrial membrane
potential (∆ᴪ), cytochrome C release, caspase activation and prevention of apoptosis inhibition.Adapted
from (Balint and Vousden 2001).
p53
IGF-BP3 PIGS Bax
Noxa
PUMA
p53AIP1
DR5
FAS
PIDDROS
Mitochondria
∆ᴪ
Cytochrome C
Caspases
Apoptosis
IGF
I. Introduction
11
p53 has the ability to activate the transcription of several pro-apoptotic genes, such as
those coding for theBcl-2 homology domain 3 (BH-3) only proteins Bax, Noxa and PUMA.
Additionally, p53 can promote apoptosis by repression of anti-apoptotic genes, thus promoting
caspase activation. p53 is also able to increase cell surface levels of FAS, further promoting
caspase activation and apoptosis (Amaral et al., 2010). The TP53 gene is frequently mutated in
sporadic cancers. Germlinemutations in TP53 are associated with the Li-Fraumeni syndrome,
an hereditary cancer susceptibility syndrome predisposing individuals to sarcomas,
lymphomas, breast, brain and other tumors. Curiously, malignancies that retain wild-type p53
gene have often acquired other mechanisms to compromise p53 function. Importantly,
inactivation of p53 function seems to be a general mechanism in tumor development and
might be a common feature of all cancers, including colon cancer (Balint and Vousden, 2001).
In addition to apoptosis inhibition, aberrant activation of survival pathways, by
overexpression, overactivation or mutation, is also a common feature observed in cancer.
Importantly, the abnormal activation of epidermal growth factor receptor (EGFR), mitogen-
activated protein kinase (MAPK), NF-κB and AKT signaling pathways, can promoteuncontrolled
cell growth, survival and chemotherapy resistance(Altomare and Testa, 2005; Grandis and Sok,
2004; Yu et al., 2005).
1.4.1. EGFR pathway
The EGFR/ErbB1 is one of four ErbB family members. It is a transmembrane protein
activated by EGF and transforming growth factor-α. Importantly, EGFR is overexpressed or
constitutively activated in many cancer types, including in up to 80% of colorectal tumors,and
is associated with a poorer prognosis (Grandis and Sok, 2004; Wolpin and Mayer, 2008).EGFR
activation triggers several downstream signaling pathways, including MAPK, phosphoinositide
phospholipase C γ(PLCγ), phosphatidylinositol 3-kinase/AKT (PI3K/AKT),and signal transducers
and activators of transcription(STATs) (Fig.7).
In cancer cells, overactivation of EGFR signaling pathways leads to increased
proliferation, survival, invasion and angiogenesis (Grandis and Sok, 2004). Importantly, one of
the major EGFR signaling pathways proceeds through Ras-Raf-MEK-ERK-MAPK (ERK MAPK
pathway). Adding to the deregulation of EGFR observed in many types of cancer, several
members of this pathway are also commonly deregulated in cancer, leading to a greater
potentiation of EGFR aberrant signaling. Further, one of the members most frequently
activated by mutation is Ras, occurring in 30% of all cancers and, specifically, in 50% of colon
tumors (Roberts and Der, 2007). Ras is a small GTPase protein, whose function is regulated by
a GDP/GTP switch. Typically, mutated and activated Ras is unresponsive to this regulation,
becoming constitutively GTP-bound, and thereby, constitutively activated. Another
downstream effector also mutated in cancer is Raf, including B-Raf, which occurs in ̴10% of
colorectal tumors (Roberts and Der, 2007).

I. Introduction
12
Fig.7.ErbB family members and major signaling routes.The EGFR transduction cascade is a highly
complex network. Ligand input and receptor engagement occur in the extracellular domain. No direct
ligand has been isolated for ErbB2 to date. Receptor engagement leads to tyrosine phosphorylation and
several dimerization options.ErbB3 lacks intrinsic tyrosine kinase activity. Finally, the output signal is
involved in a variety of cell responses.Adapted from (GrandisandSok 2004).
1.4.2. PI3K/AKT pathway
The PI3K/AKT pathway stimulates cell proliferation and promotes cell
survival(Altomare and Testa, 2005).Ras is an upstream regulator of thissignaling
pathway(Tokunaga et al., 2008). Abnormal activation of AKT and further nuclear
translocationis an important step toward cell transformation, contributing to both metabolic
changes in cell energetics and metabolic requirements for human tumor maintenance(Kim et
al., 2005; Mosca et al., 2011;Tokunaga et al., 2008). In addition, the PI3K/AKT pathway
regulates multiple cellular functions, including proliferation, growth, survival and
mobility.AKTis a serine-threonine kinase, ubiquitously expressed and located downstream of
the phosphatase and tensin homologue (PTEN)/PI3K. There are three family members (AKT1,
AKT2 and AKT3) encoded by three different genes.Activation of AKTresults in the suppression
of apoptosis induced by stress conditions, such as growth factor withdrawal, detachment of
extracellular matrix, UV irradiation and FASsignaling(Carnero et al., 2008).In addition, PTEN is
one of the major regulators of AKT, discovered as a tumor suppressor mutated in several
tumors. Further, the loss of PTEN activity was shown to induceAKT activation (Tokunaga et al.,
2008).
AKTleads to apoptosis inhibition and cell cycle progression by direct phosphorylation of
transcription factors that regulate the expression of pro- and anti-apoptotic genes, or by direct
phosphorylation of pro-apoptotic proteins.Furthermore, AKTnegatively regulates the
expression of cell death genes, such as Forkhead transcription factors, and activates
transcription factors that upregulate anti-apoptotic genes such IκB kinase that phosphorylates
IκB and leads to the activation of NF-κB signaling pathway, and cyclic-AMP response element
protein.Also, AKT promotes cell survival due to the direct phosphorylation and inactivation of
1 2 43
STATs MAPK PI3K PLC
Proliferation
Migration
Transformation
Apoptosis
Differentiation
EGFTGFα
HB-EGFβ-CellulinEpirugulin
Heregulins/Neuregulins
NRG1
NRG1,2,3,4Heregulins/Neuregulinsβ-CellulinEpirugulin
LigandInput:
EGFR/ErbBReceptors:
DimerizationOptions:
SignalingPathways:
CellularPhenotypes:
P P P P P P
I. Introduction
13
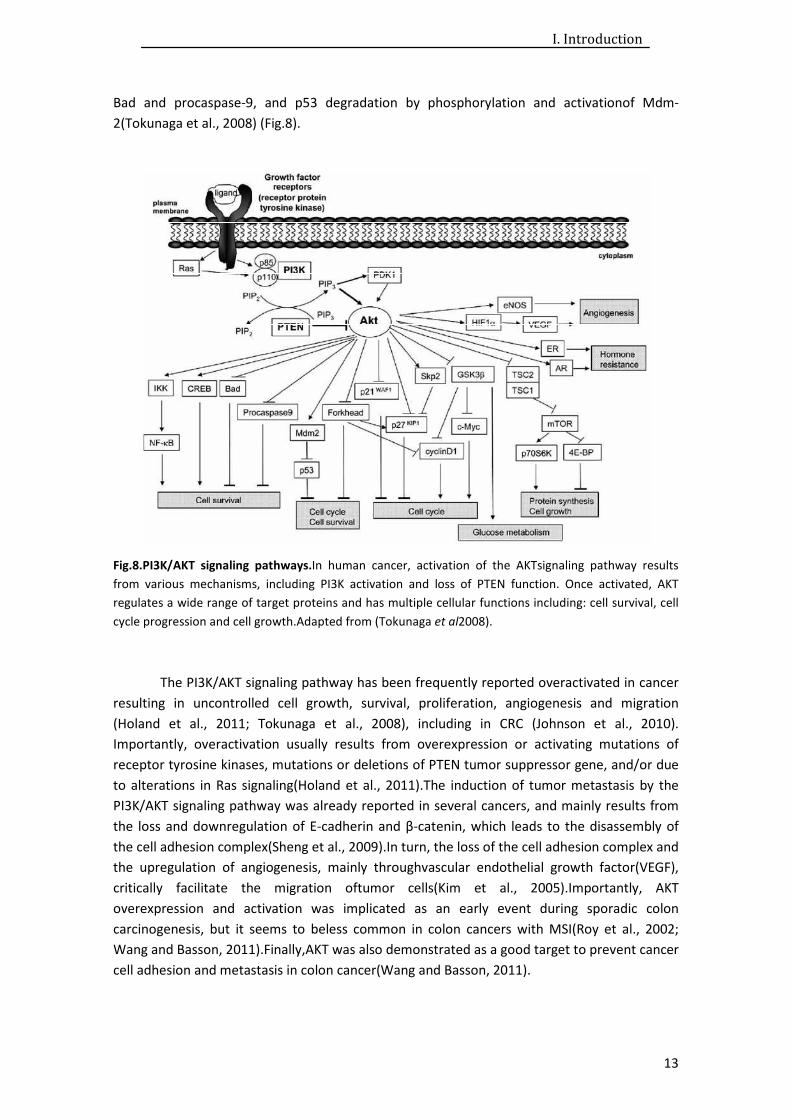
Bad and procaspase-9, and p53 degradation by phosphorylation and activationof Mdm-
2(Tokunaga et al., 2008) (Fig.8).
Fig.8.PI3K/AKT signaling pathways.In human cancer, activation of the AKTsignaling pathway results
from various mechanisms, including PI3K activation and loss of PTEN function. Once activated, AKT
regulates a wide range of target proteins and has multiple cellular functions including: cell survival, cell
cycle progression and cell growth.Adapted from (Tokunaga et al2008).
The PI3K/AKT signaling pathway has been frequently reported overactivated in cancer
resulting in uncontrolled cell growth, survival, proliferation, angiogenesis and migration
(Holand et al., 2011; Tokunaga et al., 2008), including in CRC (Johnson et al., 2010).
Importantly, overactivation usually results from overexpression or activating mutations of
receptor tyrosine kinases, mutations or deletions of PTEN tumor suppressor gene, and/or due
to alterations in Ras signaling(Holand et al., 2011).The induction of tumor metastasis by the
PI3K/AKT signaling pathway was already reported in several cancers, and mainly results from
the loss and downregulation of E-cadherin and β-catenin, which leads to the disassembly of
the cell adhesion complex(Sheng et al., 2009).In turn, the loss of the cell adhesion complex and
the upregulation of angiogenesis, mainly throughvascular endothelial growth factor(VEGF),
critically facilitate the migration oftumor cells(Kim et al., 2005).Importantly, AKT
overexpression and activation was implicated as an early event during sporadic colon
carcinogenesis, but it seems to beless common in colon cancers with MSI(Roy et al., 2002;
Wang and Basson, 2011).Finally,AKT was also demonstrated as a good target to prevent cancer
cell adhesion and metastasis in colon cancer(Wang and Basson, 2011).
I. Introduction
14
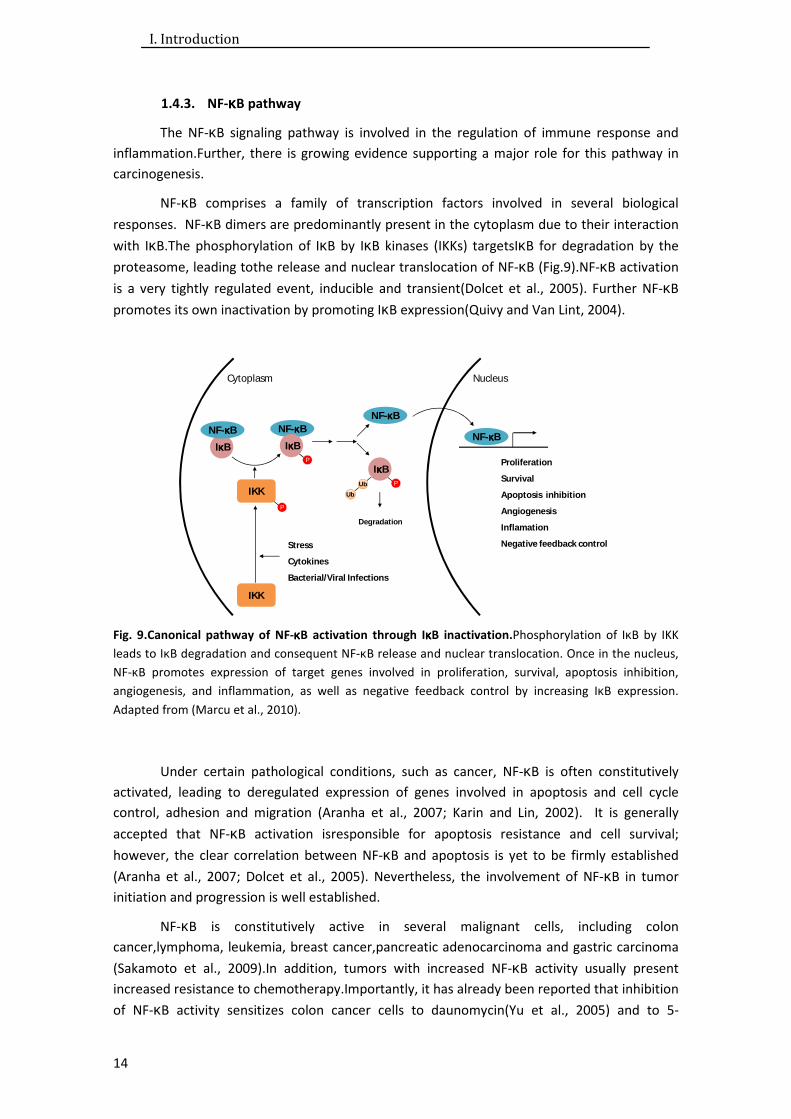
1.4.3. NF-κκκκB pathway
The NF-κB signaling pathway is involved in the regulation of immune response and
inflammation.Further, there is growing evidence supporting a major role for this pathway in
carcinogenesis.
NF-κB comprises a family of transcription factors involved in several biological
responses. NF-κB dimers are predominantly present in the cytoplasm due to their interaction
with IκB.The phosphorylation of IκB by IκB kinases (IKKs) targetsIκB for degradation by the
proteasome, leading tothe release and nuclear translocation of NF-κB (Fig.9).NF-κB activation
is a very tightly regulated event, inducible and transient(Dolcet et al., 2005). Further NF-κB
promotes its own inactivation by promoting IκB expression(Quivy and Van Lint, 2004).
Fig. 9.Canonical pathway of NF-κκκκB activation through IκκκκB inactivation.Phosphorylation of IκB by IKK
leads to IκB degradation and consequent NF-κB release and nuclear translocation. Once in the nucleus,
NF-κB promotes expression of target genes involved in proliferation, survival, apoptosis inhibition,
angiogenesis, and inflammation, as well as negative feedback control by increasing IκB expression.
Adapted from (Marcu et al., 2010).
Under certain pathological conditions, such as cancer, NF-κB is often constitutively
activated, leading to deregulated expression of genes involved in apoptosis and cell cycle
control, adhesion and migration (Aranha et al., 2007; Karin and Lin, 2002). It is generally
accepted that NF-κB activation isresponsible for apoptosis resistance and cell survival;
however, the clear correlation between NF-κB and apoptosis is yet to be firmly established
(Aranha et al., 2007; Dolcet et al., 2005). Nevertheless, the involvement of NF-κB in tumor
initiation and progression is well established.
NF-κB is constitutively active in several malignant cells, including colon
cancer,lymphoma, leukemia, breast cancer,pancreatic adenocarcinoma and gastric carcinoma
(Sakamoto et al., 2009).In addition, tumors with increased NF-κB activity usually present
increased resistance to chemotherapy.Importantly, it has already been reported that inhibition
of NF-κB activity sensitizes colon cancer cells to daunomycin(Yu et al., 2005) and to 5-
IκκκκB
NF-κκκκB NF-κκκκB
IκκκκBP
NF-κκκκB
IκκκκBPUb
Ub
Degradation
NF-κκκκB
Cytoplasm Nucleus
Proliferation
Survival
Apoptosis inhibition
Angiogenesis
Inflamation
Negative feedback control
IKKP
IKK
Stress
Cytokines
Bacterial/Viral Infections

I. Introduction
15
fluorouracil (5-FU)(Voboril et al., 2004). Importantly, the overexpression and overactivation of
NF-κB have been reported in colon cancer, and have been associated with colon tumor
progression. The regulation of this transcription factor is also considered to be useful for
therapeutic managementof colon cancer (Kojima et al., 2004; Sakamoto et al., 2009).
1.4.4. MAPK pathways
MAPK signaling pathways are alsocommonly deregulated in cancer.In fact, MAPK/ERK
pathwaysare keysignaling routes in cell proliferation,with several key growth factors and
proto-oncogenes transducing signalsthatact through these cascades. Therefore, all kinases
involved are potential targets in the treatment of CRC.So far, four major MAPK subfamilies
have been identified; the extracellular-regulatedprotein kinases 1/2 (ERK1/2), the c-Jun N-
terminal kinase (JNK), p38 MAPKs, and more recently, ERK5(Fang and Richardson, 2005;
Nishimoto and Nishida, 2006).ERK1/2 and ERK5 pathways are activated by growth factors and
mitogens, including EGF, and the activation of their downstream effectors leads to activation
of several transcription factors that regulate cell survival, differentiation and proliferation.The
ERK1/2 pathway is stimulated by sequential activation of Ras, Raf-1 and MEK1/2, finally
leading to ERK1/2 activation. In turn, activated ERK1/2 translocates to the nucleus activating
several transcription factors, such as NF-κB and Myc.Activation of ERK5 proceeds through
sequential activation of upstream kinases MEKK2/3 and MEK5. Importantly, ERK5
transcriptionally activates cyclin-D1(Nishimoto and Nishida, 2006), and regulates G2-M
progression and timely mitotic entry by activating NF-κB(Cude et al., 2007).In addition to this
pro-survival and pro-proliferative role, ERK5 prevents apoptosis by phosphorylating pro-
apoptotic proteinsBim and Bad(Girio et al., 2007), and downregulatingFAS ligand (Fig.
10)(Wang et al., 2006). ERK5 also plays an important role in angiogenesis (Wang and Tournier,
2006).
ERK1/2 overactivation has already been reported in several different primary tumors
and cell lines, including in CRC (Hoshino et al., 1999). In addition, ERK5 aberrant expression
has been reported in many cancer types, including breast (Montero et al., 2009), prostate
(McCracken et al., 2008), oral squamous cell carcinoma (Sticht et al., 2008), and hepatocellular
carcinoma (Zen et al., 2009). Nevertheless, the precise molecular mechanisms regulated by
ERK5 in cancer are not entirely clear. Importantly, ERK5 cascade has been implicated in
proliferation and chemoresistance of breast cancer cells (Montero et al., 2009), and in cell
survival of human lung cancer cells (Linnerth et al., 2005) and leukemic T cells (Garaude et al.,
2006). ERK5 overexpression is also associated with bone metastasis, and poor prognosis in
human prostate cancer (McCracken et al., 2008).
The reported overexpression and/or overactivation in many types of human cancer,
the involvement in cell survival and the association to a poorer disease survival, makes ERK5 a
desirable target for the development of additional novel cancer therapies. To date, there is no
available information on the expression of ERK5, or its direct activator MEK5, in CRC.
However, ERK5 expression is directly regulated by microRNA-143 (miR-143), and forced
expression of miR-143 is associated with decreased ERK5 expression (Akao et al., 2010;
Borralho et al., 2009). Further, the expression of miR-143 has been reported downregulated in
CRC patients (Akao et al., 2006), and persistent downregulation of miR-143 may directly

I. Introduction
16
accelerate tumorigenesis(Akao et al., 2009; Akao et al., 2007; Akao et al., 2006). Finally, miR-
143 overexpression decreases colon cancer xenograft growth (Borralho et al., 2011).
Fig. 10.ERK5 signaling pathway.Activation of ERK5 through sequential activation of MEKK2/3 and MEK5,
leads to the activation of several transcription factors and other protein effectors that promote cell
survival and proliferation.Adapted from (GeneGlobe Pathways, QIAGEN).
The elucidation of ERK5 expression in CRC may be useful as an additional prognostic
marker, similarly to ERK5 expression in prostate and breast cancers. It may also prove to be an
interesting target for therapeutic approachesto treat CRC, namely by miR-143 direct targeting
of ERK5 mRNA in vivo, In fact, we have already demonstrated that miR-143 overexpression
increases CRC cell line sensitivity to 5-FU, through modulation of ERK5 and NF-κB expression
(Borralho et al., 2009).
1.5. Colorectal Cancer Treatment
Despite all the improvements already accomplished in CRC treatment, the metastatic
form of the disease remains incurable. Treatments currently applied depend on tumor stage,
which supports the importance of determining the correct tumor stage. Surgical intervention
is considered sufficient to treat stage I and II colorectal tumors, despite the controversial use
of adjuvant therapy for the treatment of stage II tumors. The use of adjuvant therapy might
I. Introduction
17
help stage II CRC patients at high risk of recurrence, but the real benefit has not been
prospectively examined. In contrast, for the treatment of stage III tumors, the use of adjuvant
therapies is well defined, with clear benefits in improved overall survival of patients (Wilkes
and Hartshorn, 2009; Wolpin and Mayer, 2008). Finally, for the treatment of stage IV patients,
systemic chemotherapy is used, in hopes of prolonging life and palliating symptoms (Wolpin
and Mayer, 2008).
The improvements achieved in the treatment of colon cancer are associated with the
development and introduction of new therapeutic agents for systemic treatment. These
agents include cytotoxic agents, like capecitabine, irinotecan and oxaliplatin, and targeted
agents, like cetuximab, bevacizumab and panitumumab. Cytotoxic agents mainly act through
the induction of DNA damage and apoptosis, while targeted agents are usually monoclonal
antibodies targeting proteins aberrantly expressed in colon cancer. The actions developed by
these agents contribute to the inhibition of tumor growth and to tumor cell apoptosis.
Despite the progress already achieved with new therapeutic agents, 5-FU has been the
drug of choice for the treatment of CRC for several decades. Due to its rapid and efficient
absorption into the cells, and due the action of its active metabolites, disrupting RNA
synthesis, leading to DNA damage and interfering in the assembly and function of small
nuclear RNAs, 5-FU ultimately leads to apoptosis (Borralho et al., 2007; Longley et al., 2003).
Despite the large use of 5-FU, its efficacy is limited and has benefitted from the combination
with newer chemotherapeutic agents (Longley et al., 2003). Thus, there is still a high demand
for novel, efficacious therapies for the management of this disease.
Cetuximab is a targeted agent used in the adjuvant therapy for patients with stage III
colon cancer (Wilkes and Hartshorn, 2009).It is a recombinant murine immunoglobulin G1
antibody, which binds to the extra-cellular domain of EGFR that is overexpressed in several
tumor types. Importantly, cetuximab treatment has been associated with decreased cell
proliferation and angiogenesis, and increased apoptosis (Bouali et al., 2009).Cetuximab binding
to EGFR prevents receptor activation, and leads to its internalization and degradation, thus
abrogating several EGFR-regulated pathways leading toapoptosis inhibition, cell cycle
progression, angiogenesis, cell motility and metastasis (Vincenzi et al., 2008). However, the
sensitivity of colon cancer cells to cetuximab differs between tumors, according to the
presence of mutations in KRAS gene, and the expression of PTEN (Bouali et al., 2009).
Activating KRAS mutations and decreased expression of PTEN are associated with resistance to
cetuximab. Since KRAS is a downstream effector of one of the EGFR signaling pathways, the
Ras-Raf-MEK-ERK pathway, which is one of the most important signaling pathways for
proliferation and survival, activating KRAS mutations prevents the upstream repression effect
of cetuximab, and are associated with a worse prognosis (Lievre et al., 2006). Additionally,
PTEN is a tumor suppressor protein that regulates de PI3/AKT signaling pathway, another
downstream signaling pathway activated by EGFR. The loss or reduction of expression of PTEN
leads to the overactivation of the AKT pathway, and ultimately to resistance to the upstream
effect of cetuximab. Thus, the KRAS mutation status and the PTEN expression evaluation might
be valuable predictive markers for cetuximab sensitivity (Frattini et al., 2007; Karapetis et al.,
2008).

I. Introduction
18
2. MicroRNAs
2.1. MicroRNAs in Cancer
MicroRNAs (miRNAs) comprise an abundant class of endogenous, small (19-25
nucleotides), single-stranded, non-coding RNAs that repress protein translation through direct
binding to target mRNAs. Further, miRNAs are highly conserved, suggesting their involvement
in many essential biological processes, including development, differentiation, proliferation
and apoptosis (Kim et al., 2009; Slaby et al., 2009).Nevertheless, the biological function of the
majority of miRNAs remains unknown.
Due to the multiple regulatory functions of miRNAs, their contribution for cancer
onset/progression is well established and thus far,every tumoranalyzed for miRNA profiles is
significantly different when compared to normal cells from the same tissue. In addition,
analysis ofmiRNA expression profiles in human tumorshas identified several signatures
associated with diagnosis, staging, prognosis and response to treatment (Calin and Croce,
2006).Downregulated miRNAs are believed to function as tumor suppressors and prevent
tumor development, by negatively regulating tumor oncogenes and/or genes that control cell
differentiation or apoptosis.In contrast, miRNAs that are usually overexpressed in tumor
samples are considered to be oncogenes, by promoting tumor growth via negative regulation
of tumor suppressor genes and/or genes that regulate differentiation or apoptosis
(Manikandan et al., 2008).Curiously, one particular miRNA may act on different mRNA targets,
while one particular mRNA may be targeted by several different miRNAs, in different cellular
contexts, which increases the complexity of miRNA-gene regulatory networks (Calin and Croce,
2006).
2.1.1. miRNA biogenesis
miRNAs undergo several processing steps until the mature and functional form of the
miRNA is produced. Biogenesis of miRNAs starts with the synthesis of a long precursor
transcript known as primary miRNA (pri-miRNA).Generally, the pri-miRNA transcriptsare
generated by RNA polymerase II and retain mRNA features, such as 5’-cap structure and 3’-
poly(A) tail. Nevertheless, some miRNAs found interspersed among repetitive elements are
transcribed by RNA polymerase III(Borchert et al., 2006; Lee and Dutta, 2009).The primary
transcripts generated areprocessed in the nucleus by the RNase III enzyme Drosha and its
cofactor, the double-stranded-RNA-binding protein DiGeorge syndrome critical region gene 8
(DGCR8).Drosha performs the enzymatic cleavage reaction of pri-miRNAs by recognition and
cut of the stem hairpin structure, thus releasing a small RNA hairpin of 60-70 bp, called
precursor miRNA (pre-miRNA). After this first cleavage, the pre-miRNA is exported to the
cytoplasm by exportin-5, where it will be ultimately converted to a mature duplex miRNA by
RNase III enzyme Dicer.Once in the cytoplasm, Dicer cleaves near the terminal loop, at the
opposing end from Drosha, releasing approximately 22-nucleotide mature miRNA
duplexes.After Dicer cleavage, the miRNA duplexes are transferred to Argonaute (AGO)
proteins, which in turn interact with other proteins, to form the effector complex, the RNA-
induced silencing complex (RISC). Importantly, only one of the strands of the RNA duplex
(guide strand) remains in the complex, while the other (passenger strand) is released and
usually rapidly degraded.After RISC complex assembly, the miRNA purpose is to direct the RISC

I. Introduction
19
complex to target mRNAs that are subsequently cleaved or translationally repressed (Fig.
11)(Bartel, 2004; Kim et al., 2009; Lee and Dutta, 2009).
Fig. 11.Schematic overview of miRNA biogenesis and general mechanism of action.miRNAs are
transcribed into long precursor pri-miRNAs molecules. Pri-miRNAs are cleaved by the RNAse III
endonuclease Drosha and its cofactor DGCR8, originating pre-miRNAs. Pre-miRNAs are transported to
the cytoplasm by binding to Exportin-5. In the cytoplasm, pre-miRNAs are processed by the RNAse III
endonuclease Dicer. miRNA duplexes are then transferred to AGO, and one strand is then selected as
the mature miRNA, while the other is degraded. miRNAs assemble in effector ribonucleoprotein (RNP)
complexes called micro-RNPs (miRNPs) or miRNA-induced silencing complex (miRISC). miRNA RISC
loading is a dynamic process, usually coupled with pre-miRNA processing by Dicer, but its details are
unknown. Target mRNAs may also be deadenylated, decapped and exonucleolyticalydegradaded.
CCR4-NOT, deadenylation complex.Adapted from(Filipowicz et al., 2008).
2.1.2. miRNA function
The fate of the target mRNA, whether it is cleaved and degraded, or translationaly
repressed, is determined by the degree of base pair complementaritybetween the mature
miRNA and the target mRNA.Full complementarity leads to the cleavage of the target mRNA by
RISC, while on the other hand, an incomplete complementarity leads to translational
repression.However,miRNAs may also interfere with mRNA stability, without cleavage by AGO
proteins, by leading to deadenylation, decapping and exonucleolytic degradation of the
mRNA.This process involves the recruitment of cellular decapping and deadenylation
machinery, the CCR4:NOTdeadenylase and the DCP1:DCP2 decapping complexes, and occurs

I. Introduction
20
on processing bodies (P-bodies). P-bodies are intracellular sites, where translationally inactive
mRNAs are often stored and may undergo decay. Further, the presence of miRNAs, targeted
mRNAs and AGO proteins in P-bodies has already been demonstrated (Carthew and
Sontheimer, 2009; Liu et al., 2008).
2.2. Role of miRNA-143
It has been shown that many miRNAs are located at genomic sites, which in cancer are
frequently deleted, amplified or rearranged, suggesting the critical role of miRNA expression
forcancer onset (Calin et al., 2004). Interestingly,miR-143 is increasingly viewed as a tumor
suppressor, since it isdownregulated in several types of cancer, including colon cancer
(Michael et al., 2003), prostate cancer (Clape et al., 2009), gastric cancers (Takagi et al., 2009),
B-cell malignancies (Akao et al., 2007) and esophageal squamous cell carcinoma (Wu et al.,
2011). In addition, downregulation of miR-143 was reported in an early phase of adenoma
development, and therefore, decreased levels of miR-143 appear to be closely related with the
initiation of tumorigenesis. This led to the suggestionof miR-143 as an overall marker for colon
tumors(Akao et al., 2010).
The transfection of mature miR-143 in human colon cancer DLD-1 and SW480 cells
induced a significant growth inhibition (Akao et al., 2006).Importantly, our group has already
shown the anti-proliferative, pro-apoptotic and chemosensitizer effect of miR-143 in vitro
(Borralho et al., 2009), as well as a marked decrease in tumor growth in vivo (Borralho et al.,
2011).It has also been demonstrated that miR-143 directly targets the mRNA of ERK5 (Akao et
al., 2009), KRAS (Chen et al., 2009), DNMT3A (Ng et al., 2009) and Bcl-2 (Zhang et al., 2010) in
CRC. The knowledge that ERK5 plays an important influence in FAS-dependent signaling,
reducing FASL expression, suggests that miR-143 promotes FAS-mediated apoptosis, by
enabling FASL expression(Akao et al., 2009). Additionally, miR-143 was also shown to interact
with KRAS, with their levels showing an inverse correlation in CRC in vivo.Thus, miR-143
downregulation might contribute to tumorogenesis also by leading to upregulation ofKRAS
expression (Chen et al., 2009).Activating KRAS mutations are a common feature in CRC and
they lead to the aberrant activation of the Ras-Raf-MEK/ERKsignaling pathway, involved in
enhanced proliferation. KRAS inhibition by miR-143 directly results in decreased
phosphorylation of ERK1/2, thus showing the promising therapeutic role for miR-143 in CRC
(Chen et al., 2009). Recently, the anti-apoptotic protein Bcl-2 was identified as a new direct
target of miR-143 (Zhang et al., 2010), suggesting that the pro-apoptotic effect of miR-143 may
also derive from direct targeting Bcl-2 expression. In fact, our laboratoryhas reported that Bcl-
2 isdownregulated upon miR-143 overexpression in vitro andin vivo(Borralho et al., 2009;
Borralho et al., 2011). Therefore, there is growing evidence onthe potential protective role of
miR-143 against colorectal carcinogenesis.
I. Introduction
21
3. Aims
In the present study, our aim was to evaluate the expression of ERK5, MEK5, NF-κB,
IκB, AKT, p-AKT and p53, in human colon polyps and cancers, compared to normal colon
tissue. We established the aberrant expression of ERK5 pathway members in colon cancer,
thus highlighting the relevance of this particular pathway for putative therapeutic targeting.
ERK5 and MEK5 overexpression has been shown in other cancer types. However, to our
knowledge, we are first to evaluate the expression of these proteins in colon cancer, and using
well-defined sample sets of colon polyps, carcinomas, and normal colon. Further, our
evaluation of NF-κB, IκB, AKT, p-AKT and p53 expression provides solid additional information
on the deregulation of these pathways in human colon polyps and cancer, when compared to
normal colon tissue.
An increasing body of evidence arising from studies in prostate and colon cancer in
vitro, and in vivo models, indicates that ERK5 knock-down via miR-143 overexpression may
play a role in the control of tumor growth, and also in increased tumor cell chemosensitization.
In addition, due to the current knowledge on the potential deleterious role of miR-143
downregulation in carcinogenesis and/or progression of CRC, and due to the growing evidence
of its anti-proliferative, pro-apoptotic and chemosensitizer role, possibly through ERK5
signaling, our second aim was to develop miR-143 as a putative therapeutic tool. Therapeutic
applications of miRNAs will rely on the development of efficient delivery strategies, since
unmodified naked miRNAs are often unstable in circulation. The system under development is
based on the conjugation of miR-143 to cetuximab, a targeted agent in CRC therapy, and offers
the basis for the development of an efficient modular alternative to deliver miRNAs to colon
cancer cells.


II. MATERIALS AND METHODS

II. Materials and Methods
25
1. Colon cancer samples
CRC, polyps and normal colonbiospecimens were obtained from Mayo Clinic
(Rochester, MN, USA) patients, and all samples were anonymized. Pathologic tumor staging
was carried out using the tumor-node-metastasis (TNM) system (Kehoe and Khatri, 2006).
Overall, the complete set of samples used in this study was composed by 197 samples, which
included 28 normal colonic mucosa, 40 adenomas, 94 adenocarcinomas with pMMR selected
for stage I-IV, and 35 sporadic adenocarcinomas with dMMR.
2. DNA mismatch repair status
The mismatch repair status of the samples was evaluated by the presence or absence
of microsatellite instability (MSI-H) and/or the presence or absence of hMLH1 expression.
dMMR samples were defined by the presence of microsatellite instability and/or the absence
of MLH1 expression. pMMR samples were defined by the absence of microsatellite instability
(MSS/MSI-L) and the presence of normal MLH1 protein expression. MSI in CRC cases was
compared with paired normal and tumor DNA isolated from formalin fixed, paraffin-embedded
(FFPE) material, using the Qiagen DNA extraction kit (Chatsworth, CA). Tumors were classified
as MSI-H if > 30% of markers demonstrated instability and as MSS/MSI-L if < 30%
demonstrated MSI (Boland et al., 1998; Thibodeau et al., 1998). Immunohistochemical
analysis of hMLH1 expression was performed on FFPE samples, as previously described (Lindor
et al., 2002).
3. Total protein isolation
Following harvest, tissue samples were immediately snap frozen and stored at -80oC.
For each case, frozen tumor tissue was cut on a cryostat to generate hematoxylin and eosin
(H&E) stained slides. Tumors were then evaluated for content, and areas containing at least
70% tumor were macro-dissected. Tissue equivalent to 7 mm2 and 10-µm thick was then
sectioned and placed in a vial containing 400 µL of RTL buffer (Qiagen) including 4 µL β-
mercaptoethanol. The vial was then stored at -80ºC until utilized for RNA extraction using
TRIzol® LSTrizol© (Invitrogen, Corp., Carlsbad, CA), according to the manufacturer’s
instructions. RNA extractions took place in September and October 2008. At this time,
following removal of the aqueous phase for RNA extraction, the trizol-chloroform phases were
snap frozen and stored at -80oC for subsequent protein extraction. Total protein isolation from
these samples was performed 2 years later, starting in September 2010, following TRIzol®
LSTrizol© manufacturer’s instructions. Briefly, the tube was centrifuged at 12,000 x g for 15
min at 4oC; then, the remaining aqueous phase supernatant was removed and discarded.
Subsequently, 100% ethanol was added to precipitate DNA. Tubes were vigorously shaken and
centrifuged at 2,000 x g for 5min, at 4oC. The phenol-ethanol supernatant was removed to 2
mL tubes, for protein extraction. The DNA pellet obtained was washed twice with 0.1 M
sodium citrate in 10% ethanol, for 30 min at room temperature, followed by centrifugation of
2,000 x g for 5 min at 4oC. After the second wash, 75% ethanol was added to the pellets, and
samples were stored at -20oC for later DNA extraction. Subsequently, the 2 mL tubes
II. Materials and Methods
26
containing the phenol-ethanol supernatant were processed for protein extraction. Protein was
precipitated with isopropanol, followed by mixing, and 10 min incubation at room
temperature. Subsequently, samples were centrifuged at 12,000 x g for 10 min and the
supernatant discarded. Protein pellets were next washed three times with 0.3 M guanidine-
HCl in 95 % ethanol. In each wash, tubes were vigorously shaken, incubated at room
temperature for 20 min followed by centrifugation of 7,500 x g for 5 min at 4oC. After the final
wash and spin, 100% ethanol was added, and samples incubated at room temperature for 20
min, followed by a final centrifugation at 7,500 x g for 5 min at 4oC. The supernatant was
removed and the protein pellet obtained was ressuspended in an adequate volume of 8 M
Ureia (in Tris-HCl 1 M, pH 8.0) and 1% SDS solution (1:1), a modification from the 1% SDS
ressuspension solution recommendedin the manufacturer’s protocol.
4. Western blot
The steady-state levels of all proteins were determined by immunoblot analysis.
Briefly, 40 µg of total protein extracts were separated on 8% SDS-polyacrylamide
electrophoresis gels. After electrophoretic transfer onto nitrocellulose membranes,
immunoblots were blocked with 5% milk solution for 30 min. Subsequently, blots were
incubated overnight at 4oC with primary rabbit anti ERK5 (#3372; Cell Signaling, Beverly, MA),
p-AKT, AKT, NF-ĸB (p65) and IĸB-α (#sc-7985-R, #sc-8312, #sc-372 and #sc-371, respectively;
Santa Cruz Biotechnology, Inc., Santa Cruz, CA) and with primary mouse antiMEK5 and -p53
(#sc-135986 and #sc-126, respectively; Santa Cruz Biotechnology). Next, immunoblots were
incubated with anti-rabbit or -mouse secondary antibody conjugated with horseradish
peroxidase (Bio-Rad Laboratories) for 3 h at room temperature. Finally, blots were processed
for protein detection using Super Signal™ substrate (Pierce, Rockford, IL, USA). Ponceau S dye
staining of immunoblots was used as a loading control. Protein concentrations were
determined using the Bio-Rad protein assay kit, according to the manufacturer’s instructions.
Bovine albumin was used as standard (New England Biolabs Inc., New England). Absorbance
was measured in a UNICAM UV/Vis 2 spectrophotometer (Speck & Burke Analytical,
Clackmannanshire, Scotland) at 595 nm. The protein concentrations were determined after a
linear regression curve determination and absorbance value interpolation.
5. Cell culture
HCT116 cells were cultured in DMEM supplemented with 10 % fetal bovine serum
(Invitrogen, Grand Island, NY) and 1% antibiotic/antimycotic solution (Sigma Chemical Co., St
Louis, MO), and maintained at 37oC in a humidified atmosphere of 5% CO2. Cells were seeded
at 5000 cells/well, in 96-well plates for cell viability assays and at 75000 cells/well in 12-well
plates containing sterile glass coverslips, for immunocytochemistry, at 150000 cells/well in 12-
well plates for fluorescence activated cell sorting (FACS) assays and at 400000 cells/well in 6-
well plates for α-FITC-protamine binding evaluation assays.

II. Materials and Methods
27
6. Evaluation of cell viability
Cetuximab was serially diluted in sterile tissue culture media at 0.5-10 µM, final
concentration. Twenty-four hours after plating, media was removed from cells and replaced
with fresh media containing either cetuximab, at the above mentioned concentrations, or
vehicle PBS (control), for 48 and 72 h.
After 48 and 72 h of cell incubation in the presence of cetuximab or vehicle, cell
viability was evaluated using CellTiter 96® AQueous Non-Radioactive Cell Proliferation Assay
(Promega, Madison, WI), using 3-(4,5-dimethylthiazol-2-yl)-5-(3-carboxymethoxyphenyl)-2-(4-
sulfophenyl)-2H-tetrazolium, inner salt (MTS), according to the manufacturer’s instructions.
Briefly, the MTS assay is a homogeneous, colorimetric method for determining the number of
viable cells in proliferation, cytotoxicity or chemosensitivity assays. The CellTiter 96®AQueous
Assay is composed of solutions of MTS and an electron coupling reagent
phenazinemethosulfate (PMS). MTS is bioreduced by cells into a formazan product that is
soluble in tissue culture medium. The absorbance of the formazan product at 490 nm can be
measured directly from 96-well assay plates without additional processing. The conversion of
MTS into the aqueous soluble formazan product is accomplished by dehydrogenase enzymes
found in metabolically active cells. The quantity of formazan product was measured in a Bio-
Rad microplate reader Model 680 (Bio-Rad, Hercules, CA) as the amount of 490 nm
absorbance, which is directly proportional to the number of living cells in culture.
7. Cetuximab-FITC labeling
Before labeling, the commercial cetuximab solution (5 mg / ml) was submitted to
buffer exchange to PBS 1X, using PD-10 Desalting Columns (#17-0851-01, GE Healthcare) and
following the gravity protocol, according to the manufacturer’s instructions. PD-10 desalting
columns are prepacked for rapid clean-up of proteins and other large biomolecules (MW >
5000 Da). Briefly, the column was opened and the storage solution was allowed to flow by
gravity and discarded. Subsequently, the column was filled with PBS 1X pH 7.4 (equilibration
buffer) and allowed to enter the packed bed completely. This step was repeated four times,
always discarding the flow-through. After equilibration, 2.5 mL of commercial cetuximab was
added to the column, and allowed to enter the packed bed completely, discarding the flow-
through. Subsequently, cetuximab was eluted by gravity flow-through from the columns by
adding 3.5 mL of PBS 1X pH 7.4, and collected for further use.Subsequently, cetuximab labeling
with fluorescein 5(6)-isothiocyanate (FITC) was performed with the FluoReporter® FITC protein
labeling kit (# F6434; Invitrogen, Inc.), following the manufacturer’s instructions. Briefly, two
parallel labeling reactions were performed by adding 20 µL of 1 M sodium bicarbonate solution
to 200 µL of cetuximab in PBS 1X pH 7.4, per reaction. Subsequently, FITC was dissolved in
dimethyl sufoxide (DMSO), immediately before starting the reaction, and added to cetuximab
solution, at a molecular ratio of FITC:cetuximab of 100:1. The mixture was incubated at room
temperature for approximately 2h, protected from light and with stirring, for covalent
conjugation. Unreacted FITC was removed using a spin column. Briefly, the spin columns were
prepared by adding purification resin, placing the column in a collection tube, and centrifuging
at 1,100 x g for 3min, discarding the flow-through. The labeling reaction was then placed on
II. Materials and Methods
28
the center of the purification resin within the spin column. Finally, the spin column was placed
in an empty collection tube and centrifuged at 1,100 x g for 5 min. After this final
centrifugation, the flow-through in the collection tube contains the FITC labeled cetuximab
(Cetuximab-FITC). Next, the two parallel labeling reactions were pooled and further purified
using a new spin column with fresh purification resin, as described above. The flow through in
the final collection tube contains the FITC labeled cetuximab (cetuximab-FITC). Cetuximab
concentration and cetuximab-FITC labeling ratio in this solution were determined by
measuring the absorbance at 280 and 494 nm using a Nano drop 1000 Spectrophotometer
(Thermo Scientific, Wilmington, DE, USA), and by using the following equations: Cetuximab
concentration (M) = [A280 – (A494 x 0.3)] x dilution factor/ε (where ε is the molar extinction
coefficient of the protein at 280 nm, for most IgGs, ε = 203,000 cm–1M–1); and FITC:cetuximab
labeling ratio (number of dye molecules per antibody molecule) = dilution factorx A494 / [68,000
(cm–1M–1) xcetuximabconcentration (M)] (where 68,000 cm–1M–1 is the molar extinction
coefficient of the dye at pH 8.0 at 494 nm. The FITC:cetuximab ratio obtained in the
cetuximab-FITC labeling solution was approximately11(10.74).
8. Immunocytochemistry and fluorescence microscopy
For the evaluation of unlabeled cetuximab binding to EGFR expressed by HCT116 cells,
cells were grown on glass coverslips and incubated with 50 nMcetuximab in complete culture
media in a humidified incubator at 37oC, for 1 h. Cells were then fixed with paraformaldehyde
(4% w/v) in 1X PBS and permeabilized for 20 min at room temperature in PBS containing 0.1 %
Triton-X-100. Subsequently, cells were incubated for 30 min at room temperature in blocking
solution containing 0.05 % Tween-20 and 5 % normal goat serum in 1X PBS. Cells were next
incubated with secondary anti-human FITC-conjugated antibody (#109-095-003, FITC-
conjugated affinipure goat anti-human IgG; Jackson Immuno Research Laboratories, Inc.)
diluted 1:200 in blocking solution, for 1 h at room temperature, followed by counterstaining
with Hoechst at 5 µg/mL, for 10 min, also at room temperature. Finally, glass coverslips were
mounted on glass slides using Fluoromount-G™ (Beckman Coulter Inc., Fullerton, CA, USA) for
fluorescence microscopy evaluation of cetuximab binding to EGFR in HCT116 cells. For the
evaluation of cetuximab-FITC binding to EGFR on HCT116 cells, cells grown on glass coverslips
were incubated with 50 nM FITC-cetuximab in complete culture media, and incubated in a
humidified incubator at 37oC, for 1 h.Cells were then fixed, permeabilized, counterstained, and
mounted as described above for fluorescence microscopy evaluation of cetuximab binding to
EGFR in HCT116 cells. Fluorescence microscopy observation of samples was performed by
using a Leica DM5000B microscope (Leica Microsystems CMS Gmb H, Germany). Images were
acquired, under 400x and 630x magnification, using a Leica DC 350F camera (Leica
Microsystems CMS Gmb H, Germany) with the IM50 software for image acquisition (Leica
Microsystems, version 1.20, Release 19).
II. Materials and Methods
29
9. Fluorescence activated cell sorting (FACS) analysis
Cetuximab-FITC binding to EGFR on HCT116 cells and dose-response curves were
performed by FACS analysis, to determine the percentage of FITC positive cells resulting from
exposure to increasing concentrations of cetuximab-FITC. For this purpose, cells were seeded
in 12-well plates at 150000 cells/well. Twenty-four hours after plating, media was removed
from cells and replaced with fresh media containing cetuximab-FITC, at concentrations ranging
0.01–100 nM, cetuximab unlabeled, cetuximab unlabeled with secondary anti-human FITC-
conjugated antibody, secondary anti-human FITC-conjugated antibody, or with vehicle PBS
(control), and incubated at 37oC in a humidified incubator, for 1h. Cells were then washed
twice with DPBS and detached with StemPro®Accutase® (A11105-01, Invitrogen, Inc.).
Subsequently, harvested cells were collected in FACS tubes and centrifuged at 700 x g for 5
min. All following steps were performed on ice. The supernatant was discarded and the cells
washed and ressuspended twice in DPBS containing 2% FBS, followed by centrifugation at 700
x g for 5 min. Subsequently, cells were ressuspended and fixed with paraformaldehyde (4%
w/v in 1X PBS), for 20 min. After fixation, cells were centrifuged at 700 x g for 5 min and
washed again with DPBS containing 2% FBS. For FACS data acquisition, cells were
ressuspended in DPBS 2% FBS and data acquired using a BD LSRFortessa Cell Analyser flow
cytometer (BD Biosciences, San Jose, CA, USA). Data analysis was performed using FlowJo
software (Tree Star Inc, version 6.4.7).
10. Cloning, expression and purification of α-FITC-protamine scFv
The anti-FITC scFv was obtained from Dr. Carlos Barbas III (Scripps Research Institute).
The protamine sequence was derived from (Peer et al., 2007)and cloned by overlay PCR in
pComb 3x,provided by Dr. Carlos Barbas III, with anti-FITC scFv. The anti-FITC-protamine single
chain variable fragment (scFv) antibody in the original vector was subjected to PCR using the
primers: FITC pET21-Nhe-F andProt-Xho-His-R (FITC-pET21-Nhe-F: 5’- CTA GCT AGC TAC CCC
TAC GAC GTG CCT GAT TAC GCC GGA GGA TCC GGA GGA-3’; Prot-Xho-His-R: 5’-CCG CTC GAG
TCA TTA ATG GTG ATG GTG ATG GTG ATG GTG GCT ACC TCC ACC TCC AGA ACG ACG GCG ACG
GCG-3’).The resulting DNA fragment was cloned into the expression vector pET21a (Novagen)
using the restriction enzymes NheI/XhoI (Nzytech) and then expressed in E. coli Tuner
(Tuner™(DE3)pLacI Competent Cells, Novagen). Bacterial cells were grown at 37ºC in LB
medium until mid-exponential phase (Abs600nm=0.4). Cells were then induced with 0.2 mM
IPTG (isopropyl β-D-1-thiogalactopyranoside), and further incubated at 16ºC for 16h.
Subsequently, cells were collected by centrifugation (2636 x g for 15 min) and ressuspended in
10 mL of 50 mM HEPES pH 7.5, 1 M NaCl, 10 mM imidazole, 5 mM CaCl2 and protease
inhibitior cocktail (Roche). Ressuspended cells were next disrupted by ultra-sonication during
20 min. The soluble fraction was collected by centrifugation at 10000 x g for 30 min, and
purified by nickel affinity chromatography using a His GraviTrap column (#11-0033-99, GE
Healthcare). Following purification, the purified scFv α-FITC-protamine was submitted to
buffer exchange to 20 mM of HEPES pH 7.4, 100 mM of NaCl, 0.1 mM EDTA and 5% (v/v)
glycerol, using disposable P-10 Desalting Columns (#17-0851-01, GE Healthcare). scFv α-FITC-

II. Materials and Methods
30
protamine was next quantitated with NanoDropND-1000 spectrophotometer (Thermo
Scientific) and stored at 4ºC.
11. ELISA assay for the evaluation of α-FITC-protamine scFv binding to
cetuximab-FITC
Antigens (cetuximab-FITC, anti-human FITC-conjugated antibody, and unlabeled
cetuximab as a negative control) were diluted in PBS 1X and incubated in 96-well plates for 1h
at 37oC, followed by a blocking step with bovine serum albumin(BSA) 3% for 1h at 37oC. After
incubation and blocking, the wells are washed once with ddH2O, and incubated with α-FITC-
protamine in BSA 1% for 1 h at 37oC. Next, each well was washed 5 times with PBS 1X
containing 0.05% Tween-20, followed by incubation with α-HA-HRP (1:1000) in BSA 1%, for 1 h
at 37oC. Finally, each well was washed 5 times with ddH20 ant incubated with 2,2-azino-bis(3-
ethylbenzothiazoline-6-sulphonic acid) (ABTS) (#194430, Calbiochem) containing 0.2% H2O2,
for 1h, at 37oC. The relative intensities at 405 with reference at 492 nm were then measured
in a Tecan Infinite® M200 multimode microplate reader (Tecan, Grodig, Austria).
12. Delivery of α-FITC-protamine scFv conjugated with cetuximab-FITC to
HCT116 cells
The levels of α-FITC-protamine scFv in HCT116 cells were determined by Western blot
using total protein extracts from cells exposed to the delivery complexes, and controls. Firstly,
the delivery complex (cetuximab-FITC plus α-FITC-protamine scFv) and the controls (no
addition, cetuximab, cetuximab-FITC, α-FITC-protamine scFv and cetuximab plus α-FITC-
protaminescFv) were incubated in vitro, in DMEM, for 2h at room temperature, in a rocking
platform. The ratio ofα-FITC-protamine scFv to cetuximab-FITC used was 15:1. Subsequently,
the delivery complexes were concentrated using Vivaspin 500 centrifugal concentrators
(Vivascience AG, Hannover, Germany), with a cut-off of 100 KDa, to remove free
uncomplexedα-FITC-protamine scFv. Final retentate volume containing the delivery
complexes was adjusted with DMEM to 1 ml, and added to cells for 4h. Cells were then
collected and processed for total proteins extracts, and subsequently used for Western blot
analysis. Detection of α-FITC-protamine scFv in immunoblots was performed with anti-HA-
Peroxidase (3F10) (#12013819001,Roche Applied Science) and anti-His-Peroxidase
(#11965085001, Roche Applied Science) antibodies, to detect α-FITC-protamine presents an N-
terminal HA tag and C-terminal His tag, respectively.
13. Densitometry and statistical analysis
The relative intensities of protein bands were analyzed using the densitometric
analysis program Quantity One Version 4.6 (Bio-Rad Laboratories). All data are expressed as
the mean ± SEM for all CRC samples within the sample sets defined, or from at least three
independent experiments. Protein band intensities for each sample, in all blots, were
normalized to the mean protein band intensities from duplicate HCT116 total protein sample

II. Materials and Methods
31
present in the same blot, and similarly included in all blots. HCT116 protein extracts used as
internal normalization control in each blot were all from the same batch. Statistical
significance was evaluated using Student’s t-test. Values of p< 0.05 were considered
statistically significant.


III. RESULTS AND DISCUSSION


III. Results and Discussion
35
1. Selected Protein Expression Profiles in Human Colon Cancer
1.1. ERK5 and MEK5
ERK5 is one of the four major MAPK subfamilies, and is involved in the regulation of
several key cellular processes, including cell survival, proliferation, differentiation and motility,
by relaying extracellular signals to intracellular responses (Cargnello and Roux, 2011). The
crucial involvement of ERK5 in early embryonic development and in normal development of
the vascular system have already been reported (Roberts et al., 2009). Further, ERK5 activity is
increased in response to multiple stimuli, such as growth factors or oxidative stress, via dual
phosphorylation by its direct activator MEK5. MEK5 physiological significance has been
demonstrated by gene ablation studies in mice, and the resulting phenotype was similar to
that of ERK5 silencing (Turjanski et al., 2007; Wang and Tournier, 2006).
ERK5 and MEK5 overexpression has been reported in several cancer types and
associated with enhanced proliferation, chemoresistance, metastasis and angiogenesis,
correlating with poorer disease prognosis. In CRC, no information is available on ERK5 and
MEK5 expression profiles. To clarify the significance of these two kinases in CRC development,
we examined steady-state levels of ERK5 and MEK5 by Western blot. For this purpose, total
protein extracts were collected from a large set of 197 well-defined human colon samples,
including normal colonic mucosa, adenomas (polyps), stage-divided pMMR adenocarcinomas,
and sporadic dMMR adenocarcinomas.
The results clearly show for the first time that ERK5 is overexpressed in colon polyps,
and in both dMMR and pMMR colon carcinomas. Further, steady-state levels of ERK5 were
significantly increased in adenomas (p < 0.01), stage 1-4 pMMR carcinomas (p < 0.05), and also
in dMMR carcinomas (p< 0.01), compared to normal colonic mucosa (Fig. 1A). This is in
accordance with the current knowledge on ERK5 overexpression in multiple human cancers,
including breast (Montero et al., 2009), prostate (McCracken et al., 2008), oral squamous cell
carcinoma (Sticht et al., 2008) and hepatocellular carcinoma (Zen et al., 2009). Our results add
colon cancer to the growing list of cancer types with aberrant ERK5 expression, thus increasing
the relevance of this kinase as a putative novel therapeutic target in cancer.
Survival and proliferation routes usually acquire enhanced signaling capabilities, as the
expression and/or activation of relevant effectors in these pathways become deregulated. Our
data provides clear evidence that ERK5 is overexpressed early in the transition from normal
colon to adenoma. In addition, at the adenoma stage,ERK5 displayed significantly increased
steady-state expression levels, compared to all pMMR tumor stages (p < 0.05 for stage 1 and 2,
and p < 0.01 for stage 3 and 4) (Fig. 1A). In addition, steady-state levels of ERK5 are not
significantly altered between dMMR tumors and each individual pMMR tumor stages (1-4).
Taken together, our results clearly show aberrant expression of ERK5 in polyps and all pMMR
tumor stages, suggesting the involvement of ERK5 in tumor initiation and progression.
Importantly, these results also suggest that ERK5 overexpression is independent of MMR
system status, therefore representing a common event in colorectal tumorigenesis.
Next, we evaluated MEK5 expression in colon cancer, which is also unreported in the
literature. The results show that MEK5 presents an expression profile similar to that observed
for ERK5. Steady-state levels of MEK5 are clearly increased in polyps (p < 0.01), stage 1-4

III. Results and Discussion
36
pMMR carcinomas (p < 0.05), and also in dMMR carcinomas (p< 0.05), compared to normal
colon tissue (Fig. 1B). In addition, MEK5 steady-state levels are higher in polyps than in pMMR
and dMMR carcinomas (p < 0.05), and unchanged between pMMR and dMMR carcinomas.
Fig.3. ERK5 and MEK5 protein levels in human colon cancer.(A) ERK5 and (B) MEK5 steady-state levels
in normal colon samples, polyps, stages 1-4 pMMR, and dMMR tumors. Total proteins were extracted
and used forWestern blot analysis. Results are expressed as mean ± SEM. §p< 0.01 and *p < 0.05 from
normal colon; †p< 0.01 and ‡p < 0.05 from colon polyps.
MEK5 and ERK5 are overexpressed in colon adenomas and carcinomas, suggesting that
overexpression and possibly overactivation of ERK5 signaling occurs in CRC, and may be
relevant in disease onset and progression. In other cancer types, ERK5 overexpression was
associated with enhanced proliferation, migration, tumor growth and
chemoresistance(Linnerth et al., 2005; McCracken et al., 2008; Montero et al., 2009; Sticht et
al., 2008; Zen et al., 2009). MEK5 overexpression has also been associated with enhanced
proliferation and invasive potential (Mehta et al., 2003; Ramsay et al., 2011). Interestingly,
ERK5 is one of the major biological targets of miR-143, whose expression is downregulated in
colon adenomas and carcinomas (Akao et al., 2010; Michael et al., 2003). miR-143 expression
ERK5 115 kDa
Ponceau S
A
0
1
2
3
pMMR
* **
*
§
§†
‡ ‡ † †
ERK
5 e
xpre
ssio
n(a
rbit
rary
un
its)
0
1
2
3
B
* *
** *
§
‡‡
pMMR
MEK5 54 kDa
Ponceau S
MEK
5 e
xpre
ssio
n(a
rbit
rary
un
its)

III. Results and Discussion
37
was suggested to be lost in the normal to adenoma transition, and is therefore considered
closely associated with tumor initiation (Akao et al., 2010). Since the expression of miR-143 is
inversely correlated with ERK5, downregulation of miR-143 is probably responsible for the
relief of ERK5 suppression, which in turn may directly accelerate CRCtumorigenesis(Akao et al.,
2009; Akao et al., 2007; Akao et al., 2006; Borralho et al., 2009; Borralho et al., 2011).
Considering the reduced expression reported for miR-143 in colon adenomas and carcinomas,
it would be expected that ERK5 steady-state levels would be increase in adenomas and
carcinomas, as evidenced by our results. To complement this data, it would be important to
correlate miR-143 expression levels with those of ERK5 in this group of samples.
Nevertheless, our data provides evidence that ERK5 may be a novel and relevant
therapeutic target in CRC, which can be modulated via the use of miR-143 to potentially inhibit
tumor growth and progression.
1.2. NF-κκκκB and IκκκκB
The NF-κB signaling pathway is frequently deregulated in several types of cancer,
including CRC. NF-κB is important for cellular transformation, and NF-κB overexpression and
activation may lead to uncontrolled cell growth and survival, apoptosis suppression,
angiogenesis and metastasis (Chaturvedi et al., 2011). Importantly, NF-κB activation may occur
in response to activating stimuli propagated via several signaling pathways, including AKT
(Kane et al., 1999), ERK5 (Garaude et al., 2006), and ERK1/2 (Wu et al., 2011).
For assessment of the NF-κB signaling pathway in human colon cancer, we evaluated
the expression of NF-κB and its inhibitor IκB in colon polyps, carcinomas and normal colonic
mucosa. The results clearly show that NF-κB is overexpressed in colon polyps (p < 0.01), in
stage 1-4 pMMR carcinomas (p < 0.01 for stage 1, and p < 0.05 for stage 2-4), and also in
dMMR carcinomas (p < 0.01), compared to normal colon tissue (Fig. 2A). Interestingly, NF-κB
displayed increased steady-state levels in colon polyps, compared to stage 1-4 pMMR
carcinomas (p < 0.05 for stage 1, and p < 0.01 for stage 2-4) and also to dMMR carcinomas (p<
0.01) (Fig. 2A). IκB steady-state levels were increased in polyps compared to normal colon
tissue and pMMRand dMMR tumors (p< 0.01), with no significant expression changes in
pMMR and dMMRfrom normal colon (Fig. 2B).Further, to ascertain NF-κB activation, we
determined the ratio of NF-κB over IκB for each sample. NF-κB was aberrantly overactivated
in polyps and stage 1-4 pMMR tumors (p < 0.05), and also in dMMR tumors (p < 0.01),
compared to normal tissue. Curiously, there were no significant differences in NF-κB over IκB
ratio from polyps to any stage pMMR tumors, nor to dMMR tumors (Fig. 2C). Our results
confirm aberrant NF-κB signaling in colon polyps and carcinomas, and suggest that the NF-κB
pathway is not influenced by MMR system status, although NF-κB over IκB ratio is slightly
higher in dMMR versus pMMR tumors and also versus polyps.

III. Results and Discussion
38
Fig. 2.NF-κκκκB and IκκκκB protein levels and NF-κκκκB/IκκκκB ratio in human colon cancer.(A) NF-κB and (B) IκB
steady-state levels, and (C) NF-κB/IκB ratiosin normal colon samples, polyps, stages 1-4 pMMR, and
dMMR tumors. Total proteins were extracted and used for Western blot analysis. Results are expressed
as mean ± SEM. §p< 0.01 and *p < 0.05 from normal colon; †p< 0.01 and ‡p < 0.05 from colon polyps.
0.0
0.5
1.0
1.5
§
*
* *
**
C
pMMR
NF-
κB/I
κB(a
rbit
rary
un
its)
0
1
2
A
*
§
§§
* *
‡
† † ††
pMMR
NF-κB 65 kDa
Ponceau S
NF-
κB e
xpre
ssio
n(a
rbit
rary
un
its)
0
1
2
3
4
B
§
††††
†
IκB 37 kDa
Ponceau S
pMMR
IκB
exp
ress
ion
(arb
itra
ry u
nit
s)

III. Results and Discussion
39
1.3. p-AKT and AKT
The PI3K/AKT signaling pathway is deregulated in several types of cancer, including
CRC. Abnormal AKT activation has been demonstrated as an important step for cell
transformation and tumor maintenance, due to its role in the promotion of cell proliferation,
growth, survival and mobility (Mosca et al., 2011; Tokunaga et al., 2008). Interestingly, Rasacts
as an upstream regulator of AKT(Tokunaga et al., 2008). AKT overexpression is also observed
in various human cancers. However, in CRC, the overactivation of this signaling pathway is a
much more common event then its overexpression, mainly due to the typical overexpression
of EGFR in this type of cancer (Tokunaga et al., 2008).
For the evaluation of the AKT signaling pathway, we analyzed p-AKT and AKT steady-
state levels, and assessed AKT activation by calculating the ratio of p-AKT over AKT in colon
polyps, carcinomas and nomal colonic mucosa. Our results showed that p-AKT was
significantly higher in polyps compared to normal colon tissue (p< 0.01). There was also a
trend for increase in pMMR and dMMR tumors relatively to normal colon tissue, although
without statistical significance (Fig. 3A). In addition, AKT steady-state levels were increased in
polyps, without reaching statistical significance, and in pMMR and dMMR tumors versus
normal colon tissue (p< 0.05) (Fig. 3B). AKT activation was markedly increased in polyps
compared to normal tissue (p< 0.01), and higher than that of carcinomas (p < 0.01 for pMMR;
and p < 0.05 for dMMR tumors). However, the increase in AKT activation found in pMMR and
dMMR carcinomas compared to normal tissue did not reach statistical significance (Fig. 3C).
Our data suggests that overexpression and overactivation of AKT signaling occurs in CRC,
represents an early event, and proceeds independently of tumor MMR system status. The
involvement of AKT in early events of sporadic colon carcinogenesis has already been reported
(Roy et al., 2002).
1.4. p53
Loss of p53 function by mutation is a common event in cancer, at rates varying
between 10% and close to 100%. These mutational events have been reported to occur at
different phases of the multistep process of malignant transformation. The question whether
p53 mutations are involved in the initiation of malignant transformation, or perhaps only in
more advanced stages of cancer is still an open question (Rivlin et al., 2011). However, the loss
of p53 function in CRC is usually associated with adenoma to carcinoma transition (Arends,
2000; Baker et al., 1990). In most cases, the p53 gene mutation gives rise to a stable mutant
protein, which tends to accumulate in the cell (Rivlin et al., 2011), and may lead to loss of p53
tumor suppressor activity, increased cellular proliferation and inhibition of apoptosis (Tan et
al., 2005). Loss of heterozygosity is believed to be the main inactivation event on one of the
alleles of tumor suppressor genes in cancer, where approximately 70% of CRC display 17p LOH.
In most cases of CRC, the main target of 17p LOH is the p53 gene. Approximately 85% of the
somatic mutations carried in the remaining p53 allele are missense mutations (Fearon, 2011).
Further, only a small minority of CRC cases lack 17p LOH and have somatic mutations in both
p53 alleles, whereas most adenomas usually lack 17p LOH and p53 mutations. Thus,
adenomas usually present wild-type functional p53, in contrast to carcinomas, where p53 is
frequently mutated (Baker et al., 1990).
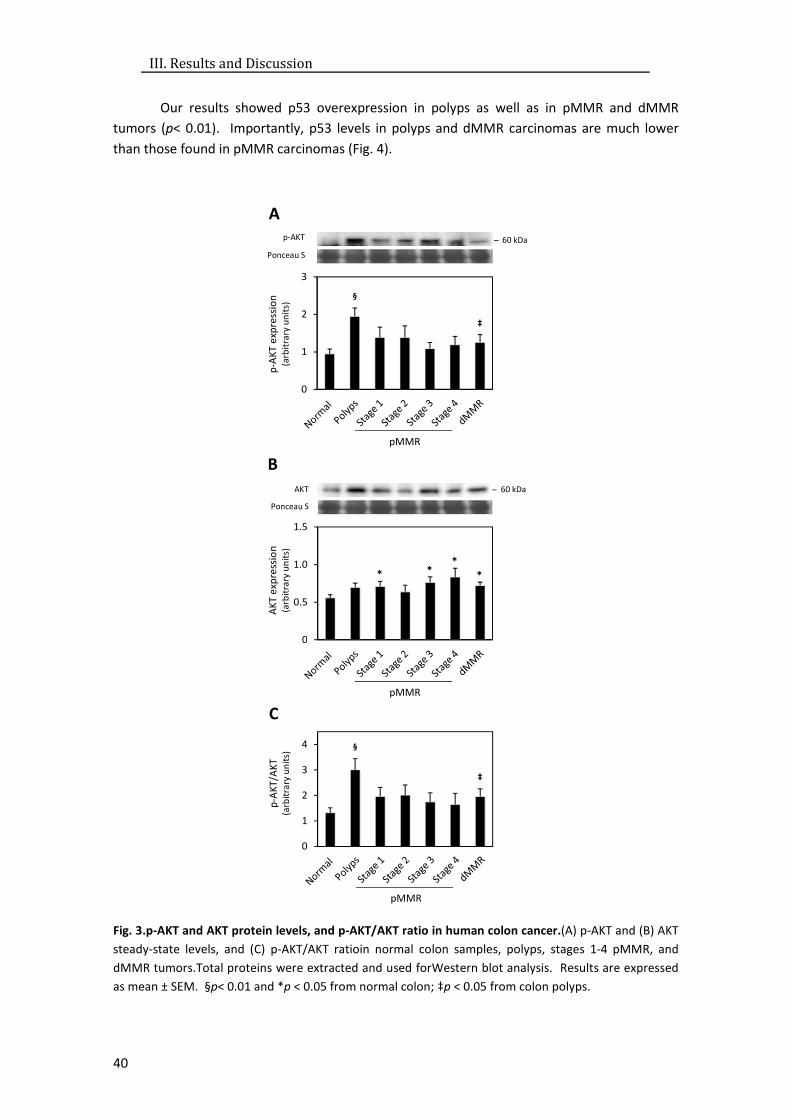
III. Results and Discussion
40
Our results showed p53 overexpression in polyps as well as in pMMR and dMMR
tumors (p< 0.01). Importantly, p53 levels in polyps and dMMR carcinomas are much lower
than those found in pMMR carcinomas (Fig. 4).
Fig. 3.p-AKT and AKT protein levels, and p-AKT/AKT ratio in human colon cancer.(A) p-AKT and (B) AKT
steady-state levels, and (C) p-AKT/AKT ratioin normal colon samples, polyps, stages 1-4 pMMR, and
dMMR tumors.Total proteins were extracted and used forWestern blot analysis. Results are expressed
as mean ± SEM. §p< 0.01 and *p < 0.05 from normal colon; ‡p < 0.05 from colon polyps.
0
1
2
3
4
C
§
‡
pMMR
p-A
KT/
AK
T(a
rbit
rary
un
its)
0
1
2
3
A
‡
§
p-AKT 60 kDa
Ponceau S
pMMR
p-A
KT
exp
ress
ion
(arb
itra
ry u
nit
s)
0.0
0.5
1.0
1.5
(Arb
itra
ry u
nit
s)
B
*
***
AKT 60 kDa
Ponceau S
pMMR
AK
T e
xpre
ssio
n(a
rbit
rary
un
its)

III. Results and Discussion
41
Fig. 4.p53protein levels in human colon cancer.p53 steady-state levels in normal, polyps, stages 1-4
pMMR, and dMMR tumors. Total proteins were extracted and used for Western blot analysis. Results
are expressed as mean ± SEM. §p< 0.01 and *p < 0.05 from normal colon; ‡p < 0.05 from colon polyps.
The apparent p53 overexpression may result from stable mutant proteins that
accumulate in cells, which is a common event in several types of cancer, including CRC
(Iacopetta, 2003). In addition, the loss of functional p53 in adenomas represents a minority of
cases (Baker et al., 1990). Therefore, the increased p53 steady-state levels found in adenomas
might be associated with an attempt to control cell growth, rather than derive from p53
mutations. Nevertheless, this requires further experiments to characterize p53 status. In
dMMR carcinomas, it has been reported that mutations in p53 are infrequent (Zaanan et al.,
2010), and our data apparently illustrates this aspect. The lower rate of p53 mutation might
also be related with the better prognosis associated with CRC presenting MSI in contrast to
CRC presenting intact mismatch repair system (Popat et al., 2005).
The present results are in accordance with the literature and suggest that the loss of
functional p53 is indeed involved in the adenoma to carcinoma transition, and that the status
of the mismatch repair system is strongly correlated with the frequency of p53 mutations
(Grady and Carethers, 2008).
2. Development of a Small Non-coding RNA Delivery Tool
Despite the use of 5-FU as the drug of choice for the treatment of CRC (Borralho et al.,
2007; Longley et al., 2003), major improvements in the treatment of colon cancer have been
associated with the development and introduction of new systemic therapeutic agents. These
might be either cytotoxic or targeted agents. Cytotoxic agents such as irinotecan, oxaliplatin
and fluoropyrimidines, and targeted agents including bevacizumab, the antibody against
vascular endothelial growth factor A, have increased the survival of patients with advanced
CRC. Nevertheless, in most patients, the disease remains incurable (Jonker et al., 2007), and
more specific agents with reduced side-effects are in high demand.
0
4
8
12
§
§
§ §*
*
‡
‡‡ ‡
p53 53 kDa
Ponceau S
pMMR
p5
3 e
xpre
ssio
n(r
bit
rary
un
its)

III. Results and Discussion
42
The main goal in cancer therapy is to develop a systemic therapeutic agent that could
improve overall and progression-free survival. This led to the development of agents that
specifically inhibit tumor growth, such as cetuximab. Cetuximab is a monoclonal antibody
targeted agent that binds to the extracellular domain of EGFR, frequently upregulated in CRC,
leading to its internalization and degradation. Cetuximab treatment improves overall and
progression-free survival in patients with CRC, in whom other treatments have failed (Jonker et
al., 2007). Cetuximab prevents the activation of EGFR signaling that is responsible for tumor
enhancement by promoting apoptosis inhibition, proliferation, angiogenesis and metastasis
(Vincenzi et al., 2008). Importantly, CRC cell sensitivity to cetuximab is affected according to
the presence of mutations in downstream effectors, such as KRAS and PTEN. Mutations in
KRAS and loss of PTEN expression are negative predictive markers for cetuximab response
(Frattini et al., 2007; Karapetis et al., 2008).
The discovery that miR-143 is commonly downregulated in CRC(Akao et al., 2010; Akao
et al., 2006; Michael et al., 2003), in association with the demonstration that miR-143 forced
expression significantly reduces tumor growth and proliferation, while increasing tumor cell
apoptosis (Borralho et al., 2011), and chemosensitizing to 5-FU(Borralho et al., 2009), have
revealed the promising therapeutic usefulness of miR-143 mimetics in CRC. Importantly, there
is also better knowledge on its biological targets involved in the regulation of these cellular
events, which include ERK5, KRAS and Bcl-2, among other relevant targets in CRC. Curiously,
recent data from our laboratory indicates that miR-143 overexpression leads to NF-κB
downregulation(Borralho et al., 2009) and reduced activation (Borralho et al., 2011).
Interestingly, Ras is an upstream regulator of AKT (Tokunaga et al., 2008), which is also directly
targeted by miR-143 inCRC(Chen et al., 2009). Importantly, in prostate cancer cell lines,
mutant KRAS reduced miR-143 expression, whereas miR-143 overexpression reduced ERK1/2
and AKT activation. Therefore, the activity of the AKT signaling pathway might also be
regulated by miR-143 in colon cancer (Kent et al., 2010). In accordance with this notion, AKT
downregulation by miR-143 tumor suppression function was very recently reported in human
bladder cancer cell lines (Noguchi et al., 2011). In addition, maturation of several miRNAs,
including miR-143, is enhanced by p53, while mutant forms of p53 hamper miRNA maturation,
leading to reduced mature miRNA production (Suzuki et al., 2009). Therefore, loss of
functional p53 in CRC might also contribute to the maintenance of low miR-143 levels.
Collectively, these findings offer the basis, and strengthen the rationale behind the potential
use of miR-143 as a therapeutic tool.
The knowledge of the potential for miR-143 to target downstream effectors of the
EGFR signaling pathway may prove to be effective in overcoming apoptosis inhibition, and
reducing tumor growth and progression. However, the therapeutic application of miRNAs will
rely on the development of efficient delivery strategies, since naked unmodified small RNAs
are often unstable in circulation. Therefore, we are attempting to develop a delivery strategy
based in the conjugation of miR-143 to cetuximab. With this approach, we aim to take
advantage of the benefits offered by both cetuximaband miR-143.
The strategy under development consists in the conjugation of cetuximab with FITC.
This conjugation will be accomplished by the FITC reaction with primary amines on cetuximab,
resulting in covalently bound protein-dye conjugates. Subsequently, an anti-FITC-protamine
single chain Fv (scFv) antibody will be bound to FITC-labeled cetuximab (cetuximab-FITC), and
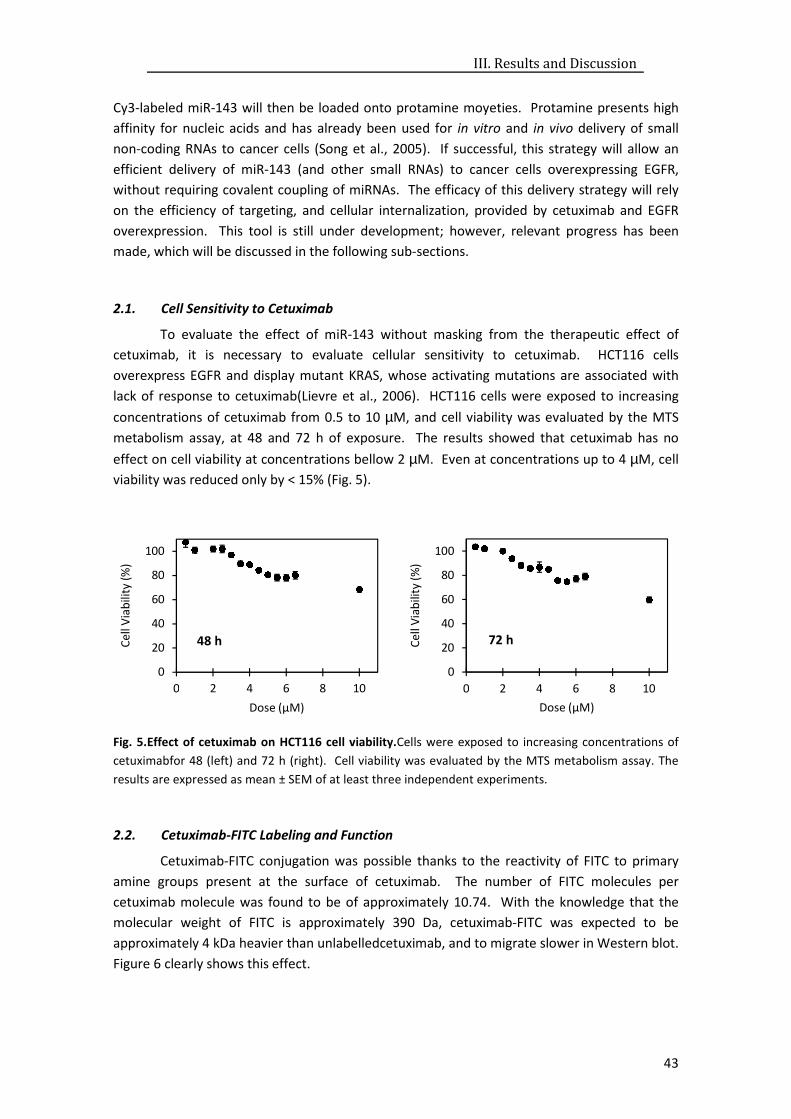
III. Results and Discussion
43
Cy3-labeled miR-143 will then be loaded onto protamine moyeties. Protamine presents high
affinity for nucleic acids and has already been used for in vitro and in vivo delivery of small
non-coding RNAs to cancer cells (Song et al., 2005). If successful, this strategy will allow an
efficient delivery of miR-143 (and other small RNAs) to cancer cells overexpressing EGFR,
without requiring covalent coupling of miRNAs. The efficacy of this delivery strategy will rely
on the efficiency of targeting, and cellular internalization, provided by cetuximab and EGFR
overexpression. This tool is still under development; however, relevant progress has been
made, which will be discussed in the following sub-sections.
2.1. Cell Sensitivity to Cetuximab
To evaluate the effect of miR-143 without masking from the therapeutic effect of
cetuximab, it is necessary to evaluate cellular sensitivity to cetuximab. HCT116 cells
overexpress EGFR and display mutant KRAS, whose activating mutations are associated with
lack of response to cetuximab(Lievre et al., 2006). HCT116 cells were exposed to increasing
concentrations of cetuximab from 0.5 to 10 µM, and cell viability was evaluated by the MTS
metabolism assay, at 48 and 72 h of exposure. The results showed that cetuximab has no
effect on cell viability at concentrations bellow 2 µM. Even at concentrations up to 4 µM, cell
viability was reduced only by < 15% (Fig. 5).
Fig. 5.Effect of cetuximab on HCT116 cell viability.Cells were exposed to increasing concentrations of
cetuximabfor 48 (left) and 72 h (right). Cell viability was evaluated by the MTS metabolism assay. The
results are expressed as mean ± SEM of at least three independent experiments.
2.2. Cetuximab-FITC Labeling and Function
Cetuximab-FITC conjugation was possible thanks to the reactivity of FITC to primary
amine groups present at the surface of cetuximab. The number of FITC molecules per
cetuximab molecule was found to be of approximately 10.74. With the knowledge that the
molecular weight of FITC is approximately 390 Da, cetuximab-FITC was expected to be
approximately 4 kDa heavier than unlabelledcetuximab, and to migrate slower in Western blot.
Figure 6 clearly shows this effect.
0
20
40
60
80
100
0 2 4 6 8 10
0
20
40
60
80
100
0 2 4 6 8 10
Cel
l Via
bili
ty (
%)
Cel
l Via
bili
ty (
%)
Dose (µM) Dose (µM)
48 h 72 h
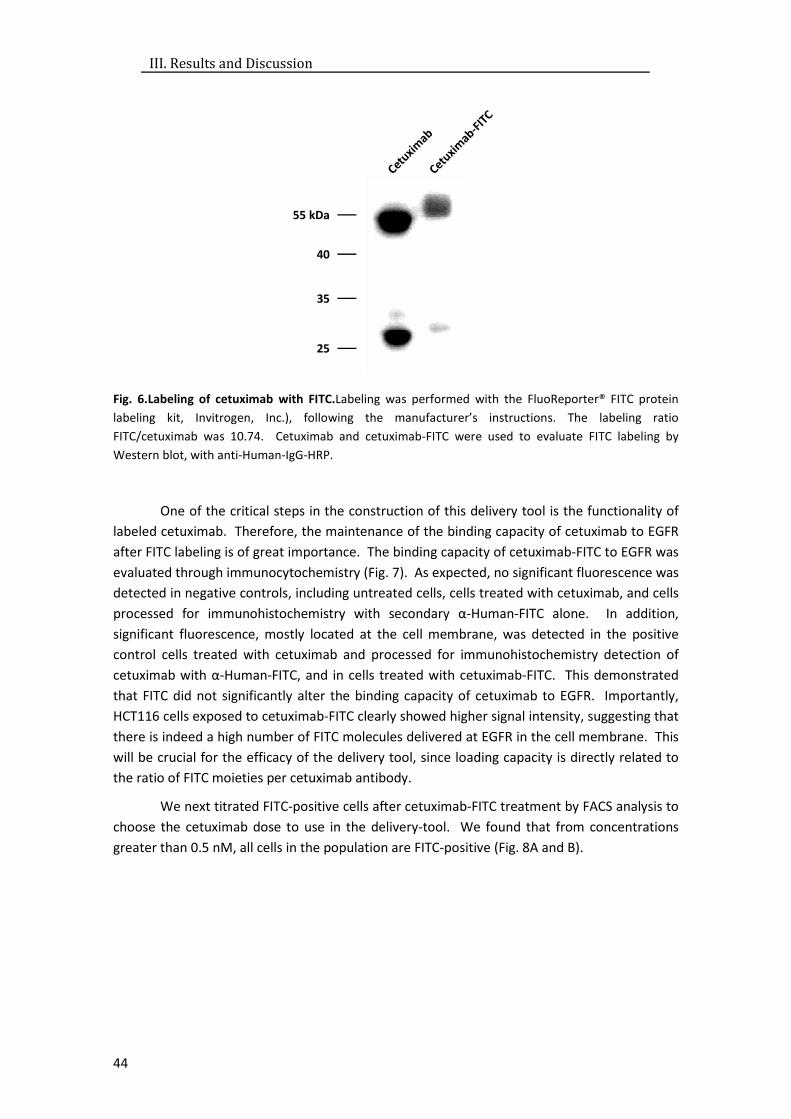
III. Results and Discussion
44
Fig. 6.Labeling of cetuximab with FITC.Labeling was performed with the FluoReporter® FITC protein
labeling kit, Invitrogen, Inc.), following the manufacturer’s instructions. The labeling ratio
FITC/cetuximab was 10.74. Cetuximab and cetuximab-FITC were used to evaluate FITC labeling by
Western blot, with anti-Human-IgG-HRP.
One of the critical steps in the construction of this delivery tool is the functionality of
labeled cetuximab. Therefore, the maintenance of the binding capacity of cetuximab to EGFR
after FITC labeling is of great importance. The binding capacity of cetuximab-FITC to EGFR was
evaluated through immunocytochemistry (Fig. 7). As expected, no significant fluorescence was
detected in negative controls, including untreated cells, cells treated with cetuximab, and cells
processed for immunohistochemistry with secondary α-Human-FITC alone. In addition,
significant fluorescence, mostly located at the cell membrane, was detected in the positive
control cells treated with cetuximab and processed for immunohistochemistry detection of
cetuximab with α-Human-FITC, and in cells treated with cetuximab-FITC. This demonstrated
that FITC did not significantly alter the binding capacity of cetuximab to EGFR. Importantly,
HCT116 cells exposed to cetuximab-FITC clearly showed higher signal intensity, suggesting that
there is indeed a high number of FITC molecules delivered at EGFR in the cell membrane. This
will be crucial for the efficacy of the delivery tool, since loading capacity is directly related to
the ratio of FITC moieties per cetuximab antibody.
We next titrated FITC-positive cells after cetuximab-FITC treatment by FACS analysis to
choose the cetuximab dose to use in the delivery-tool. We found that from concentrations
greater than 0.5 nM, all cells in the population are FITC-positive (Fig. 8A and B).
55 kDa
40
35
25
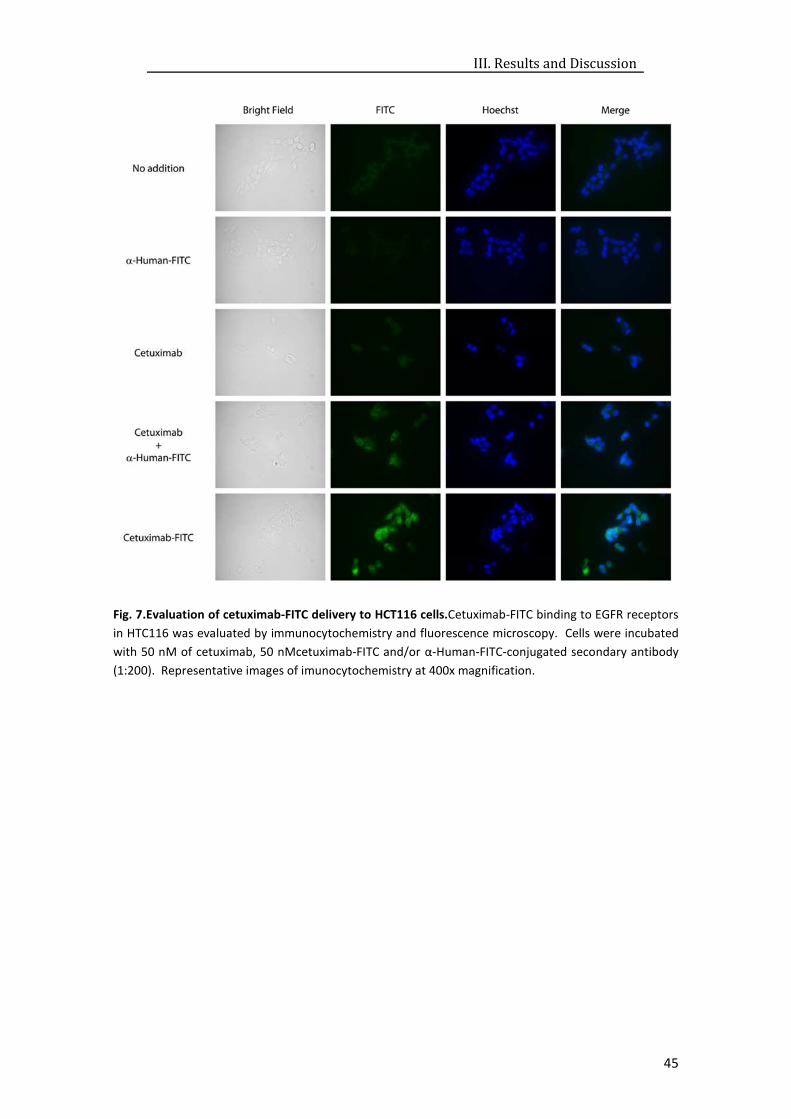
III. Results and Discussion
45
Fig. 7.Evaluation of cetuximab-FITC delivery to HCT116 cells.Cetuximab-FITC binding to EGFR receptors
in HTC116 was evaluated by immunocytochemistry and fluorescence microscopy. Cells were incubated
with 50 nM of cetuximab, 50 nMcetuximab-FITC and/or α-Human-FITC-conjugated secondary antibody
(1:200). Representative images of imunocytochemistry at 400x magnification.
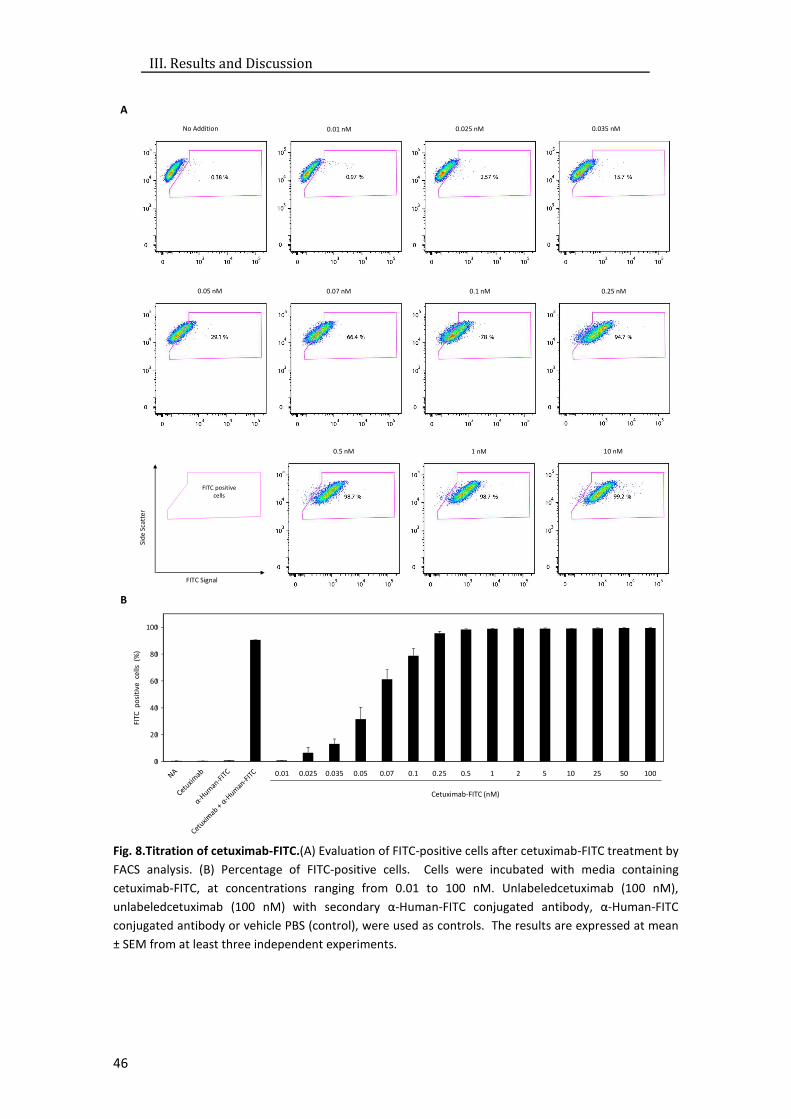
III. Results and Discussion
46
Fig. 8.Titration of cetuximab-FITC.(A) Evaluation of FITC-positive cells after cetuximab-FITC treatment by
FACS analysis. (B) Percentage of FITC-positive cells. Cells were incubated with media containing
cetuximab-FITC, at concentrations ranging from 0.01 to 100 nM. Unlabeledcetuximab (100 nM),
unlabeledcetuximab (100 nM) with secondary α-Human-FITC conjugated antibody, α-Human-FITC
conjugated antibody or vehicle PBS (control), were used as controls. The results are expressed at mean
± SEM from at least three independent experiments.
Sid
e S
catt
er
FITC Signal
No Addition 0.01 nM 0.025 nM 0.035 nM
0.05 nM 0.07 nM 0.1 nM 0.25 nM
0.5 nM 1 nM 10 nM
FITC positivecells
A
0
20
40
60
80
100
0.01 0.025 0.035 0.05 0.07 0.1 0.25 0.5 1 2 5 10 25 50 100
Cetuximab-FITC (nM)
0
20
40
60
80
100
FITC
po
siti
ve c
ells
(%
)
B

III. Results and Discussion
47
2.3. α-FITC-protamine scFVBinding to Cetuximab-FITC
The next step in the construction of the delivery complex was to evaluate binding of
the α-FITC-protamine fusion protein to cetuximab-FITC. This was performed by ELISA, using an
anti-HA-HRP antibody for the detection of HA tagged protein. The results showed enrichment
in α-FITC-protamine scFv binding to cetuximab-FITC, compared to unlabeled cetuximab (Fig. 9,
column 4versus column 3)(p < 0.05). However, the overall signal intensities measured in these
experiments were quite low, suggestive of possible problems in α-FITC-protamine scFv. We
later confirmed that the α-FITC-protamine in this batch was highly degraded, which explains
the low signal (data not shown).
Fig. 9.Evaluation of α-FITC-protamine scFV binding to cetuximab-FITC.α-FITC-protamine scFV binding to
cetuximab-FITC was evaluated by ELISA for HA, using α-HA-HRP and ABTS with 0.2% H2O2 as substrate.
Cetuximab and α-Human-FITC conjugated antibody were used as negative and positive controls,
respectively. Results are displayed as absorbance at 405 nm with reference at 492nm. Results are
expressed at mean ± SEM from at least three independent experiments.*p < 0.05 from cetuximab.
2.4. Delivery of α-FITC-protamine scFv Conjugated with Cetuximab-FITC Complex
The delivery of α-FITC-protamine scFv to cells was performed after in vitro complex
formation with cetuximab-FITC. For these experiments, we used 5 nMcetuximab-FITC and α-
FITC-protamine scFv at a molecular ratio to cetuximab-FITC of 15:1, to allow all FITC residues
on cetuximab to be bound by α-FITC-protamine scFv. Subsequently, complexes were delivered
to HCT116 cells and α-FITC-protamine scFv cellular delivery was evaluated by Western blot
using total protein extracts. Since α-FITC-protamine has an N-terminal HA tag and a C-terminal
His tag, we detected both tags by immunobloting. The results clearly show the presence of a
duplet band displaying α-HA reactivity in the positive control for α-FITC-protamine scFv (Fig.
10, upper panel, lane 7). This indicates that α-FITC-protamine scFv is to some extent
degraded. In addition, a relevant fraction corresponding to the lower band in the doublet may
be devoided of protamine. Further dissecting these results, the N-terminal region appears to
remain intact since both bands in the doublet display α-HA reactivity. In contrast, anti-His
immunoblotting showed that the C-terminal region of α-FITC-protamine scFv was degraded,
since the lowest band in the doublet did not display α-His reactivity (Fig. 10, middle panel, lane
0
0.2
0.4
+α-FITC-Protamine + + +
-α-Human-FITC - -+Cetuximab - - + -
Cetuximab-FITC - +- -
Ab
sorb
ance
(arb
itra
ry U
nit
s)
*
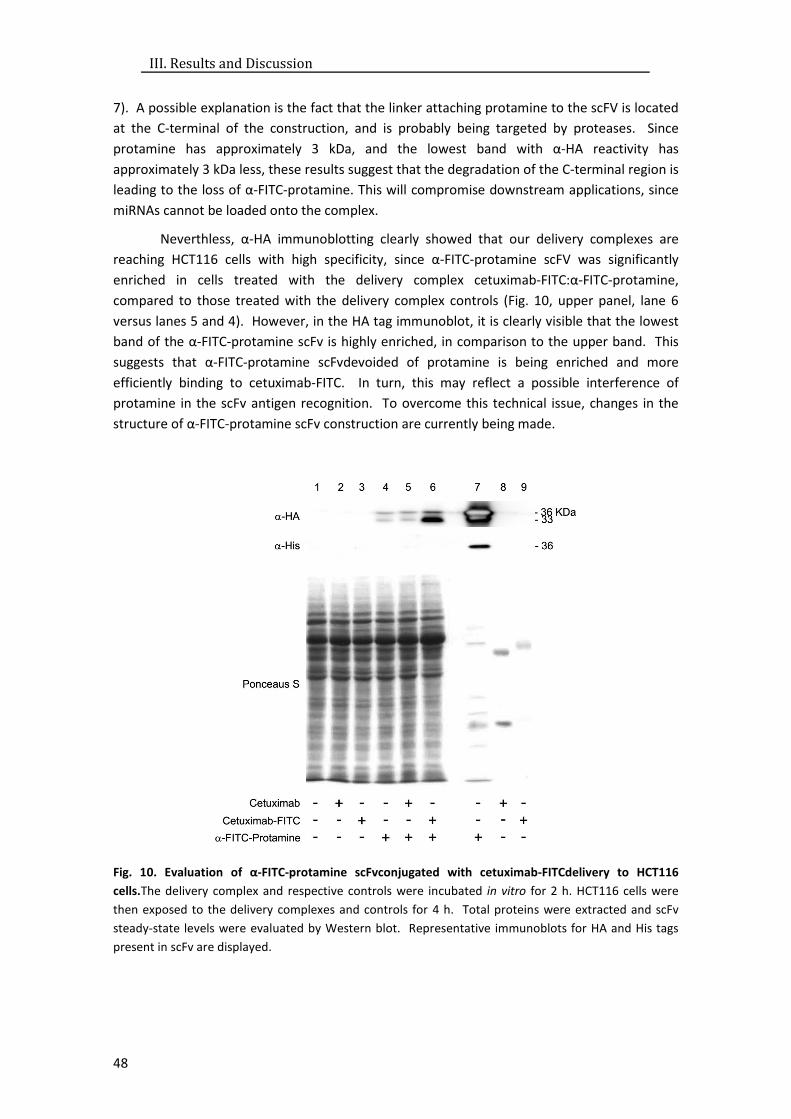
III. Results and Discussion
48
7). A possible explanation is the fact that the linker attaching protamine to the scFV is located
at the C-terminal of the construction, and is probably being targeted by proteases. Since
protamine has approximately 3 kDa, and the lowest band with α-HA reactivity has
approximately 3 kDa less, these results suggest that the degradation of the C-terminal region is
leading to the loss of α-FITC-protamine. This will compromise downstream applications, since
miRNAs cannot be loaded onto the complex.
Neverthless, α-HA immunoblotting clearly showed that our delivery complexes are
reaching HCT116 cells with high specificity, since α-FITC-protamine scFV was significantly
enriched in cells treated with the delivery complex cetuximab-FITC:α-FITC-protamine,
compared to those treated with the delivery complex controls (Fig. 10, upper panel, lane 6
versus lanes 5 and 4). However, in the HA tag immunoblot, it is clearly visible that the lowest
band of the α-FITC-protamine scFv is highly enriched, in comparison to the upper band. This
suggests that α-FITC-protamine scFvdevoided of protamine is being enriched and more
efficiently binding to cetuximab-FITC. In turn, this may reflect a possible interference of
protamine in the scFv antigen recognition. To overcome this technical issue, changes in the
structure of α-FITC-protamine scFv construction are currently being made.
Fig. 10. Evaluation of α-FITC-protamine scFvconjugated with cetuximab-FITCdelivery to HCT116
cells.The delivery complex and respective controls were incubated in vitro for 2 h. HCT116 cells were
then exposed to the delivery complexes and controls for 4 h. Total proteins were extracted and scFv
steady-state levels were evaluated by Western blot. Representative immunoblots for HA and His tags
present in scFv are displayed.

III. Results and Discussion
49
3. Conclusions and Future Work
Our results are the first to demonstrate overexpression of two main kinase effectors of
the ERK5 signaling pathwayin CRC, ERK5 and its direct activator MEK5. Our data strongly
suggest that ERK5 overexpression may be a relevant event in the transition of normal colon to
adenoma, and also for the progression of adenoma to carcinoma. This, in turn, may reflect
loss of miR-143 expression, which is known to occur early in the transition of normal colon to
adenoma and to persist in CRC tumors. The evaluation of miR-143 expression and the
correlation with the present ERK5 expression data would more properly allow the testing
ofthis suggested correlation. In addition, our results indicate that accompanying aberrant
ERK5 and MEK5 expression, NF-κB and PI3K/AKT signaling pathways are also aberrantly
activated in CRC, independently of MMR system status. The activation of these particular
signaling routes might be stimulated by ERK5, or by other upstream pathway commonly
deregulated in cancer. The activation of AKT seems to be particularly important as an early
event in CRC development, whereas NF-κB activation seems to be important in tumor
development and maintenance. Further, the loss of functional p53 may be involved in the
adenoma to carcinoma transition, and contribute to uncontrolled cell growth. However, the
loss of functional p53 is not a common event in dMMR carcinomas and that might be related
with the better prognosis of this type of tumors.
The known capacity of miR-143 to target downstream effectors of the EGFR signaling
pathway, particularly ERK5, might constitute a relevant novel therapeutic tool for CRC
management. The present study suggests that ERK5 targeting, possibly via miR-143
overexpression, might be promising and beneficial in the treatment of CRC, thus deserving
further investigation. Here, we propose to prepare a delivery tool that combines cetuximab
and miR-143. The great enthusiastic advantage of the development of this particular delivery
tool arises from the combination of a therapeutic agent already in clinical use for CRC
treatment, featuring very good targeting specificity and increased overall and progression-free
survival, together with the high potential provided by RNAinterference. Particularly, miRNAs
may target multiple deleterious factors in cancer cells. Therefore, the complementary actions
of cetuximab and miR-143 in CRC therapy is highly promising in the management of CRC, and
expected to significantly improve the efficacy of current therapeutic agents.


IV. REFERENCES


IV. References
53
Akao, Y., Y. Nakagawa, I. Hirata, A. Iio, T. Itoh, K. Kojima, R. Nakashima, Y. Kitade, and T. Naoe. 2010. Role of anti-oncomirs miR-143 and -145 in human colorectal tumors. Cancer
Gene Ther. 17:398-408.
Akao, Y., Y. Nakagawa, A. Iio, and T. Naoe. 2009. Role of microRNA-143 in Fas-mediated apoptosis in human T-cell leukemia Jurkat cells. Leuk Res. 33:1530-1538.
Akao, Y., Y. Nakagawa, Y. Kitade, T. Kinoshita, and T. Naoe. 2007. Downregulation of microRNAs-143 and -145 in B-cell malignancies. Cancer Sci. 98:1914-1920.
Akao, Y., Y. Nakagawa, and T. Naoe. 2006. MicroRNAs 143 and 145 are possible common onco-microRNAs in human cancers. Oncol Rep. 16:845-850.
Al-Sukhni, W., M. Aronson, and S. Gallinger. 2008. Hereditary colorectal cancer syndromes: familial adenomatous polyposis and lynch syndrome. Surg Clin North Am. 88:819-844, vii.
Altomare, D.A., and J.R. Testa. 2005. Perturbations of the AKT signaling pathway in human cancer. Oncogene. 24:7455-7464.
Amaral, J.D., J.M. Xavier, C.J. Steer, and C.M. Rodrigues. 2010. Targeting the p53 pathway of apoptosis. Curr Pharm Des. 16:2493-2503.
American Cancer Society. 2011. Colorectal cancer facts &figures 2011-2013. Atlanta: American
Cancer Society.
Aranha, M.M., P.M. Borralho, P. Ravasco, I.B. Moreira da Silva, L. Correia, A. Fernandes, M.E. Camilo, and C.M. Rodrigues. 2007. NF-kappaB and apoptosis in colorectal tumourigenesis. Eur J Clin Invest. 37:416-424.
Arends, J.W. 2000. Molecular interactions in the Vogelstein model of colorectal carcinoma. J Pathol. 190:412-416.
Baker, S.J., A.C. Preisinger, J.M. Jessup, C. Paraskeva, S. Markowitz, J.K. Willson, S. Hamilton, and B. Vogelstein. 1990. p53 gene mutations occur in combination with 17p allelic deletions as late events in colorectal tumorigenesis. Cancer Res. 50:7717-7722.
Balint, E.E., and K.H. Vousden. 2001. Activation and activities of the p53 tumour suppressor protein. Br J Cancer. 85:1813-1823.
Bartel, D.P. 2004. MicroRNAs: genomics, biogenesis, mechanism, and function. Cell. 116:281-297.
Baudhuin, L.M., L.J. Burgart, O. Leontovich, and S.N. Thibodeau. 2005. Use of microsatellite instability and immunohistochemistry testing for the identification of individuals at risk for Lynch syndrome. Fam Cancer. 4:255-265.
Boland, C.R., S.N. Thibodeau, S.R. Hamilton, D. Sidransky, J.R. Eshleman, R.W. Burt, S.J. Meltzer, M.A. Rodriguez-Bigas, R. Fodde, G.N. Ranzani, and S. Srivastava. 1998. A national cancer institute workshop on microsatellite instability for cancer detection and familial predisposition: development of international criteria for the determination of microsatellite instability in colorectal cancer. Cancer Res. 58:5248-5257.
Borchert, G.M., W. Lanier, and B.L. Davidson. 2006. RNA polymerase III transcribes human microRNAs. Nat Struct Mol Biol. 13:1097-1101.
Borralho, P.M., B.T. Kren, R.E. Castro, I.B. da Silva, C.J. Steer, and C.M. Rodrigues. 2009. MicroRNA-143 reduces viability and increases sensitivity to 5-fluorouracil in HCT116 human colorectal cancer cells. FEBS J. 276:6689-6700.
IV. References
54
Borralho, P.M., I.B. Moreira da Silva, M.M. Aranha, C. Albuquerque, C. Nobre Leitao, C.J. Steer, and C.M. Rodrigues. 2007. Inhibition of Fas expression by RNAi modulates 5-fluorouracil-induced apoptosis in HCT116 cells expressing wild-type p53. Biochim
Biophys Acta. 1772:40-47.
Borralho, P.M., A.E.S. Simões, S.E. Gomes, R.T. Lima, T. Carvalho, D.M.S. Ferreira, M.H. Vasconcelos, R.E. Castro, and C.M.P. Rodrigues. 2011. miR-143 overexpression impairs growth of human colon carcinoma xenografts in mice with induction of apoptosis and inhibition of proliferation. PLoS One. 6:1-11.
Bouali, S., A.S. Chretien, C. Ramacci, M. Rouyer, S. Marchal, T. Galenne, P. Juin, P. Becuwe, and J.L. Merlin. 2009. P53 and PTEN expression contribute to the inhibition of EGFR downstream signaling pathway by cetuximab. Cancer Gene Ther. 16:498-507.
Calin, G.A., and C.M. Croce. 2006. MicroRNA signatures in human cancers. Nat Rev Cancer. 6:857-866.
Calin, G.A., C. Sevignani, C.D. Dumitru, T. Hyslop, E. Noch, S. Yendamuri, M. Shimizu, S. Rattan, F. Bullrich, M. Negrini, and C.M. Croce. 2004. Human microRNA genes are frequently located at fragile sites and genomic regions involved in cancers. Proc Natl Acad Sci U S
A. 101:2999-3004.
Cargnello, M., and P.P. Roux. 2011. Activation and function of the MAPKs and their substrates, the MAPK-activated protein kinases. Microbiol Mol Biol Rev. 75:50-83.
Carnero, A., C. Blanco-Aparicio, O. Renner, W. Link, and J.F. Leal. 2008. The PTEN/PI3K/AKT signalling pathway in cancer, therapeutic implications. Curr Cancer Drug Targets. 8:187-198.
Carthew, R.W., and E.J. Sontheimer. 2009. Origins and mechanisms of miRNAs and siRNAs. Cell. 136:642-655.
Chaturvedi, M.M., B. Sung, V.R. Yadav, R. Kannappan, and B.B. Aggarwal. 2011. NF-kappaB addiction and its role in cancer: 'one size does not fit all'. Oncogene. 30:1615-1630.
Chen, X., X. Guo, H. Zhang, Y. Xiang, J. Chen, Y. Yin, X. Cai, K. Wang, G. Wang, Y. Ba, L. Zhu, J. Wang, R. Yang, Y. Zhang, Z. Ren, K. Zen, J. Zhang, and C.Y. Zhang. 2009. Role of miR-143 targeting KRAS in colorectal tumorigenesis. Oncogene. 28:1385-1392.
Clape, C., V. Fritz, C. Henriquet, F. Apparailly, P.L. Fernandez, F. Iborra, C. Avances, M. Villalba, S. Culine, and L. Fajas. 2009. miR-143 interferes with ERK5 signaling, and abrogates prostate cancer progression in mice. PLoS One. 4:e7542.
Cude, K., Y. Wang, H.J. Choi, S.L. Hsuan, H. Zhang, C.Y. Wang, and Z. Xia. 2007. Regulation of the G2-M cell cycle progression by the ERK5-NFkappaB signaling pathway. J Cell Biol. 177:253-264.
Dolcet, X., D. Llobet, J. Pallares, and X. Matias-Guiu. 2005. NF-kB in development and progression of human cancer. Virchows Arch. 446:475-482.
Elmore, S. 2007. Apoptosis: a review of programmed cell death. Toxicol Pathol. 35:495-516.
Fang, J.Y., and B.C. Richardson. 2005. The MAPK signalling pathways and colorectal cancer. Lancet Oncol. 6:322-327.
Fearon, E.R. 2011. Molecular genetics of colorectal cancer. Annu Rev Pathol. 6:479-507.
Filipowicz, W., S.N. Bhattacharyya, and N. Sonenberg. 2008. Mechanisms of post-transcriptional regulation by microRNAs: are the answers in sight? Nat Rev Genet. 9:102-114.
IV. References
55
Frattini, M., P. Saletti, E. Romagnani, V. Martin, F. Molinari, M. Ghisletta, A. Camponovo, L.L. Etienne, F. Cavalli, and L. Mazzucchelli. 2007. PTEN loss of expression predicts cetuximab efficacy in metastatic colorectal cancer patients. Br J Cancer. 97:1139-1145.
Garaude, J., S. Cherni, S. Kaminski, E. Delepine, C. Chable-Bessia, M. Benkirane, J. Borges, A. Pandiella, M.A. Iniguez, M. Fresno, R.A. Hipskind, and M. Villalba. 2006. ERK5 activates NF-kappaB in leukemic T cells and is essential for their growth in vivo. J Immunol. 177:7607-7617.
Gayet, J., X.P. Zhou, A. Duval, S. Rolland, J.M. Hoang, P. Cottu, and R. Hamelin. 2001. Extensive characterization of genetic alterations in a series of human colorectal cancer cell lines. Oncogene. 20:5025-5032.
Girio, A., J.C. Montero, A. Pandiella, and S. Chatterjee. 2007. Erk5 is activated and acts as a survival factor in mitosis. Cell Signal. 19:1964-1972.
Grady, W.M., and J.M. Carethers. 2008. Genomic and epigenetic instability in colorectal cancer pathogenesis. Gastroenterology. 135:1079-1099.
Grandis, J.R., and J.C. Sok. 2004. Signaling through the epidermal growth factor receptor during the development of malignancy. Pharmacol Ther. 102:37-46.
Holand, K., F. Salm, and A. Arcaro. 2011. The phosphoinositide 3-kinase signaling pathway as a therapeutic target in grade IV brain tumors. Curr Cancer Drug Targets.[Epub ahead of print]
Hoshino, R., Y. Chatani, T. Yamori, T. Tsuruo, H. Oka, O. Yoshida, Y. Shimada, S. Ari-i, H. Wada, J. Fujimoto, and M. Kohno. 1999. Constitutive activation of the 41-/43-kDa mitogen-activated protein kinase signaling pathway in human tumors. Oncogene. 18:813-822.
Huerta, S., E.J. Goulet, and E.H. Livingston. 2006. Colon cancer and apoptosis. Am J Surg. 191:517-526.
Iacopetta, B. 2003. TP53 mutation in colorectal cancer. Hum Mutat. 21:271-276.
Johnson, S.M., P. Gulhati, B.A. Rampy, Y. Han, P.G. Rychahou, H.Q. Doan, H.L. Weiss, and B.M. Evers. 2010. Novel expression patterns of PI3K/Akt/mTOR signaling pathway components in colorectal cancer. J Am Coll Surg. 210:767-776, 776-768.
Jonker, D.J., C.J. O'Callaghan, C.S. Karapetis, J.R. Zalcberg, D. Tu, H.J. Au, S.R. Berry, M. Krahn, T. Price, R.J. Simes, N.C. Tebbutt, G. van Hazel, R. Wierzbicki, C. Langer, and M.J. Moore. 2007. Cetuximab for the treatment of colorectal cancer. N Engl J Med. 357:2040-2048.
Kane, L.P., V.S. Shapiro, D. Stokoe, and A. Weiss. 1999. Induction of NF-kappaB by the Akt/PKB kinase. Curr Biol. 9:601-604.
Karapetis, C.S., S. Khambata-Ford, D.J. Jonker, C.J. O'Callaghan, D. Tu, N.C. Tebbutt, R.J. Simes, H. Chalchal, J.D. Shapiro, S. Robitaille, T.J. Price, L. Shepherd, H.J. Au, C. Langer, M.J. Moore, and J.R. Zalcberg. 2008. K-ras mutations and benefit from cetuximab in advanced colorectal cancer. N Engl J Med. 359:1757-1765.
Karin, M., and A. Lin. 2002. NF-kappaB at the crossroads of life and death. Nat Immunol. 3:221-227.
Kehoe, J., and V.P. Khatri. 2006. Staging and prognosis of colon cancer. Surg Oncol Clin N Am. 15:129-146.
Kent, O.A., R.R. Chivukula, M. Mullendore, E.A. Wentzel, G. Feldmann, K.H. Lee, S. Liu, S.D. Leach, A. Maitra, and J.T. Mendell. 2010. Repression of the miR-143/145 cluster by

IV. References
56
oncogenic Ras initiates a tumor-promoting feed-forward pathway. Genes Dev. 24:2754-2759.
Kim, C.S., V.V. Vasko, Y. Kato, M. Kruhlak, M. Saji, S.Y. Cheng, and M.D. Ringel. 2005. AKT activation promotes metastasis in a mouse model of follicular thyroid carcinoma. Endocrinology. 146:4456-4463.
Kim, V.N., J. Han, and M.C. Siomi. 2009. Biogenesis of small RNAs in animals. Nat Rev Mol Cell
Biol. 10:126-139.
Kinzler, K.W., and B. Vogelstein. 1996. Lessons from hereditary colorectal cancer. Cell. 87:159-170.
Kojima, M., T. Morisaki, N. Sasaki, K. Nakano, R. Mibu, M. Tanaka, and M. Katano. 2004. Increased nuclear factor-kB activation in human colorectal carcinoma and its correlation with tumor progression. Anticancer Res. 24:675-681.
Lee, Y.S., and A. Dutta. 2009. MicroRNAs in cancer. Annu Rev Pathol. 4:199-227.
Lievre, A., J.B. Bachet, D. Le Corre, V. Boige, B. Landi, J.F. Emile, J.F. Cote, G. Tomasic, C. Penna, M. Ducreux, P. Rougier, F. Penault-Llorca, and P. Laurent-Puig. 2006. KRAS mutation status is predictive of response to cetuximab therapy in colorectal cancer. Cancer Res. 66:3992-3995.
Lindor, N.M., L.J. Burgart, O. Leontovich, R.M. Goldberg, J.M. Cunningham, D.J. Sargent, C. Walsh-Vockley, G.M. Petersen, M.D. Walsh, B.A. Leggett, J.P. Young, M.A. Barker, J.R. Jass, J. Hopper, S. Gallinger, B. Bapat, M. Redston, and S.N. Thibodeau. 2002. Immunohistochemistry versus microsatellite instability testing in phenotyping colorectal tumors. J Clin Oncol. 20:1043-1048.
Linnerth, N.M., M. Baldwin, C. Campbell, M. Brown, H. McGowan, and R.A. Moorehead. 2005. IGF-II induces CREB phosphorylation and cell survival in human lung cancer cells. Oncogene. 24:7310-7319.
Liu, X., K. Fortin, and Z. Mourelatos. 2008. MicroRNAs: biogenesis and molecular functions. Brain Pathol. 18:113-121.
Longley, D.B., D.P. Harkin, and P.G. Johnston. 2003. 5-fluorouracil: mechanisms of action and clinical strategies. Nat Rev Cancer. 3:330-338.
Lynch, H.T., C.R. Boland, G. Gong, T.G. Shaw, P.M. Lynch, R. Fodde, J.F. Lynch, and A. de la Chapelle. 2006. Phenotypic and genotypic heterogeneity in the Lynch syndrome: diagnostic, surveillance and management implications. Eur J Hum Genet. 14:390-402.
Manikandan, J., J.J. Aarthi, S.D. Kumar, and P.N. Pushparaj. 2008. Oncomirs: the potential role of non-coding microRNAs in understanding cancer. Bioinformation. 2:330-334.
Marcu, K.B., M. Otero, E. Olivotto, R.M. Borzi, and M.B. Goldring. 2010. NF-kappaB signaling: multiple angles to target OA. Curr Drug Targets. 11:599-613.
McCracken, S.R., A. Ramsay, R. Heer, M.E. Mathers, B.L. Jenkins, J. Edwards, C.N. Robson, R. Marquez, P. Cohen, and H.Y. Leung. 2008. Aberrant expression of extracellular signal-regulated kinase 5 in human prostate cancer. Oncogene. 27:2978-2988.
Mehta, P.B., B.L. Jenkins, L. McCarthy, L. Thilak, C.N. Robson, D.E. Neal, and H.Y. Leung. 2003. MEK5 overexpression is associated with metastatic prostate cancer, and stimulates proliferation, MMP-9 expression and invasion. Oncogene. 22:1381-1389.
IV. References
57
Michael, M.Z., O.C. SM, N.G. van Holst Pellekaan, G.P. Young, and R.J. James. 2003. Reduced accumulation of specific microRNAs in colorectal neoplasia. Mol Cancer Res. 1:882-891.
Montero, J.C., A. Ocana, M. Abad, M.J. Ortiz-Ruiz, A. Pandiella, and A. Esparis-Ogando. 2009. Expression of Erk5 in early stage breast cancer and association with disease free survival identifies this kinase as a potential therapeutic target. PLoS One. 4:e5565.
Mosca, E., M. Barcella, R. Alfieri, A. Bevilacqua, G. Canti, and L. Milanesi. 2011. Systems biology of the metabolic network regulated by the Akt pathway. Biotechnol Adv. [Epub ahead of print]
Nathke, I.S. 2004. The adenomatous polyposis coli protein: the Achilles heel of the gut epithelium. Annu Rev Cell Dev Biol. 20:337-366.
Ng, E.K., W.P. Tsang, S.S. Ng, H.C. Jin, J. Yu, J.J. Li, C. Rocken, M.P. Ebert, T.T. Kwok, and J.J. Sung. 2009. MicroRNA-143 targets DNA methyltransferases 3A in colorectal cancer. Br
J Cancer. 101:699-706.
Nishimoto, S., and E. Nishida. 2006. MAPK signalling: ERK5 versus ERK1/2. EMBO Rep. 7:782-786.
Noguchi, S., T. Mori, Y. Hoshino, K. Maruo, N. Yamada, Y. Kitade, T. Naoe, and Y. Akao. 2011. MicroRNA-143 functions as a tumor suppressor in human bladder cancer T24 cells. Cancer Lett. 307:211-220.
Peer, D., P. Zhu, C.V. Carman, J. Lieberman, and M. Shimaoka. 2007. Selective gene silencing in activated leukocytes by targeting siRNAs to the integrin lymphocyte function-associated antigen-1. Proc Natl Acad Sci U S A. 104:4095-4100.
Popat, S., R. Hubner, and R.S. Houlston. 2005. Systematic review of microsatellite instability and colorectal cancer prognosis. J Clin Oncol. 23:609-618.
Potten, C.S., M. Kellett, S.A. Roberts, D.A. Rew, and G.D. Wilson. 1992. Measurement of in vivo proliferation in human colorectal mucosa using bromodeoxyuridine. Gut. 33:71-78.
Potter, J.D. 1996. Nutrition and colorectal cancer. Cancer Causes Control. 7:127-146.
Potter, J.D. 1999. Colorectal cancer: molecules and populations. J Natl Cancer Inst. 91:916-932.
Quivy, V., and C. Van Lint. 2004. Regulation at multiple levels of NF-kappaB-mediated transactivation by protein acetylation. Biochem Pharmacol. 68:1221-1229.
Ramsay, A.K., S.R. McCracken, M. Soofi, J. Fleming, A.X. Yu, I. Ahmad, R. Morland, L. Machesky, C. Nixon, D.R. Edwards, R.K. Nuttall, M. Seywright, R. Marquez, E. Keller, and H.Y. Leung. 2011. ERK5 signalling in prostate cancer promotes an invasive phenotype. Br J
Cancer. 104:664-672.
Ricci-Vitiani, L., A. Pagliuca, E. Palio, A. Zeuner, and R. De Maria. 2008. Colon cancer stem cells. Gut. 57:538-548.
Rivlin, N., R. Brosh, M. Oren, and V. Rotter. 2011. Mutations in the p53 tumor suppressor gene: important milestones at the various steps of tumorigenesis. Genes Cancer. 2:466-474.
Roberts, O.L., K. Holmes, J. Muller, D.A. Cross, and M.J. Cross. 2009. ERK5 and the regulation of endothelial cell function. Biochem Soc Trans. 37:1254-1259.
Roberts, P.J., and C.J. Der. 2007. Targeting the Raf-MEK-ERK mitogen-activated protein kinase cascade for the treatment of cancer. Oncogene. 26:3291-3310.

IV. References
58
Roy, H.K., B.F. Olusola, D.L. Clemens, W.J. Karolski, A. Ratashak, H.T. Lynch, and T.C. Smyrk. 2002. AKT proto-oncogene overexpression is an early event during sporadic colon carcinogenesis. Carcinogenesis. 23:201-205.
Sakamoto, K., S. Maeda, Y. Hikiba, H. Nakagawa, Y. Hayakawa, W. Shibata, A. Yanai, K. Ogura, and M. Omata. 2009. Constitutive NF-kappaB activation in colorectal carcinoma plays a key role in angiogenesis, promoting tumor growth. Clin Cancer Res. 15:2248-2258.
Sheng, S., M. Qiao, and A.B. Pardee. 2009. Metastasis and AKT activation. J Cell Physiol. 218:451-454.
Slaby, O., M. Svoboda, J. Michalek, and R. Vyzula. 2009. MicroRNAs in colorectal cancer: translation of molecular biology into clinical application. Mol Cancer. 8:102.
Song, E., P. Zhu, S.K. Lee, D. Chowdhury, S. Kussman, D.M. Dykxhoorn, Y. Feng, D. Palliser, D.B. Weiner, P. Shankar, W.A. Marasco, and J. Lieberman. 2005. Antibody mediated in vivo delivery of small interfering RNAs via cell-surface receptors. Nat Biotechnol. 23:709-717.
Sticht, C., K. Freier, K. Knopfle, C. Flechtenmacher, S. Pungs, C. Hofele, M. Hahn, S. Joos, and P. Lichter. 2008. Activation of MAP kinase signaling through ERK5 but not ERK1 expression is associated with lymph node metastases in oral squamous cell carcinoma (OSCC). Neoplasia. 10:462-470.
Suzuki, H.I., K. Yamagata, K. Sugimoto, T. Iwamoto, S. Kato, and K. Miyazono. 2009. Modulation of microRNA processing by p53. Nature. 460:529-533.
Takagi, T., A. Iio, Y. Nakagawa, T. Naoe, N. Tanigawa, and Y. Akao. 2009. Decreased expression of microRNA-143 and -145 in human gastric cancers. Oncology. 77:12-21.
Tan, J., L. Zhuang, H.S. Leong, N.G. Iyer, E.T. Liu, and Q. Yu. 2005. Pharmacologic modulation of glycogen synthase kinase-3beta promotes p53-dependent apoptosis through a direct Bax-mediated mitochondrial pathway in colorectal cancer cells. Cancer Res. 65:9012-9020.
Thibodeau, S.N., A.J. French, J.M. Cunningham, D. Tester, L.J. Burgart, P.C. Roche, S.K. McDonnell, D.J. Schaid, C.W. Vockley, V.V. Michels, G.H. Farr, Jr., and M.J. O'Connell. 1998. Microsatellite instability in colorectal cancer: different mutator phenotypes and the principal involvement of hMLH1. Cancer Res. 58:1713-1718.
Tokunaga, E., E. Oki, A. Egashira, N. Sadanaga, M. Morita, Y. Kakeji, and Y. Maehara. 2008. Deregulation of the Akt pathway in human cancer. Curr Cancer Drug Targets. 8:27-36.
Turjanski, A.G., J.P. Vaque, and J.S. Gutkind. 2007. MAP kinases and the control of nuclear events. Oncogene. 26:3240-3253.
Vincenzi, B., G. Schiavon, M. Silletta, D. Santini, and G. Tonini. 2008. The biological properties of cetuximab. Crit Rev Oncol Hematol. 68:93-106.
Voboril, R., S.N. Hochwald, J. Li, A. Brank, J. Weberova, F. Wessels, L.L. Moldawer, E.R. Camp, and S.L. MacKay. 2004. Inhibition of NF-kappa B augments sensitivity to 5-fluorouracil/folinic acid in colon cancer. J Surg Res. 120:178-188.
Walther, A., E. Johnstone, C. Swanton, R. Midgley, I. Tomlinson, and D. Kerr. 2009. Genetic prognostic and predictive markers in colorectal cancer. Nat Rev Cancer. 9:489-499.
Wang, S., and M.D. Basson. 2011. Akt directly regulates focal adhesion kinase through association and serine phosphorylation: implication for pressure-induced colon cancer metastasis. Am J Physiol Cell Physiol. 300:C657-670.
IV. References
59
Wang, X., K.G. Finegan, A.C. Robinson, L. Knowles, R. Khosravi-Far, K.A. Hinchliffe, R.P. Boot-Handford, and C. Tournier. 2006. Activation of extracellular signal-regulated protein kinase 5 downregulates FasL upon osmotic stress. Cell Death Differ. 13:2099-2108.
Wang, X., and C. Tournier. 2006. Regulation of cellular functions by the ERK5 signalling pathway. Cell Signal. 18:753-760.
Wilkes, G., and K. Hartshorn. 2009. Colon, rectal, and anal cancers. Semin Oncol Nurs. 25:32-47.
Winawer, S.J., A.G. Zauber, R.H. Fletcher, J.S. Stillman, M.J. O'Brien, B. Levin, R.A. Smith, D.A. Lieberman, R.W. Burt, T.R. Levin, J.H. Bond, D. Brooks, T. Byers, N. Hyman, L. Kirk, A. Thorson, C. Simmang, D. Johnson, and D.K. Rex. 2006. Guidelines for colonoscopy surveillance after polypectomy: a consensus update by the US multi-society task force on colorectal cancer and the American cancer society. Gastroenterology. 130:1872-1885.
Wolpin, B.M., and R.J. Mayer. 2008. Systemic treatment of colorectal cancer. Gastroenterology. 134:1296-1310.
Wright, N.A. 2000. Epithelial stem cell repertoire in the gut: clues to the origin of cell lineages, proliferative units and cancer. Int J Exp Pathol. 81:117-143.
Wu, B.L., L.Y. Xu, Z.P. Du, L.D. Liao, H.F. Zhang, Q. Huang, G.Q. Fang, and E.M. Li. 2011. MiRNA profile in esophageal squamous cell carcinoma: downregulation of miR-143 and miR-145. World J Gastroenterol. 17:79-88.
Young, B., and J.W. Heath. 2000. Gastrointestinal tract, in Wheather's Functional Histology, a
text and colour atlas. 4 ed. Edinburgh: Churchill Livingstone, 249-273.
Yu, Y.Y., Q. Li, and Z.G. Zhu. 2005. NF-kappaB as a molecular target in adjuvant therapy of gastrointestinal carcinomas. Eur J Surg Oncol. 31:386-392.
Zaanan, A., P. Cuilliere-Dartigues, A. Guilloux, Y. Parc, C. Louvet, A. de Gramont, E. Tiret, S. Dumont, B. Gayet, P. Validire, J.F. Flejou, A. Duval, and F. Praz. 2010. Impact of p53 expression and microsatellite instability on stage III colon cancer disease-free survival in patients treated by 5-fluorouracil and leucovorin with or without oxaliplatin. Ann
Oncol. 21:772-780.
Zen, K., K. Yasui, T. Nakajima, Y. Zen, Y. Gen, H. Mitsuyoshi, M. Minami, S. Mitsufuji, S. Tanaka, Y. Itoh, Y. Nakanuma, M. Taniwaki, S. Arii, T. Okanoue, and T. Yoshikawa. 2009. ERK5 is a target for gene amplification at 17p11 and promotes cell growth in hepatocellular carcinoma by regulating mitotic entry. Genes Chromosomes Cancer. 48:109-120.
Zhang, H., X. Cai, Y. Wang, H. Tang, D. Tong, and F. Ji. 2010. microRNA-143, down-regulated in osteosarcoma, promotes apoptosis and suppresses tumorigenicity by targeting Bcl-2. Oncol Rep. 24:1363-1369.