exploring markets of data for personal health information
TRANSCRIPT

Exploring Markets of Data for Personal Health Information
K. Thomas PickardICDM 2014: Designing the Market of Data - for
Practical Data Sharing via Educational and Innovative Communications
December 14, 2014

How I got here
2

My passion
• Not golf
• Research about health information sharing
3

Why health information sharing?
• Implications for improving health
4

Two examples
1. Rare diseases
2. Common diseases
5

Meet the Beery’s
6
Source: http://www.nature.com/news/2011/110615/full/news.2011.368.html

DNA sequencing finds rare disease
7
• Dopa-responsive dystonia in children
• Mom read about condition in newspaper
• Single change on SPR gene
• Improved with serotonin therapy
Chromosome 2
SPR

Rare disease in U.S.
• Defined to be 1 in 1,500 people
Source: https://www.govtrack.us/congress/bills/107/hr4013
8

30M rare disease patients in U.S.
Another ~3,700 single-gene diseases suspected
3,500 single-gene diseases identified
9
Source: http://www.ncbi.nlm.nih.gov/pubmed/23504071

95% of rare diseases have no FDA approved drug
10
Source: http://globalgenes.org/rare-diseases-facts-statistics/

Implications
• Rare disease networks
• Sharing eliminates guesswork
• Solve more cases
11
What about common diseases?

Diabetes
• Disease prevalence:
World: 4% to ~40%
U.S.: ~10%
• Disease types: 30+
• U.S.: ~30M people 30 types 1M per type
12
Sources:http://care.diabetesjournals.org/content/29/suppl_1/s43.full.pdfhttp://healthintelligence.drupalgardens.com/content/prevalence-diabetes-world-2013

Schizophrenia
• Disease prevalence:
World: ~1% (with little variation)
• Disease types: 7 or more
• U.S. ~3.5M people 7 types 500k per type
13
Source: http://www.ncbi.nlm.nih.gov/pubmed/25219520
Nobel laureate John Nash

Autism spectrum disorders
• Disease prevalence:
World: ~1%
• 10% explained by genetics
• U.S. 2M people > 6 types ~300k per type
14
Sources:http://www.cdc.gov/ncbddd/autism/documents/asd_prevalence_table_2013.pdfhttp://www.nature.com/nature/journal/v515/n7526/full/nature13772.html
Autistic activist Temple Grandin

Hospitals and patients
• U.S. hospitals:
~6,000 facilities
• U.S. population: ~320M people
15
Source: http://www.targetmap.com/viewer.aspx?reportId=3065
One hospital per 50,000 people

Patients per U.S. hospital
• 1M diabetes patients
170 patients per hospital 1 in 300
• 500k schizophrenic patients
80 patients per hospital 1 in 625
• 300k autism spectrum disorder patients
50 patients per hospital 1 in 1,000
16
Rare disease: 1 in 1,500
Source: http://www.cdc.gov/datastatistics/

Implications
• Complex and rare disease can look similar
• Hospitals must share to solve diseases
• 5,000 people with a disease are necessary for good genomic results
17
Source: http://jbjs.org/content/96/5/e38

A shift in consumer attitudes
18

“Given the choice between pizza and privacy…a remarkable number will opt for the pizza.”
19

Insights
1. Consumers are willing to share health data under the right conditions.
2. Education seems to play a strong role.
3. Consumers want to be connected to their data.
4. Develop models to encourage sharing.
20

Health Information Sharing Model
Trust Motivation
CommunityInformed Consent
Consumer
21

Can we go faster with MoDAT?
• Markets of Data (MoDAT)
• Will consumers share if paid?
• Online survey
• 400 participants
• 7 questions
22
Ask Your Target Market (aytm.com)

A global survey
Responses by Continent– Asia (40%)
– Europe (35%)
– North America (17%)
– Africa (5%)
– Oceania (2%)
– South America (2%)
59 countries represented
South America2%
Oceania2%
Africa5%
North America17%
Europe35%
Asia40%
Responses by Continent
23

Willing to share
When asked about sharing, 88% responded “Yes” or “In some cases.”
50%
33%
17%
0%
10%
20%
30%
40%
50%
60%
Yes In some cases No
If I could remove my name, age, etc. from my health information, I would share it...
24

Share with financial reward
65%
26%
9%0%
10%
20%
30%
40%
50%
60%
70%
More likely to sharemy health
information
Neither more likelynor less likely to share
my healthinformation
Less likely to sharemy health
information
If I were rewarded financially, then I would be...
25

Share/Sell Data Types
0
20
40
60
80
100
120
140
160
180
200
Re
spo
nse
sI would share/sell these types of health information...
Share
Sell
26

Share/Sell with…
0
20
40
60
80
100
120
140
160
180
Re
spo
nse
s
I would share/sell my health information with...
Share
Sell
27
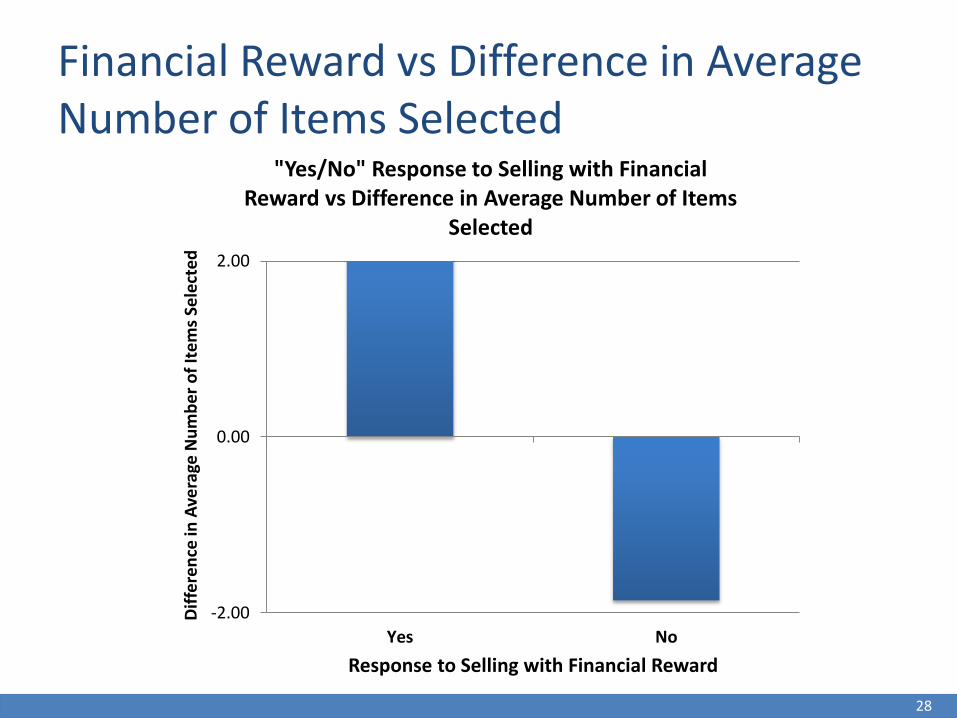
Financial Reward vs Difference in Average Number of Items Selected
-2.00
0.00
2.00
Yes No
Dif
fere
nce
in A
vera
ge N
um
be
r o
f It
em
s Se
lect
ed
Response to Selling with Financial Reward
"Yes/No" Response to Selling with Financial Reward vs Difference in Average Number of Items
Selected
28

Household Income
0%
10%
20%
30%
40%
50%
60%
Annual Household Income
Over half of the respondents reported a household income of less than $25,000 USD.
29

One-time payment
0%
5%
10%
15%
20%
25%
Re
spo
nse
s (p
erc
en
t)
In exchange for this health information, I would expect to receive a one-time payment of:
30

Age: Sample vs World
Age ranges from 18 to 74.Average age cohort is 30-34 years.
0%
5%
10%
15%
20%
25%
30%
Age Cohort
Age
Samplepopulation
Worldpopulation
Source: U.S. Census Bureau, 2014 World Midyear Population by Age31

Age and reward
0
10
20
30
40
50
60
70
18-24 25-29 30-34 35-39 40-44 45-49
Re
spo
nse
s
Age cohort
Age Cohort vs "Yes" Response to Selling with Financial Reward
R² = 0.87
32

Age and one-time payment
$0
$50
$100
$150
$200
$250
18-24 25-29 30-34 35-39 40-44 45-49
Ave
rage
on
e-t
ime
pay
me
nt
(USD
)
Age cohort
Age vs Average One-time Payment(20 or more responses per cohort)
R² = 0.68
33

GDP and one-time payment
$-
$50
$100
$150
$200
$250
$300
$350
$- $500 $1,000 $1,500 $2,000 $2,500 $3,000
On
e-t
ime
pay
me
nt
(USD
)
GDP in $B
GDP $B vs Average One-time Payment(excluding lowest and highest expected payment amounts)
$56
$169
$250
$304
$489
$878
$1,875
$2,013
$2,471
R² = 0.46
Croatia
Romania
Philippines
Malaysia
Poland
Indonesia
India
Italy
United Kingdom
34
Source: United Nations 2012 GDP Data

Limitations
1. Paid to participate
2. Convenience sample (n=400)
3. Education level
35

Our sample was educated
0%
5%
10%
15%
20%
25%
30%
Education64%Completed at least four years of college
vs
25%Global tertiary education enrollment average
36
Source: UNESCO Institute for Statistics in EdStats. “Teritary education – A global report,” 2012.

Summary
• Rare and complex diseases can look similar
• Share health information to solve disease
• Some consumers view sharing health information like a “free pizza”
37

Thank you
K. Thomas Pickardktpickard [at] [email protected]/in/kthomaspickardBlog: www.genomedad.com
38