exploring location navigating time measuring & …

2
SNAPSHOT Click on the “Snapshot” button from the top menu to export a screenshot of your entire map with visible measurements and annotations. The downloaded image will be saved locally to your computer as a .png. Exporting a screenshot is very useful for sharing an image quickly with others via email, or for use in presentations. Snapshots are created at screen resolution. GEOREFERENCED This Export option enables you to download high resolution Vertical imagery with a georeferenced file in a projection of your choosing to bring into third-party applications. When you click Download Files, the image file and the georeferenced file will be saved locally to your computer as a zip file; the image file is saved as a .jpg, and the geoferenced file is saved as a .jgw. Exporting georeferenced files is very useful when you want to export an image for use in third-party applications, such as ArcGIS and CAD. HIGH RESOLUTION This Export option enables you to download high resolution Vertical imagery for your use. On the Export menu, select an area you would like to export, and choose the resolution you want for the exported image. When you click Download Image, the file is saved locally to your computer as a .jpg. Exporting a high resolution image is very useful when you need a high quality image export, for example for printing imagery. EXPORTING IMAGERY VIEW OBLIQUE IMAGERY Nearmap Oblique imagery provides a 45-degree angle view of a location. Oblique imagery differs from Panorama in that you view individual photos of an area taken from different cardinal directions, rather than continuous, blended vertical imagery. Nearmap Oblique image is unaltered, enabling you to measure the height and width of buildings from each cardinal direction with the Line & Area tool . To access the oblique, simply drop a pin at the location of interest, then switch to oblique view, either by clicking the View Oblique Photos in the location information (right-hand panel) or by selecting Oblique from the layers tool. MEASURE HEIGHT Once you are in the Oblique view, click the Height or the Width tool from the tools bar to start taking measurements. Measuring Height: A friendly tip is to zoom in as close as you can, and start from the ground point from which you are measuring height, then measure up to the top of the building or object. Measuring Width: The MapBrowser Width tool lets you measure the distance along the ground in oblique photos, allowing you to easily measure the width of a building or object, or accurately measure the distance between two objects along the ground. MEASURE PITCH The Line tool allows you to measure the length and slope of a structure from an oblique photo. Use the Area Tool if you want to measure other parts of the structure from an oblique photo. Handy tips: • Zoom in as much as possible and take your time for best results. • Always draw along the edge of the structure you want to measure. • Switch back to the primary view to check line placement and orientation if you are not sure. • You can also choose another photo from a different direction from the dropdown list. OBLIQUE EXPLORING IN 3D VIEWER You can view 3D content in the MapBrowser by selecting 3D from the dropdown list from the layers tool. This is also referred to as 3D Viewer. Navigating with a mouse: • Panning is achieved via the left mouse button • Tilting and rotating is achieved via the right mouse button • Zooming can be done by scrolling the scroll wheel Navigating on a laptop: • Panning can be achieved using any part of the touchpad with one finger • Tilting and rotating is achieved while holding the ‘Alt’ key (Windows) or the ‘Control’ key (Mac) and using one finger on any part of the touchpad • Zooming can be achieved by sliding two fingers up and down the touchpad MEASURING IN 3D SPACE Measuring in 3D Viewer is super intuitive and fun — simply select Location, Line or Area from the tool bar at the top of the screen. Location Pin: Elevation value relative to mean sea level which can be displayed in the unit of choice from the dropdown. Line Tool: When you access the Line tool you will see a disk that aligns to the surface it is on to measure line length, pitch and relative height. Double-click to end the line. Area Tool: Use the Area tool to measure the area, perimeter and pitch of a surface in 3D Viewer. Draw out a polygon by single- clicking on each desired vertex. EXPORTING 3D CONTENT Using MapBrowser, you can export all Nearmap 3D content types to use inside third-party applications such as Esri ArcGIS Pro and Autodesk Civil 3D and Infraworks. To export 3D data, simply click on the Export tool and select 3D from the dropdown menu and draw a polygon around the area you wish to export. Then choose the vintage, the content type(s) and projection you want to export to. For 3D export to be available, it is required that your organisation have a 3D Export licences and that export credits are still available for your license. You also need to have 3D Export permissions, which your account administrator can provide you. 3D VIEWER & 3D EXPORT VIEW AI LAYERS To view AI Layers in MapBrowser, select the attributes you want to visualize from the Project Workspace. Under the Data Layers panel, check the box against the AI Layer you want to visualise. Use the colour controls in the right-hand panel to adjust the display. The AI layers are available for particular dates on Nearmap’s vertical imagery for Australia and the United States. If you navigate beyond either of these areas, a dialog appears letting you know that you are out of coverage area. AI EXPORT Nearmap AI lets you export AI Parcel Data as parcel rollup spreadsheets (csv) and vector layer (geopackage) from within MapBrowser. To download AI Parcel Data, simply click on the Export button and select AI from the drop-down menu and select the area of export. If you draw an area that has only partial AI content, the export will include only the area with AI content. Once you select the capture, the total size of the selection is shown in the Summary section. Hit confirm export to perform the export instantly! NEARMAP AI BOUNDARIES To access the Boundaries tool , go to the location of interest, then select the Boundaries check box, which is under Data Layers on the left-hand panel. Make sure you are at zoom level 16 or higher to view the Cadastre or Property lines. ROADS OVERLAY You may also want to have the the street names overlaid so that you can easily orient yourself on the vertical imagery. To do this, simply open the hamburger menu on the top-left corner and click on Roads Overlay under data layers section. If you wish to view the street map only with no aerial imagery visible, you can easily do so by selecting Roads from the drop-down menu next to the date selection tool. JUMPING TO STREET VIEW You can easily jump into Google Street View from within the MapBrowser! Simply right-click anywhere on the map to select the Google Street View from the dropdown menu, which will load the selected location in a new browser tab. Do note that this content is sourced directly from Google, and may not reflect the same vintage (date and time) of the Nearmap content for your area of interest. LAYERS WORKSPACE When you first log in to MapBrowser, a new Workspace will automatically be created. Even if you do not create a project, everything you draw in your Workspace will be saved automatically, so if you happen to refresh your browser, you will not lose your work — phew! A Worksplace can easily be saved as a project by simply clicking on the Projects icon in the toolbar and selecting Save as Project. If you have lots of different objects in your layout, you can use the view button (the “eye” icon) to hide and unhide layers, which can make it easier to view imagery or other features on the map. PROJECTS Projects can help you organise and manage your work more easily by allowing you to save information about different jobs or sites that you are working on, and need to revisit. You create as many projects as you need and you can use labels to organise your projects. You can then name your project and add labels so that you can easily identify it later. If you are no longer working on a project, you can move it to the Archive. Archiving projects is a useful way to manage your project list and keep it clutter-free. KML IMPORT The KML Import feature allows MapBrowser users to import additional geospatial information into MapBrowser to view as an overlay on Nearmap imagery. You can do so by simply (1) dragging and dropping the KML file onto the map, or (2) clicking + next to Feature Layers, then selecting KML File, and uploading the file. Please note that MapBrowser currently supports KML file imports only. If you wish to import KMZ files, you must first convert them to KML files using Google Earth. PROJECTS, WORKSPACE, KML SPLIT VIEW Simply click on the Split View button located next to the date box to enable a side-by-side comparison of two vintages. This feature allows you to compare imagery of a location across two different surveys, so that you can easily see the changes over time by dragging the slider across the screen. TIMESTAMP & WATCHLIST Using the location tool , you can click on any location on the map and a drop pin will appear at the location. Information about the particular survey location will be displayed on the right-hand panel, including: address, geo-coordinates and timestamp. From here you can also click to copy and share the location URL. You can also add a location to your Watchlist so that you can be notified via email every time we publish new imagery that contains your selected location. HISTORIC CONTENT Using the MapBrowser date selection tool , you can go back in time and view any available historical captures by selecting a survey date from the dropdown list. It’s important to note that the actual date and time of the imagery may differ from the survey date — to get the exact timestamp of the location, use the Location Tool. Nearmap updates the Vertical imagery up to six times a year in major urban areas across Australia , and up to three times a year in the United States - please visit nearmap.com/coverage for the latest coverage information. NAVIGATING TIME For more information visit docs.nearmap.com SEARCH To navigate to a specific location, simply type your search query into the search bar in the upper left part of the MapBrowser. You can search by street address, latitude and longitude coordinates, suburb, places of interest or by simply selecting from your search history. You can also quickly navigate to a particular point on the map by dropping a pin on the map with the Location tool (next to the search bar). Hot tip: You can modify the URL to change survey date and time, change rotation and zoom level. Visit docs.nearmap.com for more information. PAN, ZOOM & ROTATE The new MapBrowser has been designed with a responsive layout, which means it will work on all types of devices and screen sizes – desktop, laptop, mobile and tablet. Navigating with a keyboard & mouse: Pan: Left-click & drag Zoom In: Shift & + OR Scroll wheel Zoom Out: Shift & - OR Scroll wheel Rotate: Alt + Left-click drag Navigating on a tablet: Pan: Drag any part of the touch-pad with one finger Zoom In/Out: Pinch-in & pinch-out Rotate: ‘Spin’ the map using your thumb and forefingers SWITCH BASE LAYER There are up to six available view modes (select from the dropdown menu next to the date selection tool), depending on the Nearmap subscription you have: Vertical – this is the standard, fully orthorectified overhead aerial map Panorama – offers 45-degree angle views from different cardinal directions Terrain – lets you view the terrain Oblique – provides an individual photo of an area taken at a 45-degree angle views Roads – shows a view of the street maps only, with no aerial imagery visible 3D – streams Nearmap Textured Mesh inside 3D Viewer EXPLORING LOCATION SUBSCRIPTION OPTIONS Nearmap Vertical – standard features Nearmap Oblique features (add-on) Nearmap 3D Viewer & 3D Export features (add-on) Nearmap AI features (add-on) RADIUS & TEXT ANNOTATION Draw a circle on the map with the Radius tool to measure its area and radius. To adjust a measurement, touch any point along the line, area, or radius, and drag to a new position. Using the Text tool , text annotations can be marked up on the imagery as well. You can select the appropriate units of measurement, colour of the line/area, brightness of the line/area/ the opacity of the polygon/circle, and hide/unhide the measurement labels. AREA The Area tool is perfect for getting approximate measurement of an area on a vertical imagery. To do this, simply draw a polygon on the map to measure its area and the length of its sides. You can also obtain the aggregate area measurement by simply selecting the objects while holding the Shift key. You can choose the appropriate units of measurement, colour of the line/area, brightness of the line/area/ the opacity of the polygon/circle, and hide/unhide the measurement labels. For measurements of a structure’s pitch & area, please use the oblique measurement tools instead. MEASURING & ANNOTATING LINE The Line tool allows you to measure the length of feature on vertical imagery — such as the length of a fence or a jetty. It could also measure the length of a path composed of multiple lines. You can also choose to view the bearing of the line and the elevation profile of a line or path. You can choose the appropriate units of measurement, colour of the line/area, brightness of the line/area/ the opacity of the polygon/circle, and hide/unhide the measurement labels. MAPBROWSER CHEAT SHEET

Upload: others

Post on 22-Oct-2021

2 views

Category:

Documents


0 download

TRANSCRIPT

SNAPSHOTClick on the “Snapshot” button from the top menu to export a screenshot of your entire map with visible measurements and annotations.

The downloaded image will be saved locally to your computer as a .png.

Exporting a screenshot is very useful for sharing an image quickly with others via email, or for use in presentations. Snapshots are created at screen resolution.

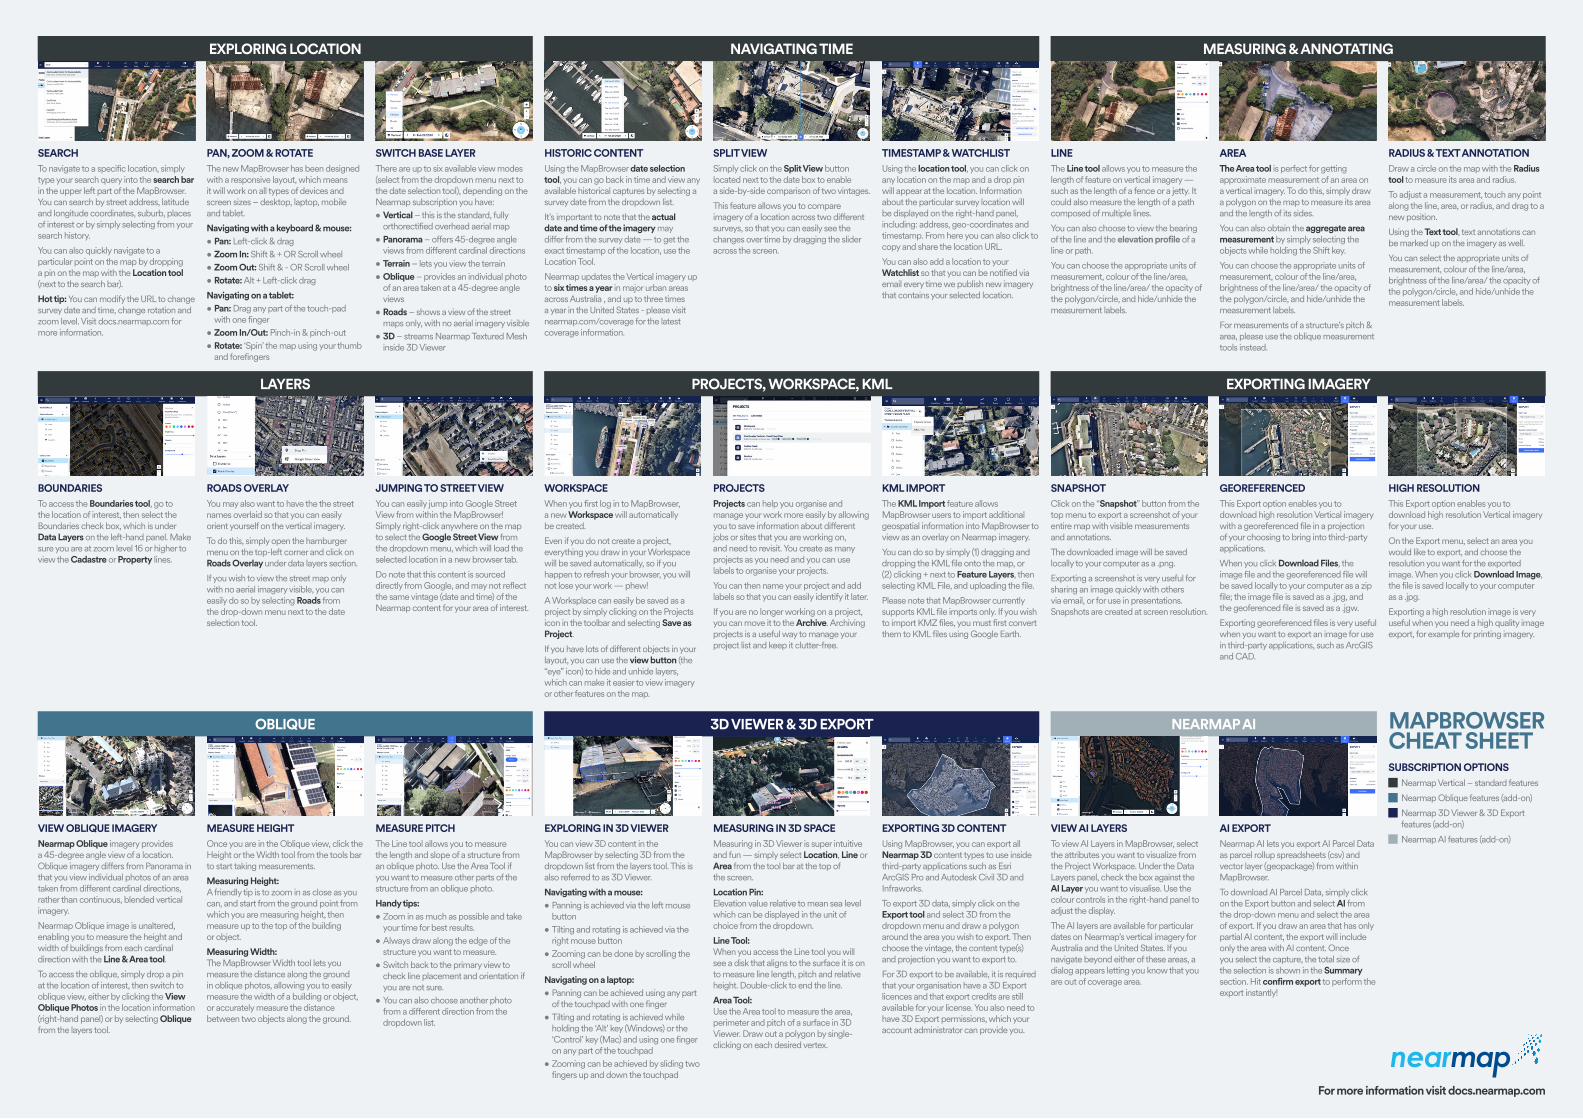
GEOREFERENCEDThis Export option enables you to download high resolution Vertical imagery with a georeferenced file in a projection of your choosing to bring into third-party applications.

When you click Download Files, the image file and the georeferenced file will be saved locally to your computer as a zip file; the image file is saved as a .jpg, and the geoferenced file is saved as a .jgw.

Exporting georeferenced files is very useful when you want to export an image for use in third-party applications, such as ArcGIS and CAD.

HIGH RESOLUTIONThis Export option enables you to download high resolution Vertical imagery for your use.

On the Export menu, select an area you would like to export, and choose the resolution you want for the exported image. When you click Download Image, the file is saved locally to your computer as a .jpg.

Exporting a high resolution image is very useful when you need a high quality image export, for example for printing imagery.

EXPORTING IMAGERY

VIEW OBLIQUE IMAGERYNearmap Oblique imagery provides a 45-degree angle view of a location. Oblique imagery differs from Panorama in that you view individual photos of an area taken from different cardinal directions, rather than continuous, blended vertical imagery.

Nearmap Oblique image is unaltered, enabling you to measure the height and width of buildings from each cardinal direction with the Line & Area tool.To access the oblique, simply drop a pin at the location of interest, then switch to oblique view, either by clicking the View Oblique Photos in the location information (right-hand panel) or by selecting Oblique from the layers tool.

MEASURE HEIGHTOnce you are in the Oblique view, click the Height or the Width tool from the tools bar to start taking measurements.

Measuring Height: A friendly tip is to zoom in as close as you can, and start from the ground point from which you are measuring height, then measure up to the top of the building or object.

Measuring Width: The MapBrowser Width tool lets you measure the distance along the ground in oblique photos, allowing you to easily measure the width of a building or object, or accurately measure the distance between two objects along the ground.

MEASURE PITCHThe Line tool allows you to measure the length and slope of a structure from an oblique photo. Use the Area Tool if you want to measure other parts of the structure from an oblique photo.

Handy tips:• Zoom in as much as possible and take

your time for best results.• Always draw along the edge of the

structure you want to measure.• Switch back to the primary view to

check line placement and orientation if you are not sure.

• You can also choose another photo from a different direction from the dropdown list.

OBLIQUE

EXPLORING IN 3D VIEWERYou can view 3D content in the MapBrowser by selecting 3D from the dropdown list from the layers tool. This is also referred to as 3D Viewer.

Navigating with a mouse:• Panning is achieved via the left mouse

button• Tilting and rotating is achieved via the

right mouse button• Zooming can be done by scrolling the

scroll wheel

Navigating on a laptop:• Panning can be achieved using any part

of the touchpad with one finger• Tilting and rotating is achieved while

holding the ‘Alt’ key (Windows) or the ‘Control’ key (Mac) and using one finger on any part of the touchpad

• Zooming can be achieved by sliding two fingers up and down the touchpad

MEASURING IN 3D SPACEMeasuring in 3D Viewer is super intuitive and fun — simply select Location, Line or Area from the tool bar at the top of the screen.

Location Pin: Elevation value relative to mean sea level which can be displayed in the unit of choice from the dropdown.

Line Tool: When you access the Line tool you will see a disk that aligns to the surface it is on to measure line length, pitch and relative height. Double-click to end the line.

Area Tool: Use the Area tool to measure the area, perimeter and pitch of a surface in 3D Viewer. Draw out a polygon by single-clicking on each desired vertex.

EXPORTING 3D CONTENTUsing MapBrowser, you can export all Nearmap 3D content types to use inside third-party applications such as Esri ArcGIS Pro and Autodesk Civil 3D and Infraworks.

To export 3D data, simply click on the Export tool and select 3D from the dropdown menu and draw a polygon around the area you wish to export. Then choose the vintage, the content type(s) and projection you want to export to.

For 3D export to be available, it is required that your organisation have a 3D Export licences and that export credits are still available for your license. You also need to have 3D Export permissions, which your account administrator can provide you.

3D VIEWER & 3D EXPORT

VIEW AI LAYERSTo view AI Layers in MapBrowser, select the attributes you want to visualize from the Project Workspace. Under the Data Layers panel, check the box against the AI Layer you want to visualise. Use the colour controls in the right-hand panel to adjust the display.

The AI layers are available for particular dates on Nearmap’s vertical imagery for Australia and the United States. If you navigate beyond either of these areas, a dialog appears letting you know that you are out of coverage area.

AI EXPORTNearmap AI lets you export AI Parcel Data as parcel rollup spreadsheets (csv) and vector layer (geopackage) from within MapBrowser.

To download AI Parcel Data, simply click on the Export button and select AI from the drop-down menu and select the area of export. If you draw an area that has only partial AI content, the export will include only the area with AI content. Once you select the capture, the total size of the selection is shown in the Summary section. Hit confirm export to perform the export instantly!

NEARMAP AI

BOUNDARIESTo access the Boundaries tool, go to the location of interest, then select the Boundaries check box, which is under Data Layers on the left-hand panel. Make sure you are at zoom level 16 or higher to view the Cadastre or Property lines.

ROADS OVERLAYYou may also want to have the the street names overlaid so that you can easily orient yourself on the vertical imagery.

To do this, simply open the hamburger menu on the top-left corner and click on Roads Overlay under data layers section.

If you wish to view the street map only with no aerial imagery visible, you can easily do so by selecting Roads from the drop-down menu next to the date selection tool.

JUMPING TO STREET VIEW You can easily jump into Google Street View from within the MapBrowser! Simply right-click anywhere on the map to select the Google Street View from the dropdown menu, which will load the selected location in a new browser tab.

Do note that this content is sourced directly from Google, and may not reflect the same vintage (date and time) of the Nearmap content for your area of interest.

LAYERS

WORKSPACEWhen you first log in to MapBrowser, a new Workspace will automatically be created.

Even if you do not create a project, everything you draw in your Workspace will be saved automatically, so if you happen to refresh your browser, you will not lose your work — phew!

A Worksplace can easily be saved as a project by simply clicking on the Projects icon in the toolbar and selecting Save as Project. If you have lots of different objects in your layout, you can use the view button (the “eye” icon) to hide and unhide layers, which can make it easier to view imagery or other features on the map.

PROJECTSProjects can help you organise and manage your work more easily by allowing you to save information about different jobs or sites that you are working on, and need to revisit. You create as many projects as you need and you can use labels to organise your projects.

You can then name your project and add labels so that you can easily identify it later.

If you are no longer working on a project, you can move it to the Archive. Archiving projects is a useful way to manage your project list and keep it clutter-free.

KML IMPORTThe KML Import feature allows MapBrowser users to import additional geospatial information into MapBrowser to view as an overlay on Nearmap imagery.

You can do so by simply (1) dragging and dropping the KML file onto the map, or (2) clicking + next to Feature Layers, then selecting KML File, and uploading the file.

Please note that MapBrowser currently supports KML file imports only. If you wish to import KMZ files, you must first convert them to KML files using Google Earth.

PROJECTS, WORKSPACE, KML

SPLIT VIEWSimply click on the Split View button located next to the date box to enable a side-by-side comparison of two vintages.

This feature allows you to compare imagery of a location across two different surveys, so that you can easily see the changes over time by dragging the slider across the screen.

TIMESTAMP & WATCHLISTUsing the location tool, you can click on any location on the map and a drop pin will appear at the location. Information about the particular survey location will be displayed on the right-hand panel, including: address, geo-coordinates and timestamp. From here you can also click to copy and share the location URL.

You can also add a location to your Watchlist so that you can be notified via email every time we publish new imagery that contains your selected location.

HISTORIC CONTENT Using the MapBrowser date selection tool, you can go back in time and view any available historical captures by selecting a survey date from the dropdown list.

It’s important to note that the actual date and time of the imagery may differ from the survey date — to get the exact timestamp of the location, use the Location Tool.

Nearmap updates the Vertical imagery up to six times a year in major urban areas across Australia , and up to three times a year in the United States - please visit nearmap.com/coverage for the latest coverage information.

NAVIGATING TIME

For more information visit docs.nearmap.com

SEARCHTo navigate to a specific location, simply type your search query into the search bar in the upper left part of the MapBrowser. You can search by street address, latitude and longitude coordinates, suburb, places of interest or by simply selecting from your search history.

You can also quickly navigate to a particular point on the map by dropping a pin on the map with the Location tool (next to the search bar).

Hot tip: You can modify the URL to change survey date and time, change rotation and zoom level. Visit docs.nearmap.com for more information.

PAN, ZOOM & ROTATEThe new MapBrowser has been designed with a responsive layout, which means it will work on all types of devices and screen sizes – desktop, laptop, mobile and tablet.

Navigating with a keyboard & mouse:• Pan: Left-click & drag• Zoom In: Shift & + OR Scroll wheel• Zoom Out: Shift & - OR Scroll wheel• Rotate: Alt + Left-click drag

Navigating on a tablet:• Pan: Drag any part of the touch-pad

with one finger• Zoom In/Out: Pinch-in & pinch-out• Rotate: ‘Spin’ the map using your thumb

and forefingers

SWITCH BASE LAYERThere are up to six available view modes (select from the dropdown menu next to the date selection tool), depending on the Nearmap subscription you have:• Vertical – this is the standard, fully

orthorectified overhead aerial map • Panorama – offers 45-degree angle

views from different cardinal directions • Terrain – lets you view the terrain • Oblique – provides an individual photo

of an area taken at a 45-degree angle views

• Roads – shows a view of the street maps only, with no aerial imagery visible

• 3D – streams Nearmap Textured Mesh inside 3D Viewer

EXPLORING LOCATION

SUBSCRIPTION OPTIONS Nearmap Vertical – standard features

Nearmap Oblique features (add-on)

Nearmap 3D Viewer & 3D Export features (add-on)

Nearmap AI features (add-on)

RADIUS & TEXT ANNOTATIONDraw a circle on the map with the Radius tool to measure its area and radius.

To adjust a measurement, touch any point along the line, area, or radius, and drag to a new position.

Using the Text tool, text annotations can be marked up on the imagery as well.

You can select the appropriate units of measurement, colour of the line/area, brightness of the line/area/ the opacity of the polygon/circle, and hide/unhide the measurement labels.

AREAThe Area tool is perfect for getting approximate measurement of an area on a vertical imagery. To do this, simply draw a polygon on the map to measure its area and the length of its sides.

You can also obtain the aggregate area measurement by simply selecting the objects while holding the Shift key.

You can choose the appropriate units of measurement, colour of the line/area, brightness of the line/area/ the opacity of the polygon/circle, and hide/unhide the measurement labels.

For measurements of a structure’s pitch & area, please use the oblique measurement tools instead.

MEASURING & ANNOTATING

LINEThe Line tool allows you to measure the length of feature on vertical imagery — such as the length of a fence or a jetty. It could also measure the length of a path composed of multiple lines.

You can also choose to view the bearing of the line and the elevation profile of a line or path.

You can choose the appropriate units of measurement, colour of the line/area, brightness of the line/area/ the opacity of the polygon/circle, and hide/unhide the measurement labels.

MAPBROWSER CHEAT SHEET

MAPBROWSER CHEAT SHEET

LAVERTON, WA AU