exploring glass and material science through candy … significant dependence of index on sucrose/...
TRANSCRIPT

An IMI-NFG Outreach Activity
for Engaging Students in Glass Science
(Pre-College and even University) through
inquiry, participation and wonder
William R. Heffner & Himanshu Jain
International Materials Institute for Glass
Lehigh University, Bethlehem, PA
Exploring Glass and Material Science
through Candy and Common Materials
MS&T, Houston, Texas, October 17, 2010

Approach:
A collection of interrelated experiments using sugar glass (hard candy) – a material
that students can both make and use to explore many aspects of glass science.
Objectives and Approach of Program
Priorities: • low cost and within the resources of a typical high school student
• yet capture relevant and significant principles of glass science
• simple enough for the young student to perform independently
• interesting enough to hold their attention
• rich enough to mimic activities done by the material scientist
• developed by glass scientists and refined through student collaboration
• inter-related experiments for prolonged engagement & accumulated learning
•Available free to all on our website:
http://www.lehigh.edu/imi/
Primary Objective:
To engage young students with the glass science through a series of
hands-on activities with glass.

Outline of Experiments and Activities Today
• Overview of Sugar Glass System
• Material Synthesis – making of candy glass
• Pulling “glass” fibers and a fiber drawing tower
• Optical characterization
Refractive Index Measurement
• Density measurements
• Crystallization
Birefringence and Detecting Ordering
Mechanisms & growth rates in sugar glass
Crystallization in PET
• Glass Transition
Thermal Methods
Electrical conductivity
•Demonstration Videos - time permitting
For more experiments and details see IMI website:
http://www.lehigh.edu/imi/

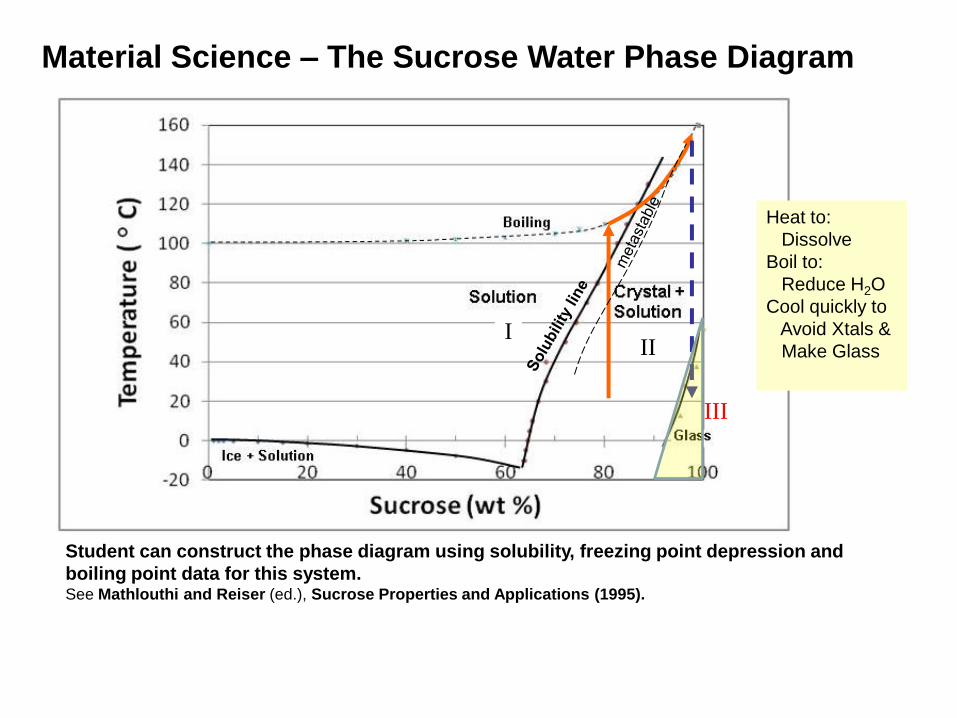
Material Science – The Sucrose Water Phase Diagram
Student can construct the phase diagram using solubility, freezing point depression and
boiling point data for this system. See Mathlouthi and Reiser (ed.), Sucrose Properties and Applications (1995).
III
III

Material Science – The Sucrose Water Phase Diagram
Student can construct the phase diagram using solubility, freezing point depression and
boiling point data for this system. See Mathlouthi and Reiser (ed.), Sucrose Properties and Applications (1995).
III
III
high viscosity
xtals slow to form
=> considerable
metastable range
> 20% supersat.
Stable for hours
Material Science – The Sucrose Water Phase Diagram
Student can construct the phase diagram using solubility, freezing point depression and
boiling point data for this system. See Mathlouthi and Reiser (ed.), Sucrose Properties and Applications (1995).
III
III
Heat to:
Dissolve
Boil to:
Reduce H2O
Cool quickly to
Avoid Xtals &
Make Glass

Material Science – The Sucrose Water Phase Diagram
Student can construct the phase diagram using solubility, freezing point depression and
boiling point data for this system. See Mathlouthi and Reiser (ed.), Sucrose Properties and Applications (1995).
III
III
Heat to:
Dissolve
Boil to:
Reduce H2O
Cool quickly to
Make Glass
Avoid Xtals
Problem with Sucrose: Very prone to crystallization at low water content, even during cooking!

Recommend:
2:1 sucrose to corn syrup (by wt.)
for good glass with some crystal tendency 8
Example of how mixing allows tailoring performance of resulting glass

The Making of Hard Candy (Glass) – Material Synthesis
Phenomenological approach
Sucrose, Corn Syrup and Water are combined and
cooked-
• first to dissolve into a single liquid phase &
• then to remove most of the water.
Solution temp provides measure of the water content.
Boil to ~ 150 C.
Cost ~ $5 in materials
for many batches
Data from Food Industries Manual, 24th ed, (1997).

Drawing glassy “candy fibers” has never
failed to excite and captivate – whether young
(middle school), high school or even adult!
Typical Science Camp Activity or
Teacher Workshop
examples, properties and structure of glass
applications e.g. optics and fiber optics
making of candy glass
fiber pulling
Candy Glass – A Favorite for the Science Camp
Multiple camps and workshops have provided a wonderful testing ground for what works!

Fiber Drawing Tower – Mimics Optical Fiber Manufacturing Process
Opportunity to explore –glass melting, visco-elasticity, heat transfer by radiation, and much more
L
a
m
p
20 W
L
a
m
p
20 W
Thermocouple
Probe
Dimmer
Switch
Voltage
Controller
Fiber Spool
(Plastic Jar)
Fixed or Sliding
Holder
Sugar Glass Rod
Monitor or Control
Heat input
Temperature
Draw rate
Candy Rod Preform heated by 20W Lamps
Estimated cost - $20 for Tower and lamps, $10 for dimmer switch control

Pfund’s Method
Refractive Index of Candy Glass via Pfund’s Method
Tara Schneider, REU(2005)
n=sqrt(d2+16h2)/d
Requires:
•Slab of candy glass ~ 1 cm thick
•laser pointer ($5.00)
•metric ruler or caliper ($10.00)
•ring stand and clamp to hold laser
With practice Tara was able to achieve a std dev of ~ 0.015 (~1%),
sufficient to see the index increase of candy glass with boiling temperature.
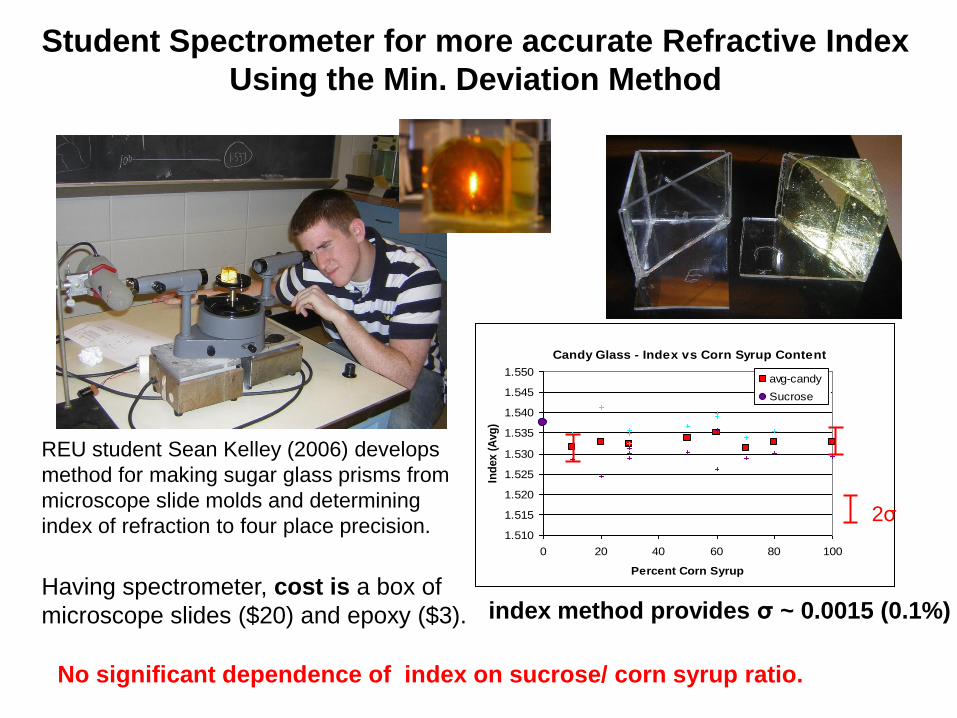
Student Spectrometer for more accurate Refractive Index
Using the Min. Deviation Method
REU student Sean Kelley (2006) develops
method for making sugar glass prisms from
microscope slide molds and determining
index of refraction to four place precision.
index method provides σ ~ 0.0015 (0.1%)
No significant dependence of index on sucrose/ corn syrup ratio.
Candy Glass - Index vs Corn Syrup Content
1.510
1.515
1.520
1.525
1.530
1.535
1.540
1.545
1.550
0 20 40 60 80 100
Percent Corn Syrup
Ind
ex (
Avg
)
avg
Candy Glass - Index vs Corn Syrup Content
1.510
1.515
1.520
1.525
1.530
1.535
1.540
1.545
1.550
0 20 40 60 80 100
Percent Corn Syrup
Ind
ex (
Avg
)
avg-candy
Sucrose
2σ
Having spectrometer, cost is a box of
microscope slides ($20) and epoxy ($3).

Specific Gravity = (wt of glass) / (wt of displaced water)
= (wt of glass) / {(wt of glass & water) – (wt of glass)}
Glass
water
water
fixed volume
Density Apparatus – Low Cost Student-built Pycnometer
Utilizes Centigram Balance – available in most high school labs
and salsa jar with hole and epoxied washer for stiffening - no other costs
Results for insoluble oxide glass as test sample –avg. specific gravity of 2.48 with std. dev. = 0.007 (0.3% )
For candy glass measurements must be made before candy dissolves (much).
REU, Sean Kelly (2006)

Polariscope constructed from two polarizing sheets can be used to demonstrate
the amorphous nature of glass compared to a ordered, birefringent solid such as
a quartz crystal.
Birefringence –Tool for Observing
Structure in Transparent Materials
Also flow induced order can be
demonstrated in glassy plastic.
Similar to method used by glass
blowers to check for residual
stress.
Glass slide –
only edges visible
Calcite Crystal –
very bright
at this orientation

Excellent Examples of Crystal Growth from Sugar Glass
Two Distinct Mechanisms
Interior Crystal Growth
From melt at elevated
temperatures
Surface Crystal Growth
At room temperature
with moisture (humidity)
microscope slides provide
convenient observation platform

Crystalization in 50% RH Chamber
(Recipe3)
0
2
4
6
8
10
12
0 5 10 15 20 25 30
days in 50% RH
Cry
sta
l w
idth
(m
m)
12/07 (143C)
12/05 (145C)
Quantitative Crystal Growth Expt. Moisture mediated surface crystallization at Room Temp
Need only: glass slides, camera,
ruler and 50% Rel. Humidity Jar
Growth of outer crystal ring
after 6 days at 50% RH
High School science project:
Awards at County Sci. Fair & Jr. Acad. of Sci.
Cookie jar with
sat. solution MgSO4
for 50% RH chamber
Batch A (143 C)
Batch B (145 C)
Rate =
0.4 mm/day

Student used Image J freeware and calculate crystal area.
Devitrification in Molten Solutions Finding the maximum crystal growth temperature
From NIH at: http://rsbweb.nih.gov/ij/Oven cost ~ $20 with temp probe
T uniformity
± 1°C typical
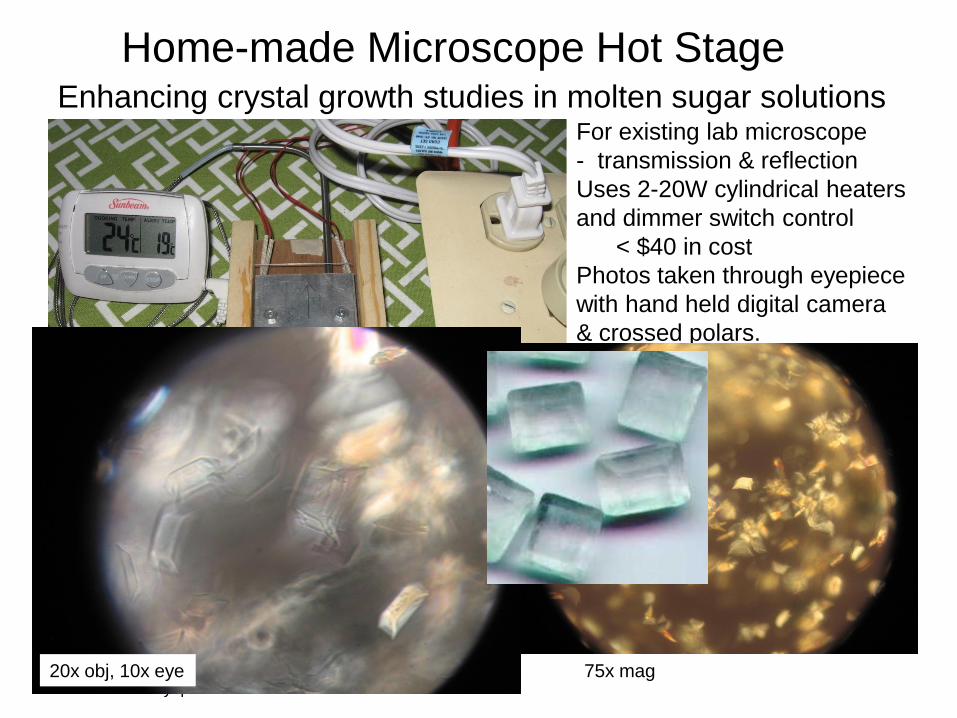
Home-made Microscope Hot Stage
For existing lab microscope
- transmission & reflection
Uses 2-20W cylindrical heaters
and dimmer switch control
< $40 in cost
Photos taken through eyepiece
with hand held digital camera
& crossed polars.
Enhancing crystal growth studies in molten sugar solutions
75x mag2.5X obj,
5x eyepiece20x obj, 10x eye

Observing Crystal Growth (125 C)
20 min 50 min
Photographed at 100X magnification through eyepiece with hand held digital camera

Multiple Crystal Morphologies
Interesting range of crystal morphologies observed under higher magnification with home-built hot stage. Levenson and Hartel reported some of the same morphologies in their 2004 paper. D.A. Levenson, R.W. Hartel, Journal of Food Engineering, “Nucleation of amorphous sucrose-corn syrup mixtures”
Photographed at 200X magnification through eyepiece with hand held digital camera

Another Common Glassy material for Crystal Growth - PET
PET is one of the common plastic materials
used for beverage and other food packaging.
It can be identified by the recycling code 1.
• glassy state at room temperature
• Tg near 80 C
• easily observable crystallization near 135 C
• Tm ~ 220 C.

Demonstration of Crystallization from Amorphous PET
appearance to 130 C All white by 135 C )
Simple equipment includes:
GE Hotplate ($20, Wal-Mart)
Aluminum plate with hole drilled for
Thermocouple to monitor temperature
TC meter ($30, Harbor Freight)
Glass Petri Dish cover
Abrupt melting at 237 C
Crystallization occurs abruptly
near 132 C providing a great demo.

Crystallization in PET under microscopic examination
lamellar region in sharp contrast to sucrose crystallizationPre crystal
clear region
~8 u pitch
Milky crystal region
Lamella phase described well for students at
http://en.wikipedia.org/wiki/Crystallization_of_polymers

Getting a handle on the Glass Transition
Advantages
•Low Cost
•Student Assembled
•Can observe what’s happening
Bath
Temp
Differential
Temp, ΔT
Enabling student
to explore both:
Glass transition
Crystal Melting
and
Candy sampleReference
Beaker filled
with oil
Thermal Analysis (DTA) for the Home Experimenter

Observing Tg of Sugar Glass
$12
The Initial, Basic Student DTA•Hot Plate from the lab with
•digital cooking thermometer
•digital meter with TC probe ($30)
•two test tubes and beaker
•cooking oil and
•hand made holder
Our initial manual data:
The experimentalist can literally watch what
is taking place as T rises!
Provides student access to the glass
transition and opportunity to explore their
own curiosities.
Quickly stimulating desire for more data,
more experiments!
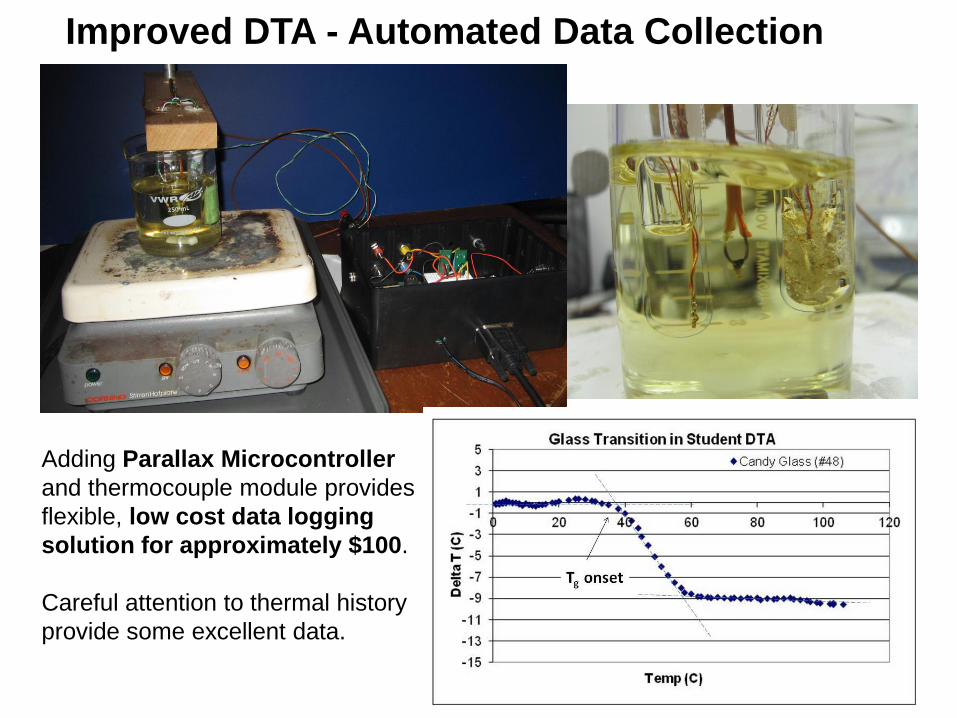
Improved DTA - Automated Data Collection
Adding Parallax Microcontroller
and thermocouple module provides
flexible, low cost data logging
solution for approximately $100.
Careful attention to thermal history
provide some excellent data.

Heating and Cooling Curves :
Stearic Acid a crystalline standard material
with moderately low melting point (~ 70 C).
Saucepan with
water & ice
Cooling Option Too!
Note: Tm identified with kink in
heating curve at ~ 70 C in
good agreement with literature
and comparison DSC.
Significant under-cooling
observed on the cooling scan.

Influence of Thermal History on DTA – Sugar Glass
Experiments illustrate
A) good repeatability with careful control of thermal history (long wait after quench)
B) large influence of changing thermal history (see 1 hr wait)
Both valuable hands on lessons for the student of glass sciences

PET chips cut from the top of a Nestle water bottle with oil to provide thermal
contact. Clear Tg near the 73 value from DSC as well as crystallization
exotherm near 135 C. Scans at ~ 10 C/min.
Tg
Txtal
Exo
Example Data – PET
Exo

Hand-made probe and ultra low current
amplifier capable of measuring
resistances in the100 G Ω range.
Designed with a $3 ultra low current IC
chip keeping total cost < $50.
Op Amps Open Additional Opportunities for the Experimenter
Electrical Conductivity Shows Signature of Tg
And a lot more ideas waiting to grow into quantitative experiments!
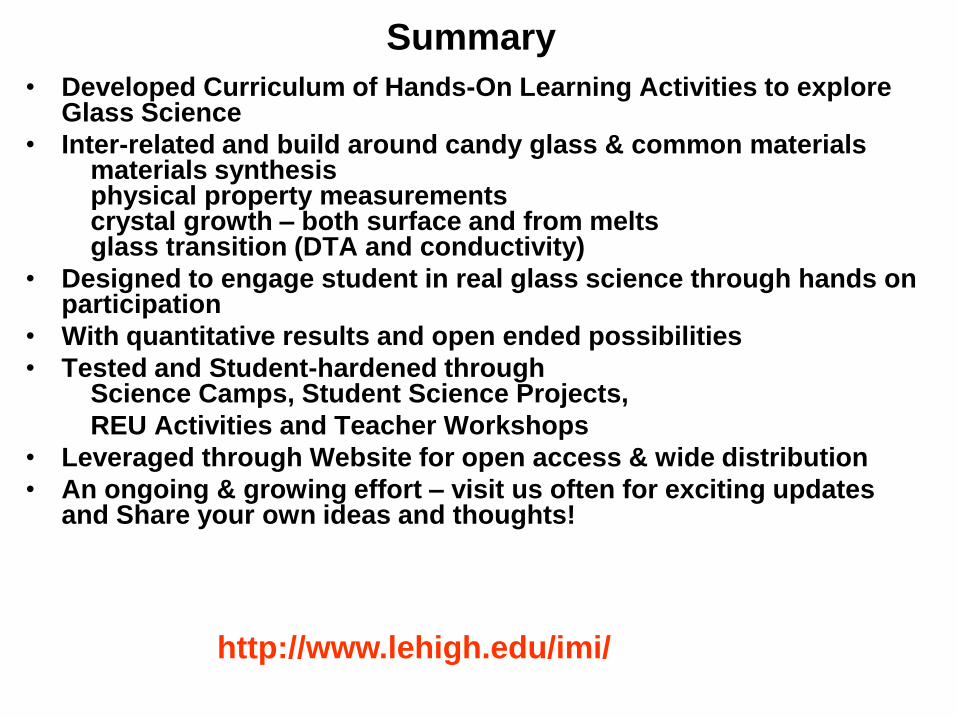
Summary
• Developed Curriculum of Hands-On Learning Activities to explore Glass Science
• Inter-related and build around candy glass & common materialsmaterials synthesisphysical property measurementscrystal growth – both surface and from meltsglass transition (DTA and conductivity)
• Designed to engage student in real glass science through hands on participation
• With quantitative results and open ended possibilities
• Tested and Student-hardened throughScience Camps, Student Science Projects,
REU Activities and Teacher Workshops
• Leveraged through Website for open access & wide distribution
• An ongoing & growing effort – visit us often for exciting updates and Share your own ideas and thoughts!
http://www.lehigh.edu/imi/

Acknowledgements:
REU students:
Tara Schneider (2006), Sean Kelly (2007)
Sarah Horst (2009),
Nick Ward, Jordan Davis, Adam Kohn and Paul Sihelnik (2010)
High school students (science projects):
Jung Hyun (Gloria) Noh (2007, 2008)
Isha Jain (2001)
Sarah Wing – IMI-NFG Coordinator , video assistant and enthusiastic
supporter of all education and outreach
NSF’s International Materials Institute for New Functionality in Glass
(IMI-NFG): DMR-0409588 and DMR-0844014.

Demonstrations
Polariscope - Observing Order
in Transparent Materials (1:39)
Candy Fiber Drawing Tower (1:45)
Writing Crystals with Light (1:13)http://rm1.cc.lehigh.edu:8080/asxgen/dept/IMI/EdVideo/CrystalWriting_768.wmv
Questions and Comments