exploring engineering chapter 15 manufacturing engineering
TRANSCRIPT
Exploring Engineering
Chapter 15
Manufacturing Engineering

We Cover Three Shop Topics
Basic Metal Cutting Operations
Speeds and Feeds
Shop Safety
Applications of statistical methods
A statistical method of analyzing defective manufactured products will be introduced. Six Sigma methods will be touched upon.

To Be Safe - Think!

Basic Safety Rules
Wear eye protection at all times
No loose-fitting clothing or jewelry
Do not work alone

Ask Someone If You Are Have Questions
= ?
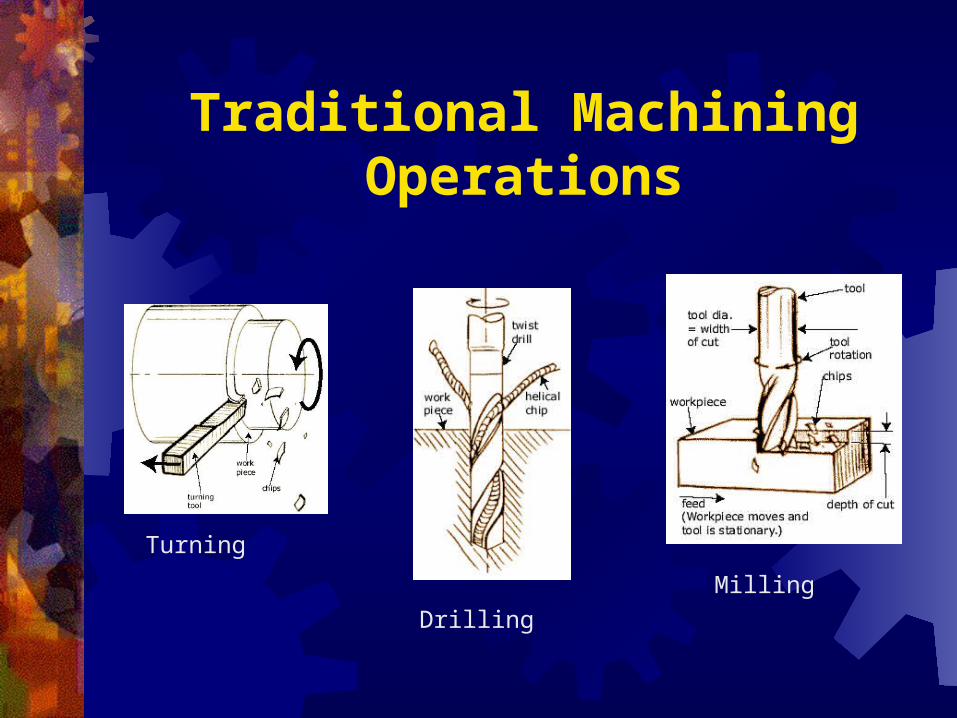
Traditional Machining Operations
Turning
Drilling
Milling

Typical Drill Press
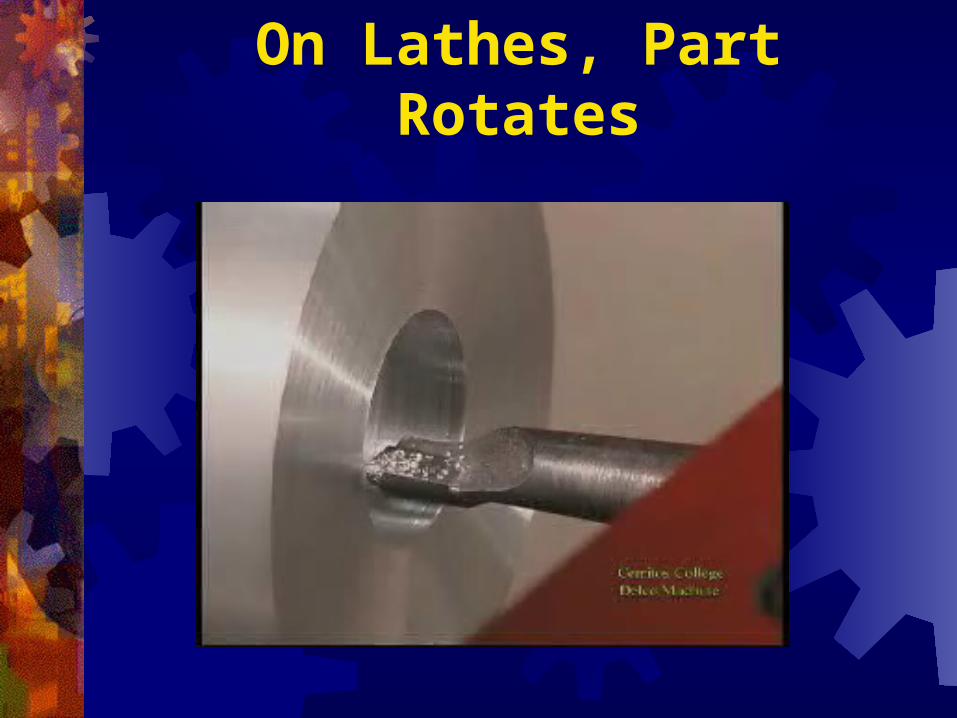
On Lathes, Part Rotates
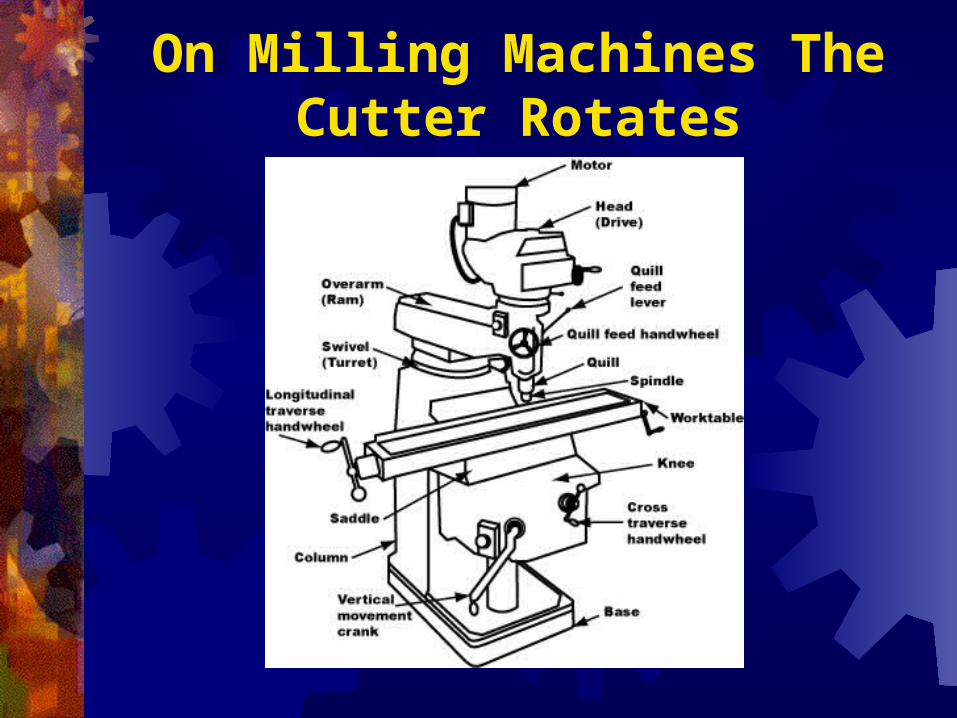
On Milling Machines The Cutter Rotates

Two Types Of Milling
Conventional Milling Climb Milling
PartPart
Cutter Cutter

Climb Milling
Both the cutter and the lead screw move the table in the same direction
Climb Milling
Part
Cutter

Speeds And Feeds Are Like Biting And Chewing
Speed: how fast the cutting tool (or part) spinsFeed Rate: how hast the part is advanced into the part
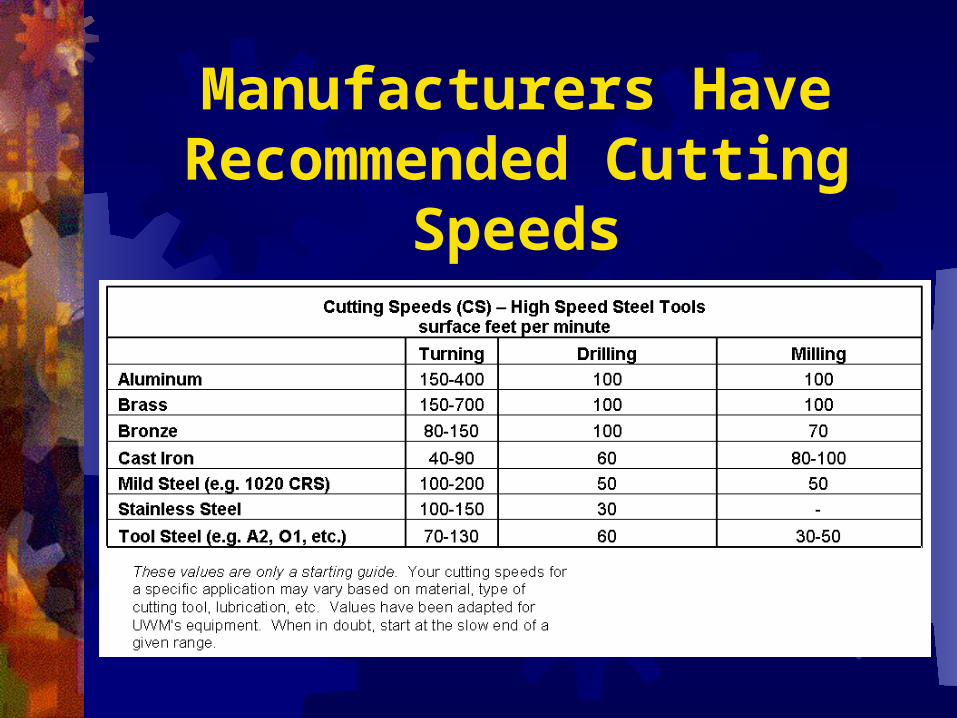
Manufacturers Have Recommended Cutting
Speeds

Calculating The Cutting RPM
Where RPM = revolutions per minute for the cutting tool (mill and drill) or work piece (lathe) CS = cutting speed in surface feet per minute Dia = diameter in inches for the cutting tool (mill and drill) or work piece (lathe)
Dia
CSRPM
*82.3
Same equation for drill press, mill, and lathe
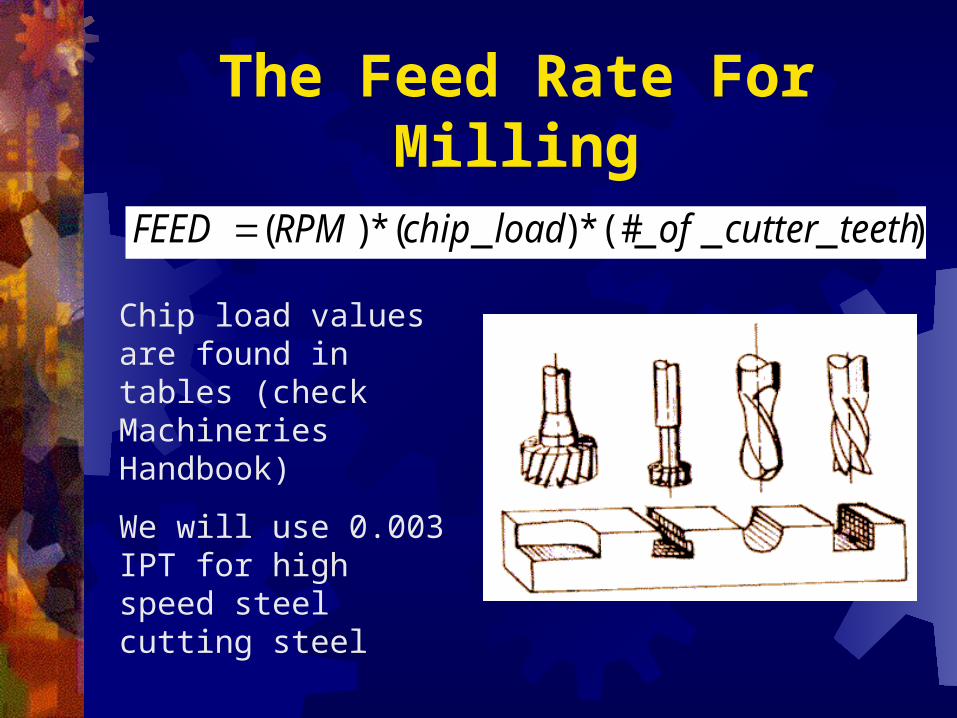
The Feed Rate For Milling)___(#*)_(*)( teethcutterofloadchipRPMFEED
Chip load values are found in tables (check Machineries Handbook)
We will use 0.003 IPT for high speed steel cutting steel
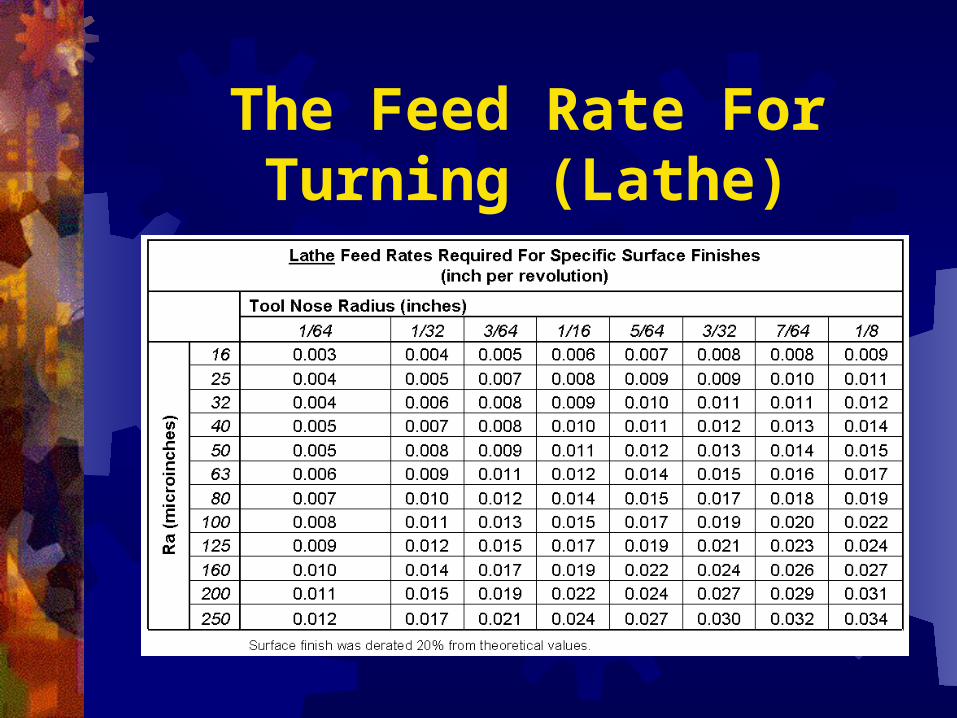
The Feed Rate For Turning (Lathe)
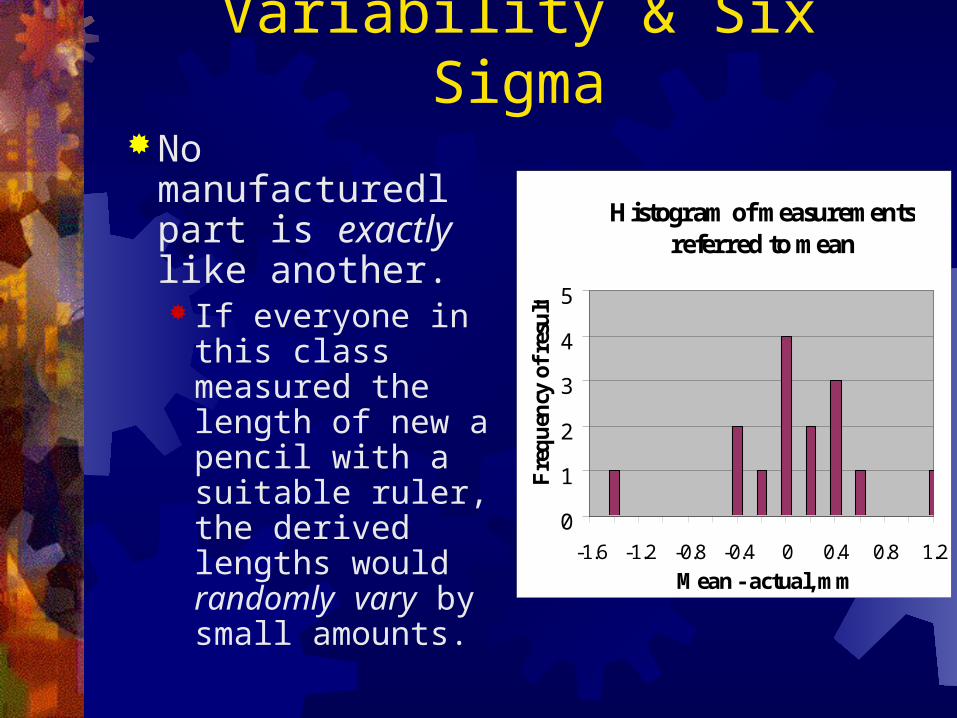
Variability & Six SigmaNo manufacturedl
part is exactly like another. If everyone in this
class measured the length of new a pencil with a suitable ruler, the derived lengths would randomly vary by small amounts.
Histogram of measurements referred to mean
0
1
2
3
4
5
-1.6 -1.2 -0.8 -0.4 0 0.4 0.8 1.2
Mean - actual, mm
Fre
qu
ency
of
resu
lt

Variability & Six Sigma Extend to many points and in the limit of
large measurements the data become continuous: Plot ordinate as “frequency” (fraction of total
measurements) vs. Z
i
i
i
i
i
i
N
x
x
N
x
xZ
2
2
th
deviation, standard theis
t measuremen i theis
mean, theis in which
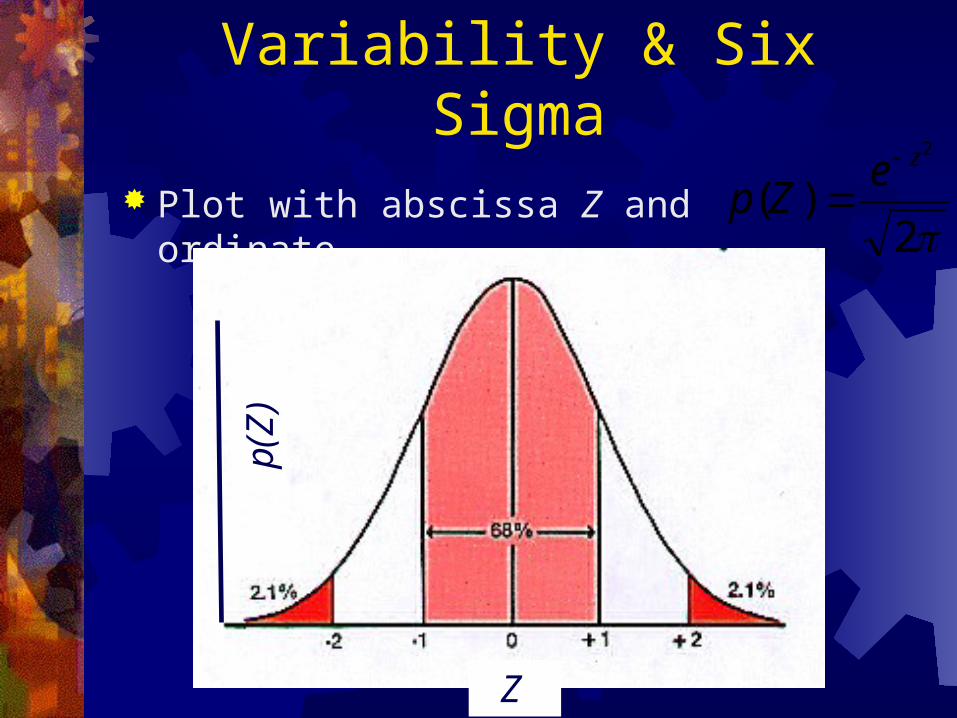
Variability & Six Sigma Plot with abscissa Z and ordinate
2)(
2zeZp
Z
p(Z
)

Variability & Six SigmaWhen plotted this way the area under
the curve from - to + is 1.00 (i.e., 100% of the samples) The area from -1 Z 1 contains 68% of
the data The area from -2 Z 2 contains 95% of
the data The area from -3 Z 3 contains 99.7%
of the data
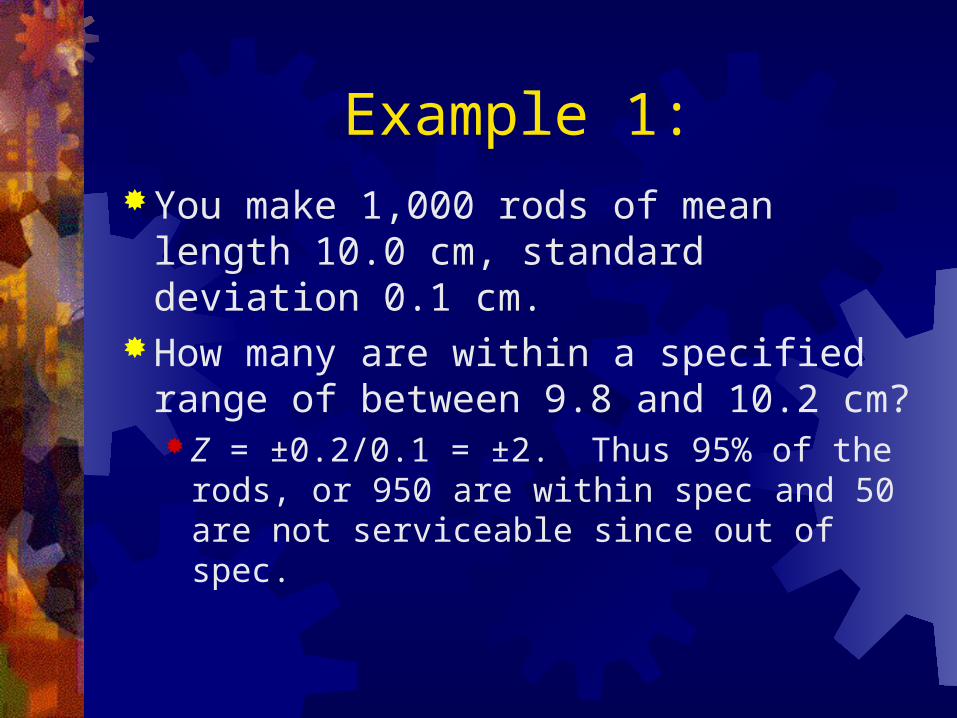
Example 1:You make 1,000 rods of mean length
10.0 cm, standard deviation 0.1 cm.How many are within a specified range
of between 9.8 and 10.2 cm? Z = ±0.2/0.1 = ±2. Thus 95% of the rods, or
950 are within spec and 50 are not serviceable since out of spec.

Example 2: You make 1,000 rods of mean length 10.0
cm, standard deviation 0.1 cm. How many are within a specified range of
between 9.85 and 10.15 cm? Z = ±0.15/0.1 = ±1.5. In the general case get the area
under the normal curve using Normsdist(Z) in Excel. Normsdist(1.5) yields 0.933 and 67 rods will fail
Less failures than in Example 1 since the window of acceptance is wider.

Variability & Six SigmaVariability has deep
consequences For example: Are
these two noisy means equivalent?
0.0
20.0
40.0
60.0
80.0
100.0
120.0
-20 30 80
Expt. #
Wid
get
vari
able
o xAverage 107.2 95.6Std dev 0.4 4.1
• Hint: Add ±boundaries for 2 - if they overlap Then the data cannot be statistically distinguished with 95% confidence

Six Sigma
A quality control program introduced into the US by Motorola to reduce the number of rejects and thus improve the quality of their products. Z = 6 is the stated target; with some slight
of hand it translates to 3.4 defects per million samples)
Summary Manufacturing engineering is covered in
Chapter 15 Machining, cutting, welding, extrusion, pultrusion
are all ways of manufacturing different products Derivation of formulae relating to cutting rates for
drilling, milling, and lathe work, are derived. Statistical analysis leads to better process control
and lest rejected widgets being out of specifications.