exploring biotransformation of micropollutants in three ... · s6 table s1 used compounds ,...
TRANSCRIPT

S1
Supporting Information:Exploring biotransformation of micropollutants in three freshwater phytoplankton species
Michael A. Stravs†‡, Francesco Pomati†§, Juliane Hollender†‡*†Eawag Swiss Federal Institute of Aquatic Science and Technology, Überlandstrasse 133, 8600 Dübendorf, Switzerland‡Institute of Biogeochemistry and Pollutant Dynamics, Universitätstrasse 16, ETH Zürich, 8092 Zürich, Switzerland§Institute of Integrative Biology, ETH Zürich, Universitätstrasse 16, 8092 Zürich, Switzerland
* Corresponding Author
Überlandstrasse 133, 8600 Dübendorf, Switzerland
phone: +41 58 765 5493; fax: +41 58 765 5893; e-mail: [email protected]
Summary: 36 pages, 9 tables, 6 figures
Electronic Supplementary Material (ESI) for Environmental Science: Processes & Impacts.This journal is © The Royal Society of Chemistry 2017

S2
Table of ContentsSupporting Information: Exploring biotransformation of micropollutants in three freshwater phytoplankton species .................................................................................................................1
S1. Supplementary Materials and Methods ............................................................................4
S2. Supplementary Results...................................................................................................11
S2.1 Bioconcentration .........................................................................................................11
S2.2 Transformation product identification ..........................................................................15
S2.3 Enzymatic transesterification of CBDZ with ethanol ...................................................19
S2.4 Abiotic transformation of KET .....................................................................................20
S2.5 Estimation of environmental transformation rates.......................................................21
S3. Spectra and Data for Transformation Products ..............................................................22
S3.1 Structure Elucidation of MEF-Glu................................................................................22
S3.2 Structure Elucidation of CBDZ-M................................................................................23
S3.3 Comparison of CBDZ-M spectrum to predicted CFM-ID spectra................................24
S3.4 Structure elucidation of SMZ-Pt ..................................................................................29
S3.5 Structure elucidation of SMZ-PtO ...............................................................................30
S3.6 Structure elucidation of SMZ-AcOH............................................................................31
S3.7 Structure elucidation of BEZ-da ..................................................................................32
S3.8 Structure elucidation of BEZ-M ...................................................................................33
S3.9 Structure elucidation of RAN-dm.................................................................................34
S3.10 Structure elucidation of MPL-dm .............................................................................35
References ................................................................................................................................36
List of Tables and FiguresTable S1: Used compounds, chemical formulas, molecular weights log Kow values, CAS numbers and sources.Table S2: Quantified parents and transformation products with internal standards used for quantificationTable S3: Suspect screening lists used for transformation product prediction.Figure S1: Growth curves for single culture experiments (a) and mixture experiments (b,c).Table S4: Mass balance of studied compounds in single-species experiments after 4 days.Table S5: Individual apparent bioconcentration factors for each compound in the three species Mcy, Syn and Chl.Figure S2 :Log bioconcentration factor in dependence of log Kow for a) Mcy, b) Syn and c) Chl. Table S6: log Kow correlations to apparent bioconcentration factor.Table S7: Analytical summary of found transformation products.Figure S3: pH-controlled experiments for strobilurin fungicides.Figure S4: Sulfamethoxazole and metabolites in mixture experiments.Figure S5: Formation of BEZ-da (a), BEZ-M (b) and ATE/MPL-A (c) under chemical stress.Figure S6: Transesterification of CBDZ with EtOH.Table S8: Estimation of environmental transformation rates for ATE.Table S9: Estimation of phytoplankton contribution to environmental transformation rates.

S3
S1. Supplementary Materials and MethodsCulture medium. Woods Hole Combo (WC) medium (as modified by Guillard and Lorenzen 1) was prepared as follows: A solution of 1 mM NaNO3, 250 μM CaCl2, 150 μM MgSO4, 150 μM NaHCO3, 50 μM K2HPO4, 390 μM H3BO3, 11.7 μM Na2EDTA, 11.7 μM FeCl3, 10 nM CuSO4, 76.5 nM ZnSO4, 42 nM CoCl2, 910 nM MnCl2, 26 nM Na2MoO4, 98 nM Na3VO4, 0.5 mM TES (2-[[1,3-dihydroxy-2-(hydroxymethyl)propan-2-yl]amino]ethanesulfonic acid) in deionized water was prepared from 115 mg TES and 1000x stock solutions of the remaining constituents. The medium was sterilized by autoclaving (30 min at 121°C). Modified versions were prepared by replacing TES by 100 mL 0.1M MOPS (3-(N-morpholino)propanesulfonic acid) buffer stock solution, pH 7.5, per L of medium (Woods Hole Combo + MOPS, WC+M medium), or by replacing TES by 100 mL 0.1M pH 7.5 per L of medium, and 1 mM NaNO3 by 1 mM NH4Cl (Woods Hole Combo + Ammonia + MOPS, WC+A+M medium).
Experiments – small scale, Mcy/Syn mixtures. Mcy and Syn cultures were sampled at comparable optical densities and mixed 1:1. In 20 mL online vials, 3 mL of Mcy/Syn mixture were diluted with 3 mL fresh WC medium. For control samples, 6 mL of fresh WC or WC+M medium was added to 20 mL online vials. A chemical mixture or solvent control (see below) was added to a final concentration of 10 µg/L per compound and sample. To each sample, a stressor chemical or vector control was added (see below). The vials were capped with a non-fixed crimp cap and a tissue cover, and incubated as for single species experiments..
Immediately after addition of the chemical mixture (t0) and after timepoints up to a week (see below) samples were taken for chemical analysis and cell density measurement. For chemical analysis, 500 or 750 µL of well mixed culture were sampled into a HPLC vial and frozen until measurement. For cell density measurement, 200 uL per culture were sampled into a 96-well plate and optical density at 680 nm and 750 nm was measured (SpectraMax 190, Molecular Devices, Sunnyvale CA).
Experiments – small scale: sample preparation. The frozen samples were thawed and lysed in the ultrasonic bath for 5 min at 37°C. 150 uL of well-mixed sample were added to a 300 uL HPLC insert in an 1.5 mL Eppendorf vial and subsequently centrifuged 5’ at 9000 rpm. 100 uL SN were diluted into 20 mL nanopure H2O and fortified with internal standard (IS) mixture (total final absolute amount 1 ng IS per substance and sample).
pH controlled degradation experiment. Two culture vials were prepared with WC+M medium (pH 7.5), one sample was prepared with WC medium (pH 7.2). As a control, two culture vials with WC+M medium and one with WC medium were prepared and autoclaved. To all samples, chemical mixture 1 was added to a final concentration of 10 µg/L per compound. Samples were taken at 0, 2.5, 4, 24, 32, 50 and 74 hours.
Chemical stressor experiment – 3 stressors. 14 culture vials were prepared with WC medium. To 7 vials, chemical mixture 1 was added to a final concentration of 10 µg/L per compound; to the other 7 vials, chemical mixture 2 was added instead. To 6 of the 7 vials for each mixture, a chemical stressor (atrazine, irgarol or triclosan) was added to a final concentration of 10 ng/L (3 vials, one each, from 1 µg/L in EtOH) or 100 ng/L (3 vials, one each, from 10 µg/L in EtOH).To the last vial, no stressor (only equivalent EtOH) was added. As a control, one vial each was prepared without culture, with WC medium, and either chemical mixture 1 or 2 (medium control); and two vials were prepared with culture and WC medium and no chemical mixture (biological control). Samples were taken after 0, 1, 3, 5 and 7 days.
Chemical stressor experiment – atrazine only. 8 culture vials were prepared with WC medium. To 4 vials each, chemical mixture 1 or 2 was added to a final concentration of 10 µg/L per compound. To 2 vials each, atrazine (final concentration 100 ng/L, from 10 µg/L in EtOH)
S4
was added; to the 2 other vials, no atrazine (only EtOH) was added. As a control, 4 vials were prepared without culture, with WC medium, 100 ng/L atrazine, and either chemical mixture 1 or 2 (two each, medium control); and 4 vials were prepared with culture and WC medium, no chemical mixture, and 100 ng/L atrazine (2 vials) or equivalent EtOH (2 vials) was added. Samples were taken after 0, 1, 3 and 5 days.
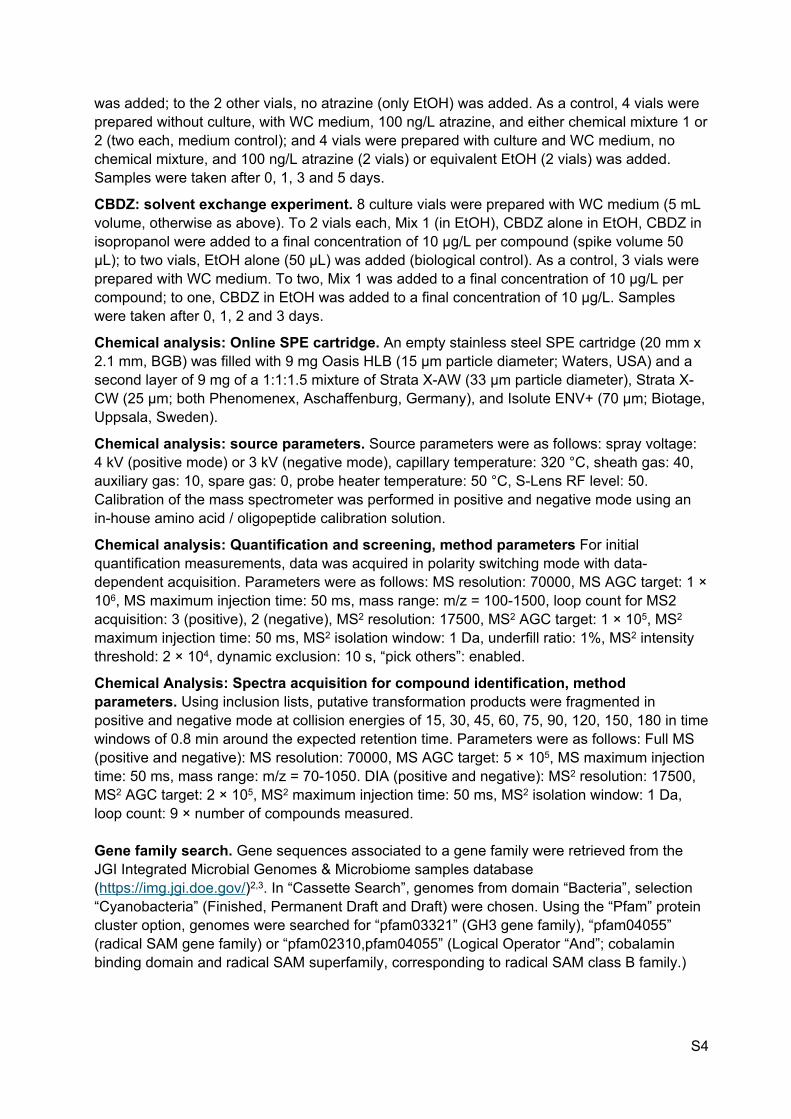
CBDZ: solvent exchange experiment. 8 culture vials were prepared with WC medium (5 mL volume, otherwise as above). To 2 vials each, Mix 1 (in EtOH), CBDZ alone in EtOH, CBDZ in isopropanol were added to a final concentration of 10 µg/L per compound (spike volume 50 µL); to two vials, EtOH alone (50 µL) was added (biological control). As a control, 3 vials were prepared with WC medium. To two, Mix 1 was added to a final concentration of 10 µg/L per compound; to one, CBDZ in EtOH was added to a final concentration of 10 µg/L. Samples were taken after 0, 1, 2 and 3 days.
Chemical analysis: Online SPE cartridge. An empty stainless steel SPE cartridge (20 mm x 2.1 mm, BGB) was filled with 9 mg Oasis HLB (15 µm particle diameter; Waters, USA) and a second layer of 9 mg of a 1:1:1.5 mixture of Strata X-AW (33 µm particle diameter), Strata X-CW (25 µm; both Phenomenex, Aschaffenburg, Germany), and Isolute ENV+ (70 µm; Biotage, Uppsala, Sweden).
Chemical analysis: source parameters. Source parameters were as follows: spray voltage: 4 kV (positive mode) or 3 kV (negative mode), capillary temperature: 320 °C, sheath gas: 40, auxiliary gas: 10, spare gas: 0, probe heater temperature: 50 °C, S-Lens RF level: 50. Calibration of the mass spectrometer was performed in positive and negative mode using an in-house amino acid / oligopeptide calibration solution.
Chemical analysis: Quantification and screening, method parameters For initial quantification measurements, data was acquired in polarity switching mode with data-dependent acquisition. Parameters were as follows: MS resolution: 70000, MS AGC target: 1 × 10⁶, MS maximum injection time: 50 ms, mass range: m/z = 100-1500, loop count for MS2 acquisition: 3 (positive), 2 (negative), MS2 resolution: 17500, MS2 AGC target: 1 × 10⁵, MS2 maximum injection time: 50 ms, MS2 isolation window: 1 Da, underfill ratio: 1%, MS2 intensity threshold: 2 × 10⁴, dynamic exclusion: 10 s, “pick others”: enabled.
Chemical Analysis: Spectra acquisition for compound identification, method parameters. Using inclusion lists, putative transformation products were fragmented in positive and negative mode at collision energies of 15, 30, 45, 60, 75, 90, 120, 150, 180 in time windows of 0.8 min around the expected retention time. Parameters were as follows: Full MS (positive and negative): MS resolution: 70000, MS AGC target: 5 × 10⁵, MS maximum injection time: 50 ms, mass range: m/z = 70-1050. DIA (positive and negative): MS2 resolution: 17500, MS2 AGC target: 2 × 10⁵, MS2 maximum injection time: 50 ms, MS2 isolation window: 1 Da, loop count: 9 × number of compounds measured.
Gene family search. Gene sequences associated to a gene family were retrieved from the JGI Integrated Microbial Genomes & Microbiome samples database (https://img.jgi.doe.gov/)2,3. In “Cassette Search”, genomes from domain “Bacteria”, selection “Cyanobacteria” (Finished, Permanent Draft and Draft) were chosen. Using the “Pfam” protein cluster option, genomes were searched for “pfam03321” (GH3 gene family), “pfam04055” (radical SAM gene family) or “pfam02310,pfam04055” (Logical Operator “And”; cobalamin binding domain and radical SAM superfamily, corresponding to radical SAM class B family.)

S5
Estimation of environmental transformation rates. An estimated biomass-normalized first-order transformation rate equivalent was calculated from the final remaining fraction of compound (C/C0), the experiment duration (t), and the average dry biomass during the experiment (B). From equation (1), the rate results as equation (2).
(1)𝐶 = 𝐶0 𝑒 ‒ 𝑘 𝑡 𝐵
(2)k =
‒ log 𝐶/𝐶0
𝐵 𝑡
For comparison with literature values from OECD 308/309 tests, DT50 values were converted to degradation rate constants using equation (3).
(3)𝑘 =
‒ log 0.5 𝐷𝑇50

S6
Table S1 Used compounds , chemical formulas, molecular weights log Kow values, CAS numbers and sources.
present in mixesCode Name Compound class1 2
Formula Molecular weight
[Da]
Exact mass log Kow CAS Vendor
ATE Atenolol Pharmaceutical x x C14H22N2O3 266.3 266.163044 0.16 [2] 29122-68-7 Sigma-AldrichBEZ Bezafibrate Pharmaceutical x x C19H20ClNO4 361.8 361.108084 4.25 [4] 41859-67-0 Sigma-Aldrich
CBDZ Carbendazim Pharmaceutical x x C9H9N3O2 191.2 191.069474 1.48 [1] 10605-21-7 Dr. EhrenstorferMEF Mefenamic acid Pharmaceutical x x C15H15NO2 241.3 241.110284 5.12 [2] 61-68-7 Sigma-AldrichMPL Metoprolol Pharmaceutical x x C15H25NO3 267.4 267.183444 1.88 [2] 37350-58-6 Sigma-AldrichRAN Ranitidine Pharmaceutical x x C13H22N4O3S 314.4 314.141262 0.27 [2] 66357-35-5 Sigma-AldrichTRA Tramadol Pharmaceutical x x C16H25NO2 263.4 263.188534 2.4 [2] 27203-92-5 FlukaVFX Venlafaxine Pharmaceutical x x C17H27NO2 277.4 277.204184 3.28 [3] 93413-69-5 TRC CanadaVPL Verapamil Pharmaceutical x x C27H38N2O4 454.6 454.283154 3.79 [2] 52-53-9 Sigma-AldrichAZY Azoxystrobin Strobilurin fungicide x x C22H17N3O5 403.4 403.116824 2.5 [1] 131860-33-8 FlukaFXS Fluoxastrobin Strobilurin fungicide x x C21H16ClFN4O5 458.8 458.079326 2.86 [1] 361377-29-9 Dr. EhrenstorferKME Kresoxim-methyl Strobilurin fungicide x x C18H19NO4 313.3 313.131404 3.4 [1] 143390-89-0 Dr. EhrenstorferPYR Pyraclostrobin Strobilurin fungicide x x C19H18ClN3O4 387.8 387.098584 3.99 [1] 175013-18-0 FlukaTFL Trifloxystrobin Strobilurin fungicide x x C20H19F3N2O4 408.4 408.129694 4.5 [1] 141517-21-7 Dr. EhrenstorferCYP Cyproconazole Azole fungicide (agric.) x C15H18ClN3O 291.8 291.113844 3.09 [1] 94361-06-5 Dr. EhrenstorferDIF Difenoconazole Azole fungicide (agric.) x C19H17Cl2N3O3 406.3 405.064697 4.36 [1] 119446-68-3 Dr. EhrenstorferEPO Epoxiconazole Azole fungicide (agric.) x C₁₇H₁₃ClFN₃O 329.8 329.073114 3.3 [1] 106325-08-0 Dr. EhrenstorferFLU Fluconazole Azole fungicide (pharm.) x C13H12F2N6O 306.3 306.104064 0.4 [2] 86386-73-4 Dr. EhrenstorferKET Ketoconazole Azole fungicide (pharm.) x C26H28Cl2N4O4 531.4 530.148761 4.35 [2] 65277-42-1 Sigma-AldrichMET Metconazole Azole fungicide (agric.) x C17H22ClN3O 319.8 319.14514 3.85 [1] 125116-23-6 Dr. EhrenstorferPEN Penconazole Azole fungicide (agric.) x C13H15Cl2N3 284.2 283.064303 3.72 [1] 66246-88-6 NovartisPRO Propiconazole Azole fungicide (agric.) x C15H17Cl2N3O2 342.2 341.069784 3.72 [1] 60207-90-1 HPC Standards GmbHTEB Tebuconazole Azole fungicide (agric.) x C16H22ClN3O 307.8 307.145144 3.7 [1] 107534-96-3 Dr. EhrenstorferSMZ Sulfamethoxazole Pharmaceutical:antibiotic x C10H11N3O3S 253.3 253.052114 0.89 [2] 723-46-6 Sigma-Aldrich
(agric.): in agricultural use, (pharm.) in pharmaceutical use[1]: Data from Pesticide Properties Database4
[2]: Data from DrugBank5
[3]: Data from PubChem (CID: 5656)6
[4]: No experimental value for the log Kow of BEZ could be found; the used value is calculated using EPI-Suite7

S7
Table S2 Parents and transformation products with internal standards used for quantification
Parent Transformation product CAS No. Formula m/z RT [min] internal standardAtenolol ATE C14H22N2O3 267.1703 11.3 Atenolol-D7
ATE Atenolol-desisopropyl 81346-71-6 C11H16N2O3 225.1234 7.9 Carbamazepine-10-11-epoxide-13C-D2
ATE, MPL
Atenolol/metoprolol acid 56392-14-4 C14H21NO4 268.1543 12.7 Atenolol/metoprolol acid-D5
Azoxystrobin AZY C22H17N3O5 404.1241 22.1 Azoxystrobin-D4AZY Azoxystrobin acid 1185255-09-7 C21H15N3O5 390.1084 21.3 Azoxystrobin-D4, DEET-D10
Bezafibrate BEZ C19H20ClNO4 362.1154 22.6 Bezafibrate-D4BEZ 3-[(4-
chlorobenzoyl)amino]-propanoic acid
108462-95-9 C10H10ClNO3 228.0422 19.5 Sulfadimethoxin-D4, Erythromycin-13C2
Carbendazim CBDZ C9H9N3O2 192.0768 13.9 Carbendazim-D4Cyproconazole CYP C15H18ClN3O 292.1211 23.1 Epoxiconazole-D4Difenoconazole DIF C19H17Cl2N3O3 406.0720 24.2 Propiconazole-D5Epoxiconazole EPO C17H13ClFN3O 330.0804 23.4 Epoxiconazole-D4Fluconazole FLU C13H12F2N6O 307.1113 17.5 Fluconazole-D4Fluoxastrobin FXS C21H16ClFN4O5 459.0866 23.0 Epoxiconazole-D4Ketoconazole KET C26H28Cl2N4O4 531.1560 19.2 Atomoxetin-D3, Erythromycin-13C2Kresoxim-methyl KME C18H19NO4 314.1387 23.7 Epoxiconazole-D4
KME Kresoxim-methyl acid 181373-11-5 C17H17NO4 300.1230 23.4 Epoxiconazole-D4Mefenamic acid MEF C15H15NO2 242.1176 24.7 Mefenamic acid-D3Metconazole MET C17H22ClN3O 320.1524 24.2 Propiconazole-D5Metoprolol MPL C15H25NO3 268.1907 15.6 Metoprolol-D7Penconazole PEN C13H15Cl2N3 284.0716 23.9 Tebuconazole-D6Propiconazole PRO C15H17Cl2N3O2 342.0771 24.0 Propiconazole-D5Pyraclostrobin PYR C19H18ClN3O4 388.1059 24.0 Tebuconazole-D6Ranitidine RAN C13H22N4O3S 315.1485 11.3 Ranitidine-D6
RAN Ranitidine S-oxide 73851-70-4 C13H22N4O4S 331.1435 7.0 Carbendazim-D4RAN Ranitidine N-oxide 73857-20-2 C13H22N4O4S 331.1435 11.7 Carbendazim-D4
Sulfamethoxazole SMZ C10H11N3O3S1 254.0594 16.3 Sulfamethoxazole-D4SMZ N-Acetyl-Sulfamethoxazole 21312-10-7 C12H13N3O4S 296.0700 17.9 N-Acetyl-Sulfamethoxazole-D5
Tebuconazole TEB C16H22ClN3O 308.1524 23.9 Tebuconazole-D6Trifloxystrobin TFL C20H19F3N2O4 409.1370 24.2 Propiconazole-D5
TFL Trifloxystrobin acid 252913-85-2 C19H17F3N2O4 395.1213 23.9 Tebuconazole-D6 (*)

S8
Tramadol TRA C16H25NO2 264.1958 15.5 Tramadol-D6TRA N,N-didesmethyltramadol 931115-27-4 C14H21NO2 236.1645 16.1 Tramadol-D6TRA N-desmethyltramadol 73806-55-0 C15H23NO2 250.1802 16.0 Tramadol-D6TRA Tramadol N-oxide 147441-56-3 C16H25NO3 280.1907 16.0 Atrazine-desethyl-15N3
Venlafaxine VFX C17H27NO2 278.2115 17.2 Venlafaxine-D6VFX N-desmethylvenlafaxine 149289-30-5 C16H25NO2 264.1958 17.3 Venlafaxine-D6VFX N,N-
didesmethylvenlafaxine93413-77-5 C15H23NO2 250.1802 17.3 N,O-didesmethylvenlafaxine-D3
VFX N,O-didesmethylvenlafaxine
135308-74-6 C15H23NO2 250.1802 15.3 N,O-didesmethylvenlafaxine-D3
VFX O-desmethylvenlafaxine 93413-62-8 C16H25NO2 264.1958 15.2 O-desmethylvenlafaxine-D6VFX Venlafaxine N-oxide 1094598-37-4 C17H27NO3 294.2064 17.8 Venlafaxine-D6
Verapamil VPL C27H38N2O4 455.2904 18.2 Verapamil-D6VPL D617 34245-14-2 C17H26N2O2 291.2067 23.2 Verapamil-D6, Atorvastatin-D5
(*): quantified by relative peak area in single species experiments

S9
Table S3 Suspect screening lists used for transformation product prediction.
Type NameMass
difference Loss GainFormula difference Description
parent 0.0000 no changeReductions, oxidations, skeleton substitutions (CHNO)
oh 15.9949 O O1 Hydroxlationdeme -14.0157 CH3 H C-1H-2 Demethylationdeet -28.0313 C2H5 H C-2H-4 Deethylationdeh2 -2.0157 H2 H-2 General reductionh2 2.0157 H2 H2 General oxidationdeh2o -18.0106 H2O H-2O-1 Dehydrationh2o 18.0106 H2O H2O1 Hydrationdeco2 -43.9898 CO2 C-1O-2 Decarboxylationdeno2 -44.9851 NO2 H H1N-1O-2 Nitro group lossmeoxi 29.9742 H O2H O2 Methyl oxidation to carboxylic aciddeamin -15.0109 H NH2 N1H1 Deaminationoxicooh 13.9793 H2 O O1H-2 Alcohol oxidation to acidnitrored -29.9742 O2 H2 H2O-2 Nitro reductiondisnhox 0.9840 NH2 OH O1N-1H-1 Amine to hydroxy (ipso-)substitutiondeipr -42.0470 C3H7 H C-3H-6 Isopropyl lossamin -0.9840 OH NH2 N1O-1H1 Hydroxy to amine (ipso-)substitution
Reductions, oxidations (Cl, F)clXh -33.9610 Cl H H1Cl-1 Reductive dechlorinationdisf -17.9906 F H H1F-1 Reductive defluorinationdisclox -17.9661 Cl OH O1H1Cl-1 Oxidative dechlorinationdisfox -1.9957 F OH O1H1F-1 Oxidative defluorination
Conjugation-type reactions: methylationme 14.0157 H CH3 C1H2 Methylationet 28.0313 H C2H5 C2H4 Ethylation / di-methylation
Conjugation-type reactions: amino acid conjugationleu 113.0841 H2O C6N1H13O2 C6N1H11O1 Leucine / isoleucinelys 128.0950 H2O C6N2H14O2 C6N2H12O1 Lysinemet 131.0405 H2O C5N1S1H11O2 C5N1S1H9O1 Methioninephe 147.0684 H2O C9N1H11O2 C9N1H9O1 Phenylalaninethr 101.0477 H2O C4N1H9O3 C4N1H7O2 Threoninetry 186.0793 H2O C11N2H12O2 C11N2H10O1 Tryptophanval 99.0684 H2O C5N1H11O2 C5N1H9O1 Valinearg 156.1011 H2O C6N4H14O2 C6N4H12O1 Argininehis 137.0589 H2O C6N3H9O2 C6N3H7O1 Histidineala 71.0371 H2O C3N1H7O2 C3N1H5O1 Alanineasn 114.0429 H2O C4N2H8O3 C4N2H6O2 Asparagineasp 115.0269 H2O C4N1H7O4 C4N1H5O3 Aspartatecys 103.0092 H2O C3N1S1H7O2 C3N1S1H5O1 Cysteineglu 129.0426 H2O C5N1H9O4 C5N1H7O3 Glutamategln 128.0586 H2O C5N2H10O3 C5N2H8O2 Glutaminegly 57.0215 H2O C2N1H5O2 C2N1H3O1 Glycinepro 97.0528 H2O C5N1H9O2 C5N1H7O1 Prolineser 87.0320 H2O C3N1H7O3 C3N1H5O2 Serinetyr 163.0633 H2O C9N1H11O3 C9N1H9O2 Tyrosineadda 313.2042 H2O C20H29NO3 C20N1H27O2 ADDA [1]
Conjugation-type reactions: othergluc 176.0321 H C6H9O6 C6O6H8 Glucuronidationnac 42.0106 H C2H3O C2O1H2 (N-)acetylationsulf 79.9568 H HSO3 S1O3 Sulfate conjugationgsh 305.0682 H C10H15N3O6S C10H15N3O6S1 Glutathione conjugationnaccys 162.0225 H C5H8NO3S C5H8N1O3S1 (N-)acetylcysteine conjugation
[1] ADDA is a non-proteinogenic amino acid found in toxic cyanobacterial peptides, e.g. microcystin.8

S10
S2. Supplementary Results
S2.1 Bioconcentration
Figure S1 Growth curves for single culture experiments (a) and mixture experiments (b,c). a) Dark blue: Mcy, light blue: Syn, green: Chl. Solid lines: cultures treated with chemicals, dashed lines: chemical-free control. Note: The lines for Syn overlap completely, which is why the chemical control is not visible. b) Mixture experiments with stressors at 100 ng/L, blue: no stressor, yellow: atrazine, brown: irgarol, olive: triclosan, blue dashed: chemical-free control. c) Mixture experiments with stressors. Blue: no stressor; yellow: atrazine 100 ng/L; red: azoles 10 µg/L, turquoise: atrazine and azoles; blue dashed: chemical-free control.

S11
Table S4: Mass balance of studied compounds after 4 days.
Microcystis Synechococcus Chlamydomonasmedium cells TPs medium cells TPs medium cells TPs
Atenolol 95% 0% 87% 0% ATE/MPL-A: 7% 102% 0%Azoystrobin 102% 0% 95% 0% 107% 0%Bezafibrate 96% 0% BEZ-da: <1%* 93% 100% BEZ-da: <1%*Carbendazim (see S2.3) 99% 94% (CBDZ-M: 1%*) 104%Cyproconazole 101% 0% 95% 0% 102% 0%Difenoconazole 83% 0% 77% 4% 98% 2%Epoxyconazole 97% 0% 92% 1% 100% 0%Fluconazole 97% 94% 101%Fluoxastrobin 103% 0% 90% 2% 108% 0%Ketoconazole (see S2.4) 23% 3% (7%*) 48% 0% (7%*) 75% 1% (8%*)Kresoxim-methyl 1% 0% KME-A: 101% 68% 1% KME-A: 29% 94% 0% KME-A: 14%Mefenamic acid 89% 0% 85% MEF-Glu: 9%* 96%Metconazole 95% 0% 93% 0% 104% 0%Metoprolol 94% 0% 93% 86% ATE/MPL-A:
4% (medium)2% (cells)MPL-dm: 6%*
Penconazole 96% 0% 94% 0% 102% 0%Propiconazole 96% 0% 95% 0% 102% 0%Pyraclostrobin 85% 2% 61% 12% 96% 1%Ranitidine 84% 0% RAN-dm: 4%* 89% 0% 94% 0%Sulfamethoxazole 66% 0% SMZ-DHPt: 2%*
SMZ-Pt: 3%*SMZ-PtO: 3%*
38% 0% SMZ-AcOH: 2%* 98% 0%
Tebuconazole 96% 93% 102%Tramadol 119% 117% 125%Trifloystrobin 2% 0% TFL-A: 101%* 49% 8% TFL-A: 28%* 96% 1% TFL-A: 7%*Venlafaxine 101% 100% 106%Verapamil 69% 0% VPL-da: 1% 90% 0% VPL-da: <1% 97% 0% VPL-da: <1%“medium”: parent substance in medium. “cells”: parent substance in cells. “TPs”: transformation products. (*): quantified using peak area ratio. Unless otherwise noted, TPs were only found in medium. Values are the mean of three replicates.

S12
Table S5 Individual apparent log bioconcentration factors for each compound in the three species Mcy, Syn and Chl.
Mcy Syn ChlATE 2.2 1.4 1.5AZY 0.9 1.5 2.3BEZ 1.1 - -CBDZ - - -CYP 1.3 1.7 1.9DIF 2.5 2.8 3.3EPO 1.4 1.7 2.5FLU - - -FXS 1.7 2.4 2.3KET 2.7 2.5 3.1KME - - 2.7MCZ 1.6 2.0 2.4MEF 2.2 - -MPL 1.4 - -PEN 1.5 - 2.2PRO 1.0 - -PYR 3.2 3.1 2.9RAN 1.3 - 1.9SMZ 1.5 1.9 -TEB - - -TFL - 3.0 2.9TRA - - -VFX - - -VPL 2.1 1.9 1.8
Mean log BCF were calculated from the point of apparent equilibration. No log BCF was calculated for
CBDZ, FLU, TRA, VFX (all species), BEZ, MPL, TEB, MEF (some species) because internal concentrations in cells were negligible
KME for Mcy and Chl, and TFL for Mcy, because degradation was too rapid to reliably determine an (apparent) BCF

S13
Figure S2 Log bioconcentration factor in dependence of log Kow for a) Mcy, b) Syn and c) Chl. Red filled circles: azole fungicides; blue filled circles: strobilurin fungicides, black open circles: remaining compounds. Red, blue and black line: linear correlation for azole fungicides only (red), strobilurin fungicides only (blue), or all compounds (including azole and strobilurin fungicides; black).
Table S6 log Kow correlations to apparent bioconcentration factor.
log BCF = a + b * log Kow adjustedSpecies Chem a b R2 R2 p (b ≠ 0)Mcy all 1.39 0.11 0.06 -0.01 0.39Syn all 1.23 0.30 0.49 0.43 0.017 (*)Chl all 1.53 0.29 0.53 0.49 0.004 (**)Mcy azoles -2.38 1.09 0.71 0.63 0.036 (*)Syn azoles -0.97 0.83 0.95 0.93 0.024 (*)Chl azoles -0.86 0.92 0.82 0.76 0.035 (*)Mcy strobilurins -2.64 1.47 0.98 0.97 0.083Syn strobilurins -0.01 0.72 0.80 0.71 0.1Chl strobilurins 1.47 0.34 0.92 0.90 0.009 (**)
p (b ≠ 0): p value for slope of the linear regression log BCD = a + b * log Kow. (*): p < 0.05; (**): p <0.01
S14
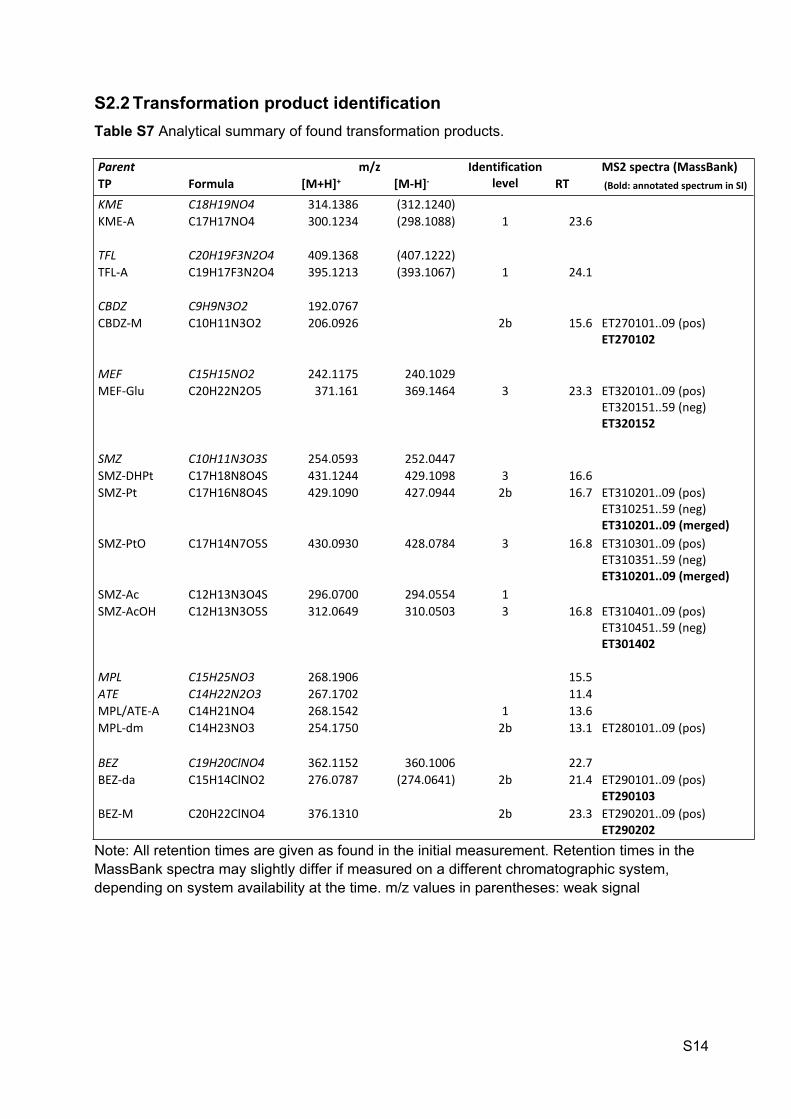
S2.2 Transformation product identificationTable S7 Analytical summary of found transformation products.
Parent m/z MS2 spectra (MassBank)TP Formula [M+H]+ [M-H]-
Identification level RT (Bold: annotated spectrum in SI)
KME C18H19NO4 314.1386 (312.1240)KME-A C17H17NO4 300.1234 (298.1088) 1 23.6
TFL C20H19F3N2O4 409.1368 (407.1222)TFL-A C19H17F3N2O4 395.1213 (393.1067) 1 24.1
CBDZ C9H9N3O2 192.0767CBDZ-M C10H11N3O2 206.0926 2b 15.6 ET270101..09 (pos)
ET270102
MEF C15H15NO2 242.1175 240.1029MEF-Glu C20H22N2O5 371.161 369.1464 3 23.3 ET320101..09 (pos)
ET320151..59 (neg)ET320152
SMZ C10H11N3O3S 254.0593 252.0447SMZ-DHPt C17H18N8O4S 431.1244 429.1098 3 16.6SMZ-Pt C17H16N8O4S 429.1090 427.0944 2b 16.7 ET310201..09 (pos)
ET310251..59 (neg)ET310201..09 (merged)
SMZ-PtO C17H14N7O5S 430.0930 428.0784 3 16.8 ET310301..09 (pos)ET310351..59 (neg)ET310201..09 (merged)
SMZ-Ac C12H13N3O4S 296.0700 294.0554 1SMZ-AcOH C12H13N3O5S 312.0649 310.0503 3 16.8 ET310401..09 (pos)
ET310451..59 (neg)ET301402
MPL C15H25NO3 268.1906 15.5ATE C14H22N2O3 267.1702 11.4MPL/ATE-A C14H21NO4 268.1542 1 13.6MPL-dm C14H23NO3 254.1750 2b 13.1 ET280101..09 (pos)
BEZ C19H20ClNO4 362.1152 360.1006 22.7BEZ-da C15H14ClNO2 276.0787 (274.0641) 2b 21.4 ET290101..09 (pos)
ET290103BEZ-M C20H22ClNO4 376.1310 2b 23.3 ET290201..09 (pos)
ET290202
Note: All retention times are given as found in the initial measurement. Retention times in the MassBank spectra may slightly differ if measured on a different chromatographic system, depending on system availability at the time. m/z values in parentheses: weak signal

S15
Figure S3 pH-controlled experiments for strobilurin fungicides. Top 5 plots, a)-e): KME, TFL, AZY, FXS, PYR; dashed: KME-A, TFL-A. f) pH over time g) biomass (determined from optical density at 750 nm) over time. Blue: nominal pH 7.5, red: nominal pH 7.2, black (narrow): autoclave control pH 7.5, brown (narrow): autoclave control pH 7.2.

S16
Figure S4 Sulfamethoxazole and metabolites in mixture experiments. a) SMZ, b) SMZ-Ac, c) SMZ-AcOH, d) SMZ-DHPT, e) SMZ-Pt, f) SMZ-PtO. Red: Mcy+Syn mixture, black: medium control. c/c0 values are concentrations, or transformation product amounts semiquantified via peak area (marked *), relative to average initial parent concentration.

S17
Figure S5 Formation of BEZ-da (a), BEZ-M (b) and ATE/MPL-A (c) under chemical stress. Blue: no stressor, yellow: atrazine, brown: irgarol, olive: triclosan, black: medium control. Top: 100 ng/L stressor concentration, bottom: 10 ng/L stressor concentration. All experiments without azole mixture. c/c0 values are concentrations, or transformation product amounts semiquantified via peak area (marked *), relative to average initial parent concentration.

S18
S2.3 Enzymatic transesterification of CBDZ with ethanolIn single species experiments with Syn and in Mcy+Syn combined experiments, a product (CBDZ-M, [M+H]+ 206.0926, RT: 15.6 min) consistent with a methylation product of CBDZ was found by suspect screening (Figure S6). Methylation of a nitrogen by a methyltransferase would be the most obvious explanation for the product. However, both the most straightforward manual interpretation of the spectrum and in-silico MS2 spectra (using CFM-ID9,10, see SI S3.2, SI S3.3) of possible structures suggest methylation on the methyl ester carbon, whereas no fragments provide evidence for a methyl group on the N.
This was initially hypothesized to be a carbon methylation reaction, which can be performed by radical S-adenosylmethionine-dependent enzymes (RS enzymes)11. However, further experiments showed that formation of CBDZ-M is abolished when CBDZ is dissolved in isopropanol instead of ethanol, whereas small amounts of a corresponding product with addition of C2H4 was found. Therefore, the CBDZ-M product is likely formed by a transesterification with ethanol, rather than by methylation of the terminal CH3. Neither of these products is formed abiotically, supporting an enzymatic reaction (Figure S6).
This reaction shows an interesting xenobiotic pathway in Synechococcus. Enzymatic transesterification by ethanol is known, for example, for cocaine in humans and mice12 Although this reaction is not relevant under environmental conditions reactions with other biological alcohols could potentially be of interest. Other TPs for CBDZ were not found; in particular there was no evidence for the formation of the hydrolysis product 2-aminobenzimidazole, which is commonly found in microbial biotransformation13.
Figure S6 Transesterification of CBDZ with EtOH. a) suggested reaction. b) CBDZ biotransformation in single-species experiments. Solid lines: CBDZ, dashed lines: CBDZ-M. Blue: Mcy, turquoise: Syn, green: Chl. Black: medium control. c)-d) CBDZ TP formation in solvent exchange experiments. c) CBDZ-M, d) CBDZ-C2H4. Dark blue: Mcy+Syn, Mix 1 in EtOH. Orange: Mcy+Syn, CBDZ in EtOH. Red: Mcy+Syn, CBDZ in isopropanol. Black: abiotic control. c/c0 values are parent concentration, or transformation product semiquantified via peak area (marked *), relative to average initial concentration.

S19
S2.4 Abiotic transformation of KETFor KET, 25-75% dissipation after 4 days and >75% dissipation after 12 days was observed in single species experiments and a single TP ([M+H]+ 533.1353) was found. However, the substance was not consistently stable in medium controls, and the TP was found also in controls where KET loss was observed. While KET is documented to be long-term stable in aqueous solutions from pH 5-9 under presence of minimal amounts of antioxidant14, no information is available on its stability in solutions similar to WC medium; abiotic oxidation, potentially by indirect photochemistry, is a likely source for the TP.

S20
S2.5 Estimation of environmental transformation ratesEstimated environmental biomass-normalized transformation rates (Table S8) were calculated for ATE as described in Supplementary Materials and Methods. To compare calculated rates with known values, DT50 values from literature were converted to degradation rates as described (Table S9). Phytoplankton biomass values for the eutrophic lake Greifensee (Switzerland) in the range of 4 mm3/L were used as a reference15. Using 0.47 pg/µm3 as a wet biovolume to dry weight conversion estimate16, a dry weight equivalent of 2 mg/L can be obtained. The contribution of phytoplankton was then estimated by multiplying the biomass-normalized rate with the biomass, and diving the obtained rate by the rate derived from DT50 values.
It should be noted that the observed data qualitatively do not match neither a first-order decay nor a pure biomass-dependent degradation, but likely involve some regulation dynamics. Therefore these values are to be seen as the roughest of estimates, however they should serve to get an order-of-magnitude estimate of the relevance of the observed reactions to environmental situations.
Table S8 Estimation of environmental transformation rates for ATE time biomass norm. rate%
remaininglog
degradation [days] [g/L] [(d × g/L)-1]
ATE (Syn) 65 -0.19 12 0.2 0.08ATE (Mcy+Syn) 85 -0.07 5 0.1 0.14“norm. rate”: estimated dry biomass normalized first order degradation rate.
Table S9 Estimation of phytoplankton contribution to environmental transformation rates.
norm. rate biomass env.rate DT50 lit. rate contribution[(d × g/L)-1] [g/L] [d-1] [d] [d-1] [%]
ATE (Syn) 0.08 1.6 × 10⁻⁴ 0.6 to 4ATE (Mcy+Syn) 0.14
0.0022.8 × 10-4
12.8-69.317 0.004 to 0.0251 to 7
“norm. rate”: estimated dry biomass normalized first order degradation rate. “env.rate”: estimated contribution to environmental first-order degradation with given biomass. “lit. rate”: Literature DT50 converted to first-order degradation rate.

S21
S3. Spectra and Data for Transformation Products
S3.1 Structure Elucidation of MEF-Glu
MS2 spectrum, negative mode, parent [M-H]- 369.1465, collision energy NCE 30. Automated formula annotation (RMassBank) MassBank reference: ET320152.
0 100 200 300 400
0%50
%10
0%
84.04
57
C 4H6NO-
128.0
353
C 5H6NO 3-
196.1
127
C14H 14
N-
222.0
925
C 15H12
NO-
240.1
029
C15H 14
NO 2-
263.1
558
C 18H 19
N 2-
281.1
656
C 18H21
N 2O-
307.1
455
C 19H19
N 2O2
-
325.1
559
C19H 21
N 2O3
-
369.1
437
C 20H 21
N 2O5
-
Proposed Structure (modification in red) and Fragmentation:
Confidence level: Level 3
Additional evidence for structure interpretation:
In positive mode, dominant fragment 224 (loss of amino acid moiety).

S22
S3.2 Structure Elucidation of CBDZ-M
MS2 spectrum, positive mode, parent [M+H]+ 206.0924, collision energy NCE 30. Automated formula annotation (RMassBank). MassBank reference: ET270102
0 50 100 150 200 250
0%50
%10
0%
134.0
713
C7H8N 3+
160.0
506
C 8H6N
3O+
178.0
612
C 8H8N
3O 2+
206.0
926
C 10H 12
N 3O2
+
Proposed Structure (modification in red) and Fragmentation:
Confidence Level: Level 2b
Additional evidence for structure interpretation:
See SI S3.3, comparison with in-silico spectra by CFM-ID
As noted in the main text, this product could in theory be formed by “ethanolysis” of the methyl ester as a possible side reaction to hydrolysis. However, a corresponding hydrolysis product is not observed. For KME and TFL, which show marked hydrolysis, trace quantities of transformation products possibly formed by ethanolysis could be observed ([M+H]+ 328.1543, RT: 24.2 min for the KME product KME-M, 423.1527, RT: 24.6 min for the TFL product TFL-M).

S23
S3.3 Comparison of CBDZ-M spectrum to predicted CFM-ID spectra.
Top: MS2 spectrum, positive mode, parent [M+H]+ 206.0924, merged spectra (collision energies NCE 15, 30, 45, 60, 75, 90) by absolute intensity. MassBank reference: ET270101-ET270109.
Bottom: In-silico MS2 spectrum, CFM-ID, positive mode, merged spectra (collision energy 10 eV, 20 eV, 40 eV).
0 50 100 150 200 250
0%50
%10
0%
65.03
86
C 5H5
+
80.04
94
C 5H6N+
92.04
95
C6H6N+
105.0
447
C 6H5N 2+
134.0
713
C7H8N 3+
160.0
506
C 8H6N 3O
+
178.0
612
C 8H 8N3O
2+
206.0
925
C 10H 12
N 3O2
+
100%
50%
0%
29.03
86
47.04
91
73.02
84
134.0
713
160.0
505
178.0
611
206.0
924
Dot product similarity: 0.86
ONH
HN
N
O Me

S24
Top: MS2 spectrum, positive mode, parent [M+H]+ 206.0924, merged spectra (collision energies NCE 15, 30, 45, 60, 75, 90) by absolute intensity. MassBank reference: ET270101-ET270109.
Bottom: In-silico MS2 spectrum, CFM-ID, positive mode, merged spectra (collision energy 10 eV, 20 eV, 40 eV).
0 50 100 150 200 250
0%50
%10
0%
65.03
86
C 5H5
+
80.04
94
C 5H6N+
92.04
95
C6H6N+
105.0
447
C 6H5N 2+
134.0
713
C7H8N 3+
160.0
506
C 8H6N 3O
+
178.0
612
C 8H 8N3O
2+
206.0
925
C 10H 12
N 3O2
+
100%
50%
0%
59.01
28
148.0
869
174.0
662
206.0
924
Dot product similarity: 0.22
ON
HN
N
O
Me

S25
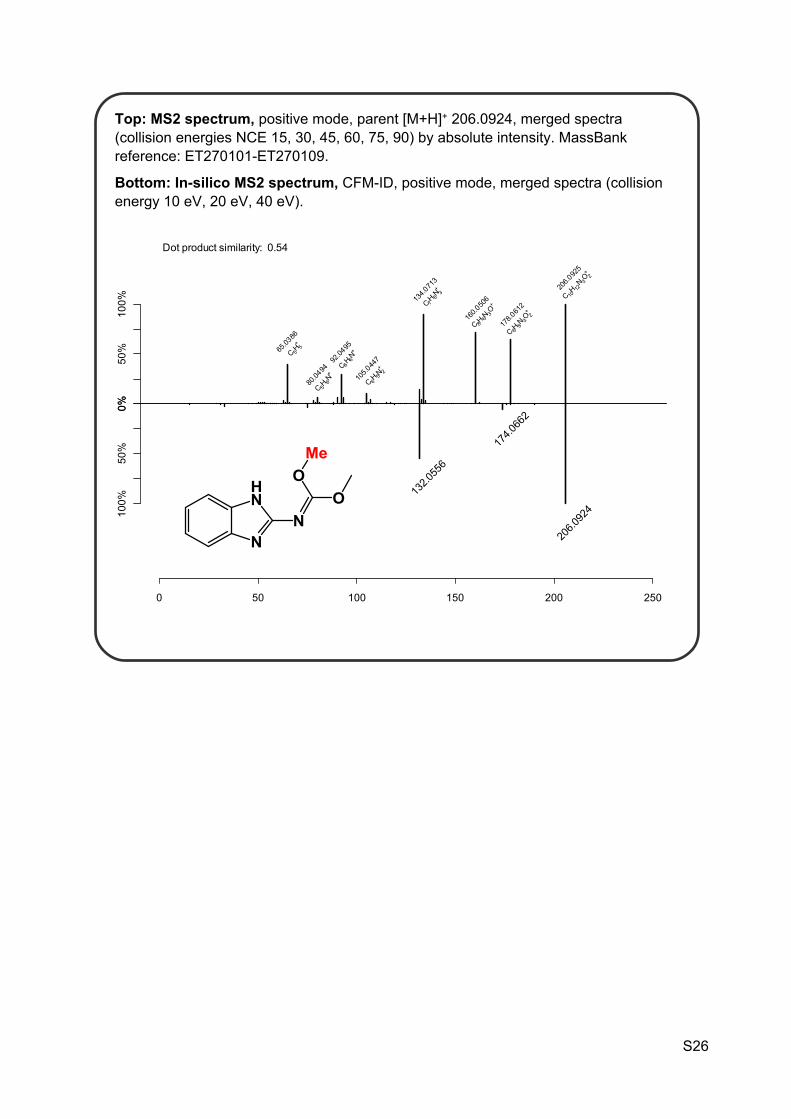
Top: MS2 spectrum, positive mode, parent [M+H]+ 206.0924, merged spectra (collision energies NCE 15, 30, 45, 60, 75, 90) by absolute intensity. MassBank reference: ET270101-ET270109.
Bottom: In-silico MS2 spectrum, CFM-ID, positive mode, merged spectra (collision energy 10 eV, 20 eV, 40 eV).
0 50 100 150 200 250
0%50
%10
0%
65.03
86
C 5H5
+
80.04
94
C 5H6N+
92.04
95
C6H6N+
105.0
447
C 6H5N 2+
134.0
713
C7H8N 3+
160.0
506
C 8H6N 3O
+
178.0
612
C 8H 8N3O
2+
206.0
925
C 10H 12
N 3O2
+
100%
50%
0%
33.03
35
59.01
2813
1.060
4
148.0
869
174.0
662
206.0
924
Dot product similarity: 0.39
ONH
N
N
OMe
S26
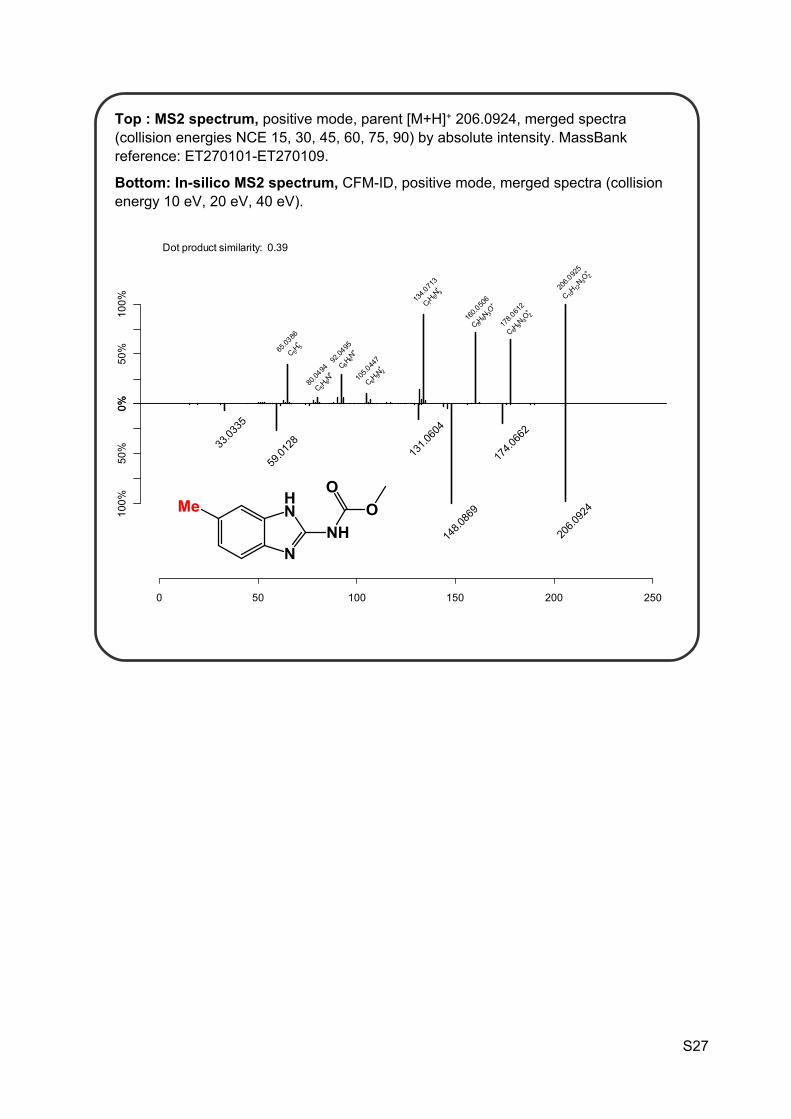
Top: MS2 spectrum, positive mode, parent [M+H]+ 206.0924, merged spectra (collision energies NCE 15, 30, 45, 60, 75, 90) by absolute intensity. MassBank reference: ET270101-ET270109.
Bottom: In-silico MS2 spectrum, CFM-ID, positive mode, merged spectra (collision energy 10 eV, 20 eV, 40 eV).
0 50 100 150 200 250
0%50
%10
0%
65.03
86
C 5H5
+
80.04
94
C 5H6N+
92.04
95
C6H6N+
105.0
447
C 6H5N 2+
134.0
713
C7H8N 3+
160.0
506
C 8H6N 3O
+
178.0
612
C 8H 8N3O
2+
206.0
925
C 10H 12
N 3O2
+
100%
50%
0%
132.0
556
174.0
662
206.0
924
Dot product similarity: 0.54
ON
HN
N
OMe
S27
Top : MS2 spectrum, positive mode, parent [M+H]+ 206.0924, merged spectra (collision energies NCE 15, 30, 45, 60, 75, 90) by absolute intensity. MassBank reference: ET270101-ET270109.
Bottom: In-silico MS2 spectrum, CFM-ID, positive mode, merged spectra (collision energy 10 eV, 20 eV, 40 eV).
0 50 100 150 200 250
0%50
%10
0%
65.03
86
C 5H5
+
80.04
94
C 5H6N+
92.04
95
C6H6N+
105.0
447
C 6H5N 2+
134.0
713
C7H8N 3+
160.0
506
C 8H6N 3O
+
178.0
612
C 8H 8N3O
2+
206.0
925
C 10H 12
N 3O2
+
100%
50%
0%
33.03
35
59.01
2813
1.060
4
148.0
869
174.0
662
206.0
924
Dot product similarity: 0.39
ONH
HN
N
OMe

S28
S3.4 Structure elucidation of SMZ-Pt
1
MS2 spectrum, positive mode, parent [M+H]+ 429.1090, merged spectra (collision energy NCE 15, 30, 45, 60, 75, 90, 120, 150, 180). Automated formula annotation (RMassBank) MassBank reference: ET310201-ET310209.
0 100 200 300 400
0%50
%10
0%
79.02
91
C4H 3N2
+10
8.055
4
C 5H6N 3+
124.0
505
C 5H6N3O
+
176.0
567
C7H6N
5O+
240.0
876
C 4H14N 7O
3S+
267.0
988
C 13H 11
N6O+
283.0
938
C 13H11
N 6O2
+
331.0
612
C 13H 11
N6O3S+
349.0
713
C 13H13
N 6O4S+
Proposed Structure (modification in red) and Fragmentation:
N O
HN
SO
O
NH
N
NHN
NH2N
O
S+
O
O
NH
N
NHN
NH2N
O
N
NHN
N+H2N
O
Chemical Formula: C7H6N5O+
Exact Mass: 176.0567
S+
O
O
NH
N
NHN
NH2N
O
Chemical Formula: C13H11N6O3S+
Exact Mass: 331.0608
CH+
N
N
NHN
NHN
O
H2O
Chemical Formula: C13H11N6O2+
Exact Mass: 283.0938
H2O
Chemical Formula: C13H13N6O4S+
Exact Mass: 349.0714
N
NHN
NHN
OH+
Chemical Formula: C13H11N6O+
Exact Mass: 267.0989
NH
CH+
N
N
N+H3N
-N
O
+
+H++
Chemical Formula: C17H17N8O4S+
Exact Mass: 429.1088
Chemical Formula: C12H10N5O+
Exact Mass: 240.0880
Confidence level: Level 2b
Additional evidence for structure interpretation:
Fragment 331.0612 corresponds to documented fragment 331.0606 as found by Richter et al.18
Note: Gas-phase addition of residual H2O to fragments has been documented e.g. for guanine and guanosine 19,20
8–20

S29
S3.5 Structure elucidation of SMZ-PtO
MS2 spectrum, positive mode, parent [M+H]+ 430.0930, merged spectra (collision energy NCE 15, 30, 45, 60, 75, 90, 120, 150, 180). Automated formula annotation (RMassBank). MassBank reference: ET310301-ET310309.
0 100 200 300 400
0%50
%10
0%
52.01
82
C 3H2N+ 79
.0291
C 4H3N 2+
106.0
4
C5H 4N3
+
124.0
506
C 5H6N
3O+
177.0
407
C 7H5N 4O
2+
195.0
513
C 7H7N 4O
3+
241.0
719
C 12H9N 4O
2+
268.0
829
C 13H 10
N5O2
+
284.0
778
C 13H 10
N5O3
+
350.0
552
C 13H 12
N 5O5S+
Proposed Structure (modification in red) and Fragmentation:
N O
HN
SO
O
NH
N
NHN
NH
O
O
S+
O
O
NH
N
NHN
NH
O
O
N
NHN
NHO
O
Chemical Formula: C7H5N4O2+
Exact Mass: 177.0407
S+
O
O
NH
N
NHN
NH
O
O
Chemical Formula: C13H10N5O4S+
Exact Mass: 332.0448
CH+
N
N
NHN
NO
O
H2O
Chemical Formula: C13H10N5O3+
Exact Mass: 284.0778
H2O
Chemical Formula: C13H12N5O5S+
Exact Mass: 350.0554
N
NHN
NO
OH+
Chemical Formula: C13H10N5O2+
Exact Mass: 268.0829
NH
+
+H++
Chemical Formula: C17H16N7O5S+
Exact Mass: 430.0928
CH+
N
N
NC+
-N
O
H2O+
Chemical Formula: C12H9N4O2+
Exact Mass: 241.0720
Confidence level: Level 3
Additional evidence for structure interpretation:
Compare to SMZ-Pt.
Note: Gas-phase addition of residual H2O to fragments has been documented e.g. for guanine and guanosine19,20

S30
S3.6 Structure elucidation of SMZ-AcOH
MS2 spectrum, positive mode, parent [M+H]+ 312.0649, collision energy NCE 30. Automated formula annotation (RMassBank). MassBank reference: ET310402.
0 100 200 300
0%25
%50
%75
%
59.04
91
C 3H7O+
89.05
97
C 4H9O 2+
106.0
651
C 7H8N+
151.0
628
C8H9NO 2+
166.0
5
C 8H8NO 3+
189.0
897
C 10H11
N 3O+
214.0
169
C8H8NO 4S
+
246.0
873
C 12H 12
N3O3
+
312.0
646
C 12H14
N 3O5S+
Proposed Structure (modification in red) and Fragmentation:
Confidence level: Level 3
Additional evidence for structure interpretation:
Does not coelute with an authentic standard of N4-hydroxyacetyl-sulfamethoxazole.
Peak 166.0500 corresponds to the peak 108.0444 in SMZ, which arises through rearrangement. SO2 loss rearrangements in analogy to SMZ. Peaks 151, 150 correspond to peaks 93, 92 in SMZ.

S31
S3.7 Structure elucidation of BEZ-da
MS2 spectrum, positive mode, parent [M+H]+ 276.0786, collision energy NCE 45. Automated formula annotation (RMassBank). MassBank reference: ET290103.
0 50 100 150
0%50
%10
0%
57.06
99
C 4H9
+
70.06
51
C 4H8N+ 88
.0757
C4H10NO
+
106.0
864
C4H12NO 2
+
121.0
648
C8H9O+ 13
8.994
6
C7H4ClO+
Proposed Structure (modification in red) and Fragmentation:
Confidence level: Level 2b
Additional evidence for structure interpretation:
Compare to BEZ (MassBank EA020909), fragments 138, 121.
Note: Spectrum is deconvoluted by RMassBank from co-fragmenting m/z 276.2803. m/z 57, 70, 88, 106 are likely ambiguous fragments incorrectly attributed to BEZ-da.

S32
S3.8 Structure elucidation of BEZ-M
MS2 spectrum, positive mode, parent [M+H]+ 376.1310, collision energy NCE 30. Automated formula annotation (RMassBank). MassBank reference: ET290202.
0 100 200 300
0%50
%10
0%
73.06
48
C 4H9O+
101.0
598
C 5H9O
2+
121.0
649
C8H9O+
138.9
946
C 7H4ClO+
161.0
962
C 11H 13
O+
204.1
147
C 13H 16
O 2+
222.1
252
C 13H 18
O 3+
276.0
787
C 15H 15
ClNO 2+
316.1
099
C 18H 19
ClNO 2+
Proposed Structure (modification in red) and Fragmentation:
Confidence level: Level 2b
Additional evidence for structure interpretation:
Compare to BEZ (MassBank EA020909), fragments 316, 276, 161, 138, 121 structurally shared, fragment 101 structurally specific to TP.

S33
S3.9 Structure elucidation of RAN-dm
Top : MS2 spectrum, positive mode, parent [M+H]+ 301.1329, collision energy NCE 30. Automated formula annotation (RMassBank). MassBank reference: ET300102.
Bottom: Library MS2 spectrum, ranitidine, [M+H]+ 315.1485, collision energy NCE 30. Automated formula annotation (RMassBank). MassBank reference: EA019603.
0 50 100 150 200 250 300 350
0%50
%10
0%
88.02
15
C3H6NS+
98.08
4
C 5H10N 2+
130.0
559
C5H 10N 2S
+
144.0
767
C5H10N 3O
2+
176.0
488
C 5H10N3O
2S+
196.9
925
C 9HN4S
+ 224.0
976
C 11H16
N 2OS+
100%
50%
0%
98.08
38
C5H10N 2+
124.0
756
C 7H10NO
+
130.0
559
C5H10N 2S
+144.0
767
C5H10N 3O
2+
176.0
488
C 5H 10N3O
2S+
191.1
178
C 11H15
N 2O+
224.0
977
C 11H 16
N 2OS+
270.0
904
C11H 16
N 3O3S+
315.1
491
C 13H 23
N 4O3S+
Dot product similarity: 0.96
Proposed Structure (modification in red) and Fragmentation:
Confidence level: Level 2b
Additional evidence for structure interpretation:
The loss of NHCH3 (m/z 270) is diagnostic for the mono-demethylation on the dimethyl-N. Fragment 176 is diagnostic for the retention of methyl on the monomethyl-N.

S34
S3.10Structure elucidation of MPL-dm
Top : MS2 spectrum, positive mode, parent [M+H]+ 254.1750, collision energy NCE 30. Automated formula annotation (RMassBank). MassBank reference: ET280102.
0 50 100 150 200 250 300
0%50
%10
0%
72.08
06
C 4H10N+
98.09
64
C 6H12N+
116.1
07
C 6H14NO
+17
7.090
9
C11H 13
O 2+
212.1
282
C 11H 18
NO 3+
254.1
751
C 14H 24
NO 3+
Proposed Structure (modification in red) and Fragmentation:
Confidence level: Level 2b
Additional evidence for structure interpretation:
Compare to MPL (MassBank EA017201..14)

S35
References1 R. R. L. Guillard and C. J. Lorenzen, J. Phycol., 1972, 8, 10–14.2 V. M. Markowitz, I.-M. A. Chen, K. Palaniappan, K. Chu, E. Szeto, M. Pillay, A. Ratner, J.
Huang, T. Woyke, M. Huntemann, I. Anderson, K. Billis, N. Varghese, K. Mavromatis, A. Pati, N. N. Ivanova and N. C. Kyrpides, Nucleic Acids Res., 2014, 42, D560–D567.
3 V. M. Markowitz, I.-M. A. Chen, K. Chu, E. Szeto, K. Palaniappan, M. Pillay, A. Ratner, J. Huang, I. Pagani, S. Tringe, M. Huntemann, K. Billis, N. Varghese, K. Tennessen, K. Mavromatis, A. Pati, N. N. Ivanova and N. C. Kyrpides, Nucleic Acids Res., 2014, 42, D568–D573.
4 K. A. Lewis, J. Tzilivakis, D. J. Warner and A. Green, Hum. Ecol. Risk Assess. Int. J., 2016, 22, 1050–1064.
5 D. S. Wishart, Nucleic Acids Res., 2006, 34, D668–D672.6 National Center for Biotechnology Information, .7 US EPA, Estimation Programs Interface SuiteTM for Microsoft® Windows, v 4.11, United
States Environmental Protection Agency, Washington, DC, USA., 2016.8 K. Harada, S. Imanishi, H. Kato, M. Mizuno, E. Ito and K. Tsuji, Toxicon, 2004, 44, 107–
109.9 F. Allen, R. Greiner and D. Wishart, Metabolomics, 2014, 11, 98–110.10 F. Allen, A. Pon, M. Wilson, R. Greiner and D. Wishart, Nucleic Acids Res., 2014, 42,
94–99.11 M. R. Bauerle, E. L. Schwalm and S. J. Booker, J. Biol. Chem., 2015, 290, 3995–4002.12 C. S. Boyer and D. R. Petersen, J. Pharmacol. Exp. Ther., 1992, 260, 939–946.13 S. Kern, R. Baumgartner, D. E. Helbling, J. Hollender, H. Singer, M. J. Loos, R. P.
Schwarzenbach and K. Fenner, J. Environ. Monit., 2010, 12, 2100–11.14 M. Skiba, M. Skiba-Lahiani, H. Marchais, R. Duclos and P. Arnaud, Int. J. Pharm., 2000,
198, 1–6.15 E. Rott, Schweiz. Z. Für Hydrol., 1981, 43, 34–62.16 C. S. Reynolds, Ecology of phytoplankton, Cambridge University Press, Cambridge; New
York, 2006.17 AstraZeneca, Environmental Risk Assessment Data: Atenolol, 2013.18 M. K. Richter, A. Focks, B. Siegfried, D. Rentsch, M. Krauss, R. P. Schwarzenbach and
J. Hollender, Environ. Pollut., 2013, 172, 208–15.19 R. Tuytten, F. Lemière, W. Dongen, E. L. Esmans, E. Witters, W. Herrebout, B. Veken,
E. Dudley and R. P. Newton, J. Am. Soc. Mass Spectrom., 2005, 16, 1291–1304.20 J. Sultan, Int. J. Mass Spectrom., 2008, 273, 58–68.