exploring binary and ternary modulations on a pa-lcos...
TRANSCRIPT

Exploring binary and ternary modulations on a PA-LCoS device for holographic data storage in
a PVA/AA photopolymer Francisco J. Martínez,1,2 Roberto Fernández,1,2 Andrés Márquez,1,2,* Sergi Gallego,1,2
Mariela L. Álvarez,1,2 Inmaculada Pascual,2,3 and Augusto Beléndez1,2 1Dept. de Física, Ing. de Sistemas y Teoría de la Señal, Univ. de Alicante, P.O. Box 99, E-03080, Alicante, Spain 2I.U. Física Aplicada a las Ciencias y las Tecnologías Univ. de Alicante, P.O. Box 99, E-03080, Alicante, Spain
3Dept. de Óptica, Farmacología y Anatomía, Univ. de Alicante, P.O. Box 99, E-03080, Alicante, Spain * [email protected]
Abstract: We focus on the novelty of three elements in holographic data storage systems (HDSS): the data pager, where we introduce a parallel-aligned liquid crystal on silicon (PA-LCoS) microdisplay; the recording material, where we consider the highly versatile PVA/AA photopolymer; and also in the architecture of the object arm, where a convergent correlator system is introduced. We show that PA-LCoS devices cannot implement pure hybrid-ternary modulated (HTM) data pages but a rather close approximation. Validation of the HDSS expressions for the convergent correlator and comparison with the widespread 4-f system is performed. Experimental results with PVA/AA material showing bit-error rates (BER) in the range of 10−3, further show its potential application for HDSS, and also demonstrate the validity of the testing platform and PA-LCoS calibration and optimization.
© 2015 Optical Society of America
OCIS codes: (090.2900) Optical storage materials; (210.2860) Holographic and volume memories; (230.3720) Liquid-crystal devices; (230.6120) Spatial light modulators.
References and links 1. P. J. Van Heerden, “Theory of optical information storage in solids,” Appl. Opt. 2(4), 393–400 (1963). 2. D. Sarid and B. H. Schechtman, “A roadmap for data storage applications,” Opt. Photonics News 18(5), 32–37
(2007). 3. H. J. Coufal, D. Psaltis, and B. T. Sincerbox, eds., Holographic Data Storage (Springer-Verlag, 2000). 4. K. Curtis, L. Dhar, A. Hill, W. Wilson, and M. Ayres, eds., Holographic Data Storage: From Theory to
Practical Systems (John Wiley & Sons, Ltd., 2010). 5. G. T. Sincerbox, “History and physical principles,” in Holographic Data Storage, H. Coufal, D. Psaltis and G. T.
Sincerbox, eds., (Springer-Verlag, 2000), pp. 3–20. 6. K.-I. Shimada, T. Ide, T. Shimano, K. Anderson, and K. Curtis, “New optical architecture for holographic data
storage system compatible with Blu-ray Disc™ system,” Opt. Eng. 53(2), 025102 (2014). 7. G. Lazarev, A. Hermerschmidt, S. Krüger, and S. Osten, “LCOS spatial light modulators: trends and
applications,” in Optical Imaging and Metrology: Advanced Technologies, W. Osten and N. Reingand, eds., (John Wiley & Sons, 2012).
8. J. Joseph and D. A. Waldman, “Homogenized Fourier transform holographic data storage using phase spatial light modulators and methods for recovery of data from the phase image,” Appl. Opt. 45(25), 6374–6380 (2006).
9. B. Das, J. Joseph, and K. Singh, “Phase modulated gray-scale data pages for digital holographic data storage,” Opt. Commun. 282(11), 2147–2154 (2009).
10. B. Das, J. Joseph, and K. Singh, “Material saturation in photopolymer holographic data recording and its effects on bit-error-rate and content-addressable search,” Opt. Commun. 282(2), 177–184 (2009).
11. E. Fernández, A. Márquez, M. Ortuño, R. Fuentes, C. García, and I. Pascual, “Optimization of twisted-nematic liquid crystal displays for holographic data storage,” Opt. Pura Apl. 42, 125–132 (2009).
12. M. J. O’Callaghan, “Sorting through the lore of phase mask options - performance measures and practical commercial designs,” Proc. SPIE 5362, 159 (2004).
13. B. Das, J. Joseph, and K. Singh, “Performance analysis of content-addressable search and bit-error rate characteristics of a defocused volume holographic data storage system,” Appl. Opt. 46(22), 5461–5470 (2007).
#240156 Received 1 May 2015; revised 30 Jun 2015; accepted 16 Jul 2015; published 28 Jul 2015 © 2015 OSA 10 Aug 2015 | Vol. 23, No. 16 | DOI:10.1364/OE.23.020459 | OPTICS EXPRESS 20459

14. J. S. Jang and D. H. Shin, “Optical representation of binary data based on both intensity and phase modulation with a twisted-nematic liquid-crystal display for holographic digital data storage,” Opt. Lett. 26(22), 1797–1799 (2001).
15. A. Márquez, S. Gallego, D. Méndez, M. L. Alvarez, E. Fernández, M. Ortuño, C. Neipp, A. Beléndez, and I.Pascual, “Accurate control of a liquid-crystal display to produce a homogenized Fourier transform for holographic memories,” Opt. Lett. 32(17), 2511–2513 (2007).
16. E. Fernandez, A. Marquez, S. Gallego, R. Fuentes, C. García, and I. Pascual, “Hybrid ternary modulation appliedto multiplexing holograms in photopolymers for data page storage,” J. Lightwave Technol. 28(5), 776–783(2010).
17. F. J. Martínez, A. Márquez, S. Gallego, J. Francés, I. Pascual, and A. Beléndez, “Retardance and flicker modeling and characterization of electro-optic linear retarders by averaged Stokes polarimetry,” Opt. Lett. 39(4), 1011–1014 (2014).
18. F. J. Martínez, A. Márquez, S. Gallego, M. Ortuño, J. Francés, A. Beléndez, and I. Pascual, “Averaged Stokes polarimetry applied to evaluate retardance and flicker in PA-LCoS devices,” Opt. Express 22(12), 15064–15074(2014).
19. J. W. Goodman, Introduction to Fourier Optics (McGraw-Hill, 1996). 20. A. VanderLugt, Optical Signal Processing (John Wiley & Sons, 1992). 21. A. Márquez, E. Fernández, F. J. Martínez, S. Gallego, M. Ortuño, A. Beléndez, and I. Pascual, “Analysis of the
geometry of a holographic memory setup,” Proc. SPIE 8429, 84291Y (2012).22. M. Schnoes, B. Ihas, A. Hill, L. Dhar, D. Michaels, S. Setthachayanon, G. Schomberger, and W. L. Wilson,
“Holographic data storage media for practical systems,” Proc. SPIE 5005, 29–37 (2003).23. A. Márquez, C. Neipp, A. Beléndez, S. Gallego, M. Ortuño, and I. Pascual, “Edge-enhanced imaging with
polyvinyl alcohol/acrylamide photopolymer gratings,” Opt. Lett. 28(17), 1510–1512 (2003).24. A. Márquez, S. Gallego, M. Ortuño, E. Fernández, M. L. Álvarez, A. Beléndez, and I. Pascual, “Generation of
diffractive optical elements onto a photopolymer using a liquid crystal display,” Proc. SPIE 7717, 77170D(2010).
25. E. Fernández, M. Ortuño, S. Gallego, C. García, A. Beléndez, and I. Pascual, “Comparison of peristrophicmultiplexing and a combination of angular and peristrophic holographic multiplexing in a thick PVA/acrylamide photopolymer for data storage,” Appl. Opt. 46(22), 5368–5373 (2007).
26. H. Sherif, I. Naydenova, S. Martin, C. McGinn, and V. Toal, “Characterisation of an acrylamide-based photopolymer for data storage utilizing holographic angular multiplexing,” J. Opt. A, Pure Appl. Opt. 7(5), 255–260 (2005).
27. Z. Ushiyama, H. Kurata, Y. Tsukamoto, S. Yoshida, and M. Yamamoto, “Shift-peristrophic multiplexing for high density holographic data storage,” Appl. Sci. 4(2), 148–157 (2014).
28. A. Hermerschmidt, S. Osten, S. Krüger, and T. Blümel, “Wave front generation using a phase-only modulating liquid-crystalbased micro-display with HDTV resolution,” Proc. SPIE 6584, 65840E (2007).
29. J. R. Moore, N. Collings, W. A. Crossland, A. B. Davey, M. Evans, A. M. Jeziorska, M. Komarčević, R. J. Parker, T. D. Wilkinson, and H. Xu, “The silicon backplane design for an LCOS polarization-insensitive phase hologram SLM,” IEEE Photonics Technol. Lett. 20(1), 60–62 (2008).
30. F. J. Martínez, A. Márquez, S. Gallego, M. Ortuño, J. Francés, A. Beléndez, and I. Pascual, “Electrical dependencies of optical modulation capabilities in digitally addressed parallel aligned liquid crystal on silicon devices,” Opt. Eng. 53, 067104 (2014).
31. A. Márquez, S. Gallego, D. Méndez, M. L. Álvarez, E. Fernández, M. Ortuño, A. Beléndez, and I. Pascual, “Characterization and optimization of liquid crystal displays for data storage applications,” Proc. SPIE 6587, 658715 (2007).
32. Z. Zhang, G. Lu, and F. T. S. Yu, “Simple method for measuring phase modulation in liquid crystal television,” Opt. Eng. 33(9), 3018–3022 (1994).
33. A. Márquez, C. Iemmi, I. Moreno, J. Campos, and M. Yzuel, “Anamorphic and spatial frequency dependent phase modulation on liquid crystal displays. Optimization of the modulation diffraction efficiency,” Opt. Express 13(6), 2111–2119 (2005).
34. F. J. Martínez, A. Márquez, S. Gallego, M. Ortuño, J. Francés, I. Pascual, and A. Beléndez, “Predictive capability of average Stokes polarimetry for simulation of phase multilevel elements onto LCoS devices,” Appl.Opt. 54(6), 1379–1386 (2015).
35. G. P. Agrawal, Fiber-Optic Communication Systems (John Wiley & Sons, 2010). 36. S. Gallego, A. Márquez, S. Marini, E. Fernández, M. Ortuño, and I. Pascual, “In dark analysis of PVA/AA
materials at very low spatial frequencies: phase modulation evolution and diffusion estimation,” Opt. Express 17(20), 18279–18291 (2009).
1. Introduction
Holographic data storage systems (HDSS) have been a promising and very appealing technology since the first laser developments in the sixties [1], enabling true 3-D storage of information and also associative memory retrieval [2]. Many scientific and engineering aspects need to be addressed for HDSS to be viable in the commercial arena as reported in the
#240156 Received 1 May 2015; revised 30 Jun 2015; accepted 16 Jul 2015; published 28 Jul 2015 © 2015 OSA 10 Aug 2015 | Vol. 23, No. 16 | DOI:10.1364/OE.23.020459 | OPTICS EXPRESS 20460
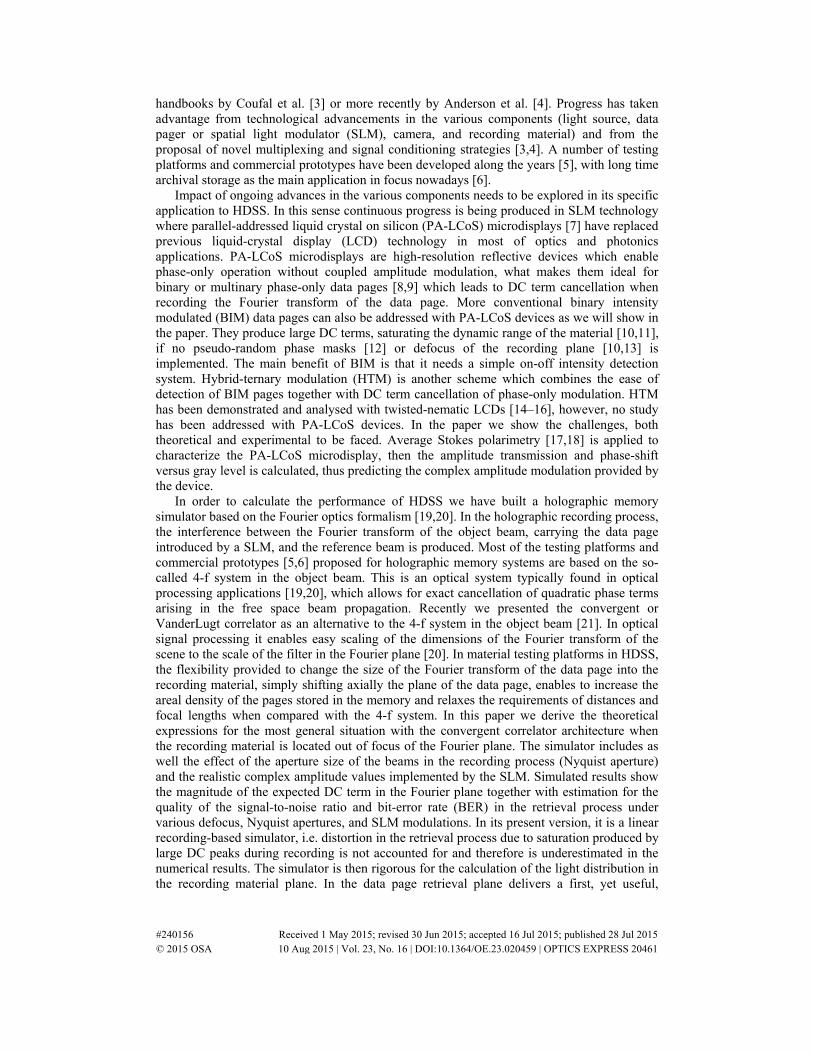
handbooks by Coufal et al. [3] or more recently by Anderson et al. [4]. Progress has taken advantage from technological advancements in the various components (light source, data pager or spatial light modulator (SLM), camera, and recording material) and from the proposal of novel multiplexing and signal conditioning strategies [3,4]. A number of testing platforms and commercial prototypes have been developed along the years [5], with long time archival storage as the main application in focus nowadays [6].
Impact of ongoing advances in the various components needs to be explored in its specific application to HDSS. In this sense continuous progress is being produced in SLM technology where parallel-addressed liquid crystal on silicon (PA-LCoS) microdisplays [7] have replaced previous liquid-crystal display (LCD) technology in most of optics and photonics applications. PA-LCoS microdisplays are high-resolution reflective devices which enable phase-only operation without coupled amplitude modulation, what makes them ideal for binary or multinary phase-only data pages [8,9] which leads to DC term cancellation when recording the Fourier transform of the data page. More conventional binary intensity modulated (BIM) data pages can also be addressed with PA-LCoS devices as we will show in the paper. They produce large DC terms, saturating the dynamic range of the material [10,11], if no pseudo-random phase masks [12] or defocus of the recording plane [10,13] is implemented. The main benefit of BIM is that it needs a simple on-off intensity detection system. Hybrid-ternary modulation (HTM) is another scheme which combines the ease of detection of BIM pages together with DC term cancellation of phase-only modulation. HTM has been demonstrated and analysed with twisted-nematic LCDs [14–16], however, no study has been addressed with PA-LCoS devices. In the paper we show the challenges, both theoretical and experimental to be faced. Average Stokes polarimetry [17,18] is applied to characterize the PA-LCoS microdisplay, then the amplitude transmission and phase-shift versus gray level is calculated, thus predicting the complex amplitude modulation provided by the device.
In order to calculate the performance of HDSS we have built a holographic memory simulator based on the Fourier optics formalism [19,20]. In the holographic recording process, the interference between the Fourier transform of the object beam, carrying the data page introduced by a SLM, and the reference beam is produced. Most of the testing platforms and commercial prototypes [5,6] proposed for holographic memory systems are based on the so-called 4-f system in the object beam. This is an optical system typically found in optical processing applications [19,20], which allows for exact cancellation of quadratic phase terms arising in the free space beam propagation. Recently we presented the convergent or VanderLugt correlator as an alternative to the 4-f system in the object beam [21]. In optical signal processing it enables easy scaling of the dimensions of the Fourier transform of the scene to the scale of the filter in the Fourier plane [20]. In material testing platforms in HDSS, the flexibility provided to change the size of the Fourier transform of the data page into the recording material, simply shifting axially the plane of the data page, enables to increase the areal density of the pages stored in the memory and relaxes the requirements of distances and focal lengths when compared with the 4-f system. In this paper we derive the theoretical expressions for the most general situation with the convergent correlator architecture when the recording material is located out of focus of the Fourier plane. The simulator includes as well the effect of the aperture size of the beams in the recording process (Nyquist aperture) and the realistic complex amplitude values implemented by the SLM. Simulated results show the magnitude of the expected DC term in the Fourier plane together with estimation for the quality of the signal-to-noise ratio and bit-error rate (BER) in the retrieval process under various defocus, Nyquist apertures, and SLM modulations. In its present version, it is a linear recording-based simulator, i.e. distortion in the retrieval process due to saturation produced by large DC peaks during recording is not accounted for and therefore is underestimated in the numerical results. The simulator is then rigorous for the calculation of the light distribution in the recording material plane. In the data page retrieval plane delivers a first, yet useful,
#240156 Received 1 May 2015; revised 30 Jun 2015; accepted 16 Jul 2015; published 28 Jul 2015 © 2015 OSA 10 Aug 2015 | Vol. 23, No. 16 | DOI:10.1364/OE.23.020459 | OPTICS EXPRESS 20461

approximation since it enables for deeper understanding of the performance of the experimental setup and the modulations implemented onto the PA-LCoS device and a first approximation of the performance of the material at reconstruction.
One of the most demanding components in HDSS is the recording material [22]. Photopolymers are the typical material of choice for write-once read-many (WORM) applications such as long time archival storage. Among photopolymers, polyvinil alcohol/acrylamide (PVA/AA) materials have been long studied for a wide range of applications, such as holographic and diffractive applications [23,24] and also in HDSS [25,26], since they combine good optical properties, ease of fabrication, self-development capability and they offer the capability to establish thick recording layers [25]. There are some studies about the capability of this material to multiplex many holograms, diffraction gratings, and to calculate the dynamic range of the material with promising results [25,26]. Nevertheless few efforts have been done in order to optimize this material for holographic memories [27]. We will introduce a PVA/AA photopolymer compound in the holographic memory testing platform to provide experimental results for storage and retrieval of information both with the BIM and the HTM data pages, showing its potential and interest for future research focused on this material with highly tunable properties.
In Section 2 we will develop the necessary expression for the recording and reconstruction steps with the convergent correlator architecture in the object beam. These expressions incorporate the Nyquist aperture and defocus of the material with respect to the Fourier transform of the data page. These expressions are then used in the holographic memory simulator we build to simulate the system performance. In Section 3, we focus on the calculation of the binary intensity and hybrid-ternary modulation regimes with a PA-LCoS device, to be used in HDSS. Numerical and experimental results are presented in Section 4, where a PVA/AA photopolymer is used as the recording material. Eventually, main conclusions are summarized in Section 5. An Appendix is added at the end to accompany the theoretical derivations in Section 2.
2. HDSS simulator with defocus based on the convergent correlator architecture
Recently we proposed [21] the use of the convergent correlator architecture for the object beam instead of the traditional 4-f system typically used in HDSS. It is an interesting alternative providing a larger range of flexibility in the design of HDSS testing platforms. We derived the theoretical expressions for the specific situation when the recording material is located on the Fourier plane for the data page. In the theoretical expressions we found that when compared with the 4-f system, a quadratic phase term emerges which can be disregarded if the data page is not codified as phase-only. Further, the scales in the various planes were obtained. Then, in the analysis in [21] we obtained a detailed validation of its utility. In this paper we calculate the most general case when the material is out of focus of the Fourier plane, which includes as a particular case the derivation in [21]. Next we present the main theoretical results in the body of the paper, leaving for the Appendix the identities and properties used in this derivation.
In Fig. 1 we show the generic scheme for the holographic memory system that we want to model and the names for the various magnitudes and variables. In the recording step the reference beam and the object beam interfere onto the holographic recording material. The object beam setup corresponds to a convergent correlator architecture where the data page on the SLM is illuminated with a converging beam produced by lens L1. The recording material is located a distance zΔ out of focus of the plane where this beam converges. We will see that at this plane we obtain the defocused Fourier transform of the data page. In the reconstruction step, the object beam is blocked and only the reference beam is used to illuminate the material. The diffracted beam from the material is then Fourier transformed by lens L2 onto the CCD plane. In the figure the basic components in the system are shown: beam-splitter, spatial filters, mirror, lenses, spatial light modulator, storage material, and CMOS/CCD
#240156 Received 1 May 2015; revised 30 Jun 2015; accepted 16 Jul 2015; published 28 Jul 2015 © 2015 OSA 10 Aug 2015 | Vol. 23, No. 16 | DOI:10.1364/OE.23.020459 | OPTICS EXPRESS 20462

cameras. Even though it is not indicated in the figure, we also take into account the placement of a diaphragm to limit the beam aperture incident onto the material, the so called Nyquist aperture [13], thus limiting the total area where actual recording of a data page takes place thus increasing the areal density of stored information.
Fig. 1. Scheme for the experimental setup we model in this work where the various elements and also the names for the magnitudes and variables are introduced.
Let us first deduce the theoretical expression describing the information stored in the material in the recording step. For the reference beam, we consider a plane wavefront, given
by ( )exp refj k r⋅
, where r
is the position vector of a point in the wavefront in a certain
reference system, and refk
is the wave vector indicating the direction and propagation sense
for the plane wavefront. We name the object beam incident onto the material as ( )3 3 3f x , y .
Therefore, onto the material we obtain the interference between both wavefronts. In the paper we consider the ideal situation where a linear recording of the interference pattern is produced onto the material, i.e. a linear recording-based model is applied. This enables to analyse the validity of the introduction of the convergent correlator instead of the 4-f system and it is a first approximation to the material performance. Experimental results are then necessary, as we will do in Section 4, to provide a more exact evaluation of the various elements under combined investigation in the paper: system architecture, PA-LCoS applicability to BIM and HTM codifications, and realistic performance of PVA/AA photopolymer to HDSS.
To calculate the expression for ( )3 3 3f x , y we take into account free-space propagation in
the Fresnel approximation of the wavefront (see Appendix) along distances 1z , 2z and
3 3'z z z= + Δ , and transmission through lens L1 of focal length 1f , which introduces a
quadratic phase onto the wavefront (see Appendix). Apart from some constant factor, the propagation from plane O to O’ can be expressed as the following sequence of convolutions,
( ) *3 3 3 1 1 1 1 1 1 2 2 2 2 2 3 3 3( , )f x , y = (x , y ;Z ) (x , y ;F ) (x , y ;Z ) f x y (x , y ;Z ).ψ ψ ψ ′ ⊗ ⊗ (1)
where ( )2 2f x , y corresponds to the data page displayed onto the SLM and ⊗ indicates
convolution. To ease development of the expressions we apply notation described in the Appendix for quadratic phase terms as 1 2 2exp( ( ) / )-(x, y;Z = z ) j Z x yψ π λ≡ + , where λ is
the wavelength used in the illumination. This enables to apply the properties presented by A. VanderLugt [20], summarized in the Appendix, which provide the following result,
#240156 Received 1 May 2015; revised 30 Jun 2015; accepted 16 Jul 2015; published 28 Jul 2015 © 2015 OSA 10 Aug 2015 | Vol. 23, No. 16 | DOI:10.1364/OE.23.020459 | OPTICS EXPRESS 20463

( ) ( ) ( )2
23 3 3 3 3 3 2 2 2 3 2 2 3 2 3 2 2 2
1 2 1 32
2; ' ; ' exp
P
Z j f (x , y )= (x , y Z ) (x , y Z Z )f x , y x x y y dx dy
Z Z F z z
πψ ψλ
−+ − + + − + Δ
(2) This is the defocused Fourier transform of the data page ( )2 2f x , y . The derivation
process is very similar to the one shown for the non-defocus case in [21], where the sequence followed to apply the properties 3, 4, 6 and 9 in the Appendix can be viewed. If the plane for the material O’ is defocused with respect to the conjugate for plane O, then 0zΔ ≠ and if
3z zΔ << , then the quadratic term inside the integral in Eq. (2) can be simplified as
( )( )* 2 2 2 22 2 3 2 2 3; exp / ( )(x , y z Z ) j z x + y zψ π λΔ = − Δ . We will show next how to rewrite this
term as a function of the defocus term 20W , which is the notation typically used in analysis
and modeling of optical systems. This is very interesting since 20W provides an invariant
parameter not dependent on the specific distances of a certain system. We note that this is not the notation found in HDSS literature and it is a novel approach that we develop in the paper. To this goal first we need to normalize the aperture coordinates by the total aperture R of the system, i.e. 2 2 2 2( , ) ( , ) /N Nx y x y R= . Then, if the quadratic term is now compared with the
generic expression for the defocus term 20W ,
( ) ( )( )2
2 2 2 22 2 20 2 22
3
exp exp 2N N N N
zRj x + y j W x + y
z
π πλ
Δ− = −
(3)
, then we obtain the relation between the invariant parameter 20W and the magnitudes for the
specific parameters in the experiment,
( )2
20 2W z NA λ= Δ (4)
where 3/NA R z= corresponds to the numerical aperture for the system. Then, Eq. (2) can be
expressed as.
( )( ) ( )( ) ( )
3 3
3 3
2 23 3 3 3 3 3 20 2 2 2 2
,; ' exp 2 N N N N R x R y
u vz z z z
f (x , y )= (x , y Z )FT j W x + y f Rx ,Ryλ λ
ψ π= =
+Δ +Δ
−
(5) Additionally, we consider the insertion of a stop ( )3 3 3p x , y , also called Nyquist aperture,
in front of the material, to limit the extent of the area used. Then what is actually registered is the product ( ) ( )3 3 3 3 3 3f x , y p x , y . Then, in Eq. (5) we observe two differences with respect to
the 4-f system: the quadratic phase term 3 3 3; '(x , y Z )ψ , which shifts the exit plane if the
optical system continues after plane P3; the scale of the Fourier transform can be adjusted, thus the areal density, simply changing distance 3z . We note that the present derivation is
valid independent of the codification (binary intensity, binary phase, hybrid ternary modulation,…) considered for the data page.
Let us now analyse the reconstruction step, where we consider that the recording material is illuminated by the reference beam and is able to diffract the recorded wavefront described by ( ) ( )3 3 3 3 3 3f x , y p x , y . We calculate the result obtained in the final plane P5 (Fig. 1), where
the camera is located. The sequence followed by the wavefront from plane P3 to plane P5 can be expressed, dropping constant factors, as follows,
#240156 Received 1 May 2015; revised 30 Jun 2015; accepted 16 Jul 2015; published 28 Jul 2015 © 2015 OSA 10 Aug 2015 | Vol. 23, No. 16 | DOI:10.1364/OE.23.020459 | OPTICS EXPRESS 20464

( ) ( ) ( ) *5 5 5 3 3 3 3 3 3 4 4 4 4 4 4 5 5 5f x , y = f x , y P x , y (x , y ;Z ) (x , y ;F ) (x , y ;Z )ψ ψ ψ ⊗ ⊗ (6)
In the case when the SLM and CCD planes, i.e. planes P2 and P5, are conjugate with each other, i.e.
( )( )23 4 4 4 5 2 0Z Z Z Z Z F+ − + − = (7)
, and applying various properties (3, 4, 6 and 9) in the Appendix then we obtain,
( ) ( )2
* 255 5 5 5 5 5 3 3
4 5 2 3 3 3 3 ,
; ;' ' ' '
u v
Z u v u vf x , y (x , y Z ) ( , z Z )f , P u,v
Z Z F Z Z Z Z
λ λ λ λψ ψ − − = − Δ ⊗ + −
(8)
where ( )3P u,v is the Fourier Transform of 3 3 3p (x , y ) and the scale is given by,
( ) ( )4 5 5 4 5 5
4 5 2 4 5 2,
Z Z x Z Z yu v
Z Z F Z Z Fλ λ= =+ − + − (9)
The quadratic phase factor dependent on 5 5(x , y ) in Eq. (8) does not appear in a 4-f
system. It may be dropped when only the amplitude of the wavefront is of interest as it is normally the case. If the data page is codified as a phase-only function, e.g. binary or multinary phase [8,9], then, depending on the detection method used in plane P5, we may have to leave the quadratic phase term. In the ideal case of infinite aperture, 3 3 3 1p (x , y ) = ,
then ( ) ( )3P u,v u,vδ= , which is the delta Dirac function, and convolution in Eq. (8) reduces
to
( )5 5 53 3 ,' '
u v
u vf x , y f ,
Z Z
λ λ − −=
(10)
, where we have dropped both the quadratic phase factor dependent on 5 5(x , y ) and the one
dependent of the defocus distance zΔ . As just said this is possible when only the amplitude of the wavefront is of interest. The result in Eq. (10) corresponds to the magnified and inverted image of the data page given by lens L2 in plane P2. If the aperture 3 3 3p (x , y ) is finite, what
we have in Eq. (8) is that ( )3P u,v widens and therefore the convolution smoothes the data
page which is also multiplied by the defocus quadratic phase term. The edges of the bits in the data page are then blurred increasing the probability of wrong detection of 1s and 0s. We then see that the convergent correlator architecture allows obtaining the reconstructed signal as in the case of the 4-f system. Differences may arise if the data page is introduced as a non-amplitude-only function, since in this case there is a resultant quadratic phase factor dependent on 5 5(x , y ) which does not appear in the 4-f system.
Function 3 3 3p (x , y ) acts as a low-pass filter in the frequency domain whose aperture
defines the cutoff frequency. In this sense, since the data page contains binary information, we have that its fundamental frequency, or Nyquist frequency, is produced at a distance
3 / 2NR z dλ= , or Nyquist radius, in the plane P3, where d corresponds to the size of the bits
in the data page. Then the radius of function 3 3 3p (x , y ) must be at least equal to the Nyquist
radius not to produce too much cross-talk between neighboring bits [12]. In Section 4 we will show some numerical results where this will become clearer. We will perform simulations, with a varying degree of defocus and we will see how robust the codifications BIM and HTM remain and for various Nyquist aperture sizes. As it has been said, the HDSS simulator presented in this Section does not take into account saturation effects and non-linearities in
#240156 Received 1 May 2015; revised 30 Jun 2015; accepted 16 Jul 2015; published 28 Jul 2015 © 2015 OSA 10 Aug 2015 | Vol. 23, No. 16 | DOI:10.1364/OE.23.020459 | OPTICS EXPRESS 20465
the recording material. This is useful to isolate the distortion effects due to low pass filtering from the Nyquist aperture and defocus. They are then the only phenomena, together with the PA-LCoS codifications, influencing the fidelity in the retrieved data page in the simulations. Then, the experimental results with a real material are necessary to complement the numerical evaluation of the system architecture and PA-LCoS codifications.
3. Modulation curves for HDSS with a PA-LCoS microdisplay
Our aim is to construct a holographic data storage testing platform based on the convergent correlator architecture for the object beam, and where the data page is introduced by a PA-LCoS microdisplay. These devices are well adapted to display phase-only elements since they enable phase-only modulation without coupled amplitude. This can be achieved when illuminated by linearly polarized light parallel to the director axis. In the paper, we investigate that PA-LCoS devices can also be used to display the widely applied BIM data pages. We also investigate HTM data pages, which are very much demanding on the phase and amplitude modulation properties of an SLM and which have not yet been studied with PA-LCoS devices. HTM data pages combine the ease of detection of BIM data pages, together with the large reduction of the DC term of the Fourier Transform of the data page possible with phase-only data pages. This is necessary to avoid saturation of the dynamic range of the recording material [10,15,16].
To analyse the modulation capabilities of PA-LCoS devices, we use the model and characterization technique that we presented in [17,18]. These devices can be considered as pixilated waveplates whose linear retardance can be tuned by the voltage applied. The technique we demonstrated, the time average Stokes polarimetry, enables to obtain not only the retardance versus applied voltage but also its flicker amplitude, which is exhibited by a number of LCoS microdisplays [28,29], especially the ones digitally addressed [30]. Then, first we calibrate the linear retardance, and then we use these values to calculate the complex amplitude modulation of the PA-LCoS device inserted between external polarization elements (polarizers and/or waveplates). In all these modeling and calculations in the paper, we apply the Jones formalism for polarization, since it enables calculation of both the amplitude and phase-shift. In previous papers, where the interest was to calculate the state of polarization (SOP) and the degree of polarization (DoP), we employed the Mueller-Stokes formalism.
Next, we provide the basic expressions necessary for the complex amplitude calculations in the Jones matrix formalism. The basic elements are the matrices for linear polarizer and linear retarder, the former given by,
1 0
0 0XP
=
(11)
which expresses the linear polarizer with its transmission axis along the X-axis, which we consider along the vertical of the lab. The matrix for a linear retarder of linear retardance φ
with its slow axis along the X-axis in the reference system is given by,
( ) ( )( )
exp 2 0
0 exp 2
jW
j
φφ
φ −
= + (12)
When polarization elements are rotated an angle θ with respect to the X-axis, then the two dimensional rotation matrix is necessary,
( ) cos sin
sin cosR
θ θθ
θ θ
= − (13)
#240156 Received 1 May 2015; revised 30 Jun 2015; accepted 16 Jul 2015; published 28 Jul 2015 © 2015 OSA 10 Aug 2015 | Vol. 23, No. 16 | DOI:10.1364/OE.23.020459 | OPTICS EXPRESS 20466

The basic configuration that we need to produce both BIM or HTM is with the PA-LCoS device inserted between two rotated linear polarizers at angles 1θ and 2θ , i.e. the complex
amplitude for the electric field OUTE
at the output of the system is given by the following
sequence,
( ) ( ) 12
1
cos1 0
sin0 1OUT X PAE P R Wθ
θθ
= ⋅ ⋅ ⋅ Γ ⋅ −
(14)
, where OUTE
corresponds to linearly polarized light at an angle 2θ with respect to the X-axis.
Since PA-LCoS displays are reflective devices, the inversion matrix in Eq. (14) is introduced so that both the forward and the backward reference systems are right-handed. In the
expression ( )PAW Γ is the matrix for the PA-LCoS device, which is given by Eq. (12), and
whose retardance Γ varies with the applied voltage ( )VΓ . The retardance value that we
consider is the average value measured with the average Stokes polarimetric technique. Its flicker amplitude will not be considered in the calculations: in the calibration we have taken care to select electrical configurations minimizing the existence of this flicker in the
retardance [18,30]. The intensity transmission OUTI is given by the hermitic product of OUTE
and the phase-shift OUTϕ corresponds to the argument. Then, once a certain working
configuration is selected for the PA-LCoS device, i.e. ( )VΓ is fixed, we can optimize in the
computer the angles 1θ and 2θ to produce the best BIM and HTM regimes.
The specific PA-LCoS device considered in this work is a commercially available PA-LCoS microdisplay, model PLUTO distributed by the company HOLOEYE. It is filled with a nematic liquid crystal, with 1920x1080 pixels and 0.7” diagonal. The pixel pitch is of 8.0 μm and the display has a fill factor of 87%. The signal is addressed via a standard DVI (Digital Visual Interface) signal. By means of the RS-232 interface and its corresponding provided software, we have access to the basic electrical parameters of the device [28,29], such as the digital addressing sequence format, the gamma curve, and the voltage dynamic range of the pulse width modulated (PWM) signal (through two digital potentiometers), i.e. the so-called voltages Vbright and Vdark, expressing the maximum and minimum amplitudes of the pulsed voltage applied across the LC layer. In particular the software for the SLM is provided with a series of configuration files corresponding to two different digital addressing sequences: the so-called 18-6 and 5-5 digital sequences. The first number indicates the quantity of “equally weighted” bit-planes, and the second number the quantity of “binary” bit-planes [28]. This means that the sequence 18-6 is longer than the one corresponding for the sequence 5-5. In principle the shorter the sequence the smaller the flicker [28] thus in the following we restrict our attention to sequence 5-5 since it produces less flicker.
Retardance measurements have been taken at an angle of incidence of 11.5°, i.e. we consider no beam-splitter in front of the SLM, and for the wavelength 532 nm, to which the PVA/AA photopolymer is sensitized. These are the working conditions of the PA-LCoS device in the HDSS setup that we will present in Section 4. The PA-LCoS device is addressed with two different electrical configurations adapted in each case for the retardance dynamic range necessary for BIM and for HTM and minimizing the possibility of flicker. In [30] we introduced how to adapt the electrical configuration as a function of the application. In this sense we consider different pair of values for the configuration voltages Vbright and Vdark: for BIM and for HTM they are respectively (Vbright = 2.02V, Vdark = 1.11V) and (Vbright = 3.82V, Vdark = 0.03V). These values enable to produce a π radians retardance range for BIM, which is enough to generate an amplitude transmission configuration with minimum and maximum intensity transmission values for the specified wavelength. In the case of HTM, we consider
#240156 Received 1 May 2015; revised 30 Jun 2015; accepted 16 Jul 2015; published 28 Jul 2015 © 2015 OSA 10 Aug 2015 | Vol. 23, No. 16 | DOI:10.1364/OE.23.020459 | OPTICS EXPRESS 20467

voltages producing a larger retardance range, close to 2π radians, since we not only need a low and high transmission intensity values, but we also need two equally high transmission intensity points with a relative phase-shift difference as close to π radians as possible. In the case of twisted-nematic LCDs [15,31] we showed that these conditions were better met if the modulation dynamic range available is increased. In this Section we will analyse if this is still the case with PA-LCoS devices.
In Fig. 2 we show the retardance (left axis) and flicker amplitude (right axis) measurements as a function of gray level obtained applying the time-average Stokes polarimetric technique [17,18] for both the BIM and HTM adapted electrical configurations. In the case of the BIM (continuous curves) the retardance range is slightly larger than 180° and the associated flicker amplitude is about 10°, which is a low value, in most of the range. For the HTM (dashed curves) the retardance range is larger than 360° and the flicker amplitude reaches values close to 40°, even though only at high gray levels.
Fig. 2. Calculated values for the average retardance and the fluctuation amplitude for λ = 532nm, at an angle of incidence of 11.5°, for sequence 5-5 with configuration voltages (Vbright = 2.02V, Vdark = 1.11V) for BIM (continuous) and (Vbright = 3.82V, Vdark = 0.03V) for HTM (dashed).
In the case of BIM the goal is to generate the maximum intensity contrast between the ON and OFF values, i.e. contrast ON OFFI I I= . In [12] O’Callaghan calculates that an acceptable raw
BER can be obtained with a contrast of 1:20, even though the system performance can be further improved for higher contrast values. Maximum contrast can be obtained with only polarizers, if they are parallel or crossed with each other and at 45° with respect to the director axis of the PA-LCoS device. Using the average retardance values ( )VΓ characterized in Fig.
2, and for polarizers and at −45° ( + 45°) with respect to the director axis (lab vertical) in the PA-LCoS (which is along the lab horizontal) we obtain the intensity transmission and phase-shift curves as a function of the gray level displayed in Fig. 3(a), which are also plotted in Fig. 3(b) as a phasor representation in the complex plane.
From Fig. 3(a) the low and high intensity transmission points occur respectively at gray levels 12 and 239. From the values in Fig. 3(a), we obtain that the theoretical contrast contrastI
tends to infinity, and the phase–shift values are respectively 270° and 360°. We note that at these two gray levels, from Fig. 2 the modulus-2π retardance values are respectively very close to 0° and 180°: thus, at these two gray levels the PA-LCoS behaves respectively as a zero-wave plate and as a half-wave plate, thus the SOP is orthogonal and parallel respectively to the transmission axis of the output polarizer. In the experimental measurements we obtain that the low and high transmission points occur slightly displaced at gray levels 14 and 248, and the contrast we measure is about 1:50. The theoretical contrast value is idealistic since the various degradation effects in the PA-LCoS have a direct impact in the minimum intensity transmission value: e.g. inhomogeneities across the aperture of the PA-LCoS and the flicker will produce a spatial and time fluctuation of the retardance from its average value and as a
#240156 Received 1 May 2015; revised 30 Jun 2015; accepted 16 Jul 2015; published 28 Jul 2015 © 2015 OSA 10 Aug 2015 | Vol. 23, No. 16 | DOI:10.1364/OE.23.020459 | OPTICS EXPRESS 20468
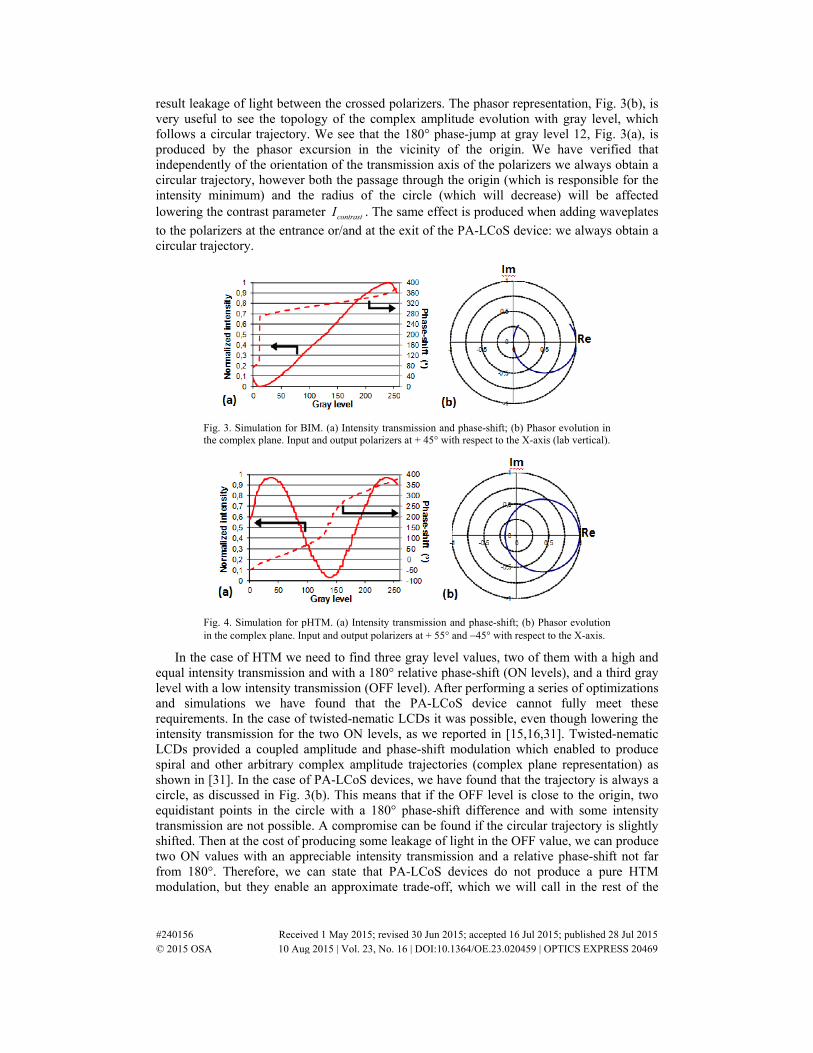
result leakage of light between the crossed polarizers. The phasor representation, Fig. 3(b), is very useful to see the topology of the complex amplitude evolution with gray level, which follows a circular trajectory. We see that the 180° phase-jump at gray level 12, Fig. 3(a), is produced by the phasor excursion in the vicinity of the origin. We have verified that independently of the orientation of the transmission axis of the polarizers we always obtain a circular trajectory, however both the passage through the origin (which is responsible for the intensity minimum) and the radius of the circle (which will decrease) will be affected lowering the contrast parameter contrastI . The same effect is produced when adding waveplates
to the polarizers at the entrance or/and at the exit of the PA-LCoS device: we always obtain a circular trajectory.
Fig. 3. Simulation for BIM. (a) Intensity transmission and phase-shift; (b) Phasor evolution in the complex plane. Input and output polarizers at + 45° with respect to the X-axis (lab vertical).
Fig. 4. Simulation for pHTM. (a) Intensity transmission and phase-shift; (b) Phasor evolution in the complex plane. Input and output polarizers at + 55° and −45° with respect to the X-axis.
In the case of HTM we need to find three gray level values, two of them with a high and equal intensity transmission and with a 180° relative phase-shift (ON levels), and a third gray level with a low intensity transmission (OFF level). After performing a series of optimizations and simulations we have found that the PA-LCoS device cannot fully meet these requirements. In the case of twisted-nematic LCDs it was possible, even though lowering the intensity transmission for the two ON levels, as we reported in [15,16,31]. Twisted-nematic LCDs provided a coupled amplitude and phase-shift modulation which enabled to produce spiral and other arbitrary complex amplitude trajectories (complex plane representation) as shown in [31]. In the case of PA-LCoS devices, we have found that the trajectory is always a circle, as discussed in Fig. 3(b). This means that if the OFF level is close to the origin, two equidistant points in the circle with a 180° phase-shift difference and with some intensity transmission are not possible. A compromise can be found if the circular trajectory is slightly shifted. Then at the cost of producing some leakage of light in the OFF value, we can produce two ON values with an appreciable intensity transmission and a relative phase-shift not far from 180°. Therefore, we can state that PA-LCoS devices do not produce a pure HTM modulation, but they enable an approximate trade-off, which we will call in the rest of the
#240156 Received 1 May 2015; revised 30 Jun 2015; accepted 16 Jul 2015; published 28 Jul 2015 © 2015 OSA 10 Aug 2015 | Vol. 23, No. 16 | DOI:10.1364/OE.23.020459 | OPTICS EXPRESS 20469

paper pseudo-HTM modulation (pHTM). We want to study if the pHTM can still be useful in its application to HDSS.
In Fig. 4 we show the complex amplitude modulation for one of the possible pHTM configurations obtained in our simulations. It corresponds to input and output polarizers at 55° and −45° with respect to the X-axis (lab vertical). In Fig. 4(a) we show the intensity and the phase-shift versus gray level, and in Fig. 4(b) we plot the phasor evolution in the complex plane where we see that the circular trajectory is not traversing the origin. The two ON gray levels considered are 105 and 168, with amplitude transmission values of 0.28 and phase-shift values of 75° and 281° respectively, i.e. a phase-shift difference of 206°. The OFF gray level is 140 with an amplitude transmission of 0.03 and phase-shift 170°. The intensity contrast
contrastI is then 1:10. This is a low value, however increasing the contrast means almost
crossing the two polarizers to produce a smaller intensity transmission for the OFF value. This has the drawback that the phase-shift becomes rather close to a 180° phase-jump at the OFF value, and the phase-shift difference between two ON levels about the OFF level rapidly becomes much larger than 180° if we want a reasonable intensity transmission at the ON levels. We note that we have verified experimentally the intensity transmission values at these three gray levels by in situ measurements: uniform gray level screens are addressed onto the PA-LCoS and the CCD captures the corresponding transmitted intensity. To measure the phase-shift between the two ON levels, a binary grating with these two gray levels is addressed. As we did in [15] we measure the intensity in the Fourier plane for the diffracted orders (0 and ± 1). From these measurements we extract the relative phase-shift value as proposed by Zhang et al. [32] which is approximately in accordance with the simulated value.
In the next Section we evaluate numerically the pHTM in comparison with the idealistic HTM and BIM both at the recording and at the final retrieval plane. We show how the light distributions under these modulation regimes are affected by defocus and by the size of the Nyquist aperture We also obtain experimental results both with BIM and pHTM which contain additional phenomena, such as the saturation effects produced by DC peaks in the recording step, not included in our linear recording-based simulator.
4. Numerical and experimental results
In Section 2 we verified theoretically the validity of the convergent correlator as an alternative to the 4-f processor in holographic memory testing platforms. We obtained the expressions considering the recording of the defocused Fourier transform of the data page and the possibility of a limiting aperture, the Nyquist aperture, on the recording plane. Furthermore we can simulate the realistic complex amplitude values for the levels implemented on the SLM to address the data page. These realistic values for the BIM and pHTM data pages can be obtained from the calculations exposed in Section 3. Next we will show numerical results using the HDSS simulator, and they will be compared with experimental results using the testing platform in our lab that we now present.
#240156 Received 1 May 2015; revised 30 Jun 2015; accepted 16 Jul 2015; published 28 Jul 2015 © 2015 OSA 10 Aug 2015 | Vol. 23, No. 16 | DOI:10.1364/OE.23.020459 | OPTICS EXPRESS 20470

Fig. 5. Diagram for the experimental HDSS testing platform. System described in the text.
In Fig. 5 we show the scheme for the experimental holographic memory setup used in our lab. We consider the 532 nm beam from a Nd:YVO4 laser, to which the PVA/AA photopolymer is sensitized. An additional waveplate, WP, is inserted before the shutter and spatial filter, SF, to secure that enough light traverses the polarizers in the object and reference beams. After the SF, the beam is collimated, and a non-polarizing beam-splitter produces the object and reference beams. The intensity ratio between both beams is controlled with one attenuator in each arm (not shown in the figure). The two linear polarizers LP1 and LP3 are used to produce the appropriate SOP for the object beam, and for the reference beam (along the vertical of the lab, to produce TEM mode interference on the material). In the reference beam, a stop limits the aperture of the beam to about a diameter of 1 cm. We have built an afocal system with lenses L6 and L7 so that the rotating mirror and the recording material are at conjugate planes, enabling angular multiplexing simply by rotation of the mirror. In the object beam, we have combined a divergent (L2) and convergent (L3) lens so that we can control the curvature of the converging beam onto the PA-LCoS. At the convergence plane the Fourier transform of the data page is produced and a stop, the Nyquist aperture, is located, as indicated in the figure. In our setup Nyquist aperture is at 15 cm from the PA-LCoS device. Then we have built a relay system to image the Nyquist filter plane onto the recording plane, where lens L4 collimates the beam before inciding onto polarizer LP2, which plays the role of exit polarizer for BIM and pHTM. The half-wave plate (HWP) is oriented so that the object beam is linearly polarized along the lab vertical. In this way we produce interference between TEM modes both in the object and reference beams, which generates maximum visibility of the interference fringes. The position of the image for the Fourier transform of the data page is produced on the focal plane of lens L5, with a focal length of 15 cm. The angle between the object and reference beams is 37°. In this work we will produce a symmetrical recording, i.e. the angle of incidence of either beam with respect to the normal to the plane of the material is 18.5°, which in the case of two plane waves interference would be equivalent to the recording of a transmission diffraction grating with 1193 lines/mm, which is well within the range characterized with PVA/AA photopolymers [25]. Taking into account that the beam size is about 1 cm diameter, and that the second lens in the object beam has a focal length of 15 cm, we obtain that the numerical aperture, NA, to be used in Eq. (4) is about 0.03, and for a defocus parameter 20 1W = the lab defocus is
1z mmΔ = .
In the reconstruction step, the recording material is illuminated with the reference beam and the lens L8 produces the Fourier transform of the object beam retrieved onto the plane of
#240156 Received 1 May 2015; revised 30 Jun 2015; accepted 16 Jul 2015; published 28 Jul 2015 © 2015 OSA 10 Aug 2015 | Vol. 23, No. 16 | DOI:10.1364/OE.23.020459 | OPTICS EXPRESS 20471

the CCD camera (pco.1600 model from pco.imaging). This is a high dynamic 14 bits cooled CCD camera system with a resolution of 1600x1200 pixels, and a pixel size of 7.4x7.4 μm2. The magnification of the PA-LCoS plane onto the camera plane is about a factor x2. In this paper, we consider data pages on the PA-LCoS with 64x64 bits and with 8 pixels per bit. Many LCDs and LCoS devices exhibit cross-talk effects, such as the anamorphic and frequency-dependent effect [33,34], when there are fast transitions in the image. To limit these effects we have preferred to work with this bit size.
To numerically simulate the system we use the fast Fourier transform algorithm using the MATLAB software. To accurately simulate the optical system we have to consider both oversampling and zero padding of the data page bits [21]. Oversampling is necessary in order to simulate the existence of harmonics in the Fourier plane. Zero padding, i.e. filling with zeros the oversampled matrix, has the effect of adding interpolated values in the Fourier plane. In the simulations we consider data pages with 128x128 bits. Oversampling by a factor of 4 produces a 512x512 matrix, and generates 3 harmonics, plus the fundamental frequency in the Fourier plane. This matrix has been zero padded resulting in a matrix 2048x2048, which produces 3 interpolated values between the previous samples in the Fourier plane. According to all these factors, the size in pixel number of the Nyquist radius NR is 256
pixels. In the simulations the figures of merit that we consider to evaluate the fidelity in the
retrieval are bit-error rate (BER), which is given by the number of incorrectly detected ones and zeros with respect to the total. Then we also use the so-called Q-factor, which is an estimate for the quality of the signal-to-noise ratio, typically used in digital systems as for example in optical fiber communications [35], which is given by,
1 0
1 0
Qμ μσ σ
−=
+ (15)
, where 1μ and 0μ are the mean value in the histograms produced for the gray level
distribution of ON and OFF bits respectively, and where 1σ and 0σ are the corresponding
standard deviations. BER below 10−2-10−3 are necessary so that further reduction to practical levels is obtained through additional error correction codes. To evaluate the homogeneity of the intensity distribution in the recording plane we consider the ratio between the DC-term (zero frequency) intensity value DCI with respect to the intensity avrgI averaged across the
recording plane,
( )1010 logDCterm DC avrgR I I= (16)
, given in decibels (dB). This figure of merit is a variation of the ones defined in [12,13] by O’Callaghan and by Das et al. respectively. As said, the linear recording-based simulator developed in Section 2 is rigorous for the calculation of the light distribution in the recording material plane. In the data page retrieval plane delivers a first, yet useful, approximation since distortion effects due to low pass filtering from the Nyquist aperture and defocus are included in the simulations for the various modulation regimes with the PA-LCoS display.Next we show some simulated results. We apply gaussian additive noise with a variance of 0.005 and mean zero, which is a good estimation of the thermal noise of the CCD camera used in the experiments. In the BIM we consider random bit data pages with an equal number of 0s and 1s, whereas in the pHTM the 1s are equally distributed between the two ON levels.
#240156 Received 1 May 2015; revised 30 Jun 2015; accepted 16 Jul 2015; published 28 Jul 2015 © 2015 OSA 10 Aug 2015 | Vol. 23, No. 16 | DOI:10.1364/OE.23.020459 | OPTICS EXPRESS 20472

Fig. 6. Fourier plane where the limiting stop is double the length of the Nyquist radius, which is 512 pixels. (a) Image plane; (b) Radial cut across a diameter crossing the center of the Fourier plane. The representation is logarithmic. We have considered a 128x128 bits BIM data page.
In Fig. 6 we show the resulting pattern in the Fourier plane for an ideal BIM data page, when considering a limiting stop with a length double the Nyquist radius, 256NR pixels= ,
that is the aperture radius is 512 pixels, therefore it transmits both the fundamental frequency and the first harmonic for the data page. We can see, especially in radial cut in Fig. 6(b), the much larger intensity of the zero frequency (or DC term) in comparison with the rest of the frequency components in the Fourier plane. This is what happens when using BIM data pages and results in saturation of the dynamic range of the recording material in the location of the DC term, therefore deteriorating the data page information when retrieved and reducing the dynamic range of the recording material.
Fig. 7. Simulation for BIM and for 128x128 bits data page. (a) Homogeneity in the recording plane; (b) Q-factor and (c) BER, to evaluate the quality of the reconstruction. In the legend, size of the Nyquist aperture in Nyquist radius units.
Fig. 8. Simulation for ideal HTM and for 128x128 bits data page. (a) Homogeneity in the recording plane; (b) Q-factor and (c) BER, to evaluate the quality of the reconstruction. In the legend, size of the Nyquist aperture in Nyquist radius units.
#240156 Received 1 May 2015; revised 30 Jun 2015; accepted 16 Jul 2015; published 28 Jul 2015 © 2015 OSA 10 Aug 2015 | Vol. 23, No. 16 | DOI:10.1364/OE.23.020459 | OPTICS EXPRESS 20473

Fig. 9. Simulation for pHTM and for 128x128 bits data page. (a) Homogeneity in the recording plane; (b) Q-factor and (c) BER, to evaluate the quality of the reconstruction. In the legend, size of the Nyquist aperture in Nyquist radius units.
In Fig. 7 we show the simulated results for various figures of merit as a function of defocus, and for various Nyquist apertures (in units of the fundamental frequency, in the legend), for the case of ideal BIM. In Fig. 7(a) we observe the large dynamic range necessary to both register the DC-term and the higher frequencies, whose value will tend to the average
avrgI value. We see that one way to reduce this dynamic range is to defocus the Fourier
transform of the data page onto the recording material. In Figs. 7(b) and 7(c) we show respectively the Q-factor and the BER. We observe that the reconstruction deteriorates for smaller Nyquist apertures. BER results better than 10−2 can be obtained for apertures larger than 1.5 the Nyquist radius, which is related with Q factor values better than 1. In the defocus range shown in the X-axis in Figs. 7(b) and 7(c) both the Q-factor and the BER remain constant. This means that the low pass filtering effect of the Nyquist aperture is not influenced by defocus within this not very large defocus range. For larger values of defocus, not shown in these figures, Q-factor and BER actually start to deteriorate. We note that we have also done the simulation using the experimental values for the BIM, which provide a limited contrast of about 1:50 (discussed with Fig. 3). The simulations obtained are basically the same as the plots in Fig. 7.
In Fig. 8 we show the plots equivalent to the ones in Fig. 7, but now for the case of ideal HTM. We see that DCtermR is more than 40 dB smaller than in the BIM case. Actually the DCI
value varies with each realization of the simulation since we are considering a random data page, then we can even obtain negative values for DCtermR . Defocus, Fig. 8(a), does not have
an influence in the intensity homogeneity in the recording plane. It is interesting to observe that now to obtain Q factor better than 1, Fig. 8(b), the Nyquist aperture needs to be close to 2. This is in correspondence with necessary Nyquist aperture to obtain a BER smaller than 10−2, Fig. 8(c). The BER value obtained for a Nyquist aperture value of 2 is about 50 times better in the case of BIM with respect to HTM. We believe that the low-pass filtering due to the Nyquist aperture is producing a larger cross-talk between neighbouring pixels in the case of HTM, since larger spatial frequencies increase their relative importance with respect to the DC-term.
In Fig. 9 we show the plots equivalent to the ones in Figs. 7 and 8, but now for the case of pHTM. In Fig. 9(a) we observe that for the non-defocused situation, the homogeneity has worsened with respect to ideal HTM, but it is still 20 dBs (2 orders of magnitude) better than for BIM. The results for the Q-factor and BER, Figs. 9(b) and 9(c), are very close to the ones in Fig. 8, thus there is no degradation in the quality of the reconstructed page when compared with HTM. We note that both HTM and pHTM are quite robust to defocus within the defocus range shown in plots for Q-factor and BER in Figs. 8 and 9: i.e. cross-talk is mainly given by the low pass filtering effect of the Nyquist aperture size and not because of defocus.
In the previous numerical simulations we considered an ideal linear material (linear recording-based simulator), thus not reflecting the impact that saturating DC peaks produce in the fidelity of the reconstructed data page. To complement these simulations, experimental
#240156 Received 1 May 2015; revised 30 Jun 2015; accepted 16 Jul 2015; published 28 Jul 2015 © 2015 OSA 10 Aug 2015 | Vol. 23, No. 16 | DOI:10.1364/OE.23.020459 | OPTICS EXPRESS 20474

results are then needed. Next we show the experimental results obtained with a PVA/AA photopolymer as recording material. In the paper we restrict our attention to the non-defocus situation, i.e. 0zΔ = . The effective Nyquist aperture in the experiment is in principle better than 2, i.e. both the fundamental frequency and the first harmonic are not filtered. The PVA/AA photopolymer composition we use is similar to the one used in previous works [36]. This photo-chemical composition is characterized by the presence of yellowish eosin (YE) as dye and N,N’-methylene-bis-acrylamide (BMA) as crosslinking monomer. It also contains a co-sensitizer which is triethanolamine (TEA), the acrylamide (AA) monomer and the PVA as a binder. The thickness of the samples is around 90 ± 2µm and the refractive index modulation achieved for a single holographic grating with a spatial frequency of 1150 lines/mm is 0.005. Thicker samples can be prepared with PVA/AA photopolymer, which is necessary when multiplexing many data pages.
First we plot the results for the image retrieved when addressing the BIM data page to the PA-LCoS and with no recording material. This allows evaluating the performance of the setup. In Figs. 10(a) and 10(b) we show respectively the data page captured with the CCD camera and the distribution of 0s and 1s in the histogram. We note that no errors are obtained, i.e. BER = 0. In Fig. 10(a) a good contrast between ON and OFF bits is visible. In Fig. 10(b) we see the large separation between the histograms for the 0s and 1s, with no overlap.
In Fig. 11 we show the retrieved results when the PVA/AA photopolymer is used to record the data page. It corresponds to a beam intensity ratio about 1:400, where the intensity incident onto the recording material is 3.16 mW/cm2 and 8µW/cm2 respectively for the reference and object beam, and for an exposure time of 6 seconds. The number of errors detected is 52, i.e. BER = 1.3·10−2. This is larger than the numerical BER value in Fig. 7(c) for the Nyquist radius of 2. Other beam ratios and exposure times have been tried, and results in Fig. 11 are in the range of the best results obtained in the various batches. We see the good contrast between 0s and 1s in Fig. 11(a). In Fig. 11(b) we see a slight overlap between the 0s and 1s histograms.
Fig. 10. Experimental results BIM data page and no material. (a) Data page; (b) Histograms.
#240156 Received 1 May 2015; revised 30 Jun 2015; accepted 16 Jul 2015; published 28 Jul 2015 © 2015 OSA 10 Aug 2015 | Vol. 23, No. 16 | DOI:10.1364/OE.23.020459 | OPTICS EXPRESS 20475

Fig. 11. Experimental results BIM data page and PVA/AA. (a) Data page; (b) Histograms.
Next we concentrate on the results obtained when the pseudo-HTM data page is addressed. In Fig. 12 we show the retrieved results when no photopolymer is in the system, i.e. only the effect of the holographic memory setup and implementation on the PA-LCoS is considered. We detect 8 errors, which corresponds to a BER of 2.0·10−3. This is worse than in the BIM case in Fig. 10, which is probably due to the lower contrast of the data pages in the PA-LCoS, as commented when discussing the contrast parameter contrastI in Fig. 4. In Fig.
12(a) it can be seen a lower contrast than in Fig. 10(a). The histograms, Fig. 12(b), have a slight overlap, especially when compared with Fig. 10(b).
Now the photopolymer is used to record the pseudo-HTM data page and we plot the results in Fig. 13. Beam intensity ratio is about 1:800, where the intensity incident onto the recording material is 3.16 mW/cm2 and 4µW/cm2 respectively for the reference and object beam, and for an exposure time of 10 seconds. There are 229 errors detected, which corresponds to a BER of 5.6·10−2. Visually, the image in Fig. 13(a) is not showing a much worse contrast or definition, even though the BER is worse than in previous cases, which is clearly appreciated in the histograms overlap in Fig. 13(b). When compared with results for Fig. 11(b) the BER is about 5 times larger. In the case of the numerical simulations, corresponding to a linear material, for the Nyquist aperture value of 2, an analogous comparison between the two modulations produced a BER ratio of about 50. Therefore, the experimental result for the pHTM is 10 times better than the numerical one. We believe that the better experimental ratio is due to the impact of the larger DC peak in the case of the BIM, which causes a nonlinear recording of the data page due to saturation of the dynamic range of the material, which is an effect not included in the numerical simulation. Further experimental work has to be done with PVA/AA photopolymer to get a deeper understanding of these saturation effects in this material. In general, we have obtained good results with the PVA/AA material, improving the fidelity of the reconstructed data page with respect to previous works in the literature [25,26], thus showing its potential in data storage. There are various points to be addressd to tune more effectively the PVA/AA photopolymer to the specific application as holographic memory. The interplay between a larger dynamic range to enable multiplexing of many data pages needs thicker samples and higher concentrations of monomer and dye. However, this may affect negatively the signal-to-noise ratio and the BER. Then, BIM, with larger DC peaks, and pHTM, with lower contrast ratios, need also further exploration to optimize the material composition to these specificities exhibited by the two coding methods.
#240156 Received 1 May 2015; revised 30 Jun 2015; accepted 16 Jul 2015; published 28 Jul 2015 © 2015 OSA 10 Aug 2015 | Vol. 23, No. 16 | DOI:10.1364/OE.23.020459 | OPTICS EXPRESS 20476

Fig. 12. Experimental results pHTM data page and no material. (a) Data page; (b) Histogram.
Fig. 13. Experimental results pHTM data page and PVA/AA. (a) Data page; (b) Histogram.
5. Conclusions
We have built a holographic data storage testing platform, where the novelty in three of its elements has been analysed. On one hand, we have introduced a last generation PA-LCoS device to display the data page. We have verified its good performance to display BIM data pages. We have also shown that pure HTM data pages cannot be obtained with PA-LCoS devices, however, a rather close performance is obtained when implementing the pseudo-HTM data pages that we have proposed in this paper. Another novelty is that instead of the typical 4-f system, we have studied both theoretically, numerical and experimental, the use of the convergent correlator architecture for the object beam. The expressions obtained, based on the Fourier Optics formalism, have been used to construct a holographic storage simulator which includes the possibility of a Nyquist aperture and defocus of the Fourier transform of the data page with respect to the recording material. Differences with respect to the 4-f system may arise if the data page is introduced as a phase-only function, since in this case there is a resultant quadratic factor which does not appear in the 4-f system. Then, we have also analysed experimentally the potential of PVA/AA photopolymer to be used in HDSS applications. We have obtained promising results with BER values in the range of 10−3 thus showing the interest of further studies with this phopolymer in data storage.
Appendix
Next we show the basic Fourier Optics notation needed for the theoretical derivations in Section 2. In the Fourier Optics formalism [19,20] optical systems are composed of two basic
#240156 Received 1 May 2015; revised 30 Jun 2015; accepted 16 Jul 2015; published 28 Jul 2015 © 2015 OSA 10 Aug 2015 | Vol. 23, No. 16 | DOI:10.1364/OE.23.020459 | OPTICS EXPRESS 20477

units: propagation in air (or free-space) and propagation through lenses. In the case of free-space propagation the impulse response, in the Fresnel approximation, is given by,
( )2 2expjkz keh(x, y) = j x y .
j z 2zλ +
(17)
where k is the wave number, k = 2π/λ, with λ the light wavelength. In the case of a lens, it produces the change in the curvature of the incoming beam thus generating a spherical wavefront, and for a lens with a focal length f the effect on the phase of the incoming
wavefront is represented by,
( )2 2expLt (x, y) = j x yf
πλ
− +
(18)
where, as in Eq. (A1), we have a parabolic expression. This is a very good approximation as long as we move in the paraxial regime, i.e. not very large numerical apertures. For complex optical systems it becomes very useful to use the notation introduced in pages 117-118 in the book of A. VanderLugt [20]. Using the definition,
( )2 21, ; exp
Zx y Z j x y
z
πψλ
= ≡ +
(19)
we rewrite Eq. (17) and (18) as follows,
;jkzeh(x, y) = Z (x, y Z)
jψ
λ (20)
;Lt (x, y) (x, y F)ψ= − (21)
These expressions verify a series of very useful properties which are used intensively in the theoretical calculations in Section 2. For self containment of the paper we list them as follows,
*1 ) ; ; (x, y Z) (x, y Z)ψ ψ= −
2º ) ; ;( x, y Z) = (x, y Z)ψ ψ− −
1 2 1 23º ) ; ; ;(x, y Z ) (x, y Z ) = (x, y Z Z )ψ ψ ψ +
* *1 2 1 2 2 14º ) ; ; ; ;(x, y Z ) (x, y Z ) = (x, y Z Z )= (x, y Z Z )ψ ψ ψ ψ− −
25º ) ; ;(cx,c y Z) = (x, y c Z) ψ ψ
( )26º ) ; ; ; exp(x u, y v Z) = (u,v Z) (x, y Z) j u x v y
z
πψ ψ ψλ
− − − +
*07º ) lim ; 1Z (x, y Z) = ψ→
( )8º ) lim ; ,Z Z (x, y Z) = x y ψ δ→∞
( )2
* 21
2 1 1
29º ) ; exp ; ,
Zj(x, y Z ) j u x v y dx dy = (u,v )
z Z Z
π λψ ψλ
+∞ +∞
−∞ −∞
− +
#240156 Received 1 May 2015; revised 30 Jun 2015; accepted 16 Jul 2015; published 28 Jul 2015 © 2015 OSA 10 Aug 2015 | Vol. 23, No. 16 | DOI:10.1364/OE.23.020459 | OPTICS EXPRESS 20478

( )2
* 21
2 1 1
2; exp ;
Zj(x, y Z ) j u x v y dx dy = (u,v )
z Z Z
π λψ ψλ
+∞ +∞
−∞ −∞
−− +
Acknowledgments
Work supported by Ministerio de Trabajo y Competitividad of Spain (projects FIS2011-29803-C02-01 and FIS2011-29803-C02-02), by Generalitat Valenciana of Spain (projects PROMETEOII/2015/015 and ISIC/2012/013), and by Univ. de Alicante (project GRE12-14)
#240156 Received 1 May 2015; revised 30 Jun 2015; accepted 16 Jul 2015; published 28 Jul 2015 © 2015 OSA 10 Aug 2015 | Vol. 23, No. 16 | DOI:10.1364/OE.23.020459 | OPTICS EXPRESS 20479