exploring an educational system’s data through fuzzy ... · exploring an educational system’s...
TRANSCRIPT

Athens Journal of Sciences X Y
1
Exploring an Educational System’s Data
through Fuzzy Cluster Analysis
By Erind Bedalli
Ilia Ninka†
Clustering is a very useful technique which helps to enrich the
semantics of the data by revealing patterns in large collections of
poly-dimensional data. Moreover the fuzzy approach in clustering
provides flexibility and enhanced modeling capability, as the results
are expressed in soft clusters, allowing partial memberships of data
points in the clusters. During the last decade, the digitalization of
detailed student records of the University of Elbasan has not only
simplified the typical university procedures but also it has created
the possibility of a deeper view of the students’ data. The cluster
analysis applied on these student data can discover patterns which
would assist in several strategic issues like: optimizing the student
advising process, organization of curricula, adjusting the
compulsory/elective courses, preparing better teaching approaches
etc. In our study, besides the classical fuzzy c-means, we will utilize
several other variations like the possibilistic fuzzy c-means, the
Gustafson-Kessel algorithm and the kernel based fuzzy clustering.
We have found the application of several variations of the fuzzy
clustering algorithms on these data to be a productive approach.
Particular applications sometimes provide useful viewpoints which
trigger innovative ideas for the policy-makers of the university.
Introduction
Clustering algorithms are important instruments used in the analysis of
large collections of data. They are typically unsupervised methods which
arrange the data elements into classes (clusters) based on the similarity among
the data elements, thus revealing underlying patterns of the data (Hoppner et
al., 1999). Due to its fair modeling capabilities even without prior knowledge
about the distribution of the data, cluster analysis has a wide range of
applicability in various disciplines of study like patterns recognition, image
processing, cognitive sciences, economics, medicine, education etc (Miyamoto
et al., 2008)
The fuzzy approach to cluster analysis generalizes the concept of the
distribution of the data elements into clusters relaxing the condition that each
Lecturer, University of Elbasan, Albania.
†Lecturer, University of Tirana, Albania.

Vol. X, No. Y Bedalli et al.: Exploring an Educational System’s Data...
2
data element must belong to exactly one of the clusters, thus allowing each data
element to have partial membership (a value between 0 and 1) into several
clusters simultaneously. This is of particular interest in the cases when the
boundaries among the classes (clusters) are not clearly separated (they are
blurred). Furthermore the resulting partial memberships may be helpful in
revealing more sophisticated relationships between the data elements and the
created clusters (Hoppner et al., 1999). The most widely-used fuzzy clustering
algorithm is the fuzzy c-means algorithm (FCM). Several variations of this
algorithm are developed by trying to optimize the algorithm efficiency on
specific scenarios and by analyzing the influence of various parameters
characterizing the algorithm like the fuzzy exponent, the distance measure etc.
Some of the most-important variations of the FCM algorithm include but are
not limited to Gustafson-Kessel algorithm (GK), Gath-Geva algorithm (GG),
possibilistic fuzzy clustering algorithm (PFCM), kernel-based fuzzy clustering
algorithm (KFCM) etc.
In this paper we have conducted an experimental study by applying several
fuzzy cluster analysis techniques to explore the collection of student’s data
available in the Information Systems Center at the University of Elbasan. We
have applied several algorithms on these data and we have described the
interpretations and utilization of the obtained outcomes in the improvement of
some aspects of the education process. Moreover we have outlined
perspectives of further applications. The main application was in the
improvement of the student advising process. This was achieved by profiling
the students according to their data and providing guidance to improve their
academic performance. Also the student advising process was assisted in the
suggestion of the selection of the elective courses according to the
characterizations obtained by the fuzzy cluster analysis. Outcomes of the
analysis were also interpreted to the lecturers for to assist them in development
of better teaching approaches.
Fuzzy Cluster Analysis
The fuzzy clustering algorithms are classified into two major categories:
the partitional clustering algorithms and hierarchical clustering algorithms. The
algorithms in the partitional category generate a single partition of the data set,
while the hierarchical clustering algorithms generate a nested sequence of
partitions (Miyamoto et al., 2008). In this paper we will be focused only on
partitional clustering algorithms. In the following subsections we will discuss
respectively the fuzzy c-means algorithm, the Gustafson-Kessel algorithms, the
possibilistic fuzzy c-means algorithm and the kernel-based fuzzy c-means
algorithm. Finally we will briefly describe the crucial problem determining of
the optimal number of clusters, known as the cluster validity problem.
Athens Journal of Sciences X Y
3
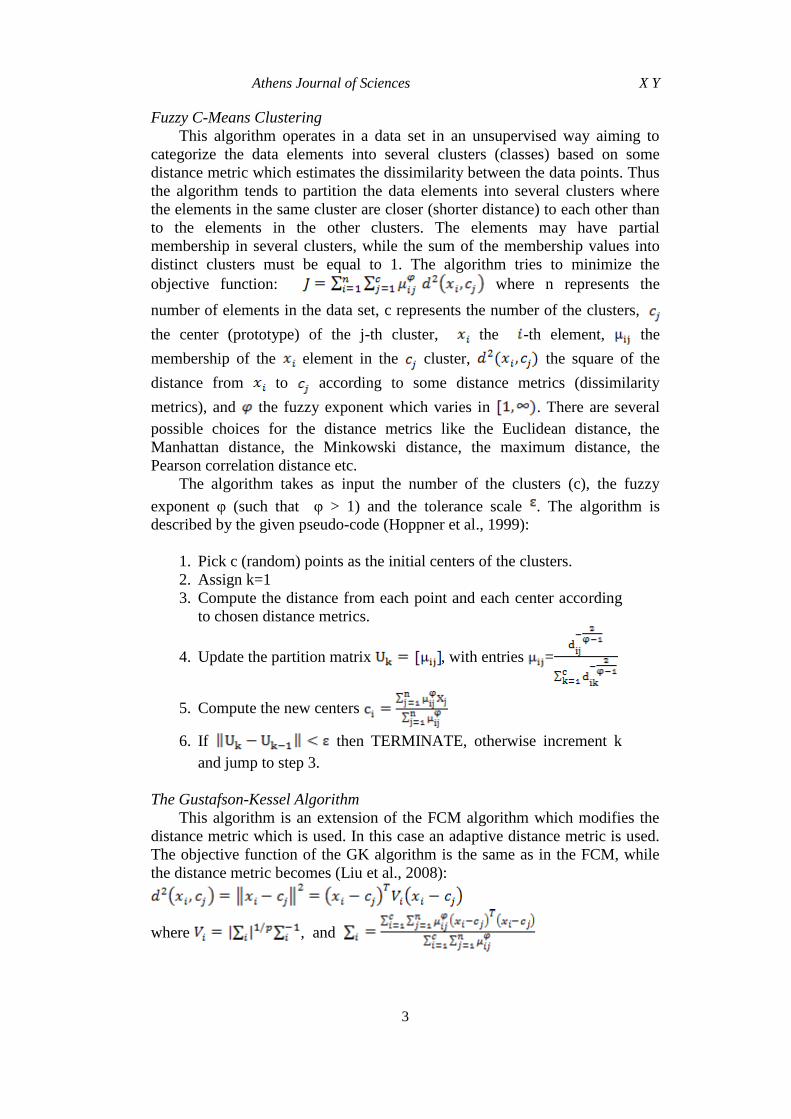
Fuzzy C-Means Clustering
This algorithm operates in a data set in an unsupervised way aiming to
categorize the data elements into several clusters (classes) based on some
distance metric which estimates the dissimilarity between the data points. Thus
the algorithm tends to partition the data elements into several clusters where
the elements in the same cluster are closer (shorter distance) to each other than
to the elements in the other clusters. The elements may have partial
membership in several clusters, while the sum of the membership values into
distinct clusters must be equal to 1. The algorithm tries to minimize the
objective function: where n represents the
number of elements in the data set, c represents the number of the clusters,
the center (prototype) of the j-th cluster, the -th element, the
membership of the element in the cluster, the square of the
distance from to according to some distance metrics (dissimilarity
metrics), and the fuzzy exponent which varies in . There are several
possible choices for the distance metrics like the Euclidean distance, the
Manhattan distance, the Minkowski distance, the maximum distance, the
Pearson correlation distance etc.
The algorithm takes as input the number of the clusters (c), the fuzzy
exponent φ (such that φ > 1) and the tolerance scale . The algorithm is
described by the given pseudo-code (Hoppner et al., 1999):
1. Pick c (random) points as the initial centers of the clusters.
2. Assign k=1
3. Compute the distance from each point and each center according
to chosen distance metrics.
4. Update the partition matrix , with entries =
5. Compute the new centers
6. If then TERMINATE, otherwise increment k
and jump to step 3.
The Gustafson-Kessel Algorithm
This algorithm is an extension of the FCM algorithm which modifies the
distance metric which is used. In this case an adaptive distance metric is used.
The objective function of the GK algorithm is the same as in the FCM, while
the distance metric becomes (Liu et al., 2008):
where , and
Vol. X, No. Y Bedalli et al.: Exploring an Educational System’s Data...
4
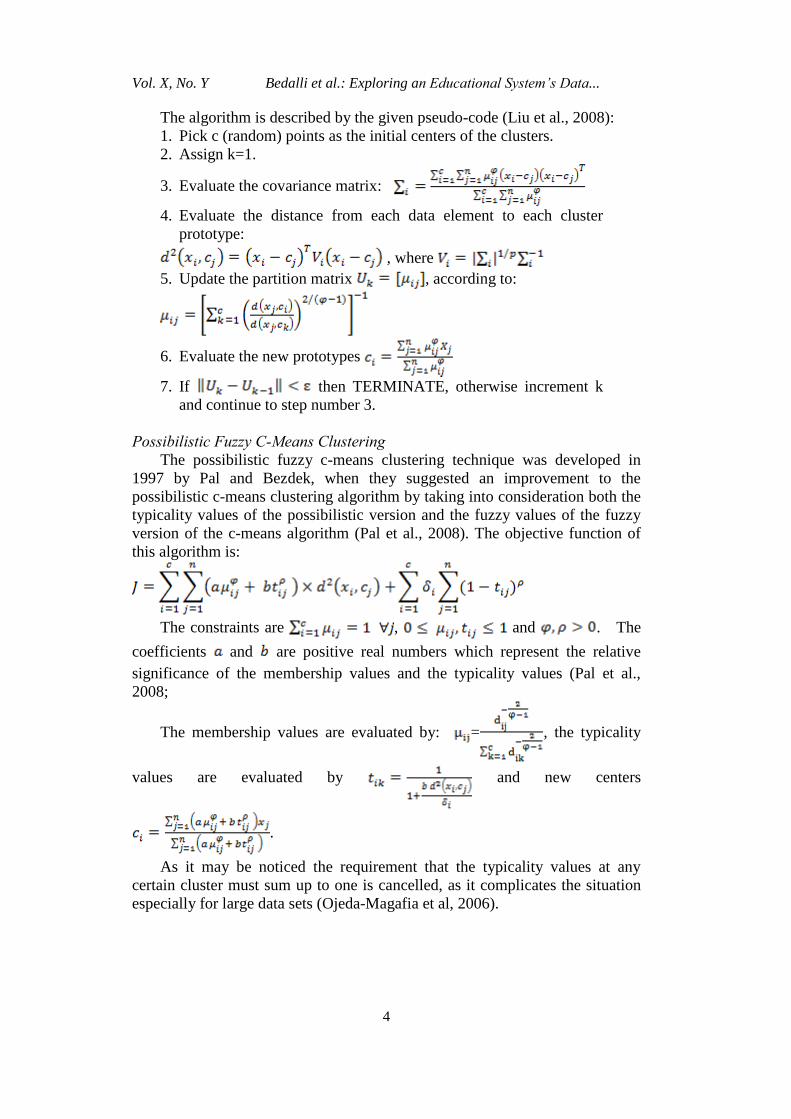
The algorithm is described by the given pseudo-code (Liu et al., 2008):
1. Pick c (random) points as the initial centers of the clusters.
2. Assign k=1.
3. Evaluate the covariance matrix:
4. Evaluate the distance from each data element to each cluster
prototype:
, where
5. Update the partition matrix , according to:
6. Evaluate the new prototypes
7. If then TERMINATE, otherwise increment k
and continue to step number 3.
Possibilistic Fuzzy C-Means Clustering
The possibilistic fuzzy c-means clustering technique was developed in
1997 by Pal and Bezdek, when they suggested an improvement to the
possibilistic c-means clustering algorithm by taking into consideration both the
typicality values of the possibilistic version and the fuzzy values of the fuzzy
version of the c-means algorithm (Pal et al., 2008). The objective function of
this algorithm is:
The constraints are , and . The
coefficients and are positive real numbers which represent the relative
significance of the membership values and the typicality values (Pal et al.,
2008;
The membership values are evaluated by: = , the typicality
values are evaluated by and new centers
.
As it may be noticed the requirement that the typicality values at any
certain cluster must sum up to one is cancelled, as it complicates the situation
especially for large data sets (Ojeda-Magafia et al, 2006).

Athens Journal of Sciences X Y
5
The Kernel-based Fuzzy C-Means Clustering
The kernel-based fuzzy c-means clustering technique is a modification of
the conventional fuzzy c-means clustering technique by employing a nonlinear
map (known as the kernel function) from the feature space to a high
dimensional kernel space. This nonlinear map enables the identification of
complex structures (which cannot be linearly separated in the feature space), as
in the kernel space they are transformed into simpler linearly separable
structures (Zhang & Chen, 2003). The nonlinear map is denoted as:
. The objective function that we tend to minimize is:
Here we have
where is an inner product kernel (Zhang & Chen, 2003; Graves &
Pedrycz, 2010). In our study we have employed the Gaussian function as
kernel function, i.e. where , so and
the objective function is expressed as:
The algorithm is described by the given pseudo-code :
1. Pick c (random) points as the initial centers of the clusters.
2. Assign k=1.
3. Evaluate the new prototypes
4. Update the partition matrix , by
=
5. If then TERMINATE, otherwise increment k
and continue to step number 3.
The Cluster Validity Problem
One of the critical problems associated with the clustering algorithms is to
answer the question whether the obtained clusters are optimal, which is known
as the cluster validity problem. As the clustering algorithms are unsupervised,
we have no prior labels to assess the classification accuracy. Under these
circumstances the quality of the resulting clusters is assessed based on their
compactness and separation. Compactness is a quantity that evaluates the
variation of the data within the same cluster separation is a quantity that
describes the structures among the different clusters. The primary goal of all
the validation methods is to decrease the compactness and to increase the
separation of the obtained clusters. There are several well-known cluster
validation techniques like the partition coefficient, the partition index, the

Vol. X, No. Y Bedalli et al.: Exploring an Educational System’s Data...
6
partition entropy, the partition index, the separation index, the Xie-Beni index,
the Fukuyama-Sugeno index, the fuzzy hypervolume etc (Bedalli & Ninka,
2013). In this paper we will utilize three of these validity measures: the
partition index, the Xie-Beni index and the fuzzy hypervolumes. The partition
index estimates the amount of shared regions among the clusters. It is
calculated as:
with representing the membership value of the data element in
the cluster. The value satisfies the inequality . The
drawback of this method is that it monotonically decreases with c and there is
no explicit relation to some property of the data. The optimal value of c is the
value that maximizes the partition coefficient.
The Xie-Beni index is evaluated as:
with representing the membership value of the data element in the
cluster, is the data element, and is the center of the i-th
cluster. The optimal value of c is the value that minimizes the index (Bedalli &
Ninka, 2013).
The fuzzy hypervolumes is one of the most frequently used validity
measures. It can be considered as the volume of the fuzzy clusters and it is
calculated as:
So it is expressed as the sum of the determinant of the matrices, where
represents the matrix:
Methodology and Interpretation of Results
The fuzzy clustering techniques which were theoretically discussed in the
previous sections of this paper have been applied to explore the collection of
student’s data available in the Information Systems Center at the University of
Elbasan. One of the troublesome aspects of the fuzzy c-means algorithm and its
variations is the large computational complexity especially when the data
elements have many dimensions. Clustering in the multi-dimensional feature
spaces is a challenging task not only because it is a time intensive process, but
also the presence of outliers and noisy data would affect the results in a more

Athens Journal of Sciences X Y
7
sensitive manner (Eschrich et al., 2003; Hogo 2010). In our case the data
elements consist of many features which may be discrete, continuous or
categorical. Involving all these features simultaneously would yield
implementation challenges and computational infeasibilities. So our first step
in our approach (considered as a preprocessing stage) was to reduce the
dimensionality of the data elements. The reduction was achieved through three
main strategies which were feature selection, quantization and aggregation.
Through feature selection only the most representative features of the data
elements are picked in order to be involved in the evaluation of the similarity
(or dissimilarity) between the data elements. On the other hand, through
quantization continuous data of various types are transformed and adapted in
the discrete form. There are cases of precision loss when using quantization,
but generally they yield insignificant changes in the results (Eschrich et al.,
2003). Finally through aggregation we combine and merge several features into
a single weighted feature. The value of this new feature will be the
representative value which will be involved in the evaluation of the similarity
(or dissimilarity) between the data elements (Eschrich et al., 2003; Talavera &
Gaudioso, 2004).
After we have reduced the dimensionality of the data elements in our
collection, then we have applied several times the clustering algorithms like the
fuzzy c-means clustering, the Gustafson-Kessel clustering algorithm, the fuzzy
possibilistic clustering and the kernel-based fuzzy c-means clustering. The
algorithms were applied with the value 2 for the fuzzy exponent, the value
0.0001 for the scale of tolerance and several values for the number of clusters
varying iteratively from 2 to 10. Later we have validated the obtained clusters
through three cluster validation techniques, namely the partition index, the Xie-
Beni index and the fuzzy hyper volumes measure. Through the validation
process we have determined the optimal number of clusters for each case and
the membership values of the optimal partition. The obtained partitions are
utilized in the next subsections to address important aspects of the education
process as the student advising, the recommendations about the elective
courses and the adaption of better teaching approaches.
Assisting the Student Advisors
Typically an advisor, who is in the same time a lecturer/teaching assistant,
is assigned to each class in our university. The advisor’s main duties generally
consists of the students orientation about the offered courses in each semester,
about the regulations in various aspects of the university procedures, about the
utilization of various resources of the university and to consult the students
about difficulties/poor performances they may be facing. The student advising
process is generally difficult to be handled in a customized way (Romero &
Ventura, 2010). The advisors typically give advices based on the grade point
average of the student and the information about grade distribution of various
courses in the previous years. This approach cannot provide specific guidance
to the students, as it is difficult to characterize their profiles based just on their
grade point average and the grade distribution in various courses.
Vol. X, No. Y Bedalli et al.: Exploring an Educational System’s Data...
8
Our application aims to provide more useful information to the advisors
about the students’ profiles by summarizing to them the fuzzy cluster analysis
outcomes. We have applied several clustering techniques and through cluster
validation measures we have selected the optimal partition. Cluster validation
is very useful as it primarily determines the optimal number of clusters. These
clusters will be the main categories to characterize the student profiles. Based
on the number of the clusters and on the values of the cluster centers
(prototypes) these clusters are manually labeled.
As an illustrating example we are describing the outcomes of the fuzzy
cluster analysis about the first three semesters for the students registered in the
Information Technologies program of study in the year 2011-2012. After the
clustering algorithms were applied several times with varying number of initial
clusters (we have iterated the clustering procedures with values of c from 2 to
10), the cluster validation procedures evaluated the optimal partition to contain
5 clusters and the most appropriate membership values were those generated
by the kernel–based fuzzy clustering technique. These clusters were labeled as
“Very good”, “Good”, “Average”, “Sufficient” and “Insufficient”. For each
student the partial memberships into these clusters (categories) are provided.
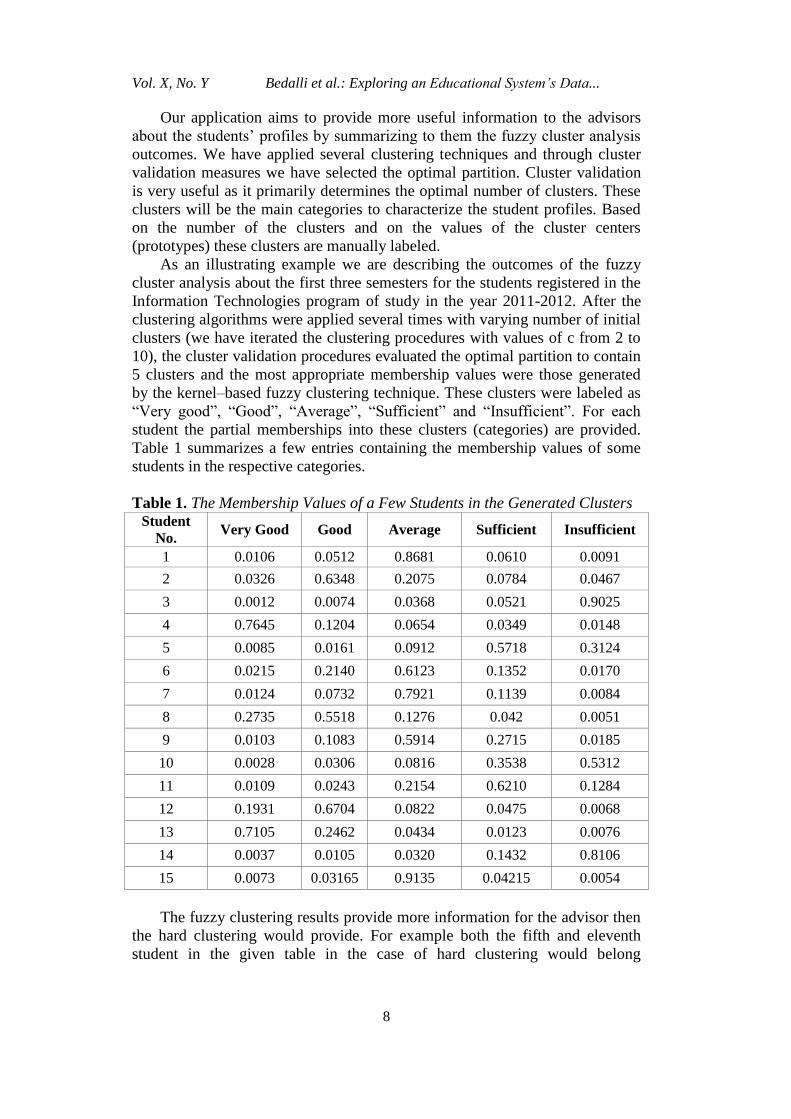
Table 1 summarizes a few entries containing the membership values of some
students in the respective categories.
Table 1. The Membership Values of a Few Students in the Generated Clusters
Student
No. Very Good Good Average Sufficient Insufficient
1 0.0106 0.0512 0.8681 0.0610 0.0091
2 0.0326 0.6348 0.2075 0.0784 0.0467
3 0.0012 0.0074 0.0368 0.0521 0.9025
4 0.7645 0.1204 0.0654 0.0349 0.0148
5 0.0085 0.0161 0.0912 0.5718 0.3124
6 0.0215 0.2140 0.6123 0.1352 0.0170
7 0.0124 0.0732 0.7921 0.1139 0.0084
8 0.2735 0.5518 0.1276 0.042 0.0051
9 0.0103 0.1083 0.5914 0.2715 0.0185
10 0.0028 0.0306 0.0816 0.3538 0.5312
11 0.0109 0.0243 0.2154 0.6210 0.1284
12 0.1931 0.6704 0.0822 0.0475 0.0068
13 0.7105 0.2462 0.0434 0.0123 0.0076
14 0.0037 0.0105 0.0320 0.1432 0.8106
15 0.0073 0.03165 0.9135 0.04215 0.0054
The fuzzy clustering results provide more information for the advisor then
the hard clustering would provide. For example both the fifth and eleventh
student in the given table in the case of hard clustering would belong

Athens Journal of Sciences X Y
9
completely to the “Sufficient” category, without any further information being
provided. In our case, certainly these students both have the largest value of
their memberships in the “Sufficient” category but for the fifth student the
advisor would advise him to take care not to fall in the insufficient category,
while the eleventh student would be prompted to achieve the “Average”
category. Similarly the second and the twelfth student would both be classified
in the “Good” category, but the second one is in the lower part of this category
and the twelfth one is in the upper part of this category.
Elective Courses Recommendations
Choosing a course from a group of elective courses is generally a
procedure in which the students would require recommendation. In our
approach we aimed to give recommendations to the students based on their
profile characterization about the previous courses which are considered
related to the courses to be elected. More concretely in our illustrating example
we try to give recommendations to guide the students to choose among two
elective courses, namely “Distributed systems” and “Parallel computing”. For
the “Distributed systems” course we have used aggregation of the data of three
previous courses: “Computer Architecture”, “Operating systems” and
“Computer Networks”, and for the “Parallel computing” course we have used
aggregation of the data about three previous courses: “Introduction to
programming”, “Discrete mathematics” and “Analysis of algorithms”. After
the aggregation step (considered as e preprocessing stage) we have applied the
fuzzy cluster analysis techniques. The fuzzy clustering techniques were applied
iteratively with values of c (number of clusters) varying from 2 to 8. Finally the
cluster validation techniques were applied to select the optimal partitions. In
this case the optimal number of partitions was 4, and the most appropriate
membership values were generated by the Gustafson-Kessel clustering
algorithm. The resulting four clusters were labeled as “High”, “Satisfactory”,
“Sufficient” and “Insufficient”.
In table 2 are shown some results about the memberships of a few students
in the clusters for the “Distributed systems” course (which is generated by the
aggregation of the data of three previous courses: “Computer Architecture”,
“Operating systems” and “Computer Networks”).
Table 2. The Membership Values of a Few Students for the “Distributed
Systems” Course Recommendation
Student
No. High Satisfactory Sufficient Insufficient
1 0.3106 0.5712 0.1053 0.0129
2 0.0609 0.1639 0.6427 0.1325
3 0.8204 0.1275 0.0473 0.0048
4 0.0451 0.9210 0.0211 0.0128
5 0.0247 0.1055 0.7742 0.0956
Vol. X, No. Y Bedalli et al.: Exploring an Educational System’s Data...
10
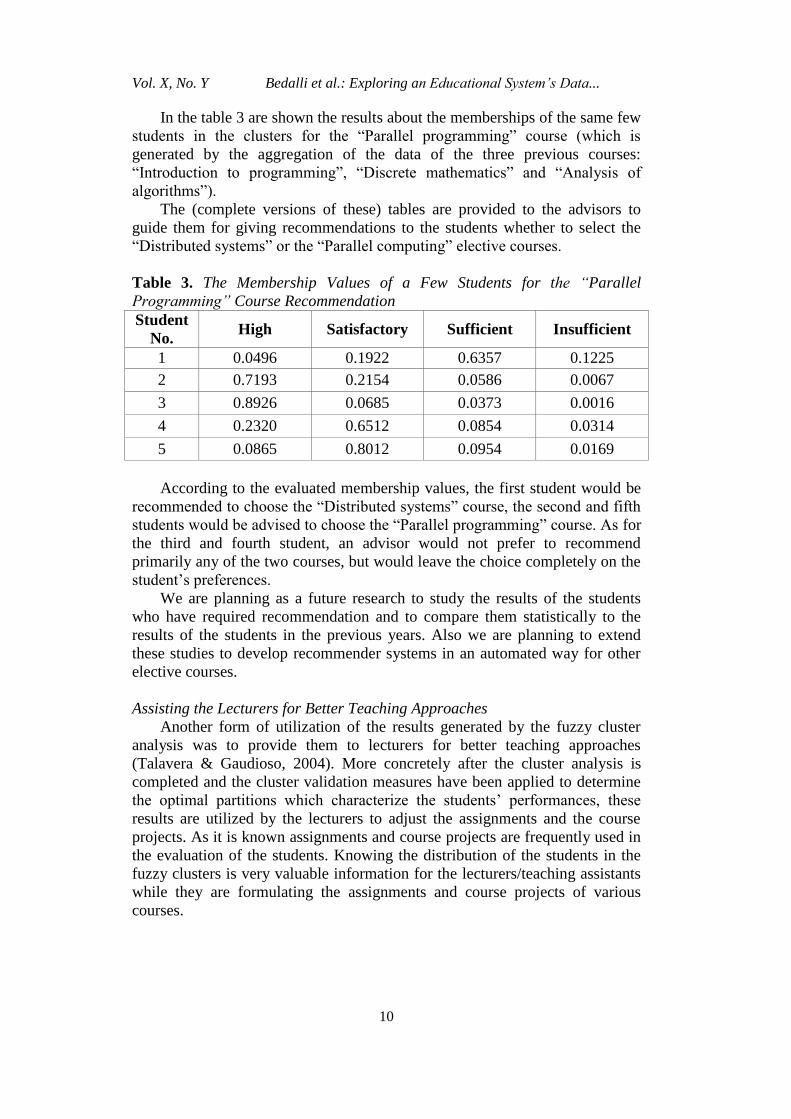
In the table 3 are shown the results about the memberships of the same few
students in the clusters for the “Parallel programming” course (which is
generated by the aggregation of the data of the three previous courses:
“Introduction to programming”, “Discrete mathematics” and “Analysis of
algorithms”).
The (complete versions of these) tables are provided to the advisors to
guide them for giving recommendations to the students whether to select the
“Distributed systems” or the “Parallel computing” elective courses.
Table 3. The Membership Values of a Few Students for the “Parallel
Programming” Course Recommendation
Student
No. High Satisfactory Sufficient Insufficient
1 0.0496 0.1922 0.6357 0.1225
2 0.7193 0.2154 0.0586 0.0067
3 0.8926 0.0685 0.0373 0.0016
4 0.2320 0.6512 0.0854 0.0314
5 0.0865 0.8012 0.0954 0.0169
According to the evaluated membership values, the first student would be
recommended to choose the “Distributed systems” course, the second and fifth
students would be advised to choose the “Parallel programming” course. As for
the third and fourth student, an advisor would not prefer to recommend
primarily any of the two courses, but would leave the choice completely on the
student’s preferences.
We are planning as a future research to study the results of the students
who have required recommendation and to compare them statistically to the
results of the students in the previous years. Also we are planning to extend
these studies to develop recommender systems in an automated way for other
elective courses.
Assisting the Lecturers for Better Teaching Approaches
Another form of utilization of the results generated by the fuzzy cluster
analysis was to provide them to lecturers for better teaching approaches
(Talavera & Gaudioso, 2004). More concretely after the cluster analysis is
completed and the cluster validation measures have been applied to determine
the optimal partitions which characterize the students’ performances, these
results are utilized by the lecturers to adjust the assignments and the course
projects. As it is known assignments and course projects are frequently used in
the evaluation of the students. Knowing the distribution of the students in the
fuzzy clusters is very valuable information for the lecturers/teaching assistants
while they are formulating the assignments and course projects of various
courses.

Athens Journal of Sciences X Y
11
Conclusions
In this paper we have discussed methods of using fuzzy cluster analysis in
the exploration of the students’ data in an educational information system and
to use the results to improve some critical procedures of a university like the
student advising, recommendations about the elective courses and prepare
better teaching approaches.
Firstly we made a theoretical discussion about some of the most widely-
used fuzzy clustering techniques like the fuzzy c-means algorithm, the
Gustafson-Kessel algorithm, possibilistic fuzzy clustering and kernel-based
fuzzy clustering algorithm. Also we discussed the critical problem of cluster
validation which enables the estimation of the quality of the generated clusters.
We observed that the fuzzy clustering results provide flexibility in the
characterization of the student profiles, which is very useful in the student
advising process.
Another useful application of the cluster analysis was to develop
recommendations for the student for their choices about the elective course.
We have clustered the students based on their previous performances on the
related courses.
References
Bedalli, E. & Ninka, I., 2013. Implementation of some cluster validity methods for
fuzzy cluster analysis, ISCIM 2013.
Eschrich, S., Ke, J., Hall, L. O. and Goldgof, D. B., 2003, Fast accurate fuzzy
clustering through data reduction, Fuzzy Systems, IEEE Transactions , 262-270.
Graves, D. & Pedrycz, W., 2010, “Kernel-based fuzzy clustering and fuzzy clustering:
A comparative experimental study”, Fuzzy Sets and Systems, Vol. 161, Issue 4.
Hogo, M. A., 2010, Evaluation of e-learners behavior using different fuzzy clustering
models: a comparative study. arXiv preprint arXiv:1003.1499.
Hoppner, F., Klawonn, F. , Kruse, R., and Runkler, T., 1999, Fuzzy Cluster Analysis,
Wiley, 35-43.
Liu, H., Jeng, B., Yih, J., and Yu, Y., 2009, “Fuzzy C-Means Algorithm Based on
Standard Mahalanobis Distances”, International Symposium on Information
Processing (ISIP ‘09.).
Miyamoto, S., Ichihashi, H., and Honda, K., 2008, Algorithms for fuzzy clustering
(Methods in c-Means Clustering with Applications), Springer, 43 -57.
Ojeda-Magafia, B., Ruelas, R., Corona-Nakamura, M. A., & Andina, D., 2006, An
improvement to the possibilistic fuzzy c-means clustering algorithm, Automation
Congress, 2006. WAC'06. World (pp. 1-8).
Pal, N. R., Pal, K., Keller, J. M., & Bezdek, J. C., 2005, A possibilistic fuzzy c-means
clustering algorithm. Fuzzy Systems, IEEE Transactions 517-530.
Romero, C. & Ventura, S., 2010, Educational data mining: a review of the state of the
art. Systems, Man, and Cybernetics, Part C: Applications and Reviews, IEEE
Transactions on, 40(6), 601-618.
Talavera, L. & Gaudioso, E., 2004, Mining student data to characterize similar
behavior groups in unstructured collaboration spaces. Proceedings of the

Vol. X, No. Y Bedalli et al.: Exploring an Educational System’s Data...
12
Artificial Intelligence in Computer Supported Collaborative Learning Workshop
at the ECAI 2004, 17-23.
Zhang, D. Q. & Chen, S.C., 2003, Kernel-based fuzzy and possibilistic c-means
clustering, Proceedings of the International Conference Artificial Neural Network
(pp. 122-125).