exploration for offshore heavy mineral sands by grupo ... · heavy mineral sand deposits are a ......
TRANSCRIPT
EXPLORATION FOR OFFSHORE HEAVY MINERAL SANDS 163
Introduction
In 2008 SRK Exploration Services Ltd (SRKES) werecommissioned by Golden Lane Ltd to review the currentstatus of GMEC’s exploration programme for heavymineral sands along the Caribbean coast of Colombia.Golden Lane Ltd. is registered in St. Vincent and
Grenadines and hold 75% of GMEC, through which theyconduct operations in Colombia.
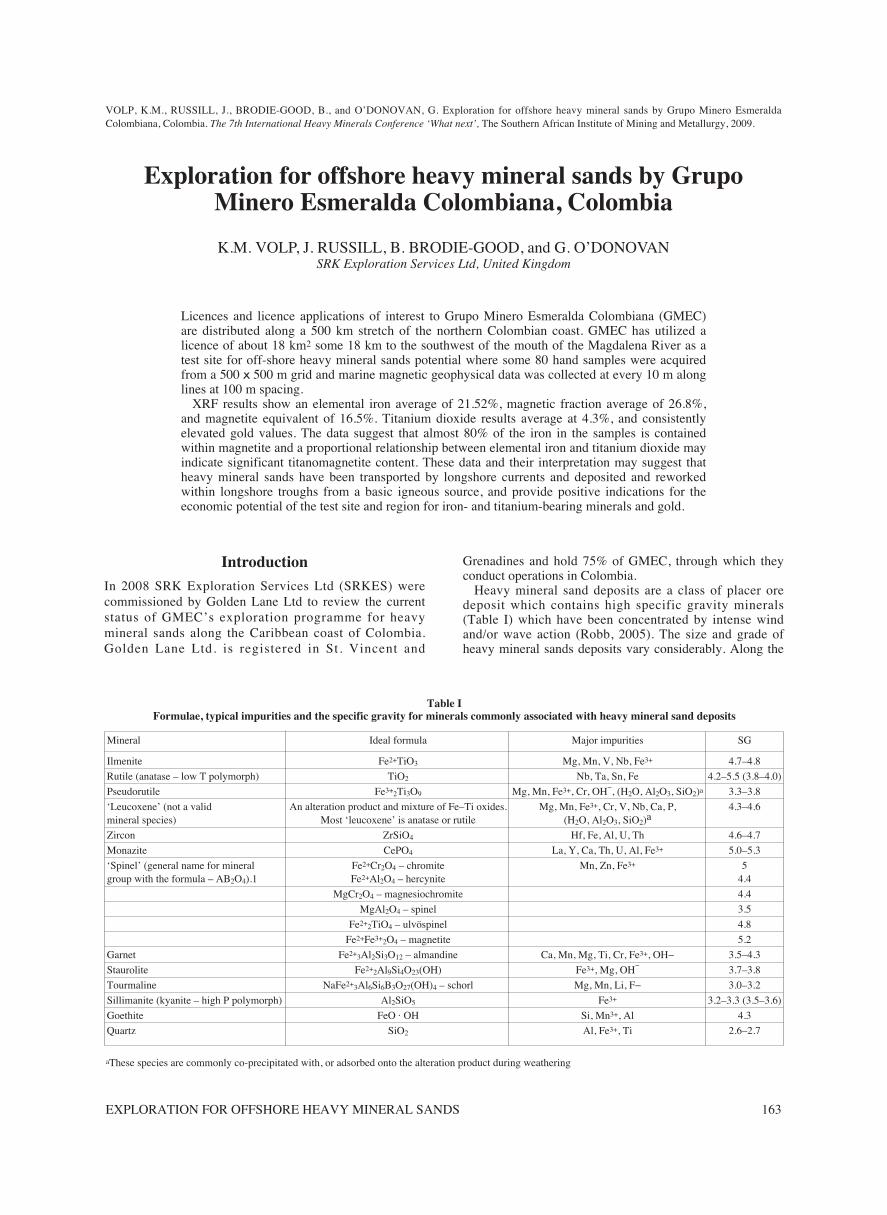
Heavy mineral sand deposits are a class of placer oredeposit which contains high specific gravity minerals(Table I) which have been concentrated by intense windand/or wave action (Robb, 2005). The size and grade ofheavy mineral sands deposits vary considerably. Along the
VOLP, K.M., RUSSILL, J., BRODIE-GOOD, B., and O’DONOVAN, G. Exploration for offshore heavy mineral sands by Grupo Minero EsmeraldaColombiana, Colombia. The 7th International Heavy Minerals Conference ‘What next’, The Southern African Institute of Mining and Metallurgy, 2009.
Exploration for offshore heavy mineral sands by GrupoMinero Esmeralda Colombiana, Colombia
K.M. VOLP, J. RUSSILL, B. BRODIE-GOOD, and G. O’DONOVANSRK Exploration Services Ltd, United Kingdom
Licences and licence applications of interest to Grupo Minero Esmeralda Colombiana (GMEC)are distributed along a 500 km stretch of the northern Colombian coast. GMEC has utilized alicence of about 18 km2 some 18 km to the southwest of the mouth of the Magdalena River as atest site for off-shore heavy mineral sands potential where some 80 hand samples were acquiredfrom a 500 x 500 m grid and marine magnetic geophysical data was collected at every 10 m alonglines at 100 m spacing.
XRF results show an elemental iron average of 21.52%, magnetic fraction average of 26.8%,and magnetite equivalent of 16.5%. Titanium dioxide results average at 4.3%, and consistentlyelevated gold values. The data suggest that almost 80% of the iron in the samples is containedwithin magnetite and a proportional relationship between elemental iron and titanium dioxide mayindicate significant titanomagnetite content. These data and their interpretation may suggest thatheavy mineral sands have been transported by longshore currents and deposited and reworkedwithin longshore troughs from a basic igneous source, and provide positive indications for theeconomic potential of the test site and region for iron- and titanium-bearing minerals and gold.
Mineral Ideal formula Major impurities SG
Ilmenite Fe2+TiO3 Mg, Mn, V, Nb, Fe3+ 4.7–4.8
Rutile (anatase – low T polymorph) TiO2 Nb, Ta, Sn, Fe 4.2–5.5 (3.8–4.0)
Pseudorutile Fe3+2Ti3O9 Mg, Mn, Fe3+, Cr, OH−, (H2O, Al2O3, SiO2)a 3.3–3.8
‘Leucoxene’ (not a valid An alteration product and mixture of Fe–Ti oxides. Mg, Mn, Fe3+, Cr, V, Nb, Ca, P, 4.3–4.6mineral species) Most ‘leucoxene’ is anatase or rutile (H2O, Al2O3, SiO2)a
Zircon ZrSiO4 Hf, Fe, Al, U, Th 4.6–4.7
Monazite CePO4 La, Y, Ca, Th, U, Al, Fe3+ 5.0–5.3
‘Spinel’ (general name for mineral Fe2+Cr2O4 – chromite Mn, Zn, Fe3+ 5group with the formula – AB2O4).1 Fe2+Al2O4 – hercynite 4.4
MgCr2O4 – magnesiochromite 4.4
MgAl2O4 – spinel 3.5
Fe2+2TiO4 – ulvöspinel 4.8
Fe2+Fe3+2O4 – magnetite 5.2
Garnet Fe2+3Al2Si3O12 – almandine Ca, Mn, Mg, Ti, Cr, Fe3+, OH− 3.5–4.3
Staurolite Fe2+2Al9Si4O23(OH) Fe3+, Mg, OH− 3.7–3.8
Tourmaline NaFe2+3Al6Si6B3O27(OH)4 – schorl Mg, Mn, Li, F− 3.0–3.2
Sillimanite (kyanite – high P polymorph) Al2SiO5 Fe3+ 3.2–3.3 (3.5–3.6)
Goethite FeO · OH Si, Mn3+, Al 4.3
Quartz SiO2 Al, Fe3+, Ti 2.6–2.7
Table IFormulae, typical impurities and the specific gravity for minerals commonly associated with heavy mineral sand deposits
aThese species are commonly co-precipitated with, or adsorbed onto the alteration product during weathering
HEAVY MINERALS 2009164
shoreline, deposits are typically 100 or 200 metres wide, 5 to 20 metres thick and 2 to 20 kilometres long. Heavymineral grades vary from several per cent to 90 per cent.Dunal deposits close to the shore tend to be larger, moreirregular and lower grade. These deposits typically containpercentages of high specific gravity minerals that vary from10 wt% to 35 wt% with economies of scale being the mainadvantage for larger deposits (Rozendaal et al., 1999).Ilmenite (TiFeO3) is typically the principal product, withzircon (ZrSiO4) and rutile (TiO2) as co-products and highquality pig iron and monazite as possible by-products.Ilmenite, rutile and ‘synthetic rutile’ (upgraded ilmenite)are the most important sources for titanium dioxide and arean indirect source of titanium metal (Tyler and Minnitt,2004).
Colombia is a globally significant producer of nickelalthough the Colombian mining industry is dominated bythe production of coal, natural gas and crude petroleum.Colombia is historically recognized as the world’s leadingexporter of emeralds but it is not known for heavy mineral
sands exploration and until recent political changesColombia was not a subject of international explorationinterest. Today, leading international mining houses such asAngloGold Ashanti Limited, BHP Billiton Plc, Xstrata Plcand Vale do Rio Doce hold significant interests inColombia.
GMEC’s interest in heavy mineral sands began withanecdotal information regarding black sands along theCaribbean coast near Baranquilla. Black sands are heavymineral sands in which quantities of the darker heavyminerals such as magnetite, titanomagnetite, ilmenite andrutile may be sufficient for economic recovery.
Background
Caribbean black sands in Colombia
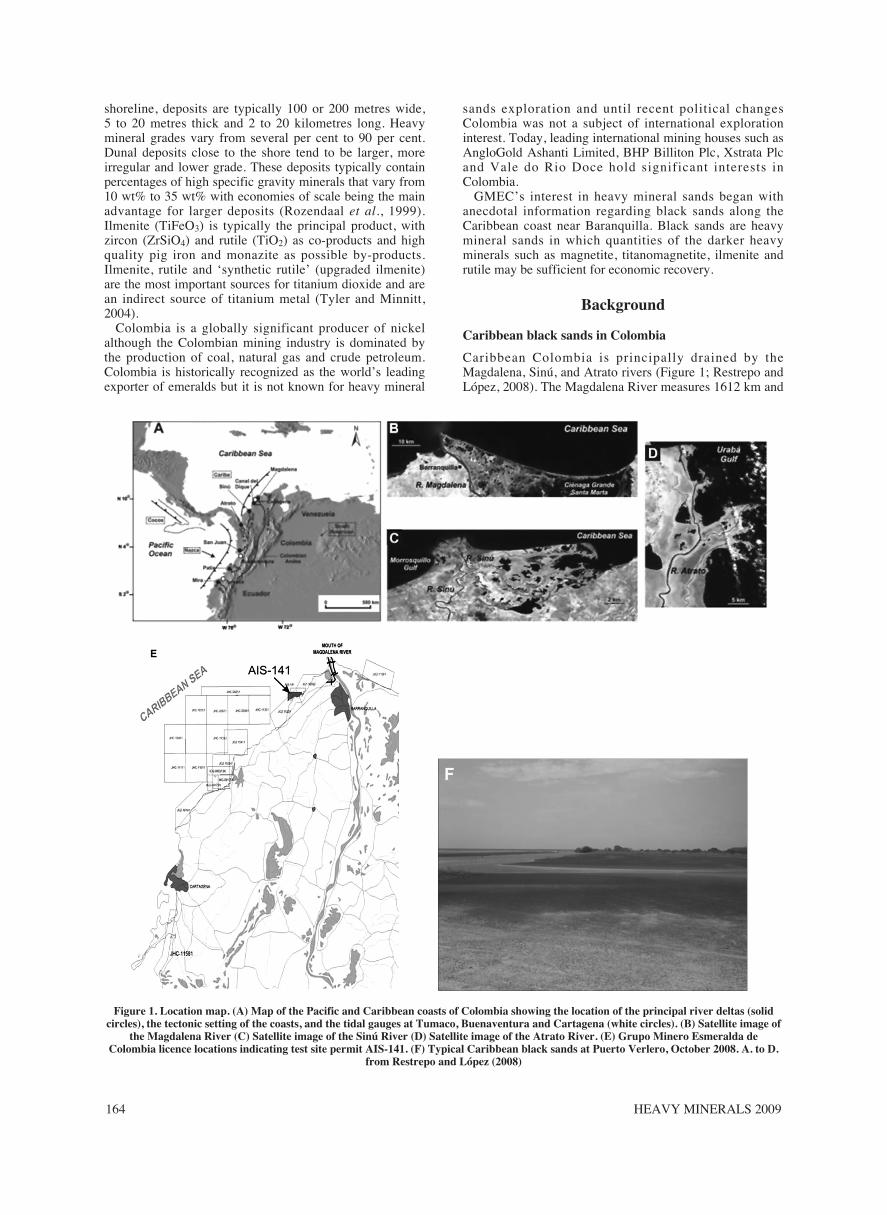
Caribbean Colombia is principally drained by theMagdalena, Sinú, and Atrato rivers (Figure 1; Restrepo andLópez, 2008). The Magdalena River measures 1612 km and
Figure 1. Location map. (A) Map of the Pacific and Caribbean coasts of Colombia showing the location of the principal river deltas (solidcircles), the tectonic setting of the coasts, and the tidal gauges at Tumaco, Buenaventura and Cartagena (white circles). (B) Satellite image of
the Magdalena River (C) Satellite image of the Sinú River (D) Satellite image of the Atrato River. (E) Grupo Minero Esmeralda deColombia licence locations indicating test site permit AIS-141. (F) Typical Caribbean black sands at Puerto Verlero, October 2008. A. to D.
from Restrepo and López (2008)
EXPLORATION FOR OFFSHORE HEAVY MINERAL SANDS 165
drains a 257 438 km2 basin, which occupies a major portionof the Colombian Andes. It is the largest fluvial system inColombia and originates from headwaters in the AndeanCordillera at an elevation of about 3 300 m. The MagdalenaRiver has the highest sediment yield of any medium- orlarge-sized river along the whole eastern coast of SouthAmerica and is placed sixth in the world for sedimentdischarge with an estimated 30 million m3 of sedimentdeposited near the river mouth each year (Food andAgriculture Organization of the United Nations, 2006). Ithas an arcuate delta with an emergent area of 1 690 km2,the largest delta in Colombia and is classified as wave-dominated system which consists of alluvial plains,marginal lagoon systems and beach ridges and the receivingbasin is characterized by sedimentation, slumping andcompressional tectonics (Vernette et al., 1992; Restrepoand López, 2008). The delta mouth empties into an offshorechannel-canyon complex with a steep slope (40°) and muchof the material has passed over the continental slope to formthe Magdalena Fan (Shepard, 1973; Martinez et al., 1990).The Atrato River drains a basin of 35 700 km2 and occupiesa considerable portion of the Pacific basin, but the riverempties into the Caribbean via the Urabá Gulf. The AtratoRiver has an area of 672 km2 and a river-dominated deltawith bird-foot morphology (Restrepo and López, 2008).The Sinú River delta has a sub-aerial area of 26 km2 and isclassified as a river and wave-dominated system anddelivers its sediments into the largest portion of thecontinental shelf (Serrano, 2004).
Tectonically, Caribbean Colombia is characterized by theconvergence of the South American and Caribbean tectonicplates and the Panama–Colombia border area near theAtrato river delta is one of the most seismically active areasin northwestern South America (Trenkamp et al., 2002).
Most of the rivers entering the Caribbean in this regionturn sharply to the west-southwest at their mouths and flowparallel to the shore behind barrier bars before entering theocean, reflecting the predominant northeasterly winds andcurrents which cause northeast-to-southwest longshore drift(Martinez et al. 1990). Black sands are said to have begunto appear along the stretch of coast near Puerto Colombiaafter the channel at the mouth of the Magdalena River wasstabilized by a large jetty system which was completed in1935 and provided a deep water channel that would allowlarge shipping to reach the main port at Barranquilla.Martinez et al. (1990) studied the changes in the MagdalenaRiver mouth and coastal sand bodies. Photographicevidence shows that the western delta front retreated andcoastal sand bodies formed, shifted and accreted. Theyestimated sand migration rates to be as high as 430 m/yr(Martinez et al. 1990). Martinez et al. (1990) consideredthat the jetty system was at least indirectly responsible forthese changes but that the transported sands which lead tothe buildup of downstream sand bodies may have beenderived from the immediate vicinity of the jetty system, theretreating delta front of the Magdalena River, thecontinental shelf, or elsewhere as a result of the changes inwave patterns produced by the jetty system. Today, blacksand beaches dominate from Barranquilla towardsCartagena in the southwest (Figure 1).
GMEC’s areas of interestMost of GMEC’s areas of interest are located in the areabetween Puerto Colombia, to the west of the mouth of theMagdalena River, and Cartagena (Figure 1). These areeasily accessed via of Barranquilla, one of Colombia’s
major cities. There are an additional two licences along thecoast to the south of Cartagena, and a further three near themouth of the Atrato River. The licence areas are generallyoffshore, with some containing onshore areas. Licenceareas that are close to the shore generally compriseshallower water with average water depths of about 8 m andthose further offshore have water depths of up to 150 m.The licences are distributed along a total coastal length ofapproximately 500 km. To date GMEC’s exploration hasfocused on assessing permit AIS-141 as a test site for heavymineral sands suitable for magnetic recovery.
Analogue marine iron sands and gold placer depositsCurrent operating heavy mineral sand mines are locatedonshore and commonly associated with surficial beach,dune, paleo-beach, paleo-dune or paleo-river material forthe recovery of zircon, rutile, leucoxene and ilmenite, inorder of relative value, e.g., Iluka Resources Limited (Iluka)in Australia (and the USA) and Exxaro Resources Ltd inSouth Africa. Pig iron is a typical by-product. There are,however, several large operations which focus on therecovery of iron sands, i.e., sands with economicconcentrations of iron-bearing minerals e.g., mining on thenorth coast of KwaZulu-Natal, South Africa, which isoperated by Richards Bay Minerals and the Waikato NorthHead and Taharoa mines of New Zealand (Carter, 1980;Lawton and Hochstein, 1993) which are operated by NewZealand Steel, and Cardero Resources Corp is expected tocommence production at the Pampa el Toro iron sandsproject in Peru in the near future (Cruise and Hoffman,2008). Richards Bay Minerals are said to have undertakenoffshore exploration; however, no information about thiswork was publicly available at the time of writing.
A strong demand for iron in recent years, particularlyfrom China, has led to the opening or reopening of lowergrade iron deposits (30%<Fe<64%) worldwide andexploration has expanded to included banded ironformation which has a typical iron grade of 20–40% Fe e.g.,the recently released resource estimate for the Numbara andSimbili targets at African Minerals Ltd’s Tonkolili iron oreproject in Sierra Leone have been estimated to have acombined resource of 4.7 billion tons (Bt) grading 29.9%Fe Total, 25.1% Fe Mag, 45.1% SiO2 and 4.7% Al2O3(SRK Consulting (UK) Ltd, 2009). There has evenapparently been interest in the production of iron ore fromheavy mineral sands tailings at Iluka’s projects in Australia(Sydney Morning Herald, August 22, 2008).
At this time no offshore ironsands exploration is knownto be underway although the Australian explorer, De GreyMining Ltd., has entered into an option to purchase the 640 m2 Fortescue Island exploration licence application,which has been interpreted (from aeromagnetic data) tocontain unconsolidated iron oxide minerals derived fromthe offshore in situ erosion of the Brockman IronFormation, the principal onshore source of high gradehaematite iron ores in Australia (Taylor et al., 2001).Historically, material derived from the onshore erosion ofthe Brockman Formation (with a combined resource of 38Mt @ 62% Fe derived from several discrete lenses) wasmined by Hamersley Iron Pty Limited from 1992 to1998 atBrockman Syncline No. 2 Detritals (Butt et al., 2001).
Worldwide, economic marine gold placer deposits arerare and the Nome gold placer deposit, Alaska, is one of themost well-known marine examples. From as early as1897–1962, the Nome area produced about 5 millionounces of gold and mining between 1987 to 1990 produced
HEAVY MINERALS 2009166
118 078 fine oz (a fine ounce is a troy ounce of 99.5% puregold) with an average recovered grade of 824 mg/m3
(Cronan, 2000; Zhou et al., 2007). The offshore area ofanomalous gold mineralization at Nome is orientatedparallel to the coast over an east-west distance of about 25km, reflecting the footprint of recent glacial deposition, thesource of the gold. The average background grades are inthe tens of mg/m3, with the highest concentrations andcoarsest particles are in sediments which lie between and onlobes of glacial material near the shore and are associatedwith the coarsest gravels. The grades at Nome areconsiderably more erratic than those of most alluvial goldplacers worldwide and magnetite and ilmenite are closelyassociated with the gold. Recent work at the Nome depositby Zhou et al. (2007) provides for a placer gold resourcebetween 113 767 oz (with a cutoff grade of 1 000 mg/m3)and 2 309 664 oz (with a cutoff grade of 0 mg/m3) withaverage grades which range from 1.929 g/m3 (with a cutoffgrade of 1000mg/m3) to 0.233 g/m3 (with a cutoff grade of0 mg/m3).
Sediment sampling methods and analysis
GMEC sediment sampling methodsGMEC planned and executed a field sampling programmeover permit AIS-141 in August and September 2008. Thesampling procedure was not determined or verified bySRKES. Eighty sand samples were collected from a 500 x500 m grid covering the permit area (Figure 2). Samplingwas undertaken by two scuba divers accompanied by ageologist who did not dive. The sampling site was locatedby utilizing a handheld Garmin GPS 76 situated in a smallboat from which the scuba divers would descend to theseabed directly below the boat. The diver followed asampling procedure whereby a hole was excavated to amaximum depth of about 100 cm and sand material wascollected from the base to the top of the excavation,excluding surficial debris or mud, to produce a sample ofapproximately 2.5 to 5 kg. The sampled material wasplaced in a plastic bag whilst underwater. For each sampleGMEC planned for the following information to berecorded: sample number; coordinates; depth of cover tosand; depth of hole; quality of sample (nominally as weak,average, good). Sea depth was measured using a flaggedrope. No details of local current, sea conditions or visibilitywere recorded but it is understood that the sea state wasgenerally quite rough with large swells and turbulent waterduring the sampling.
SRKES sediment sampling methodsSRKES visited GMEC’s northern areas of interest betweenthe 20th and the 30th October 2008 from Barranquilla toCartagena as well as the application area, JHC-11581,located to the south of Cartagena with the aim of observingGMEC’s sampling procedures and to review the localgeology and logistical considerations. SRKES sub-sampledGMEC’s previously collected 80 samples from AIS-141and added four new samples indicated by SRKES andcollected by GMEC following GMEC methodology duringthe field visit to AIS-141. Previously collected sampleswere homogenized within the original sample bag and asub-sample of between 500 and 800 g was taken and placedinto a clean sample bag. New sample numbers wereassigned (AIS-001 to AIS-083). SRKES was unable to visitthe south-western application areas including those near theAtrato river due to time and logistical constraints. Due to
the limitations of boating equipment available and the largeareas involved, only a land-based reconnaissance of thenorthern permit application areas was undertaken. Severalbeaches along the coast were also visited.
Sample analysisAll samples were prepared and analysed by OMACLaboratories in Ireland. Samples were firstly dried andmilled to <100 µ (code P4). Samples were then analysed byXRF for major oxides (Fe2O3, Al2O3, CaO, Cr2O3, K2O,MgO, MnO, Na2O, P2O5, SiO2, TiO2) with LOI at 1000°C.The method use was borate fusion X-ray fluorescence (codeBF/XRF). Silver (Ag) was prepared with aquia regiadigestion and analysed by Flame Atomic Absorption (codeGAR). Gold (Au), platinum (Pt) and palladium (Pd) wereanalysed by fire assay with ICPAES/MS (code PG).
Davis Tube tests were undertaken to determine themagnetic fraction of the samples and Satmagan analysiswas performed in order to determine concentrations ofmagnetic iron (magnetite equivalent). The Satmagan datawere calibrated by the Davis Tube test results in order tocalibrate the data specifically for the project material.OMAC carried out repeat analyses on every 10th sampleand the sample batch included three laboratory standardsand three laboratory blanks.
Geophysical surveyPermit AIS-141 was the first area surveyed by GMEC anddata was acquired by Moscow State University geophysicalconsultants without SRKES involvement between the 17thand 27th of November 2008 (Lygin, 2009). Surveyparameters were:
• Survey vessel—from 17 to 20 November a 9 mfibreglass boat was used and from 21 to 27 November a13 m fibreglass boat which was better able to handlethe sea conditions was utilized
• Magnetometers—two SeaSPY Marine Magnetometerstowed in longitudinal gradient mode with 10 m spacingbetween magnetometers in combination with aGeomatrix G858SX as the base station
• Sampling frequency—marine magnetometers at 1 secand base station at 20 sec
• Survey vessel velocity—<15 km/h• Water depth measurements—pressure and depth
sensors incorporated within magnetometers• Towing distance from vessel—40 m• Navigation—Garmin Etrex Legend Cx GPS• Coordinate system—WGS85 UTM Zone 18P• Survey line orientation—east-west with north-south
check lines and• Survey line spacing—100 m within the permit area and
increased to 500 m outside the permit area with 1 000 m check lines.
The survey was complicated by variable and difficultweather and sea conditions. It is understood that the seastate was generally quite rough with large swells andturbulent water which compromised the ability to maintainthe magnetometers at their optimum depth and tracking,potentially causing some deterioration of data quality.
The geophysical consultant, Mr Lygin of Moscow StateUniversity, applied standard processing routines to the dataincluding diurnal corrections using base station data, lagshift to correct for the difference between the position of themagnetometers and the navigation instruments on board theboat, and levelling to remove corrugation between lines inthe data.

EXPLORATION FOR OFFSHORE HEAVY MINERAL SANDS 167
Regional geology
Colombia covers large areas of the South American,Caribbean and Nazca tectonic plates (Figure 1). Thesubmerged portion of Colombia’s territory lies in thePacific Ocean and Caribbean Sea and covers a total area of828 660 km2. The emerged land, consisting mainly of rocksof the South American plate, covers an area of 1 143 748 km2 and comprises the Andean region and theLlanos plains. Most workers recognize a Late Jurassic rift
stage related to the separation of North and South America,a protracted Cretaceous period of passive-margin formationfollowing the rift event, a Palaeogene period of obliquecollision between a westward-moving Caribbean island arcand the passive margin of South America, and a Neogeneperiod of strike-slip faulting and Andean uplift to form theAndean region of Venezuela and Colombia (Ferero et al.,2002). Andean uplift in Colombia formed the ColombianMassif which divided into three mountain ranges, fromyoungest to oldest: Cordillera Oriental (eastern mountain
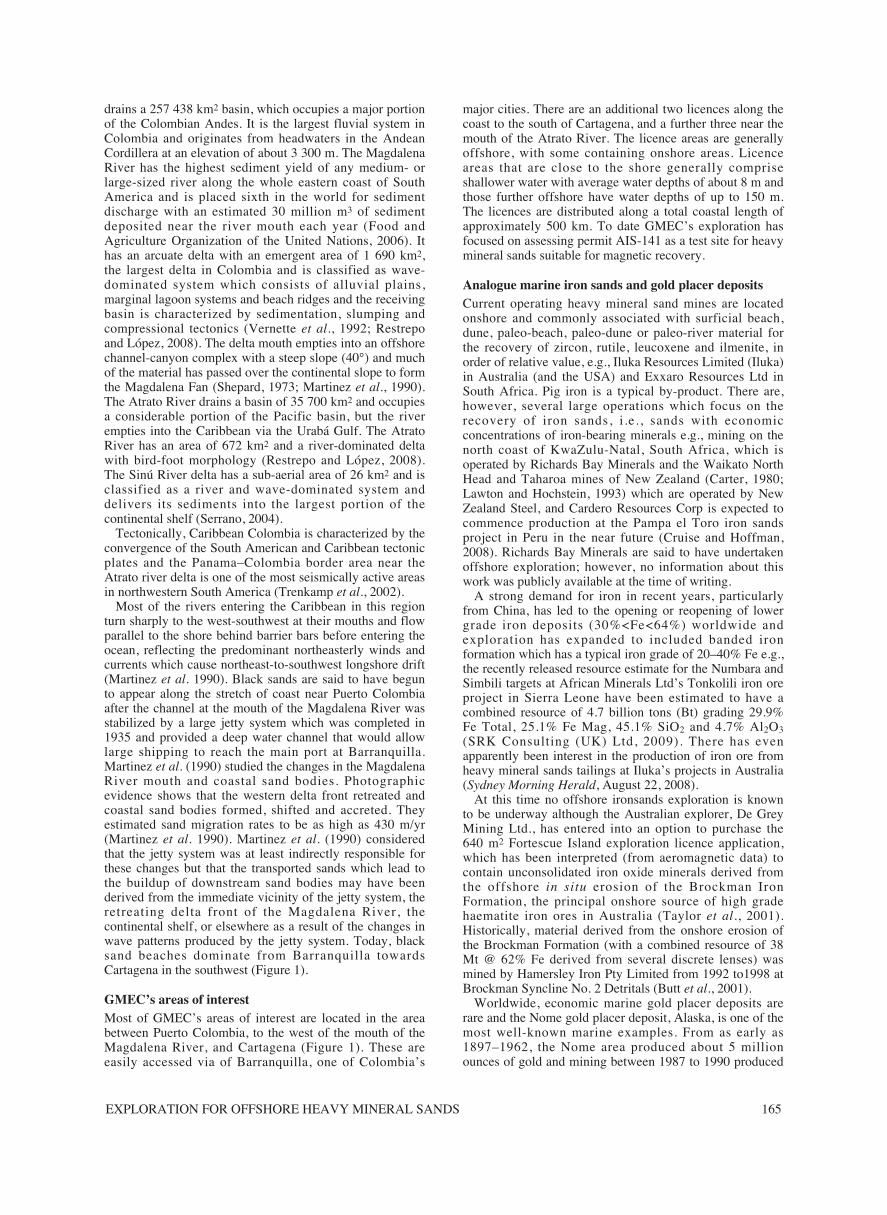
Figure 2. The geology around Barranquilla comprises Neogene rocks consisting of fine to coarse grained lithic and feldspathic areniteintercalated with mudstones, calcareous arenite, calcareous shales and coarse grained to conglomeratic quartzarenite overlain by
Quaternary marsh, alluvial and aeolian deposits and terruginous and reef carbonates. The major tectonic units are labelled: The Turbaco(1) and Cartagena (2) blocks of the Sinú Belt and the Luruaco (3), El Carmen (4), and Sincelejo (5) blocks of the Jacinto Belt. Modified after
Ferero et al. (2002)

HEAVY MINERALS 2009168
range), Cordillera Central (central mountain range) and theCordillera Occidental (western mountain range) separatedby valleys. The Cordillera Oriental is dominated bysedimentary units and was developed by the end of theTertiary period.
The Llanos Plains are divided into three subregions: thenorthern area, Macarena mountains and the southern area.The northern area is located between the Andes and theGuyana Shield and is characterized by savanna-like plains.It formed during the Tertiary period and is mostly coveredwith Quaternary sand and clay eroded from the Andes. TheMacarena Mountains area is centrally located within theLlanos plains and forms an area of elevated topographyorientated north-south and covering an area of 120 km longand 30 km wide. The mountains contain some of the oldestgeological formations in Colombia with rocks from theLower Precambrian forming part of the Amazon craton.The southern area comprises the Putumayo and AmazonRiver basins which are covered by dense jungle.
Local geologySince this paper focuses on GMEC’s work betweenCartagena and Barranquilla, this section concentrates on thelocal geology for the region between Cartagena andBaranquilla which comprises Palaeozoic to Recent agesedimentary rocks of the San Jacinto Belt in the east whichare separated from the marine and littoral deposits of theSinú Belt in the west by the Sinú Lineament (Figure 2;Ferero et al., 2002). The belts have historically beendivided into three anticlines but the Geological Survey ofColombia (Ferero et al., 2002) divides the region into
tectonic blocks, separated by transverse faults, inaccordance with their tectonic characteristics. The SanJacinto belt has been divided into the Luruaco, el Carmen,and Sincelejo blocks, and the Sinú belt into the Turbaco andCartagena blocks. The entire region is distinguished bythree zones of differing deformational characteristics,although the general stress regime was compressive in thedirection east-west, whereby the San Jacinto and Sinú Beltsare dominated by an imbricated thrust fault system,although the Sinú Belt is less deformed. The DiqueDepression is considered to have been generated byinferred normal faulting.
The extensive marsh deposits to the east of Barranquilla,on the eastern side of the Magdalena River, are consideredto contain sediments derived from deltaic and alluvialdeposits associated with the Magdalena River. Quaternaryterruginous and reef carbonates and calcareous sandstonesoccur in the Puerto Colombia area. To the west of PuertoColombia is an area of beach sands and gravels thatrepresent the ongoing formation of a spit which may beassociated with remobilization of sediments derived fromthe Magdalena delta. Near to Cartagena, older Miocene andEocene rocks comprising arenite, shale and mudstone areoverlain by extensive deposits of alluvial material andbeach sands and gravels.
Results and interpretation
XRF analytical resultsThe results from the analysis 83 samples from permit AIS-141 including four samples collected under SRKES
Sample Local grid WGS 84 E WGS 84 N Water Depth Hole Au Pt Pd Ag Fe Al2O3 CaO Cr2O3 K2O MgO MnO Na2O P2O5 SiO2 TiO2 LOI @ Davis Satmaganno. metres metres metres depth of cover ppb ppb ppb ppb wt% wt% wt% wt% wt% wt% wt% wt% wt% wt% 1000°C tube magnetite
metres metres metres wt% test wt% equivalent
AIS 001 A0 498322.68 1217586.09 11.4 0.02 0.6 832 8 <2 <0.3 15.92 6.92 4.06 0.09 1.18 1.39 0.2 1.66 0.163 54.58 4.36 2.19 16.28 10.2
AIS 002 A1 498324.21 1217086.36 8 0.02 0.6 3 <2 <2 <0.3 36.39 4.83 2 0.17 0.52 2.01 0.28 1.05 0.253 29.48 6.21 -0.64 51.53 31.7
AIS 003 A2 498325.74 1216586.62 10.2 0.03 0.5 8 <2 <2 <0.3 26.86 6.46 2.76 0.13 0.73 3.09 0.25 1.45 0.25 41.35 4.76 -0.12 35.81 21.8
AIS 004 A3 498327.27 1216086.89 8.4 1.02 1 9 <2 <2 <0.3 16.62 9.1 2.39 0.11 1.27 2.43 0.15 2.05 0.18 53.61 2.74 1.28 21.56 13.3
AIS 005 A4 498328.8 1215587.15 8.2 0.02 0.5 <2 <2 <2 <0.3 31.41 5.57 2.49 0.14 0.61 2.75 0.29 1.2 0.269 35.87 6.34 -1.1 41.77 25
AIS 006 A5 498330.33 1215087.42 8.4 0.02 0.5 <2 <2 <2 <0.3 31.95 5.3 2.67 0.14 0.54 3.24 0.32 1.1 0.296 32.44 6.88 -0.86 42.81 25.1
AIS 007 A6 498331.86 1214587.68 8.2 0.02 0.6 <2 <2 <2 <0.3 22.19 7.24 3.02 0.13 0.85 3.39 0.24 1.6 0.243 47.53 4.38 0.1 27.77 16.7
AIS 008 A7 498333.38 1214087.95 10.2 0.02 0.2 <2 <2 <2 <0.3 3.91 8.41 3.21 0.1 1.54 1.25 0.06 2.05 0.096 74.05 0.64 2.05 2.53 2.2
AIS 009 A8 498334.91 1213588.21 4.1 0.03 0.6 10 <2 <2 <0.3 16.9 8.69 2.48 0.12 1.09 2.37 0.15 1.93 0.181 53.8 2.85 1.12 21.67 13.2
AIS 010 B0 498822.41 1217587.62 10 0.04 0.6 664 <2 <2 <0.3 15.93 7.28 2.12 0.11 1.12 1.59 0.22 1.72 0.179 56.47 4.77 0.32 15.04 9.5
AIS 011 B1 498823.94 1217087.89 11 0.05 0.6 60 <2 <2 <0.3 27.74 6.34 2.58 0.13 0.81 2.59 0.24 1.47 0.237 38.06 4.99 0.42 38.46 23.6
AIS 012 B2 498825.47 1216588.15 10 0.01 0.6 778 <2 <2 <0.3 36.35 5.26 1.69 0.14 0.75 1.97 0.32 1.09 0.277 29.16 7.84 -0.8 48.92 28.9
AIS 013 B3 498827 1216088.42 7 0.02 0.7 32 <2 <2 <0.3 31.67 5.71 3.5 0.16 0.47 3.62 0.3 1.14 0.317 33.09 5.99 -0.24 41.86 25.2
AIS 014 B4 498828.53 1215588.68 6.1 0.02 0.4 294 <2 <2 <0.3 22.9 7.37 2.87 0.13 0.9 3 0.24 1.67 0.238 45.08 4.76 0.34 28.4 17.4
AIS 015 B5 498830.06 1215088.95 8.8 0.03 0.5 40 <2 <2 <0.3 12.88 9.13 2.83 0.11 1.19 2.85 0.15 2.04 0.189 59.2 2.33 0.61 14.59 9.3
AIS 016 B6 498831.59 1214589.21 11.2 0.2 0.4 <2 <2 <2 <0.3 3.02 10.99 1.78 0.08 1.94 1.3 0.05 2.56 0.097 73.14 0.47 2.15 0.54 1.2
AIS 017 B7 498833.12 1214089.48 6.8 0.04 0.6 6 <2 <2 <0.3 9.75 10.26 2.21 0.1 1.56 1.98 0.1 2.36 0.157 61.68 1.56 1.8 10.77 7.2
AIS 018 C0 499322.15 1217589.15 10.8 0.02 0.4 <2 <2 <2 <0.3 32.5 5.52 2.9 0.14 0.58 3.6 0.32 1.11 0.295 33.56 6.39 -0.56 43.02 25.6
AIS 019 C1 499323.68 1217089.42 9 0.17 0.5 103 <2 <2 <0.3 32.1 6.15 1.89 0.13 0.81 2.16 0.25 1.33 0.245 33.59 5.77 0.12 44.67 27.3
AIS 020 C2 499325.21 1216589.68 7 0.01 0.5 21 <2 <2 <0.3 30.66 5.8 2.15 0.14 0.69 2.51 0.28 1.29 0.256 36.36 6.1 -0.52 41.68 25.2
AIS 021 C3 499326.74 1216089.95 6.6 0.32 0.6 54 <2 <2 <0.3 22.83 7.35 3.28 0.13 0.83 3.53 0.26 1.5 0.257 44.24 4.87 0.22 27.62 16.8
AIS 022 C4 499328.27 1215590.21 9.2 0.02 0.6 7 <2 <2 <0.3 27.37 5.75 2.41 0.14 0.75 2.64 0.29 1.22 0.259 37.73 6.59 -0.38 35.35 20.8
AIS 023 C5 499329.8 1215090.48 8.6 0.04 0.6 <2 <2 <2 <0.3 35.3 5.09 2.05 0.15 0.61 2.69 0.29 1.14 0.271 32.28 6.37 -0.91 49.29 29.7
AIS 024 C6 499331.33 1214590.74 11.4 0.15 0.3 <2 <2 <2 <0.3 6.83 10.37 2.09 0.09 1.58 1.6 0.08 2.23 0.131 67.59 1.13 2.23 6.2 4.3
AIS 025 D0 499821.88 1217590.69 8.6 0.02 0.5 111 <2 <2 <0.3 32.27 5.55 2.08 0.17 0.71 2.04 0.24 1.23 0.23 35.32 5.34 -0.02 44.82 27.9
AIS 026 D1 499823.41 1217090.95 9.4 0.05 0.7 <2 <2 <2 <0.3 12.78 9.09 3.27 0.1 1.28 2.63 0.15 2.14 0.185 57.53 2.55 1.93 13.68 8.9
AIS 027 D2 499824.94 1216591.21 7.4 0.01 1 <2 <2 <2 <0.3 4.55 10.22 2.13 0.09 1.82 1.31 0.07 2.37 0.097 72.23 0.89 1.94 2.74 2.4
AIS 028 D3 499826.48 1216091.48 10 0.3 1.1 152 <2 <2 <0.3 23.63 7.26 2.16 0.12 1.1 2.29 0.22 1.69 0.213 44.24 4.49 0.16 30.82 19.3
Table IIGeochemical results for permit AIS-141

EXPLORATION FOR OFFSHORE HEAVY MINERAL SANDS 169
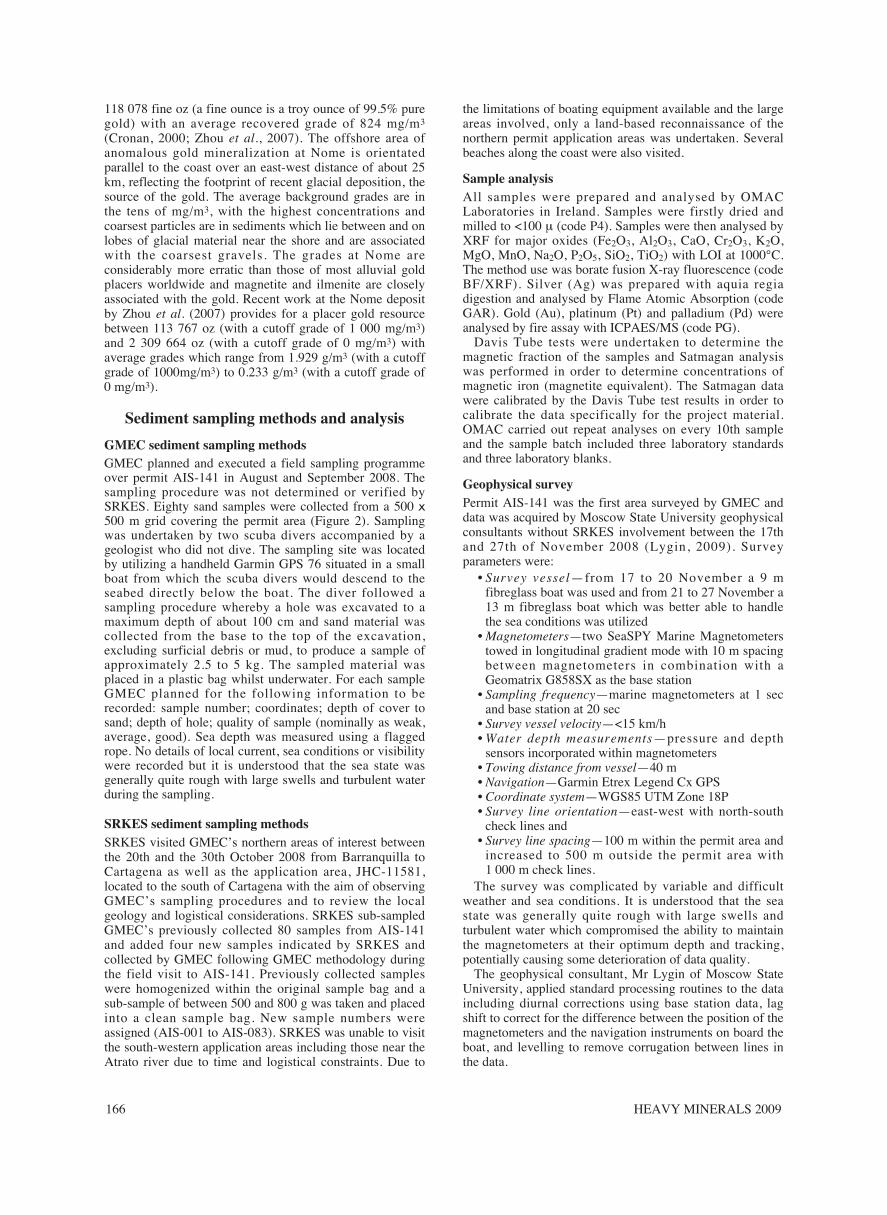
supervision are provided in Table II. AIS-141 data indicatesthat the average percentage for elemental iron is 21.52% Fe,the magnetic fraction is 26.8%, and magnetic iron(magnetite equivalent) is 16.5%. These data suggest thatalmost 80% of the iron in the samples is contained withinmagnetite. Values for magnetite equivalent are consistentlyabove 50% of the total magnetic fraction and may indicatethat a proportion of magnetic iron is intimately associated
with other minerals (Figure 3). There is a proportionalrelationship between elemental iron and titanium oxides(Figure 3) which suggests that the material analysed maycontain significant titanomagnetite and is supported bycorrelations between iron and other oxides such aschromium and manganese. Such correlations may indicatethat the magnetic material was derived from mafic rocks.
Elemental iron grades are heterogeneously distributed
Sample Local grid WGS 84 E WGS 84 N Water Depth Hole Au Pt Pd Ag Fe Al2O3 CaO Cr2O3 K2O MgO MnO Na2O P2O5 SiO2 TiO2 LOI @ Davis Satmaganno. metres metres metres depth of cover ppb ppb ppb ppb ppb wt% wt% wt% wt% wt% wt% wt% wt% wt% wt% wt% 1000°C tube magnetite
metres metres metres wt% test wt% equivalent
AIS 029 D4 499828.01 1215591.74 7.6 0.01 0.8 267 <2 <2 <0.3 40.7 4.28 2.49 0.17 0.35 2.75 0.36 0.8 0.31 23.33 8.06 -1.05 54.71 33.4
AIS 030 D5 499829.53 1215092 8.4 0.03 0.7 279 <2 <2 <0.3 27.95 6.71 2.28 0.12 0.84 2.4 0.27 1.4 0.242 38.92 5.86 -0.24 35.39 21.9
AIS 031 D6 499831.06 1214592.27 9.2 0.04 0.3 6 <2 <2 <0.3 4.12 10.38 6 0.07 1.7 1.62 0.07 2.25 0.122 63.55 0.62 6.19 1.39 1.7
AIS 032 E0 500321.62 1217592.22 9.2 0.03 0.4 80 <2 <2 <0.3 26.57 6.5 2.75 0.16 0.77 2.96 0.29 1.39 0.26 38.64 5.77 0.88 32.15 19.8
AIS 033 E1 500323.15 1217092.48 8.6 0.01 0.5 39 <2 <2 <0.3 24.77 6.68 3.38 0.13 0.69 3.88 0.3 1.33 0.271 40.39 5.48 0.1 30.35 18.4
AIS 034 E2 500324.68 1216592.74 7.6 0.01 0.5 <2 <2 <2 <0.3 28.59 6.32 3.2 0.16 0.68 3.49 0.27 1.35 0.283 38.5 5.3 -0.06 37.53 22.9
AIS 035 E3 500326.21 1216093.01 7.6 0.05 0.6 57 <2 <2 <0.3 26.8 6.43 2.75 0.14 0.72 2.86 0.29 1.35 0.242 39.71 5.81 -0.12 32.96 20.6
AIS 036 E4 500327.74 1215593.27 8 0.03 0.7 29 <2 <2 <0.3 19.86 7.83 2.96 0.11 0.94 2.95 0.26 1.64 0.235 47.95 5.03 0.49 21.23 13.3
AIS 037 E5 500329.27 1215093.53 7.8 0.02 0.5 7 <2 <2 <0.3 5.7 9.62 2.83 0.09 1.25 2.16 0.1 2.17 0.155 70.31 1.07 1.51 4.05 3.1
AIS 038 F0 500821.36 1217593.75 9 0.02 0.2 21 <2 <2 <0.3 24.09 6.82 2.54 0.13 0.8 2.35 0.24 1.44 0.248 44.36 4.84 0.2 29.85 18.9
AIS 039 F1 500822.89 1217094.01 8.2 0.8 1 <2 <2 <2 <0.3 10.29 8.83 3.51 0.09 1.01 2.92 0.14 1.93 0.225 62.11 2.11 1.55 9.82 6.5
AIS 040 F2 500824.42 1216594.28 9.1 0.01 1 <2 <2 <2 <0.3 20.45 7.55 4.35 0.12 0.65 4.18 0.27 1.54 0.308 47.48 4.47 0.18 22.25 13.9
AIS 041 F3 500825.95 1216094.54 8.3 0.03 0.6 1572 <2 <2 <0.3 19.57 7.52 2.23 0.11 0.96 1.9 0.26 1.6 0.22 49.46 5.8 0.46 19.08 12
AIS 042 F4 500827.48 1215594.8 7.5 0.02 0.7 1959 <2 <2 <0.3 25.64 6.09 2.61 0.1 0.64 2.29 0.34 1.25 0.288 39.4 7.72 -0.04 26.69 16.3
AIS 043 F5 500829.01 1215095.06 7.4 0.05 0.7 2591 4 <2 <0.3 32.28 5.05 2.42 0.13 0.51 2.31 0.42 1.04 0.311 31.2310.03 -0.64 32.73 19.9
AIS 044 G0 501321.09 1217595.28 10.4 0.03 0.6 4 <2 <2 <0.3 3.97 14.18 1.7 0.05 1.68 2.08 0.06 2.08 0.154 63.08 0.72 6.04 0.1 0.5
AIS 045 G1 501322.63 1217095.54 10 1.2 1.3 <2 <2 <2 <0.3 7.37 10.56 2.37 0.07 1.51 1.88 0.09 2.21 0.152 66.23 1.29 2.51 6.3 4.4
AIS 046 G2 501324.16 1216595.81 8 0.5 0.6 <2 <2 <2 <0.3 16.73 8.12 3.45 0.12 0.96 3.15 0.2 1.66 0.251 52.86 3.26 1.08 19.61 12.1
AIS 047 G3 501325.69 1216096.07 7.6 0.02 1 13 <2 <2 <0.3 27.14 6.25 2.58 0.14 0.68 2.41 0.3 1.29 0.274 39.75 6.29 -0.06 32.71 20.2
AIS 048 G4 501327.22 1215596.33 7.2 0.02 1 7 <2 <2 <0.3 17.91 7.59 2.91 0.1 0.89 2.52 0.2 1.62 0.243 51.54 3.75 0.69 21.3 13.3
AIS 049 H0 501820.83 1217596.82 8.6 0.04 0.6 <2 <2 <2 <0.3 19.87 7.79 3.13 0.11 0.91 3.17 0.2 1.75 0.234 50.9 3.66 0.62 24.6 15.1
AIS 050 H1 501822.36 1217097.08 8 0.1 0.6 13 <2 <2 <0.3 27.7 6.36 2.95 0.14 0.68 2.95 0.25 1.32 0.271 39.36 4.85 -0.04 37.46 22.9
AIS 051 H2 501823.9 1216597.34 7.8 0 0.6 12 <2 <2 <0.3 27.13 6.5 3.26 0.15 0.68 3.5 0.26 1.3 0.282 39.62 4.97 0.24 35.68 21.5
AIS 052 H3 501825.43 1216097.6 7.6 0 0.6 <2 <2 <2 <0.3 32.12 5.48 2.81 0.17 0.52 3.38 0.33 1.01 0.301 31.9 6.51 -0.24 43.07 25.6
AIS 053 H4 501826.96 1215597.86 7.4 0.12 0.7 11 <2 <2 <0.3 22.37 7.07 2.77 0.13 0.82 2.7 0.22 1.46 0.231 44.81 4.25 0.43 29.3 18
AIS 054 I0 502320.57 1217598.35 9 0.03 0.6 2 <2 <2 <0.3 25.66 6.61 3.75 0.13 0.64 3.76 0.32 1.28 0.348 39.4 6.06 0 30.25 18.2
AIS 055 I1 502322.1 1217098.61 8.2 0.4 0.6 <2 <2 <2 <0.3 22.75 7.26 2.12 0.12 1 2.08 0.19 1.67 0.202 46.82 3.82 0.44 30.77 19.2
AIS 056 I2 502323.63 1216598.87 7.8 0.02 0.3 4 <2 <2 <0.3 21.31 7.54 3.81 0.14 0.77 3.69 0.23 1.52 0.282 45.45 3.83 0.7 27.11 16
AIS 057 I3 502325.17 1216099.13 7.6 0.01 0.6 3 <2 <2 <0.3 22.56 7.13 2.6 0.13 0.88 2.29 0.21 1.5 0.214 46.63 4.12 0.62 29.34 18.2
AIS 058 I4 502326.7 1215599.39 7.2 0.3 0.6 4 <2 <2 <0.3 24.15 7.09 2.38 0.14 0.89 2.31 0.2 1.58 0.198 44.74 3.98 0.65 32.81 20.4
AIS 059 I5 502328.22 1215099.65 6.4 0.2 0.6 22 <2 <2 <0.3 20.97 7.72 2.19 0.12 1.1 2.17 0.18 1.77 0.192 47.79 3.43 0.32 28.11 17.9
AIS 060 J0 502820.31 1217599.88 8.8 0.6 0.6 6 <2 <2 <0.3 13.66 8.99 4.41 0.09 0.89 3.57 0.2 1.71 0.34 55.44 2.95 1.49 13.17 8.2
AIS 061 J1 502821.84 1217100.14 8 0.02 0.4 21 <2 <2 <0.3 7.6 3.94 0.13 0.78 3.78 0.23 1.47 0.298 46.52 3.81 0.57 25.87 174
AIS 062 J2 502823.37 1216600.4 7.8 0.5 0.6 9 <2 <2 <0.3 22.74 7.27 2.86 0.14 0.88 2.62 0.2 1.59 0.221 46.37 3.85 0.61 29.96 18.6
AIS 063 J3 502824.91 1216100.66 7.4 0.03 0.6 49 <2 <2 <0.3 18.95 7.74 3.23 0.12 0.96 2.68 0.22 1.62 0.228 51.24 4 0.89 22.18 13.7
AIS 064 J4 502826.44 1215600.92 6.8 0.01 0.5 33 <2 <2 <0.3 27.52 6.43 2.13 0.14 0.81 1.9 0.21 1.48 0.205 39.78 4.42 -0.06 39.46 24.7
AIS 065 K0 503320.05 1217601.41 8 0.02 0.4 32 2 <2 <0.3 19.93 7.34 4.66 0.11 0.8 3.74 0.24 1.46 0.309 47.52 4.13 1.24 23.96 14.1
AIS 066 K1 503321.58 1217101.67 7.8 0.01 0.6 7 <2 <2 <0.3 23.2 6.89 2.22 0.13 0.94 1.84 0.18 1.56 0.189 48.1 3.64 0.1 31.37 19.8
AIS 067 K2 503323.12 1216601.93 7.7 0.02 0.6 26 <2 <2 <0.3 30.65 6.04 3.3 0.16 0.52 3.02 0.3 1.01 0.327 34.56 5.8 -0.3 40.89 24.5
AIS 068 K3 503324.65 1216102.19 6.8 0.3 0.6 6 <2 <2 <0.3 32.05 5.57 3.43 0.17 0.5 3.85 0.34 0.98 0.344 31.05 6.61 -0.18 43.17 25.3
AIS 069 K4 503326.18 1215602.45 6 0.03 0.8 2 <2 <2 <0.3 5.12 10.81 3.01 0.07 1.35 2.46 0.1 2.21 0.19 67.64 1.04 2.24 1.76 1.9
AIS 070 L0 503819.79 1217602.94 7.8 0.01 0.6 4 <2 <2 <0.3 40.91 3.85 2.01 0.16 0.32 2.17 0.35 0.73 0.294 20.49 7.92 -1.22 55.93 34.6
AIS 071 L1 503821.33 1217103.2 8 0.02 0.6 8 <2 <2 <0.3 5.6 10.16 3.33 0.05 1.14 2.34 0.11 1.98 0.228 66.94 1.43 2.77 2.1 1.9
AIS 072 L2 503822.86 1216603.46 6.9 0.04 0.6 34 <2 <2 <0.3 20.5 7.45 3.49 0.13 0.86 3.42 0.23 1.48 0.284 47.82 4.22 0.67 25.14 14.8
AIS 073 L3 503824.39 1216103.72 6 0.02 0.6 3 <2 <2 <0.3 24.91 6.96 2.76 0.16 0.79 2.72 0.22 1.46 0.241 42.29 4.33 0.32 34.55 20.5
AIS 074 L4 503825.92 1215603.98 4.6 0.01 0.5 53 <2 <2 <0.3 21.31 7.39 3.04 0.12 0.88 2.42 0.21 1.42 0.288 48.4 4.06 0.52 26.7 16.4
AIS 075 M0 504319.53 1217604.48 8.2 0.03 1.2 27 <2 <2 <0.3 6.71 9.65 2.98 0.08 1.24 1.93 0.11 2 0.202 65.51 1.72 2.35 4.24 3.1
AIS 076 M1 504321.07 1217104.73 7 0.01 0.6 39 <2 <2 <0.3 19.34 7.58 3.34 0.12 0.8 2.58 0.21 1.47 0.302 50.39 4.09 0.57 22 13.8
AIS 077 M2 504322.6 1216604.99 7 0.01 0.3 <2 <2 <2 <0.3 25.39 6.59 2.45 0.13 0.79 2.64 0.24 1.43 0.233 43.29 4.66 0.2 33.38 20.4
AIS 078 N0 504819.28 1217606.01 7 0.1 0.6 661 <2 <2 1.3 11.74 9.07 2.08 0.09 1.21 1.66 0.15 1.9 0.17 60.1 3.16 1.37 10.55 7
AIS 079 N1 504820.81 1217106.26 7.2 0.2 0.8 6 <2 <2 <0.3 11.21 9.23 2.65 0.1 1.21 2.22 0.14 2.01 0.191 61.17 2.2 1.31 11.54 7.6
AIS 080 W-J4 502826.44 1215600.92 6.8 0.02 0.6 13 <2 <2 <0.3 34.82 5.4 1.9 0.16 0.67 1.97 0.25 1.18 0.232 32.49 5.43 -0.02 49.1 30.3
AIS 081 W-J4A 502826.44 1215600.92 6.8 0.02 0.8 13 <2 <2 <0.3 5.92 9.93 2.86 0.08 1.39 1.94 0.1 2.13 0.177 69.45 1.35 2.38 3.43 2.8
AIS 082 W-F2 500824.42 1216594.28 8 0 0.5 17 <2 <2 <0.3 26.06 6.55 3.79 0.13 0.52 3.74 0.28 1.3 0.301 39.87 5.21 0.06 31.7 20
AIS 083 W-F4 500827.48 1215594.8 7.4 0.12 0.5 5 <2 <2 <0.3 17.08 7.94 3.1 0.12 0.94 2.69 0.19 1.74 0.227 53.14 3.36 1.02 19.82 12.6
Table II (continued)Geochemical Results for permit AIS-141

HEAVY MINERALS 2009170
across permit AIS-141 with higher grades predominantlylocated in the western half of permit AIS-141 and thereappears to be a directional increase in grade towards deeperwaters, particularly towards the northwest, which correlateswith the distribution of magnetic iron and is similar to thedistribution and grades of titanium oxide (av. 4.3%TiO2)(Figure 3). These trends may be a function of thephysiochemical similarities of iron and titanium oxides orindicate an intimate physical relationship, e.g., theagglomeration of particles, or intimate chemicalrelationship, e.g., the presence of titanomagnetite.
SRKES has carried out limited studies into thegeochemical variance of elemental iron grades in order toobtain information with respect to the optimal samplespacing for future exploration. This work indicates that thedistribution of higher grade material is relatively sporadicand that a sample spacing of 300 m may be moreappropriate for future resource estimation. This exercisealso revealed that there is an approximate trend to thedistribution of iron grades at 110–290º and this may alsohave an impact on future sampling spacing. It isrecommended that more detailed studies on variance arecarried out as part of the design of future explorationprogrammes.
Analytical results for Au, Ag, Pt and Pd have shownconsistently elevated Au values, above detection results inthree samples for Pt (AIS001, AIS043, and AIS065), and
above detection results in one sample for Ag (AIS78)(Table II). Gold data and their distribution are highlyvariable and requires significant work in order to define itsmode of occurrence and economic potential (Figure 3).
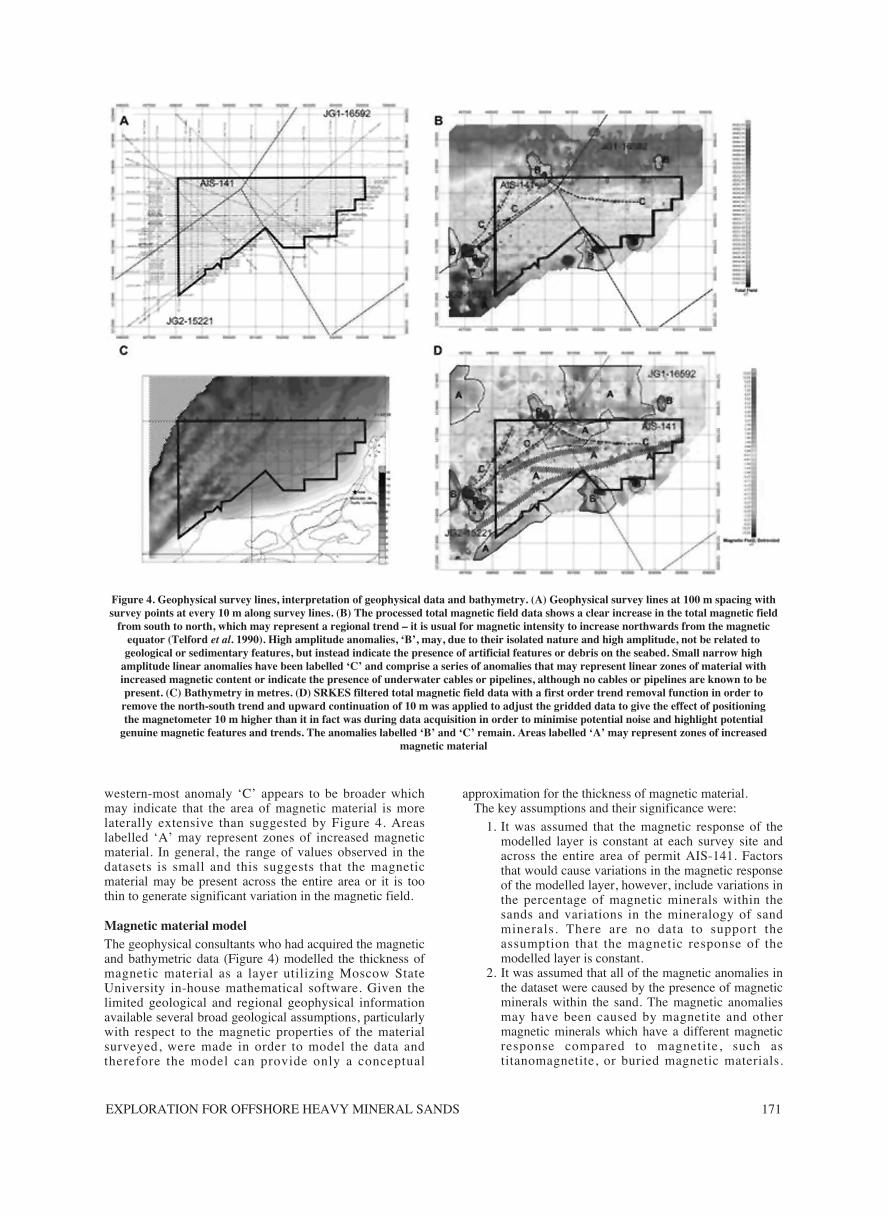
Magnetic survey resultsThe processed data (Figure 4) shows a clear increase in thetotal magnetic field from south to north, which mayrepresent a regional trend—it is usual for magnetic intensityto increase northwards from the magnetic equator (Telfordet al. 1990). There are a number of high amplitudeanomalies present, labelled ‘B’, which, due to their isolatednature and high amplitude may not be related to geologicalor sedimentary features, but instead, may indicate thepresence of artificial features or debris on the seabed. Smallnarrow high amplitude linear anomalies have been labelled‘C’ and comprise a series of anomalies that may representlinear zones of material with increased magnetic content orindicate the presence of underwater cables or pipelines,although no cables or pipelines are known to be present.
SRKES filtered these data with a first order trend removalfunction in order to remove the north-south trend. Inaddition an upward continuation of 10 m was applied toadjust the gridded data to give the effect of positioning themagnetometer 10 m higher than it in fact was during dataacquisition in order to minimize potential noise andhighlight potential genuine magnetic features and trends.
The anomalies labelled ‘B’ and ‘C’ remain, and the
Figure 3. Sample location and geochemical results for 83 hand samples acquired from a 500 x 500 m grid at permit AIS-141. (A) Sample location. (B) Geochemical results for elemental Fe. (C) Porportional relationship between elemental Fe and titanium dioxide.
(D) Geochemical results for Au
EXPLORATION FOR OFFSHORE HEAVY MINERAL SANDS 171
western-most anomaly ‘C’ appears to be broader whichmay indicate that the area of magnetic material is morelaterally extensive than suggested by Figure 4. Areaslabelled ‘A’ may represent zones of increased magneticmaterial. In general, the range of values observed in thedatasets is small and this suggests that the magneticmaterial may be present across the entire area or it is toothin to generate significant variation in the magnetic field.
Magnetic material modelThe geophysical consultants who had acquired the magneticand bathymetric data (Figure 4) modelled the thickness ofmagnetic material as a layer utilizing Moscow StateUniversity in-house mathematical software. Given thelimited geological and regional geophysical informationavailable several broad geological assumptions, particularlywith respect to the magnetic properties of the materialsurveyed, were made in order to model the data andtherefore the model can provide only a conceptual
approximation for the thickness of magnetic material. The key assumptions and their significance were:
1. It was assumed that the magnetic response of themodelled layer is constant at each survey site andacross the entire area of permit AIS-141. Factorsthat would cause variations in the magnetic responseof the modelled layer, however, include variations inthe percentage of magnetic minerals within thesands and variations in the mineralogy of sandminerals. There are no data to support theassumption that the magnetic response of themodelled layer is constant.
2. It was assumed that all of the magnetic anomalies inthe dataset were caused by the presence of magneticminerals within the sand. The magnetic anomaliesmay have been caused by magnetite and othermagnetic minerals which have a different magneticresponse compared to magnetite, such astitanomagnetite, or buried magnetic materials.
Figure 4. Geophysical survey lines, interpretation of geophysical data and bathymetry. (A) Geophysical survey lines at 100 m spacing withsurvey points at every 10 m along survey lines. (B) The processed total magnetic field data shows a clear increase in the total magnetic field
from south to north, which may represent a regional trend – it is usual for magnetic intensity to increase northwards from the magneticequator (Telford et al. 1990). High amplitude anomalies, ‘B’, may, due to their isolated nature and high amplitude, not be related togeological or sedimentary features, but instead indicate the presence of artificial features or debris on the seabed. Small narrow high
amplitude linear anomalies have been labelled ‘C’ and comprise a series of anomalies that may represent linear zones of material withincreased magnetic content or indicate the presence of underwater cables or pipelines, although no cables or pipelines are known to bepresent. (C) Bathymetry in metres. (D) SRKES filtered total magnetic field data with a first order trend removal function in order to remove the north-south trend and upward continuation of 10 m was applied to adjust the gridded data to give the effect of positioning the magnetometer 10 m higher than it in fact was during data acquisition in order to minimise potential noise and highlight potential
genuine magnetic features and trends. The anomalies labelled ‘B’ and ‘C’ remain. Areas labelled ‘A’ may represent zones of increasedmagnetic material
HEAVY MINERALS 2009172
Underlying geological units or structures may also causemagnetic anomalies. There are no data to support theassumption that all of the magnetic anomalies in the datasetwere caused by the presence of magnetic minerals withinthe sand.
Until suitable data are incorporated into the model areliable estimate for the thicknesses of magnetic materialwithin the sands cannot be obtained from these data.
The minimum modelled thickness of the magnetic layeris between 0.5 m and 2 m thick and trends across the centreof permit AIS-141 in an east-west direction and themaximum modelled thickness of the magnetic layer variesfrom <1 m to over 10 m. The geophysical consultantconcluded that there may be a good correlation between thetopography of the sea floor and the thickness of themodelled magnetic layer, i.e. an increase in magnetic layerthickness is associated with topographic lows such asdepressions or trenches on the sea floor, and a decrease inmagnetic layer thickness is associated with topographichighs. Bathymetric data show a series of northeast-trending‘trenches’ and a more subtle easterly-trending depression,all of which appear to correlate to increased thickness of themagnetic layer.
Discussion
Correlations between geochemical and magnetic dataThere do not appear to be strong or obvious correlationsbetween the sampling results and magnetic data in permitAIS-141. However, there are three potential correlations ofnote:
• A correlation may be interpreted between material ofincreased magnetic content in the western part of thepermit and an area of variable values in the totalmagnetic field which may indicate the presence ofvarying or increased quantities of magnetic material.Such an interpretation is also supported by an increasein thickness of the modelled magnetic layer andbathymetric lows in the same area.
• A northeasterly trend in higher elemental iron gradesmay be correlated with an increase in both the thicknessof the modelled magnetic layer and bathymetric lows.
• A relatively higher elemental iron grade may correlatewith a ‘B’ anomaly near the north-western corner ofpermit AIS-141. Such an interpretation may suggestthat ‘B’ anomalies indicate the presence of magneticmaterial; however, higher elemental iron grade samplesdo occur within areas of very low magnetic response.
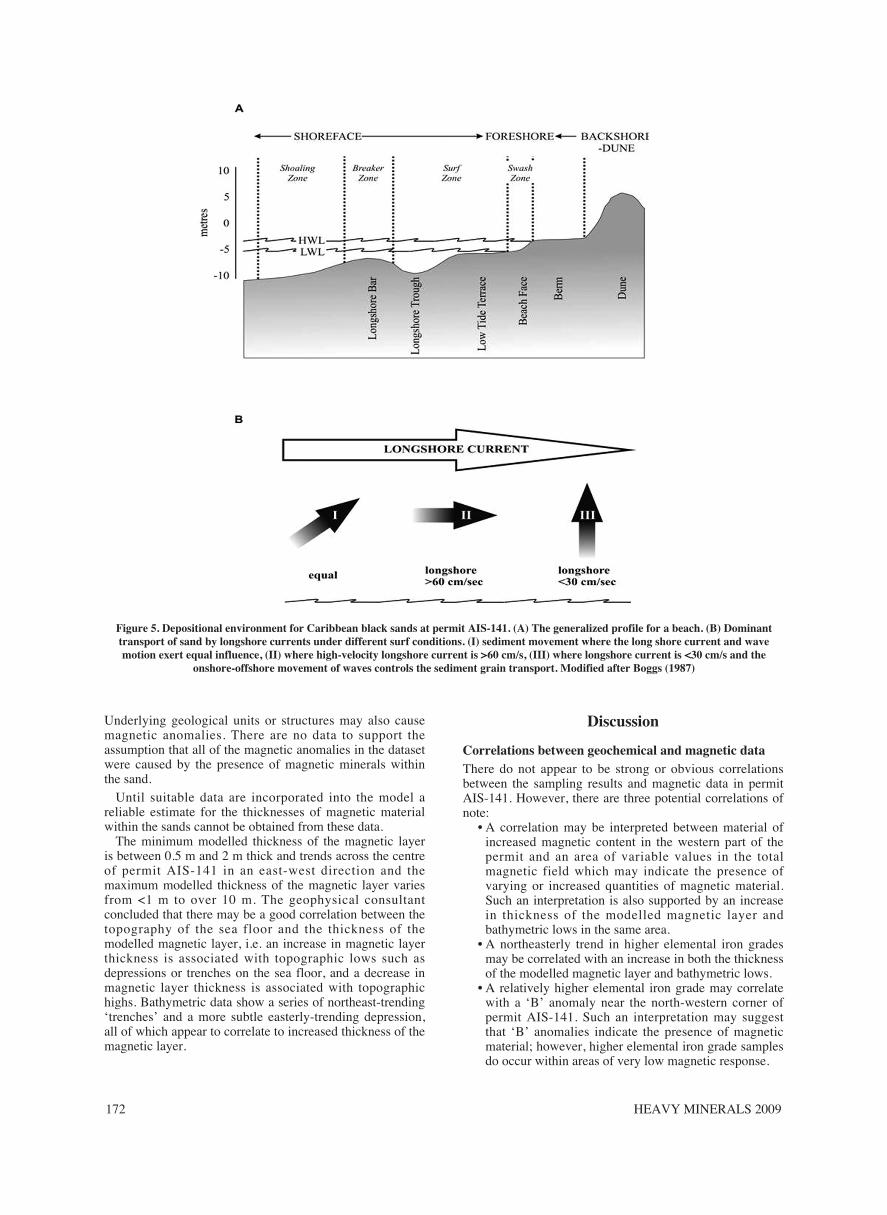
Figure 5. Depositional environment for Caribbean black sands at permit AIS-141. (A) The generalized profile for a beach. (B) Dominanttransport of sand by longshore currents under different surf conditions. (I) sediment movement where the long shore current and wavemotion exert equal influence, (II) where high-velocity longshore current is >60 cm/s, (III) where longshore current is <30 cm/s and the
onshore-offshore movement of waves controls the sediment grain transport. Modified after Boggs (1987)

EXPLORATION FOR OFFSHORE HEAVY MINERAL SANDS 173
Depositional environmentHeavy mineral sands deposits typically form under alluvial,fluvial, or marine conditions (Guilbert and Park, 2007). Thedepth of water across permit AIS-141, as derived from thebathymetric data, varies from <1 m to over 10 m whichplaces it, geomorphologically, in a beach and shoreface (ornearshore) zone setting (Boggs, 2007; Figure 5).
Most heavy mineral marine sand deposits form as a resultof the combined effects of longshore currents and onshorewave-wind-storm action (Guilbert and Park, 2007; Figure 5). Longshore currents move both heavy and lightminerals as a mixed sediment load according to the size,specific gravity, durability and abundance of each mineralin the source unit and the ratio of dark, heavy, fine-graineddurable minerals to other sediment may vary widelybetween layers. Longshore currents move parallel to theshore following longshore troughs, which are shallowtroughs in the lower part of the surf zone orientated parallelto the strand line. The transport of sand on beaches bylongshore currents under different surf conditions indicatestheir relative influence: where the longshore current andwave motion exert equal influence sediment movement willbe at an angle to the coastline, under high-velocity (>60 cm/ s) longshore currents, and where longshorecurrent velocity is <30 cm/ s and onshore-offshore motionof waves controls the sediment grain transport (Boggs,2007; Figure 5).
Combinations of wave-wind-storm action concentrate theheavy minerals. Wind is generally ineffective but stormtides can be highly effective as they can suspend and carryminerals in high energy turbulent wave action. A storm tidewill carry all material beachwards but backflow willproportionally carry more of the lighter material resulting indeposition of the heavier material. Typically, only theheavier, higher-equivalent-hydraulic-diameter particles arelodged in storm-generated high-tide strand lines. The size,grade and extent of a given deposit are complex functionsof the source of supply, relative coastline-mean sea levelstability, and the frequency, energy, consistency ofdirection, and reproducibility of storms (Guilbert and Park,2007).
The northeast-southwest trending deeper bathymetric datain permit AIS-141 probably represent longshore troughsproduced during conditions where the longshore currentand wave motion exert an equal influence on sedimenttransport. The proposed correlation between material ofincreased magnetic content in the western part of permitAIS-141 which is supported by an increase in thickness ofthe modelled magnetic layer and bathymetric lows in thesame area may be interpreted to suggest that heavy mineralsands are being transported by longshore currents anddeposited and reworked within longshore troughs underconditions where longshore current and wave motion exertan equal influence on sediment transport.
Provenance of Caribbean black sandsOne of the principal factors contributing to the moderninterest in provenance studies is the affect that source rockshave on the overall quality of the detrital heavy mineralsthey produce e.g., Ni, Cr, V and Co contents are importantin ilmenite chemistry, as abundance of these elements inilmenite makes it unsuitable for the pigment industry.Boggs (1987) indicates that particular suites of heavyminerals can be utilized for source-rock determination. Forexample:
• Alkaline igneous source rocks—a suite comprisingapatite, biotite, hornblende, monazite, rutile, titanite,pink tourmaline, and zircon
• Basic igneous source rocks—a suite consisting ofaugite, chromite, diopside, hypersthenes, ilmenite,magnetite, and olivine
• Metamorphic source rocks—a suite consisting ofandalusite, garnet, staurolite, topaz, kyanite, andsillimanite
• Sedimentary source rocks—a suite comprising barite,iron ores, leucoxene, rounded tourmaline, and roundedzircon.
Minerals that have been particularly utilized in theprovenance studies of heavy mineral placers includeilmenite, zircon and rutile. For example, the heavy mineralassemblage and geochemistry of ilmenite from Honnavarbeach, Karnataka, on the central west coast of India werestudied by Hegde et al. (2006) in order to understand theirprovenance. The heavy mineral assemblage of ilmenite,magnetite, zircon, hornblende, epidote, sphene, kyanite,garnet and staurolite was considered to indicate itsderivation from mixed sources of gneissic/granitic, basicand high-grade metamorphic rocks. The trace elementcontent of Co, Cr, V and Ni in ilmenite was interpreted tosuggest a gneissic to basic provenance. The grainmorphology of the high-grade metamorphic minerals suchas garnet, kyanite and staurolite were considered to havebeen reworked and derived from the offshore/palaeo-beachand brought to the beach deposit by combined action oflongshore current and wave motion. Zircon geochemistrycan also be utilized because there is a general trend ofincreasing REE abundance in zircons from ultramaficthrough mafic to granitic rocks and trace elements such asY, Ce, U, Eu, Yb, Sm, Nb, and Ta in zircons are influencedby source rock type and (Belousova et al., 2002). Thelithology of source rocks can be determined using Nb andCr contents in rutile, because the most important sourcerocks for rutile, metapelites and metabasites, imprint adistinct Nb and Cr signature in rutiles (Zack et al., 2004).
Although data is limited, the XRF analyses may beinterpreted, on the basis of correlations between Fe, Ti, Crand Ni to suggest that basic igneous rocks may be potentialprimary source rocks for Caribbean black sand minerals.
Anecdotal evidence about the recent appearance of blacksands along the Caribbean coast suggests that depositionalprocesses have changed significantly in modern times andmay provide for an intermediate source for the black sandsmaterial, i.e., a heavy mineral sands depositional site whichchanged to a site for sediment removal after theconstruction of a jetty system at the mouth of theMagdalena River in 1935. No specific work has beencarried out to date in respect of this hypothesis althoughMartinez et al. (1990) considered that the Magdalena Riverjetty system was at least indirectly responsible for build-upof sand bodies downstream from the Magdalena River andthat these sands may have been derived from the immediatevicinity of the jetty system, the retreating delta front of theMagdalena River or the continental shelf.
Significance of goldGold data at permit AIS-141 are highly variable andsignificant work is required in order to define its mode ofoccurrence and economic potential. Gold placer depositsare typically low grade (0.05-0.25 g/t Au) and concen-trations are highly variable both within and between
HEAVY MINERALS 2009174
individual deposits. Gold is typically fine grained (< 0.5mm diameter) and well rounded; coarser grains and nuggetsare rare. Worldwide, economic marine gold placer depositsare rare and the Nome gold placer deposit, Alaska, is one ofthe best known marine examples. Records suggest that over5 million ounces of gold have been recovered from Nomeand magnetite and ilmenite are closely associated with thegold which was sourced from recent glacial deposition.
Economic potentialAlthough the initial work carried out at permit AIS-141 hasnot been undertaken to international standards, it does,however, provide indications for the potential of the permitand region. Current data indicates the presence of iron-bearing (av. 21.5% Fe) material in association withtitanium-bearing material (av. 4.3%TiO2). The magneticfraction averages 26.8% and the magnetite equivalentaverages 16.5%. Resource data on competitors is scantalthough these data are higher than grades published byCardero Resources to date from the Pampa el Toroironsands project in Peru where the magnetic fraction ofactive dune material averages 11.0% and that of Quaternarysands averages 7.7%. Magnetic concentrates fromCardero’s Pampa el Toro ironsands project have averagevalues of approximately 61.5% iron (Fe), 4.3–6.41%titanium oxide (TiO2), 0.2–0.28% phosphate (P2O5),2.41–4.34% silica (SiO2), 1.22–1.82% alumina (Al2O3),0.61–1.14% magnesium (MgO), 0.4–0.55% manganese(MnO) and 0.01% sulphur (S) (Cruise and Hoffman, 2008).
Given that an acceptable magnetic fraction may havebeen attained and titanium oxide grades are similar to thosefor magnetic concentrates from the Pampa el Toro ironsands project, the potential for relatively cheap labour inColombia and the expectation of relatively low extractioncosts for the dredging of ore materials present in sandshosted by shallow water depths, supports the contentionthat the economic potential of Caribbean Colombian blacksands for iron ore is largely dependent upon tonnage. Todate no resource estimate work has been undertaken and isdependent upon future sampling to international standards.
Economic marine gold placer deposits are rare and at thistime gold data at permit AIS-141 are highly variable andrequire significant work in order to define the mode ofoccurrence and economic potential of potential goldmineralization.
ConclusionsThe sampling and geophysical data obtained from GMEC’sactivities allow the following conclusions to be drawn:
• GMEC have obtained 80 samples on an approximately500 m x 500 m grid at one of their permit areas, AIS-141, which confirm the presence of iron- and titanium-bearing minerals and gold in potentially economicquantities
• GMEC have carried out a marine magnetic survey atone of their permit areas, AIS-141, which correlateswith some areas of higher iron and titanium oxidegrades; however, the magnetic survey cannot be used toproduce reliable estimates for the thickness of anymagnetic layers until sufficient data are available
• GMEC have undertaken a bathymetric survey at one oftheir permit areas, AIS-141, which shows somecorrelation with the presence of magnetic material andhigher iron and titanium oxide grades and suggests thatthese materials were deposited in longshore troughs
• GMEC has the advantage of utilizing permit AIS-141as a test site for developing suitable explorationmethods for this type and style of deposit enablingfuture work to proceed in an efficient and cost-effectivemanner.
Future workSRKES is currently involved in the design and managementof an exploration programme suitable which includesvibrocore drilling for the future estimation of resources.This will lead to a ‘fatal flaw’ study, resource estimate andpreliminary economic assessment of the project. This workwill require input from mining engineers, mineralprocessing engineers and dredging specialists and allow forany potential difficulties or issues to be identified andassessed at an early stage in the development of the project.
References
BELOUSOVA, E.A., GRIFFIN, W.L., O'REILLY, S.Y.,and FISHER, N.I. Igneous zircon: trace elementcomposition as an indicator of source rock type.Contributions to Mineral Petrology, vol. 143, 2002. pp. 602–622.
BOGGS, S. Principles of sedimentology and stratigraphy.Merrill Publishing Company, Colombus, Ohio, USA.1987.
BUTT, A., HAWKE, P. and FILS, M. Of detritals,derivatives and determination—an example of detritaliron discovery. Exploration Geophysic, vol. 32, 2001. pp. 185–188.
CARTER, L. Ironsand in continental shelf sediments offwestern New Zealand—a synopsis. New ZealandJournal of Geology and Geophysics, vol. 23, 1980. pp. 455–468.
CRONAN, D.S. Handbook of Marine Mineral Deposits(Marine Science). CRC press. 2000.
CRUISE, M.D. and HOFFMAN, G. Technical report on theIron Sands Project: The Pampa El Toro, Carboneraand Tanaca Dune Fields, near Nazca, southern Peru.2008. 69 pp.
FORERO, G., FERREIRA, P., MAYA, M., GARCÍA, E.,MARTÍNEZ, J.O., NÚÑEZ, A., CARDOZO, E.,NIVIA, A., GONZÁLEZ, H., CEPEDA, H., andCLAVIJO, J. Atlas Geológico Digital de ColombiaVersión 1.1 (26 planchas). Escala 1:500.000.INGEOMINAS. Bogotá. 2002.
GUILBERT, J.M. and PARK, C.F. The geology of oredeposits. Waveland Press Inc. Long Grove, Illinois,USA. 2007.
HEGDE, V.S., SHALINI, G., and KANCHANAGOURI,D.G. Provenance of heavy minerals with specialreference to ilmenite of the Honnavar beach, centralwest coast of India. Current Science, vol. 91, 2006. pp. 644–648.
LAWTON, D.C. and HOCHSTEIN, M.P. Geophysicalstudy of the Taharoa ironsand deposit, west coast,North Island, New Zealand. New Zealand Journal ofGeology and Geophysics, vol. 36, 1993. pp. 141–160.
EXPLORATION FOR OFFSHORE HEAVY MINERAL SANDS 175
LYGIN, I. Results of hydro-magnetic survey in the areaAIS-141. Gravity and Magnetic Laboratory,Geophysical Department, Geological Faculty,Lomonosov Moscow State University. 2009.
RESTREPO, J.D. and LÓPEZ, S.A. Morphodynamics ofthe Pacific and Caribbean deltas of Colombia, SouthAmerica. Journal of South American Earth Sciences25, 2008. pp. 1–21.
ROBB, L. Introduction to Ore-forming Processes .Blackwell Publishing, UK, 2005.
ROZENDAAL, A., PHILANDER, C., and DE MEIJER,R.J. Mineralogy of heavy mineral placers along thewest coast of South Africa. Heavy Minerals 1999,South African Institute of Mining and Metallurgy1999. pp. 67–73.
SHEPARD, F.P. Sea floor off the Magdalena delta andSanta Marta area, Colombia. Geological Society ofAmerica Bulletin, vol. 84, 1973. pp. 1955–1972.
SRK CONSULTING (UK) Ltd. Mineral resource estimateon the Tonkolili iron ore project in Sierra Leone.2009. 229 pp.
TAYLOR, D., DALSTRA, H.J., HARDING, A.E.,BROADBENT, G.C., and BARLEY, M.E. Genesis ofhigh-grade hematite orebodies of the Hamersleyprovince, Western Australia. Economic geology andthe bulletin of the Society of Economic Geologists,vol. 96, 2001. pp. 837–873.
TELFORD, W.M., GELDART, L.P., and SHERIFF, R.E.Applied Geophysics, second edition. CambridgeUniversity Press. 1990.
TRENKAM, R., KELLOGG, J.N., FREYMUELLER, J.T.,and WIDE, H.P.M. Plate margin deformation,southern Central America and northwestern SouthAmerica, CASA GPS observations. Journal of SouthAmerican Earth Sciences, vol. 15, no. 2, 2002. pp. 157–171.
TYLER R.M. and MINNIT, R.C.A. A review of sub-Saharan heavy mineral sand deposits: implications fornew projects in southern Africa. The Journal of TheSouth African Institute of Mining and MetallurgyMarch 2004. pp. 89–99.
VERNETTE, G., MAUFFRET, A., BOBIER, C.,BRICENO, L., and GAYET, J. Mud diapirism, fansedimentation and strike-slip faulting, CaribbeanColombian margin. Tectonophysics, vol. 202, 1992. pp. 335–349.
ZACKA, T., VON EYNATTEN, H., and Kronz, A. Rutilegeochemistry and its potential use in quantitativeprovenance studies. Sedimentary Geology, vol. 171,2004. pp. 37–58.
ZHOU, W., CHEN, G., LI, H., LUO, H., and HUANG, S.L.GIS application in mineral resource analysis—A casestudy of offshore marine placer gold at Nome, Alaska.Computers & Geosciences, vol. 33, 2007. pp. 773–788.
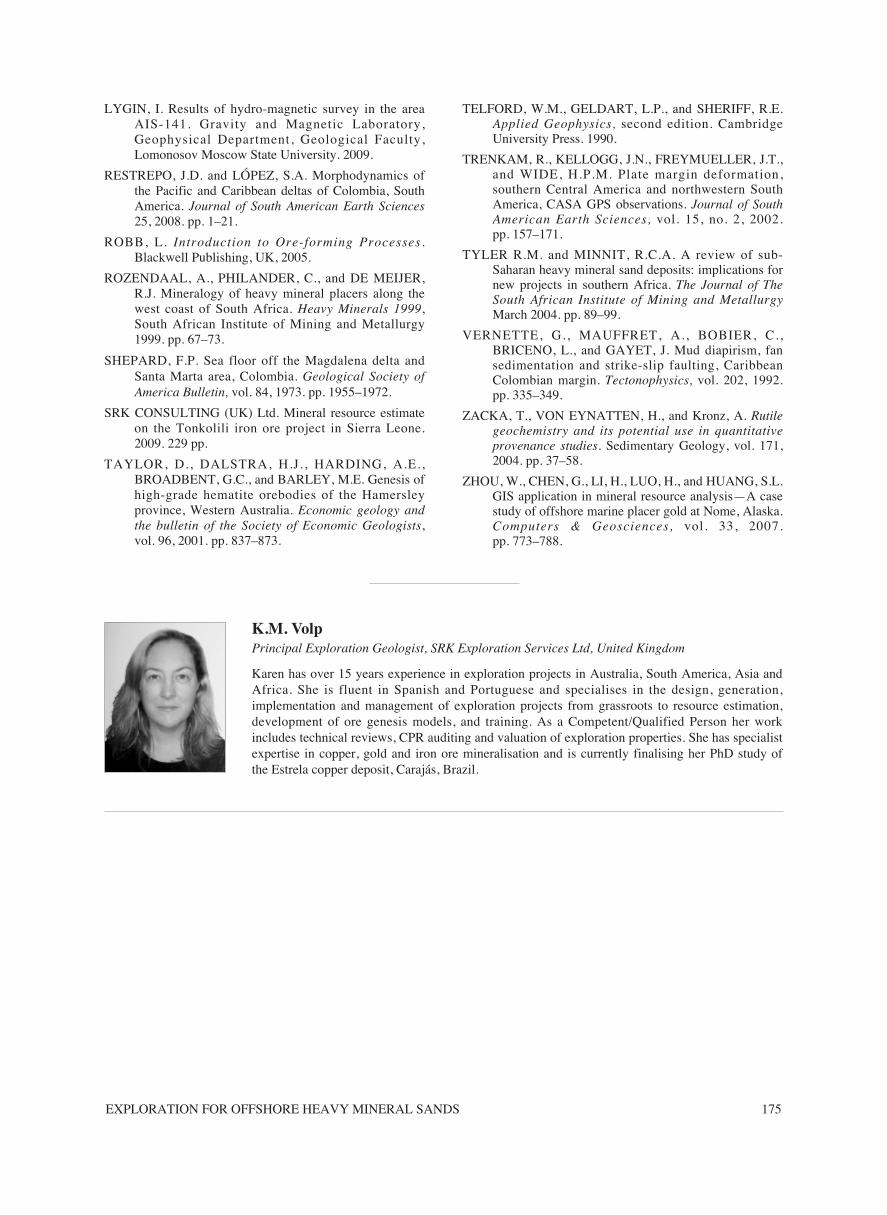
K.M. VolpPrincipal Exploration Geologist, SRK Exploration Services Ltd, United Kingdom
Karen has over 15 years experience in exploration projects in Australia, South America, Asia andAfrica. She is fluent in Spanish and Portuguese and specialises in the design, generation,implementation and management of exploration projects from grassroots to resource estimation,development of ore genesis models, and training. As a Competent/Qualified Person her workincludes technical reviews, CPR auditing and valuation of exploration properties. She has specialistexpertise in copper, gold and iron ore mineralisation and is currently finalising her PhD study ofthe Estrela copper deposit, Carajás, Brazil.

HEAVY MINERALS 2009176