exploiting the colors of soap bubblesshipman/47/volume5a2013/math435_mauser_bubbles.pdfexploiting...
TRANSCRIPT
Dynamics at the Horsetooth Volume 1, 2013.
Exploiting the Colors of Soap Bubbles
Kelly W. MauserDepartment of PhysicsColorado State University [email protected]
Report submitted to Prof. P. Shipman for Math 435, Spring 2013
Abstract. Soap films and soap bubbles display properties relevant to both differentialgeometry and optics. We explore a method in which knowledge of the shape of abubble and colors from interference patterns on the soap film can be used to determinethe thickness of a bubble at a point on the surface, to try and determine the thicknesswhen a bubble pops. We use a bubble stretched between a wire loop and a petri dishcreating a catenoid shape. Using the colors on the surface of the bubble, the thicknesscan be determined. While thickness was determined for small sections of the bubble,the thickness of the bubble when it popped was unable to be determined for reasonsexplained. Additionally, a question about the pinch off of this system is explored.
Keywords: Bubbles, Soap Films, Interference
1 Introduction
Anyone who has played with soap bubbles as a child, or even has washed dishes at any point oftheir lives, has seen the beautiful colors created on the surface of soap bubbles. While beautiful,these bubble can serve a useful purpose in discovering properties of a bubble, like the thickness. Inthis paper, I examine a bubble stretched effectively between two loops. In this case, it is a petridish and a wire loop. The purpose of my project was to determine if a bubble will pop after thesoap film reaches a critical thickness.
This paper is organized as follows: In Section 2, we introduce the setup of our experiment. InSection 3, we show how colors on soap bubbles can be used to determing the thickness of the soapfilm. Section 4 describes the manner in which data was collected. Section 5 examines the results,and finally, Section 6 concludes and discusses future work.
2 Setup
The object under study was a soap film stretched between two circles. In my case, I used a wireloop with a diamter of 4.7 cm and a petri dish with a diameter of 5.5 cm full of bubble solution, asshown in Fig. 1.

Exploiting the Colors of Soap Bubbles Kelly W. Mauser
Figure 1: Setup of experiment. Wire loop forms a bubble with a petri dish.
To perform the experiment, we set up the bubble, LED, and camera as shown in Fig. 2.
Figure 2: Top view of experimental setup.
Using a stand, we propped the wire loop up at varying heights of 1 cm, 2 cm, and 3 cm abovethe rim of the petri dish. We created the bubble by bringing the petri dish up to the loop andpulling down. We then let the bubble sit and filmed the changing colors until the bubble popped.
3 Theory
The colors on a soap film are due to the constructive and destructive interference of differentwavelengths of light. Different wavelengths of light correspond to different colors. Using acombination of the wavenumber, k = 2π/λ and Snell’s Law, n1 sin(θ1) = n2 sin(θ2) we can findan expression for the thickness of the soap film for a given color and a given angle of incidence ofincoming light. In the equation for Snell’s Law, n1 is the index of refraction of air (equal to 1),and n2 is the index of refraction of the soap film, which is approximately 1.33 [3]. θ1 is the angleof incidence of the incoming light measured from the normal of the surface, and θ2 is the angle ofincidence of the light refracted in the soap film as measured from normal to the surface. This isdiagramed in Fig. 3.
Dynamics at the Horsetooth 2 Vol. 1, 2013

Exploiting the Colors of Soap Bubbles Kelly W. Mauser
Figure 3: How light is transmitted and reflects through a soap film. Incident wave is either reflected(a) or transmitted (b) at interface 1. The transmitted (b) wave is either transmitted (c) or reflected(d) at interface 2. The reflected wave (d) is either transmitted (e) or reflected (f) at interface 1.
If (a) and (e) and the additional reflected waves in Fig. 3 are in phase, they will constructivelyinterfere, creating a bright spot of that particular color. To find the phase difference between lightreflecting off the top surface of the film and light reflected from the buttom surface of the film, wehave the equation
δ = k2n2d cos(θ2),
involving the fact that light that reflects off an object with a higher index of refraction than thelight is traveling in undergoes a 180 phase change after reflection.
Next, we know by Fresnel’s equations[1] that
δ =4πd
λ
√n2 − sin2(θi).
In our case, we want δ to be equal to a multiple 2π for constructive interference. Using this factand solving for d, we find
d =mλ
2√n22 − sin2(θi)
, (1)
where m is a positive integer greater than zero. We need to know the wavelength and the incidentangle. We will first examine the latter. Assuming our light source is parallel (Fig. 4), the trickypart is finding n, the unit normal vector to the surface. This involves knowing a little more aboutthe behavior of bubbles.
Figure 4: n is the unit normal vector to the surface, and p is the vector antiparallel to the incominglight.
Dynamics at the Horsetooth 3 Vol. 1, 2013

Exploiting the Colors of Soap Bubbles Kelly W. Mauser
Bubbles always assume the shape with minimal surface area. Having been studied previously[2],this minimum surface area shape is known to be a catenoid (Fig. 5).
Figure 5: Shape of a bubble stretched between two loops. The catenoid minimizes surface area, orhas a mean curvature of zero.
The surface is parameterized by
~x = xi+ cosh(x) cos(θ)j + cosh(x) sin(θ)k,
where x is the distance from the center of the catenoid along the axis of rotational symmetry, andθ is the angle in the y-z plane as measured from the y-axis. Using the formula to find the anglebetween two vectors,
θi = cos−1 n · p|n||p|
,
and setting p to be along the y-axis, we find
θi = cos−1
(− cos(θ)
cosh(x)
).
We can then use this in our formula for d (Eq. 1). Now the only missing variable in this equationis the wavelength. This we can extract from the data we collect.
4 Data Collection
We used the color of the bubble to find the wavelength, and therefore, the thickness at any givenpoint. We saw repeated bands of color during the experiment (Fig. 6).
Dynamics at the Horsetooth 4 Vol. 1, 2013
Exploiting the Colors of Soap Bubbles Kelly W. Mauser
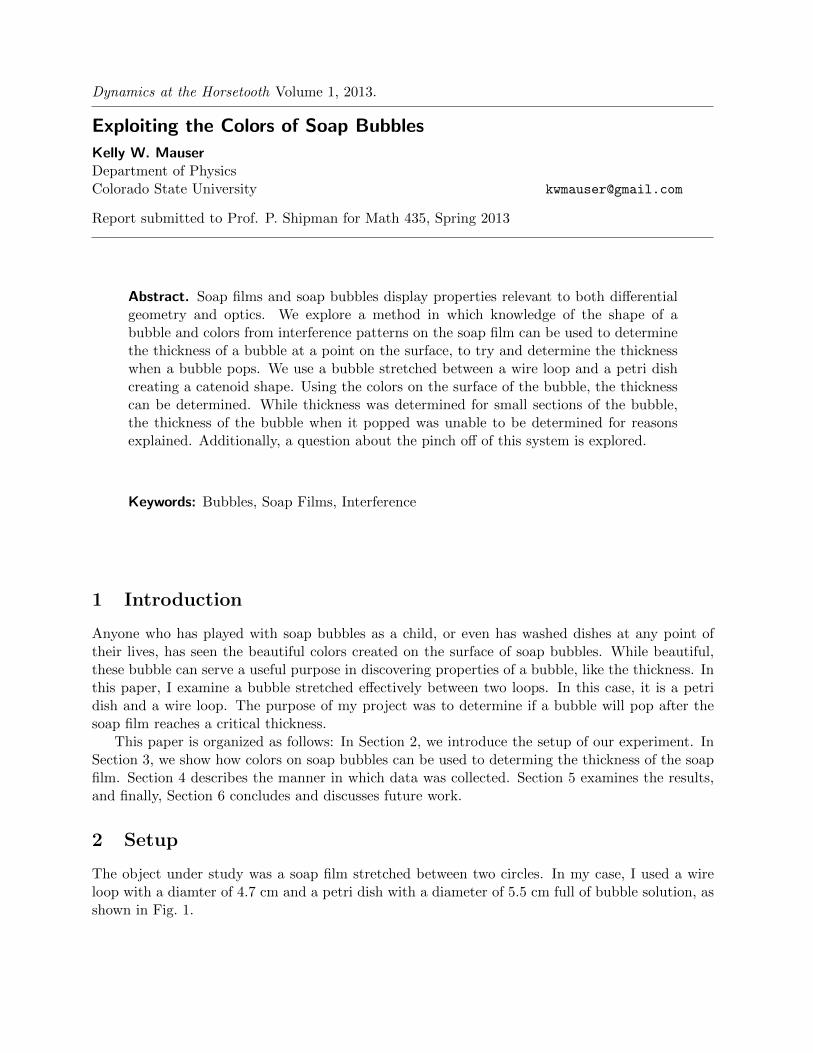
Figure 6: Typical data picture showing repeated bands of color. Note the colorless area above thevisible bands of color, where the bubble becomes thinner than half the wavelength of visible lightand thickness at this point can no longer be determined.
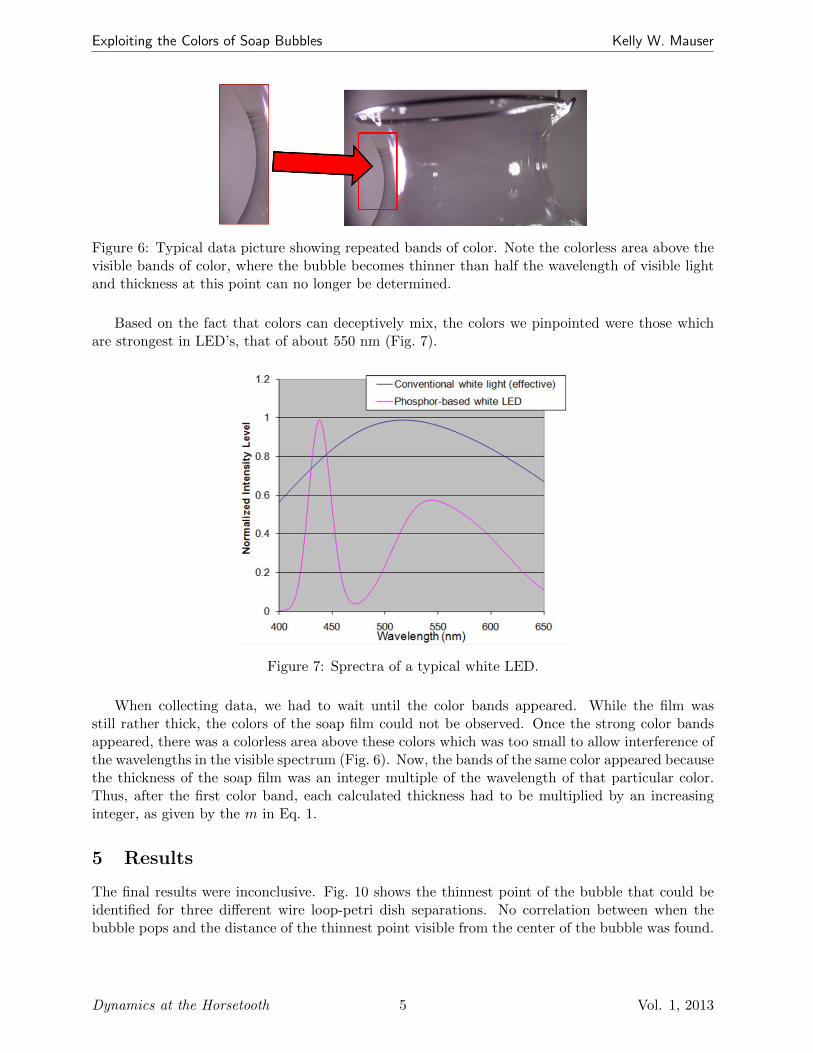
Based on the fact that colors can deceptively mix, the colors we pinpointed were those whichare strongest in LED’s, that of about 550 nm (Fig. 7).
Figure 7: Sprectra of a typical white LED.
When collecting data, we had to wait until the color bands appeared. While the film wasstill rather thick, the colors of the soap film could not be observed. Once the strong color bandsappeared, there was a colorless area above these colors which was too small to allow interference ofthe wavelengths in the visible spectrum (Fig. 6). Now, the bands of the same color appeared becausethe thickness of the soap film was an integer multiple of the wavelength of that particular color.Thus, after the first color band, each calculated thickness had to be multiplied by an increasinginteger, as given by the m in Eq. 1.
5 Results
The final results were inconclusive. Fig. 10 shows the thinnest point of the bubble that could beidentified for three different wire loop-petri dish separations. No correlation between when thebubble pops and the distance of the thinnest point visible from the center of the bubble was found.
Dynamics at the Horsetooth 5 Vol. 1, 2013

Exploiting the Colors of Soap Bubbles Kelly W. Mauser
Figure 8: Distance from the center of the catenoid versus time from when the colorless sectionof bubble first appeared near the wire loop. Each different line is a different trial at varyingseparations. The line stops when the bubble pops, which doesn’t appear to correlate with anyparticular time for the given data.
Though we couldn’t determine how thin the bubble was when it popped, we tried to interpolatefrom the graphs if the thickness of the bubble fell off linearly by distance from the center, but fromthe shown examples (Fig. 9), no correlation between the distance and thickness could be determinedfrom the given information.
(a) Trial 1 (b) Trial 2 (c) Trial 3
Figure 9: Thickness profiles with time for the 3 cm separation of the wire and petri dish. Notenough data, given the small data range, was collected to determine if a trend in thickness profileswas present.
Dynamics at the Horsetooth 6 Vol. 1, 2013
Exploiting the Colors of Soap Bubbles Kelly W. Mauser
6 Conclusion
In conclusion, we were able to use interferometry to determine the thickness of the bubble fora small range of the bubble. For thickness smaller than half the wavelength of the smallestwavelength visible light, we could not determine the thickness of the bubble. Beyond about fivewavelengths thick, we couldn’t determine the thickness as clear colors were not visible. Given asmaller wavelength of light, we could determine the thickness of the bubble before it pops. Thedifficulty comes from the fact that we could no longer observe this smaller wavelength, as it wouldbe outside the visible spectrum.
There were sources of error in this experiment. First of all, the bubble was not isolated fromair currents, which can affect when a bubble pops. Also, the LED wasn’t truly parallel. Thewire loop wasn’t perfectly circular, so the catenary shape may not have been precise. Future workwould include possibly using some sort of camera that could pick up wavelengths outside the visiblespectrum in order to observe thinner sections of the bubble.
6.1 Future Work
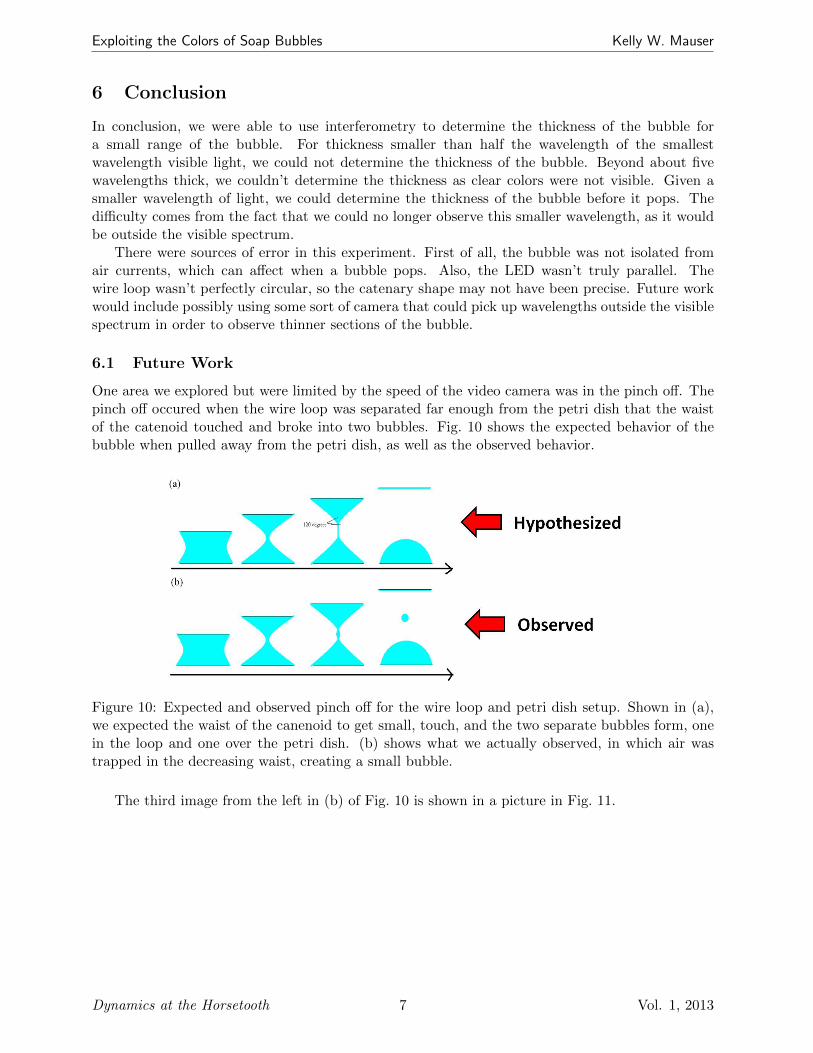
One area we explored but were limited by the speed of the video camera was in the pinch off. Thepinch off occured when the wire loop was separated far enough from the petri dish that the waistof the catenoid touched and broke into two bubbles. Fig. 10 shows the expected behavior of thebubble when pulled away from the petri dish, as well as the observed behavior.
Figure 10: Expected and observed pinch off for the wire loop and petri dish setup. Shown in (a),we expected the waist of the canenoid to get small, touch, and the two separate bubbles form, onein the loop and one over the petri dish. (b) shows what we actually observed, in which air wastrapped in the decreasing waist, creating a small bubble.
The third image from the left in (b) of Fig. 10 is shown in a picture in Fig. 11.
Dynamics at the Horsetooth 7 Vol. 1, 2013

Exploiting the Colors of Soap Bubbles Kelly W. Mauser
Figure 11: Unexpected behavior during the pinch off of the bubble. Air is trapped in the neck ofthe shrinking waist of the catenoid, which will separate into a small bubble.
A sequence of what occurs is shown in Fig. 12. The images appear blurry because of the speedof the pinch off.
(a) (b) (c)
(d) (e)
Figure 12: Time lapse of a bubble pinch off. (a) The waist shrinks. (b) Note that the entirecurvature of the surface is convex. (c) Note that the curvature of the bubble half closest to thepetri dish has changed from convex to concave. (d)Air is trapped in the neck of the catenoid. Thecurvature of the upper bubble is convex, while the curvature of the lower bubble is both convexand concave. (e)A small bubble appears after the catenoid has separated.
Possibly what is creating the unexpected bubble is that the air trapped in the catenoid neckon the loop side can escape, while the air on the petri dish side cannot escape. While the bubblemembrane is normally strong enough to overcome any pressure differences and maintain its shape,in this case, the air pressure becomes too much. As can be seen in figure (c) of Fig. 12, the petridish side of the catenoid begins to lose the convexity of its sides. The curvature changes, possibly
Dynamics at the Horsetooth 8 Vol. 1, 2013
Exploiting the Colors of Soap Bubbles Kelly W. Mauser
due to larger air pressure. This could change the shape of the bubble enough to affect how thebubble pinches off.
While this could be a plausable explanation, when a bubble was created between two wire loops,occasionally a small bubble would appear. This suggests that the pressure idea could be incorrect.Another thought is that the fast moving air creates a low pressure area on either side of the neck,while the still air in the middle does not ”suck” in the bubble as tightly. This would be accurate,except for the fact that the lowest pressure would be in the center, where the air is leaving, so theneck should pinch off the fastest in this region.
One other possibility lays in the Rayleigh-Plateau Instability. This instability describes aninstability which occurs on a cylindrical column of fluid. When the column length becomes greaterthan the column diameter by a factor of about 3.13, sinusoidal variations occur in the surface due topressure differences and surface tension[4]. This would need to be looked into further to determine ifa Rayleigh-Plateau Instability is applicable to our system. Thus, this pinch-off phenomena remainsa mystery.
Dynamics at the Horsetooth 9 Vol. 1, 2013

Exploiting the Colors of Soap Bubbles Kelly W. Mauser
References
[1] Y. D. Afanasyev, G. T. Andrews, and C. G. Deacon, American Journal of Physics, 79, 10, pp.1079 (2011)
[2] Oprea, J., The Mathematics of Soap Films: Explorations With Maple, Student MathematicalLibrary, 10, (2000)
[3] Pedrotti, F.L., Pedrotti, L.M., Pedrotti, L.S., IntroductiontoOptics, 3rded. Addison-Wesley,(2006)
[4] Breslouer,O.,Rayleigh-Plateau Instability: Falling Jet, http://www.princeton.edu/
~stonelab/Teaching/Oren%20Breslouer%20559%20Final%20Report.pdf, (2010)
Dynamics at the Horsetooth 10 Vol. 1, 2013