explaining variability in surgical decision-making - ulisboa · explaining variability in surgical...
TRANSCRIPT

Explaining variability in surgical decision-making:
Developing qualitative and quantitative models to characterize surgeons'
choice of treatments
Liliana Andreia Fernandes de Freitas
Thesis to obtain the Master of Science Degree in
Biomedical Engineering
Supervisors: Professor Mónica Duarte Correia de Oliveira
Professor José Crespo Mendes de Almeida
Examination Committee
Chairperson: Professor Patrícia Margarida Piedade Figueiredo
Supervisor: Professor Mónica Duarte Correia de Oliveira
Members of the Committee: Professor Carlos Manuel Pinho Lucas de Freitas
December 2015

ii

iii
Acknowledgments
I would like to thank Professor Mónica Oliveira for all the support, guidance and mainly for having
confidence, always motivating for a step ahead. I would also like to thank Professor Mendes de Almeida
and Doctor Teresa Braga of Hospital de Santa Maria in Lisbon, for the effort, motivation and enthusiasm.
Without my parents, nothing would be possible. My friends that were always there, thank you all! Thank
you to my family too, for the love!
And finally, I thank the participation of the surgeons of Hospital de Santa Maria in all the steps of this
work: Dr João Coutinho, Dr Carlos Miranda, Dr António Ruivo, Dr Fernando Aldeia, Dr Teresa Pereira,
Dr Filipa Ferreira, Dr José Freire and Dr Afonso Ramires.

iv
Abstract
Surgeons commonly face situations in which they must be ready to make a decision. Their expertise
and capability, both obtained by surgical training and experience, as well as guidelines, guide them in
the decision making process. Nevertheless, evidence reported in the literature points out for a large and
unexplained variability in surgical decision making, even in areas in which scientific evidence exist. In
some contexts, such as for the treatment of acute cholecystitis, there is a lack of evidence and tools to
assist doctors in their decisions.
This thesis develops and applies multicriteria methods to explore how surgeons make decisions
concerning the treatment of acute cholecystitis patients, as well as constructs a decision support model
to assist surgeons in the choice of treatment. A multimethodology based on the MACBETH approach is
built to meet those objectives. It starts by using exploratory interviews to understand and structure the
multiple factors that surgeons consider in the evaluation of patients and in treatments’ choice. Then,
making use of a web-based platform that makes MACBETH based questions, it is constructed an
individual model that captures the views of each one of ten surgeons from Hospital de Santa Maria in
Lisbon. Then all surgeons are set to participate in a decision conference and a MACBETH group model
is built.
With the application of this multimethodology, we could explore the variability across surgeons’
views, the convergence towards a group model and, based on the group model, to build a decision
support model to assist them in future surgical decisions. Results shows that, despite giving different
qualitative judgments, most of surgeons end up evaluating the patient state in a similar way, which
generates similar results in the different models; regarding the decision support model, there was
agreement by the surgeons, however, work needs to be done to have the information that the model
needs to evaluate the patient state according to each way of treatment.
Keywords: Surgical Decision Making; Variability; Acute Cholecystitis; Decision Support Model;
MACBETH.

v
Resumo
Os cirurgiões enfrentam constantemente situações em que têm de estar prontos para tomar uma
decisão. As suas capacidades e perícia, obtidas pela instrução e experiência, tal como as diretrizes
existentes orientam-no na tomada de decisão. Ainda assim, a literatura demonstra a existência de
bastante e indesejada variabilidade na tomada de decisão em cirurgia, mesmo em áreas com evidência
científica disponível. Em alguns contextos, tal como o tratamento da colecistite aguda, há falta de
evidência e ferramentas que apoiem os médicos nas decisões.
Esta tese desenvolve e aplica métodos multicritério para explorar a forma como os cirurgiões
tomam decisões em pacientes que necessitam de um tratamento de colecistite aguda, além disso,
constrói um modelo de apoio à decisão para auxiliar os médicos nesta escolha de tratamento. Uma
multimetodologia baseada na abordagem MACBETH é construída para alcançar estes objetivos.
Começa-se por usar entrevistas exploratórias para perceber e estruturar os múltiplos fatores que os
cirurgiões consideram na avaliação de pacientes e na escolha de tratamentos. Depois, usando uma
plataforma web com questões baseadas na abordagem MACBETH, é construído um modelo individual
que captura a opinião de cada um de dez cirurgiões do Hospital de Santa Maria em Lisboa. Todos os
cirurgiões são depois reunidos numa conferência de decisão e um modelo MACBETH de grupo é
criado.
Com a aplicação da multimetodologia foi possível explorar a variabilidade entre as opiniões dos
cirurgiões, a sua convergência em relação ao modelo de grupo e, baseado no modelo de grupo,
construir um modelo de apoio à decisão para auxiliar nas futuras decisões cirúrgicas. Os resultados
demonstram que, apesar dos diferentes julgamentos de atratividade dados, a maioria dos cirurgiões
acaba por avaliar o paciente de forma similar, o que gera resultados semelhantes nos diferentes
modelos; em relação ao modelo de apoio à decisão criado, notou-se concordância por parte dos
cirurgiões, no entanto, trabalho tem de ser feito para obter a informação que o modelo necessita para
avaliar o paciente de acordo com cada opção de tratamento.
Palavras-Chave: Tomada de Decisão Cirúrgica; Variabilidade; Colecistite Aguda; Modelo de Apoio
à Decisão; MACBETH.

vi
Contents
Acknowledgments ................................................................................................................................... iii
Abstract.................................................................................................................................................... iv
Resumo ....................................................................................................................................................v
List of Figures ........................................................................................................................................ viii
List of Tables ............................................................................................................................................x
Abbreviations .......................................................................................................................................... xii
1. Introduction ...................................................................................................................................... 1
2. Context ............................................................................................................................................ 4
2.1. Surgical Decision Making ........................................................................................................ 4
2.2. Variability ................................................................................................................................. 5
2.3. Decreasing Unwanted Variation .............................................................................................. 8
3. Literature Review ........................................................................................................................... 10
3.1. Acute Cholecystitis ................................................................................................................ 10
3.1.1. Acute Cholecystitis Treatment ........................................................................................... 11
3.1.2. Early versus Interval Cholecystectomy ............................................................................. 13
3.2. Reporting Variability .............................................................................................................. 14
3.2.1. Total Knee Arthroplasty (TKA) ........................................................................................... 15
3.2.2. Early-Onset Scoliosis (EOS) ............................................................................................. 16
3.3. Multicriteria Decision Analysis (MCDA) in Healthcare........................................................... 16
3.3.1. MCDA in Surgical Decision Making ................................................................................... 18
4. Methodology .................................................................................................................................. 20
4.1. Proposed Multimethodology .................................................................................................. 20
4.1.1. Multicriteria Models – MACBETH Approach ..................................................................... 23
4.2. Structuring the Multicriteria Models ....................................................................................... 25
4.2.1. Exploratory Interviews ....................................................................................................... 26
4.2.2. Defining Criteria and Descriptors of Performance ............................................................. 27
4.3. Individual Multicriteria Models ............................................................................................... 30
4.3.1. Web-Based Platform ......................................................................................................... 30
4.3.2. Web-Based Platform: Protocol .......................................................................................... 31

vii
4.3.3. Building Value Scales for the Criteria ................................................................................ 34
4.3.4. Obtaining Criteria Weights ................................................................................................. 35
4.4. Compromise Multicriteria Model ............................................................................................ 36
4.4.1. Decision Conference ......................................................................................................... 36
4.4.2. Decision Conference: Protocol .......................................................................................... 38
4.4.3. Building Value Scales for the Criteria ................................................................................ 39
4.4.4. Obtaining Criteria Weights ................................................................................................. 42
5. Results ........................................................................................................................................... 43
5.1. Comparing the Individual and Group Models ........................................................................ 43
5.1.1. Morbidity ............................................................................................................................ 43
5.1.2. Functional Recovery .......................................................................................................... 47
5.1.3. Patient Satisfaction ............................................................................................................ 49
5.1.4. Patient Costs ..................................................................................................................... 51
5.1.5. Comparisons of Standard Deviations ................................................................................ 54
5.1.6. Criteria Weighting .............................................................................................................. 54
5.2. The Models Illustrated by Patient Cases ............................................................................... 56
5.2.1. Patient Cases .................................................................................................................... 57
5.2.2. Comparing Results of the Multicriteria Models .................................................................. 59
5.2.3. The Compromise Model as a Decision Support Model ..................................................... 62
6. Discussion ..................................................................................................................................... 64
6.1. Comparison of the Multimethodology with the Current Literature ......................................... 64
6.2. Multimethodology: Pros and Cons ........................................................................................ 64
7. Conclusion ..................................................................................................................................... 66
8. References .................................................................................................................................... 67

viii
List of Figures
Figure 1. Naturalistic model of intraoperative decision making [4]. ......................................................... 4
Figure 2. Naturalistic model provided by Cristancho et al.[5] .................................................................. 5
Figure 3. Variation profiles of 11 surgical procedures among hospital regions, in the United States. Each
point represents the ratio of observed to expected. [8]. .......................................................................... 6
Figure 4. Non-clinical influences on clinical decision making. [13]. ........................................................ 8
Figure 5. Information and uncertainty affecting variation in surgical care [8]. ......................................... 9
Figure 6. Biliary System [14].................................................................................................................. 10
Figure 7. Schemes of laparoscopic cholecystectomy, in the left ([14]), and of cholecystostomy, drainage
of the gallbladder, in the right ([27]). ...................................................................................................... 12
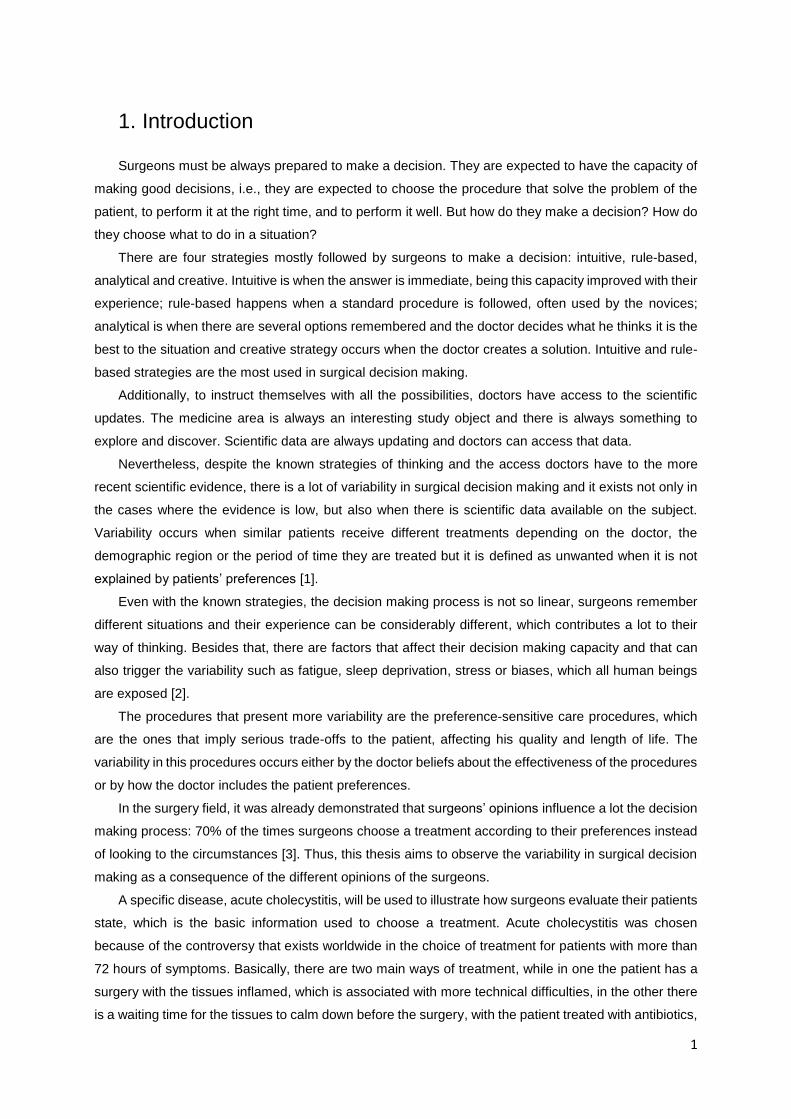
Figure 8. Number of publications included in the systematic review per year of publication [37]. ........ 17
Figure 9. Social and technical components of socio-technical approach that describes the
multimethodology. The numbers indicate the sequential order of the steps. ........................................ 21
Figure 10. Socio-Technical approach that will be followed in this thesis. There are three paths, the grey,
the green and the blue and the objectives of each path are presented at right. ................................... 21
Figure 11. Example of a consistent matrix of judgements with the assigned value scale [40]. ............ 25
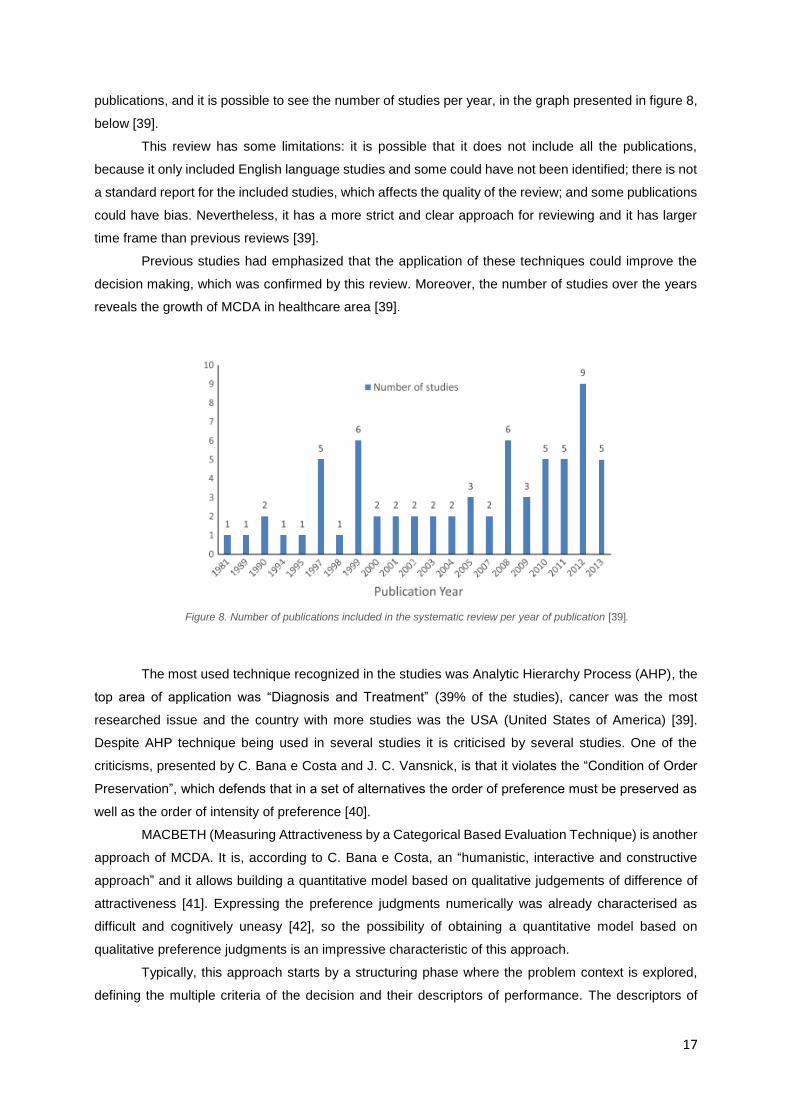
Figure 12. Organization of the criteria in a tree. The criteria are in the green boxes, below them (in light
blue) there are factors mentioned in the interviews and above them (in dark blue) there are the areas of
impact. ................................................................................................................................................... 28
Figure 13. Question regarding the Functional Recovery criterion in the first part of the web-based
platform. First, the performance levels are presented and then it is asked, for the quality of life of the
patient, to evaluate the difference of attractiveness between some levels – the levels that correspond to
the last column (first four lines) and the diagonal above the main diagonal (last three lines) of the M-
MACBETH matrixes, as it is possible to see in the matrix of judgments at left. .................................... 32
Figure 14. Ranking of the improvements. Here, surgeons were asked to suppose that a patient, after a
treatment, is in the state defined by all the yellow levels in the four criteria, i.e., in level II of Clavien-
Dindo classification respecting to morbidity, with minimal symptoms respecting to functional recovery,
not unsatisfied or satisfied respecting to satisfaction and with costs of medication and of extra visits to
the hospital. ........................................................................................................................................... 33
Figure 15. Weighting matrix of judgments given by default by the software. ........................................ 33
Figure 16. Criteria weights according to the individual answers of the surgeons. ................................ 36
Figure 17. Example of a question of the decision conference. This question of the slide asks 'For the
quality of life of the patient, going from: Reposition of the state previous to the acute episode to
Asymptomatic is of [surgeons much choose a category] importance.’ The answer given in this question
is inserted in the indicated cell of the matrix.......................................................................................... 38
Figure 18. Example of question for the 'Patient Costs' criterion. It is asked 'For the quality of life of the
patient, the importance of going from: A (having costs of medication, of extra visits to the hospital and
alteration of the economic balance) to B (having only medication costs) is [surgeons much choose a
category]’. .............................................................................................................................................. 39

ix
Figure 19. At left it is the question where the surgeons chose the ranking of the improvements from the
‘neutral’ (yellow) to the ‘good’ (green) level. At right, it is an example of how the difference of
attractiveness was asked, in this example for the 'Functional Recovery' criterion. ............................... 39
Figure 20. Matrix of judgments and value scale for the 'Morbidity' criterion. ........................................ 40
Figure 21. Matrix of judgments and value scale for the 'Functional Recovery' criterion. ...................... 40
Figure 22. Matrix of judgments and value scale for the 'Patient Satisfaction’ criterion. ........................ 41
Figure 23. Matrix of judgments and value scale for the 'Patient Costs’ criterion. ................................. 41
Figure 24. Weighting matrix of judgments and weights for the criteria. The ranking is in the following
order: 'Patient Satisfaction', 'Morbidity', 'Functional Recovery' and 'Patient Costs'. ............................. 42
Figure 25. Quantification of MACBETH categories by performance levels. At left there are the individual
opinions, considering the inconsistent judgments and not its corrections and at right it is the category or
categories selected by the group. ......................................................................................................... 44
Figure 26. Quantification of MACBETH categories by performance levels. At left there are the individual
opinions, considering the inconsistent judgments and not its corrections and at right it is the category or
categories selected by the group. ......................................................................................................... 47
Figure 27. Quantification of MACBETH categories by performance levels. At left there are the individual
opinions, considering the inconsistent judgments and not its corrections and at right it is the category or
categories selected by the group. ......................................................................................................... 50
Figure 28. Quantification of MACBETH categories by performance levels. At left there are the individual
opinions, considering the inconsistent judgments and not its corrections and at right it is the category or
categories selected by the group. ......................................................................................................... 52
Figure 29. Standard deviation of the performance levels of each criterion in the individual opinions. The
zeros are the anchors (neutral and good levels), they have not deviation from their values because the
anchors are fixed values in the value scales, which are always 0 for the neutral level and 100 for the
good level. ............................................................................................................................................. 54
Figure 30. Distribution of criteria by the ranking according individual opinions. ................................... 56
Figure 31. Criteria weights and ranking according to individual opinions and to the group opinion. .... 56
Figure 32. Evaluation of the multicriteria models for patient A at left and patient B at right. ................ 59
Figure 33. Evaluation of the multicriteria models for the patient A best and worst cases. .................... 60
Figure 34. Evaluation of the multicriteria models for the patient B best and worst cases. .................... 61
Figure 35. Results of the compromise model for the patient cases presented before. At left there is the
table of scores with all the values attributed to each option and the weights of the criteria. At the middle
the overall thermometer and at right the overall thermometer without the best and worst cases. (Blue
and green boxes are the neutral and good levels, respectively). .......................................................... 62

x
List of Tables
Table 1. Information of a review article. It is possible to see the lack of consistency when talking about
the timing of early surgeries [16]. .......................................................................................................... 13
Table 2. Answers of the surgeons when questioned about the goals of the decision. ......................... 27
Table 3. Clustering of the evaluating factors mentioned in the interviews in criteria. The criteria were
defined at the same time, after analysing the factors and the way of clustering them. ........................ 28
Table 4. Definition of the descriptors of performance and of the anchors ‘neutral’ and ‘good’. ............ 29
Table 5. Value scales obtained by the individual judgments to the 'Morbidity' criterion. ...................... 34
Table 6. Value scales obtained by the individual judgments to the 'Functional Recovery' criterion. .... 34
Table 7. Value scales obtained by the individual judgments to the 'Patient Satisfaction' criterion. ...... 35
Table 8. Value scales obtained by the individual judgments to the 'Patient Costs' criterion. ................ 35
Table 9. Qualitative judgments attributed to the comparisons of Morbidity criterion by every surgeon and
the group. The initials are according to MACBETH scale: N – No; VW – Very Weak; W – Weak; M –
Moderate; S – Strong; VS – Very Strong; E – Extreme. The hyphen represents that more than one
categories were attributed and the strikethrough represents an inconsistent judgment, being the
correction adopted presented after the arrow. ...................................................................................... 44
Table 10. Value Scales built according to the consistent qualitative judgments for the individual and
group opinions. ...................................................................................................................................... 45
Table 11. Qualitative judgments attributed to the comparisons of Functional Recovery criterion by every
surgeon and the group. The initials are according to MACBETH scale: N – No; VW – Very Weak; W –
Weak; M – Moderate; S – Strong; VS – Very Strong; E – Extreme. The hyphen represents that more
than one categories were attributed and the strikethrough represents an inconsistent judgment, being
the correction adopted presented after the arrow. ................................................................................ 47
Table 12. Value Scales built according to the consistent qualitative judgments for the individual and
group opinions. ...................................................................................................................................... 48
Table 13. Qualitative judgments attributed to the comparisons of Patient Satisfaction criterion by every
surgeon and the group. The initials are according to MACBETH scale: N – No; VW – Very Weak; W –
Weak; M – Moderate; S – Strong; VS – Very Strong; E – Extreme. The hyphen represents that more
than one categories were attributed and the strikethrough represents an inconsistent judgment, being
the correction adopted presented after the arrow. ................................................................................ 49
Table 14. Value Scales built according to the consistent qualitative judgments for the individual and
group opinions. ...................................................................................................................................... 51
Table 15. Qualitative judgments attributed to the comparisons of Patient Costs criterion by every
surgeon and the group. The initials are according to MACBETH scale: N – No; VW – Very Weak; W –
Weak; M – Moderate; S – Strong; VS – Very Strong; E – Extreme. The hyphen represents that more
than one categories were attributed and the strikethrough represents an inconsistent judgment, being
the correction adopted presented after the arrow. ................................................................................ 52
Table 16. Value Scales built according to the consistent qualitative judgments for the individual and
group opinions. ...................................................................................................................................... 53

xi
Table 17. Ranking of the criteria according to the attractiveness of the neutral-good improvement and
its classification using MACBETH scale: N – No; VW – Very Weak; W – Weak; M – Moderate; S –
Strong; VS – Very Strong; E – Extreme. In the cells in boxes (D5) the ranking was inconsistent with the
judgments and the order was swapped. ................................................................................................ 55
Table 18. Patient A and B performances in ELC and ILC according to the answers obtained by the
patients. ................................................................................................................................................. 58
Table 19. Patient A best and worst cases reported by the patients of the two treatment options. ....... 58
Table 20. Patient B best and worst cases reported by the patients of the two treatment options. ....... 59

xii
Abbreviations
AAC – Acute Acalculous Cholecystitis;
ACC – Acute Calculous Cholecystitis;
AHP – Analytical Hierarchy Process;
DMII – Diabetes Mellitus Type II;
ELC – Early Laparoscopic Cholecystitis;
EOS – Early-Onset Scoliosis;
ILC – Interval Laparoscopic Cholecystitis;
MACBETH – Measuring Attractiveness through a Categorical Based Evaluation Technique;
MCDA – Multicriteria Decision Analysis;
OA – Osteoarthritis;
TKA – Total Knee Arthroplasty;
USA – United States of America.
1
1. Introduction
Surgeons must be always prepared to make a decision. They are expected to have the capacity of
making good decisions, i.e., they are expected to choose the procedure that solve the problem of the
patient, to perform it at the right time, and to perform it well. But how do they make a decision? How do
they choose what to do in a situation?
There are four strategies mostly followed by surgeons to make a decision: intuitive, rule-based,
analytical and creative. Intuitive is when the answer is immediate, being this capacity improved with their
experience; rule-based happens when a standard procedure is followed, often used by the novices;
analytical is when there are several options remembered and the doctor decides what he thinks it is the
best to the situation and creative strategy occurs when the doctor creates a solution. Intuitive and rule-
based strategies are the most used in surgical decision making.
Additionally, to instruct themselves with all the possibilities, doctors have access to the scientific
updates. The medicine area is always an interesting study object and there is always something to
explore and discover. Scientific data are always updating and doctors can access that data.
Nevertheless, despite the known strategies of thinking and the access doctors have to the more
recent scientific evidence, there is a lot of variability in surgical decision making and it exists not only in
the cases where the evidence is low, but also when there is scientific data available on the subject.
Variability occurs when similar patients receive different treatments depending on the doctor, the
demographic region or the period of time they are treated but it is defined as unwanted when it is not
explained by patients’ preferences [1].
Even with the known strategies, the decision making process is not so linear, surgeons remember
different situations and their experience can be considerably different, which contributes a lot to their
way of thinking. Besides that, there are factors that affect their decision making capacity and that can
also trigger the variability such as fatigue, sleep deprivation, stress or biases, which all human beings
are exposed [2].
The procedures that present more variability are the preference-sensitive care procedures, which
are the ones that imply serious trade-offs to the patient, affecting his quality and length of life. The
variability in this procedures occurs either by the doctor beliefs about the effectiveness of the procedures
or by how the doctor includes the patient preferences.
In the surgery field, it was already demonstrated that surgeons’ opinions influence a lot the decision
making process: 70% of the times surgeons choose a treatment according to their preferences instead
of looking to the circumstances [3]. Thus, this thesis aims to observe the variability in surgical decision
making as a consequence of the different opinions of the surgeons.
A specific disease, acute cholecystitis, will be used to illustrate how surgeons evaluate their patients
state, which is the basic information used to choose a treatment. Acute cholecystitis was chosen
because of the controversy that exists worldwide in the choice of treatment for patients with more than
72 hours of symptoms. Basically, there are two main ways of treatment, while in one the patient has a
surgery with the tissues inflamed, which is associated with more technical difficulties, in the other there
is a waiting time for the tissues to calm down before the surgery, with the patient treated with antibiotics,

2
and during this time complications can occur leading to a surgery with the body in a worst state. There
is not an optimal choice.
Merging the lack of consistency in the treatment choice for this disease with the interest of studying
the variability, this thesis intends to understand how surgeons make decisions concerning the treatment
of acute cholecystitis, applying multicriteria methods, as well as constructs a decision support model to
assist surgeons in this decision. The methods will be applied to a group of ten surgeons of Hospital de
Santa Maria, individually, and then as a group. This way, it could be possible the exploration of the
variability between the opinions, either individually or between each surgeon and the group and, at the
same time, the model of the group provides a decision support model that can be a useful tool to the
hospital.
During this work, first, a literature review was made to understand the disease and its possibilities
of treatment and see the reason why there is not a standard measure for the patients. As this treatment
choice was mentioned in first meetings in the hospital as a decision with several areas of concern,
multicriteria decision analysis in healthcare was also reviewed.
Then, the proposed multimethodology to obtain the models according to the surgeons, individually
and in group, for the exploration of the variability and the development of a decision support model for
the hospital was planned. The models are multicriteria and their development followed the MACBETH
(Measuring Attractiveness by a Categorical Based Evaluation Technique) approach.
The multimethodology involves first the structuring of all the models, since individual and group
models will have the same structure to be comparable. For this phase, exploratory interviews with all
the surgeons, individually, will be made to explore the decision context and all the needed information
for the structuring itself.
Then, the individual models will be made first, for the surgeons not to be influenced by the other
opinions. To develop the individual models, a web-based platform will be implemented with MACBETH
based questions to obtain all the needed information about the individual opinions of the surgeons.
The compromise model for the group is then developed. This development will also need information
about the opinion of the surgeons, but this time it is a group opinion. For that, a decision conference will
be made, creating the model on-the-spot.
These steps allow the accomplishment of the objectives since the individual and the compromise
models can be used for comparisons, observing its differences and exploring the variability associated
with the opinions of the surgeons, and the compromise model can also be used as the decision support
model for the hospital. The decision support model supports the decision of the treatment for acute
cholecystitis because it will evaluate the patient state according to the expected outcomes of each
treatment and consequently it can be seen how much a treatment is beneficial for a specific patient,
providing the doctor the information of which treatment contributes in a more positive way for the quality
of life of the patient.
Regarding this document, besides this introductory chapter, it is divided in six more chapters. In
chapter 2 it is presented the context of the decision: how do surgeons make decisions, how that leads
to variability and how can the unwanted variability be decreased. Chapter 3 is the literature review and
in this chapter the acute cholecystitis is explained, as well as its options of treatment. The variability

3
studies in health in literature are mentioned and the multicriteria decision analysis in healthcare is
explored. Chapter 4 is dedicated to the methodology and application of the methods of this thesis. The
results are presented in chapter 5 and the discussion in chapter 6. Chapter 7 is dedicated to the
conclusions and future work.

4
2. Context
2.1. Surgical Decision Making
The ability to operate and the capacity to make good surgical decisions are essential qualities
in every surgeon. Surgeons must choose the right procedure, the right time to do it and do it well. These
are characteristics that everyone expects in a surgeon and, in fact, they can be improved: repeating
procedures, receiving feedback and updating skills will be reflected in the surgeon’s dexterity and
through learning, experience and reflection their decision making capacity can be improved, as well [2].
Surgeons repeatedly face situations in which they must be ready to make a decision. In the
operating room, for example, they have to be prepared to decide whether the situation is familiar, with
common problems, or whether it is an unexpected event thus, they must be able, in the moment, to
make a decision under uncertainty and deal with situations they have never dealt before. To do that,
they have to be well informed about their patient condition, biomedical and non-biomedical data and the
events of the patient history that can be related with his disorder [2]. These factors combined with the
surgeon’s expertise and capability, both obtained by surgical training, experience and feedback, will
guide the decision making in the surgery field [2].
Surgeons make decisions through four different strategies: intuitive, rule-based, analytical or
creative. In the intuitive strategy, the situation and the answer are quickly recalled, being this strategy
improved with the surgeon’s experience. The rule-based strategy occurs when the surgeon applies a
standard procedure, remembered or looked up, and it is often used by the novices. The analytical
strategy is also named option comparisons because the surgeon evaluates a certain number of
reminded possibilities and decides the best according to the situation. And, finally, the creative strategy
occurs when the situation is a new one and the doctor has to come up with an innovative solution, which
is barely used in situations of high time pressure and risk [4]. According to these strategies, Flin et al.
presented a naturalistic model, which has two steps: assess the situation and making a decision,
presented in figure 1. Naturalistic decision making is an approach where the decision makers are studied
in operational environment, the operating room in this case, and it is expected to obtain a description of
how they make decisions in risky situations [4].
Figure 1. Naturalistic model of intraoperative decision making [4].

5
There are more studies focused on surgical decision making in nonroutine situations, i.e.,
focused on intraoperative decision making. These studies follow and show evidence of, mainly, three
different approaches: (1) the possibility of decompose and identify decision making steps and influences
for a certain procedure, (2) the predominance of intuitive and analytic strategies, and (3) the existence
of a “cognitive shift” when surgeons foresee a challenge, that is, a “slowing down” moment as a response
of an unexpected occurrence [5]. With all these facts established by previous research, Cristancho et
al. sought to enrich information on how surgeons perceive and solve a situation, providing a naturalistic
model based on surgeons’ behaviours and their reflections, after the surgery, describing their actions
[5]. The model shows that the surgeons begin surgeries with a planned course of action (CoA, in figure
2), which is continuously assessed. It is a cycle, so, the course of action can be referred not only to the
planned before the surgery but also to each minor phase of the operation [5].
Despite of the training that surgeons receive in his lifetime and the attempts to understand how
surgical decision making is made, surgeons have not the same cases, the same operating room
conditions or even the same thinking. Thus, when they make a decision they recall different events and
think differently providing sometimes a solution that can vary from surgeon to surgeon. There are, also,
other factors that affect the decision making capacity, providing a different result between surgeons and
even within the same surgeon to different situations, such as fatigue, sleep deprivation, mood, illness
and stress, which can be raised by time pressure, for example [2]. The biases that a surgeon can follow,
as a human being, together with these aspects can contribute to trigger the clinical practice variability.
2.2. Variability
Variability was first pointed out by James Alison Glover, a British paediatrician, in the 1930s. He
observed an increase in the variation of tonsillectomy (operation for tonsillitis) rates in children of a
Figure 2. Naturalistic model provided by Cristancho et al.[5]

6
school area, despite of not existing significant difference in tonsillitis. Glover found that a single physician
was responsible for the medical choices. With the arrival of another physician at the school, the
tonsillectomy rates there fell and stayed low for years. Then, Glover concluded that the difference in
rates was due to different “medical opinion” instigated by the two different doctors [6][7].
Despite not having a standardized definition, P. Kennedy et al. gave to the clinical practice
variation the following definition: “patients with similar diagnoses, prognoses and demographic status
receive different levels of care depending on when, where and by whom they are treated, despite agreed
and documented evidence of “best practice””. The variability is difficult to quantify but it is known that
what is considered effective is not always what occurs in practice. Dartmouth Medical School showed
that 30% to 40% of regional Americans receive care inconsistent with recent evidence, many times care
reveals “clinician or organizational preference, not patient needs”, and 20% to 25% of care is not
necessary, being, sometimes, harmful [1]. Regarding surgical rate, variations between observed and
expected rates are presented in figure 3, below, where it is possible to see it for different procedures
among hospital regions, in the United States. The main reason pointed for this regional variation was
the different physicians’ opinions indicating for surgery [8][9].
Over the past years, it was seen that variability is more frequent in procedures that involve
significant trade-offs to the patient, affecting his quality and/or his length of life. These procedures are
defined as preference-sensitive care and they are the ones that present more disagreement in the
decision making in both diagnosis and treatment [10][6]. The disagreement is shown by, first, the
surgeon beliefs: they diverge about the strategies that are optimal to a certain case and about the
effectiveness of surgery; and second the patient preferences: the importance, and consequently the
Figure 3. Variation profiles of 11 surgical procedures among hospital regions, in the United States. Each point represents the ratio of observed to expected. [8].

7
level of inclusion, that the surgeon gives to them [10][9]. The patient’s behaviour or the disease burden
are not so much dominant in the variability [4].
Decisions in preference-sensitive care must reflect patients’ preferences and, to make that
possible, patients must have enough information and understanding on their situation [6]. For example,
we can look at early stage breast cancer. In this type of cancer there are two main surgical treatment
options that a person can be submitted: mastectomy and lumpectomy. The first is the absolute removal
of the breast and the second is a local excision of the tumour that can include radiation and/or
chemotherapy. Both approaches present about the same impact on survival, however, they also have
other outcomes that are quite different. While a mastectomy involve the loss of the breast and possible
prosthesis, the lumpectomy is associated with a risk of recurrence [6]. These consequences can affect
women in a different way. Psychologically, while for some women the risk of recurrence is worse than
the loss of the breast, for others it is not, and the aesthetic impact would bring more harm to their health.
Nevertheless, it was suggested by the Dartmouth Atlas of Health Care that the variations in rates of the
decisions in preference-sensitive care procedures are intensely influenced by local medical opinion and
this opinion is not always the same as the one that a well-informed patient would have [6].
The influence of local medical opinion can be seen, for example and using the breast cancer
cases, in the variation of the number of women undergoing lumpectomy in different regions in the United
States. In a study in the 1990s, regions were found with no lumpectomy cases reported and, at the same
time, regions where this procedure was selected in 50% of the cases, being some of this huge
differences in adjacent regions. This brought curiosity, and even with arguments defending that this
variation was due to patients’ preferences, an investigative report visited Rapid City, where lumpectomy
was the choice in only 1% of the women, and discovered that the surgeon there did not offer the option
of lumpectomy and defended mastectomies, which enhanced his influence [6].
Many other studies have been made concerning variability. In 2007 it was shown that some
characteristics of surgeons end in different outcomes for the patient. For example, regarding the number
of procedures already made by the surgeon, it was noted an association between higher number of
performed procedures and better outcomes for interventions like esophagectomy and pancreatic cancer
surgery [11]. The number of performed procedures will be noticed in a surgeon expertise, due to the
learning associated with the experience, and he also tends to follow an approach according more to his
training and preference than to the compared effectiveness of the intervention [9]. So, additionally to the
surgeons’ different background on their instruction, their personalities also result in diverse decisions,
deciding 70% of the times according to their favourite strategies while the circumstances influence only
the rest 30% [3]. This leads to a considerable variation between regions, hospitals and even surgeons
in the same hospital [9].
This surgeon preference is based on his recognition of patterns, according to his experience, but it
can also be interfered with bias related to lack of information [12]. Despite of variability in practice being
a common phenomenon even with agreed guidelines, the existence of evidence-based guidelines,
frequently revisited, is believed to minimize the effects of surgeons’ individual preference, without taking
his independence, and allows a major focus on the patient [1][12].

8
2.3. Decreasing Unwanted Variation
F. Hajjaj et al. reviewed non-clinical influences on clinical decision making. They defend that non-
clinical influences, presented in figure 4, must be identified to be considered in surgical decision
otherwise these influences can lead to “sub-optimal decision-taking”. The decision making process is
something that physicians can be taught, during their training, allowing them to become more alert to
these influences and choose more consistent paths and, also, more directed to their patients’ interests,
increasing the equality of treatment [13].
Nevertheless, to reduce unwanted variation, the most common measure is the development and
implementation of guidelines, evidence-based paths and protocols. The implementation is not so simple
because they have to provide an easy usage and doctors have to believe that the materials are
appropriate to the situation. Some surgeons’ common thinking, pointed out by P. Kennedy et al., is that
guidelines don’t bring new information, just reinforce the methods already used, or that there is no need
of learning new methods if the existing ones are enough to solve the problem. So, informing clinicians
and involving them in the development and implementation processes are considered the best ways for
them to recognize and use the materials [1].
Involving doctors in processes is associated with a personal level, but the organizational level of the
hospital and the teaching system have influence in variation, too. So, to decrease the unwanted
variation, efforts cannot be focused on just one level [1].
Decreasing the variation, a more standardized way of acting is achieved. A recent research
identified standardization as one of the best practices in high-performing health systems in the United
States. Besides, the reduction of the variation was also identified as important for the quality and safety
dimensions, once it allows a decrease of mortality and morbidity and a more patient-focused care. Thus,
increasing quality, safety and standardization of the procedures, greater efficiency can be reached [1].
Figure 4. Non-clinical influences on clinical decision making. [13].

9
Tracking patient outcomes was proven, by The Dartmouth Atlas of Health Care, to be also an
effective approach to reduce variation in surgical treatments and it is easier nowadays with the
development of technology than when the information was in paper records. Figure 5 allows the
observation of the influence of information and uncertainty in the variation of the decisions. Shared
decision making is another strategy that can decrease the variation, increase patient satisfaction and
provide better outcomes. It allows the patient to really understand the situation, taking his preferences
into the decision, avoiding him to be so influenced by the doctor individual opinion [8].
This thesis aims to study the variability in surgical decision making caused by surgeons’ different
opinions. Since the standardization of the procedures is a mean to reach efficiency, observing if
individual opinions converge to the same solution is also a motivating subject to explore. To do that, it
is interesting to use a specific case, a disease, and see how surgeons think and what they want to
achieve when selecting a treatment option. Acute cholecystitis is a disease where controversy remains
when choosing the right time to operate, so, it proved to be interesting to use it as a practical case. The
next chapter is dedicated to learn a bit more of acute cholecystitis condition and its treatment’s options
as well as to explore the literature about variability and muticriteria decision analysis in healthcare.
Figure 5. Information and uncertainty affecting variation in surgical care [8].

10
3. Literature Review
Acute cholecystitis disease and its treatment options will be used in this thesis to illustrate how
surgeons make decisions, how different are their opinions and how can a decision support tool be
developed. Thus, this chapter provides an explanation of this disease and a review on the treatment
choice issue.
Having the support of Hospital de Santa Maria’s surgeons, it was perceptible, in preliminary
meetings, that this is an innovative subject to explore especially for the cases of patients with symptoms
for more than 72 hours because there is not so much literature focusing on these cases and the one
available has much controversy associated. It was also perceptible that this decision brings concerns at
several levels to the surgeons, so, here it is also reviewed the use of multicriteria decision analysis in
healthcare for investigate the possibility of collapse all the surgeons multiple concerns about the result
of the treatment choice in an overall score that translates its benefit for the patient.
Databases as Google Scholar, PubMed, B-on and ScienceDirect were searched for this literature
review using expressions as Surgical Decision Making, Choice of a Treatment, Multicriteria Models,
MACBETH, Acute Cholecystitis, Variability and its combinations.
3.1. Acute Cholecystitis
The gallbladder (figure 6 [14]) is the organ that stores temporarily the bile, after its production in
the liver, and then releases it into the small intestine, where it helps the fat digestion. Due to the
saturation of the bile with cholesterol and bilirubin, gallstones can be developed in the gallbladder,
known as cholelithiasis, which affects about 5% to 25% of the population [15][16].
Most cholelithiasis cases are asymptomatic, annually only 1% to 4% become symptomatic, and
the symptoms can involve pain (biliary colic), obstruction of the bile’s flow from the liver and gallbladder
into the small intestine (obstructive jaundice – seen for example in the yellowish decolourisation of the
body), bile infection (cholangitis), inflammation of the pancreas or inflammation of the gallbladder,
Figure 6. Biliary System [14].

11
denominated cholecystitis, which can occur also as a consequence of the other symptoms (for example,
it can occur in about 20% of the biliary colic cases by itself) [15][17][18].
Acute cholecystitis episodes cause intense pain and fever and occur, more frequently (95% of
the times), after an obstruction of the cystic duct with gallstones and consequent gallbladder chemical
or bacterial inflammation [16][18]. The cases associated with gallstones, i.e., associated with
cholelithiasis are named acute calculous cholecystitis (ACC). However, about 5% of acute cholecystitis
cases are not associated with cholelithiasis, it can be associated to conditions such as HIV or diabetes
or, rarely, to tumours of the gallbladder, and are denominated as acute acalculous cholecystitis cases
(AAC) [18]. Comparing AAC with ACC cases, the previous ones are more abrupt and are associated
with “significantly higher morbidity and mortality” [19]. The latter cases, ACC cases, occur three times
more in women than in men up to the age of 50 years. Then, occur about one and a half times more in
women than in men [18].
The risk factors of this condition are the gender (females have more risk), the older age, being
pregnant, being subjected to a hormone therapy, obesity, fast alterations of weight, diabetes (as said
before) and being Native American or Hispanic [20].
The next section will explore the possible treatments that a person can be submitted, when
having an acute cholecystitis crisis.
3.1.1. Acute Cholecystitis Treatment
Acute cholecystitis is one of the most common acute abdomen diseases in emergency room
being its preferred treatment the removal of the gallbladder, named cholecystectomy [16]. In the UK,
60 000 cholecystectomies are performed annually, being 13 000 resulted by acute cholecystitis events
[15]. In the United States, also per year, 120 000 cholecystectomies are performed due to cholecystitis
cases [17].
Over time, acute cholecystitis cases had different treatment approaches. In 1882, Carl
Langebuch, a German surgeon, performed the first open cholecystectomy [21][22]. Then, until the
1970s, the typical treatment was the inflammation control, as a first step, and only then an elective
(planned, scheduled in advance) open cholecystectomy, 4 to 6 weeks later. However, many times
complications occurred in this waiting time, leading to the earlier surgeries exploration. Early open
cholecystectomies started to take place, after the 1970s, and rapidly became the treatment of choice,
until the 1990s, and besides the complications’ minimization it also revealed shorter hospital stay and
less pain to the patient [23].
The first laparoscopic cholecystectomy was performed on September, 12th of 1985 by Erich
Mühe, also a German surgeon, more than 100 years after the first open cholecystectomy [21][22].
Laparoscopic cholecystectomies (scheme in figure 6, [14]), after the 1990s, gradually replaced the open
surgeries and became the standard treatment of acute cholecystitis. This happened due to the
equipment development and improvement and, consequently, the expertise growth of the surgeons. In
Portugal, the laparoscopic surgery was introduced in 1991 [24].

12
Compared to the open surgery, laparoscopic surgery brought faster patient recovery, even
shorter hospital stay, better cosmetic results and a decrease in hospital costs. Nevertheless, 2% to 30%
of laparoscopic cholecystectomies are converted to open surgeries due to the technical difficulties
brought by the severe inflamed tissues which turns the anatomy unclear [23][25][26]. To avoid this
conversion to open surgery due to technical difficulties, sometimes the laparoscopic cholecystectomy is
performed after a conservative treatment, which is a period when the patient does antibiotic therapy,
allowing the treatment to calm the inflammation first and the surgery takes place only when the body is
not in an acute crisis, i.e., when the tissues are not so inflamed. On the other hand, in the time of
conservative treatment, complications can occur, leading to urgent surgeries with the tissues still
inflamed and with more technical difficulties associated with the urgency. There are, also, some patients
who cannot undergo a surgery. For severely ill patients in intensive care and patients who cannot
undergo anaesthesia a third approach is recommended, a cholecystostomy (placement of a tube in the
gallbladder to drain it, figure 7 [27]) [28][29]. After the drainage, if the patient is feeling better, sometimes
he can have a surgery [20].
Summing up, there are two main ways of treatment of acute cholecystitis, excluding the special
cases of really ill patients who are recommended to undergo a drainage of the gallbladder
(cholecystostomy), which are early laparoscopic cholecystectomy, when the surgery is performed in the
acute crisis, in the first hospital admission; and interval laparoscopic cholecystectomy, when the patient
undergoes an antibiotic therapy period and his surgery is planned for a period of time after the acute
crisis and the antibiotic therapy. These two approaches have pros and cons, while the early approach
is performed when the tissues are inflamed which brings more difficulties to the surgery, the interval
approach has a waiting time that sometimes leads to urgent surgeries, even worst to deal with.
So, nowadays, the main question is when to operate: if immediately or after a conservative
treatment, i.e., which way brings more value to the patient quality of life, the early or the interval
approach? The next section presents a research on this timing problem, trying to point out what is known
and what is not known yet.
Figure 7. Schemes of laparoscopic cholecystectomy, in the left ([14]), and of cholecystostomy, drainage of the gallbladder, in the right ([27]).

13
3.1.2. Early versus Interval Cholecystectomy
Early laparoscopic cholecystectomy (ELC) and interval laparoscopic cholecystectomy (ILC) are
compared in several studies and recent randomized trials had recognised that both approaches are as
“safe and effective” [30]. However, controversy remains. The problem is that, although the numerous
studies comparing both procedures, there is not a consensual definition of early, many studies involve
few patients and antibiotic routine in conservative treatment is not standardized [28]. In a review article,
of 2014, the clinical safety and outcomes of these approaches were compared, and it is possible to
observe the lack of a consistent definition of early, which in the compared trials varied “from 24 h to 7
days after either the onset of symptoms or the time of diagnosis at hospital admission”, presented in
table 1 [16].
Table 1. Information of a review article. It is possible to see the lack of consistency when talking about the timing of early surgeries [16].
Study Participants Interventions
Revie
w a
rtic
le,
2014 [
16] – L
itera
ture
Searc
h
(Gutt et
al. 2013)
Adults with acute cholecystitis 2 random groups:
-ILC (<24 hours of admission,
n=304);
-DLC (delayed by 7-45 days, n=314).
(Yadav
et al.
2009)
Adults with acute cholecystitis. Exclusion criteria: (1) symptoms
more than one week; (2) common bile duct stones or ductal
dilatation; (3) contraindication for laparoscopic surgery; (4) people
who refused to undergo laparoscopic surgery.
2 random groups:
-ELC (as soon as possible, n=25);
-DLC (delayed by 6-8 weeks, n=25).
(Kolla et
al. 2004)
Adults with acute cholecystitis. Exclusion criteria: (1) symptoms
more than four days; (2) previous history of upper abdominal
surgery; (3) contraindication for laparoscopic surgery; (4) common
bile duct stones.
2 random groups:
-ELC (<24 hours of randomization,
n=27);
-DLC (delayed by 6-12 weeks, n=36).
(Johans
son et al.
2003)
Adults with acute cholecystitis. Exclusion criteria: (1) symptoms
more than one week; (2) older than 90 years old; (3) bilirubin more
than 3.5mg/dL.
2 random groups:
-ELC (<7 days of diagnosis, n=74);
-DLC (delayed by 6-8 weeks, n=71).
(Davila
et al.
1999)
Adults with acute cholecystitis 2 random groups:
-ELC (<7 days of diagnosis, n=27);
-DLC (delayed by 2 months, n=36).
(Lai et al.
1998)
Adults with acute cholecystitis. Exclusion criteria: (1) symptoms
more than one week; (2) previous history of upper abdominal
surgery; (3) contraindication for laparoscopic surgery; (4) common
bile duct stones; (5) acute pancreatitis or acute cholangitis.
2 random groups:
-ELC (<24 hours of randomization,
n=53);
-DLC (delayed by 6-8 weeks, n=36).
(Lo et al.
1998)
Adults with acute cholecystitis. Exclusion criteria: (1) symptoms
more than one week; (2) previous history of upper abdominal
surgery; (3) contraindication for surgery; (4) more than three days
of admission; (5) uncertainty about diagnosis; (6) peritonitis; (7)
pregnancy.
2 random groups:
-ELC (<72 hours of admission, n=45);
-DLC (delayed by 8-12 weeks, n=36).
Regarding the problem of timing, recent studies tried to define how early should a
cholecystectomy be and demonstrated that until 72 hours after the onset of symptoms a

14
cholecystectomy is safest [26][31]. So, nowadays it is settled that until the 72 hours the surgery is more
effective than the conservative treatment, but the problem remains in patients who present symptoms
for more than this time.
Tokyo guidelines were made in 2007 [32] concerning the timing and the optimal treatment for
acute cholecystitis and were revised in 2013 [33]. Patients were divided by grade of severity: mild,
moderate and severe. Having more than 72 hours since the beginning of symptoms is a characteristic
to fit in moderate category and this cases don’t have a unique optimal treatment, early cholecystectomy
is advised however the inflammation can produce technical difficulties and in that case “(…) medical
treatment and delayed cholecystectomy are necessary” [32]. Thus, this guidelines do not answer to the
problem investigated here: the patients with more than 72 hours of symptoms.
After 72 hours since the onset of symptoms, the gallbladder wall thickening can be a problem
so, in one hand, an interval cholecystectomy could be the answer, since its initial conservative treatment
could treat the inflammation first but, in the other hand, it is not so simple because complications can
occur in the waiting time (failing of the conservative treatment) leading to urgent surgeries, which can
be worse than an early surgery with technical difficulties caused by the inflamed tissue [30]. This urgent
surgeries happen in 18% of the interval cholecystectomy patients [34]. It is the difficulty after this time
that this thesis aims to explore: After 72 hours of the onset of symptoms, which treatment brings more
value to a patient, in the surgeons’ point of view? The surgery when the patient is admitted to the hospital
or the surgery only after the conservative treatment (antibiotic therapy)? It is important not to forget that
patients are different and there are co-morbidities that have influence in the result of each way of
treatment, so, patients can be grouped in similar cases but it is not possible to use a single patient case
to represent them all.
While exploring what would be the procedure with more benefit to each patient, surgeons have
to explain their concerns and opinions. Observing first their individual opinions, independently, allows
the exploration of the variability between them, and then it is possible to observe if their opinions, even
when different, converge to the same recommendations to the patient. Additionally, observing the
opinion of the group, it is possible to see how the compromise opinion is different from the individual
ones.
3.2. Reporting Variability
The Dartmouth Atlas of Healthcare, in the series “Variation in the Care of Surgical Conditions”,
is dedicated to the observation of many cases of surgical variability in the United States. Over time,
quality in surgical procedures increased but many times there is not enough information about the
benefits and the risks of all alternatives because the report of the outcomes differ across hospitals and
doctors. Additionally, when and if doctors advise their patients to make a decision, the patients don’t
fully understand the implications of their choice. As said, the variation in care that are not explained by
the patients’ preferences or needs is unwarranted and, in this series, it is defended that it reflects both

15
gaps in outcomes exploration and poor quality in patients’ decisions and many times it is explained by
the influence of local medical opinion, as mentioned before [8].
To explore the variability, in this series they studied a set of health conditions with a previous
structured report. Since the differences in outcomes reporting was defined by them as a problem that
contributes to the variation in care, using a structured report they could obtain consistent information to
be possible the comparison between treatment alternatives. Their protocol included four sections: the
time before, during, after and beyond surgery. Thus, all the challenges in care could be monitored, being
possible to observe what situations bring more disagreement, and ways of increasing population’s health
and decreasing costs could be explored [8].
This section presents two more examples of studies made concerning variability on physicians’
recommendations for treatments, to observe how the variability was demonstrated in these cases.
3.2.1. Total Knee Arthroplasty (TKA)
In 2014, L. Fraenkel et al. explored the factors influencing physicians’ recommendations for
using TKA in the treatment of knee osteoarthritis (OA). TKA is considered an effective treatment for
knee OA cases and it is one of the most performed procedure in the world. Nevertheless, there is
significant differences in the number of TKAs performed across regions and it happens not only due to
the patients’ preferences or the disease state but also due to unwanted sources of variability such as
the patient ethnicity, gender, motivation and the physician’s opinion [35].
For the observation of the variability in doctors’ opinion, in this study they used composed
scenarios of patients and obtained, by an online survey, doctors’ recommendations for a TKA, in a scale
from 1 to 6, where 1 meant a very strong recommendation for a TKA and 6 a very strong
recommendation for not to do it. There were two groups of surgeons, orthopaedic and rheumatologists,
and each one completed a random scenario, chosen using a computer generated list of random
numbers. The scenarios had a mutual layout, which was a 62 year old person with knee OA with
moderate knee pain limiting vigorous activity despite medical management, and they varied only in the
patient gender, employment status (business manager versus retired/housewife) and x-ray (mild versus
moderate OA), since it was expected to observe the effects of these characteristics on the doctors’
opinions [35].
In conclusion, they observed that patient and doctor characteristics had influence on the
decision and the different surgeons, orthopaedics and rheumatologists, presented different ways of
making a decision. For example, it was observed a gender bias only in the orthopaedic doctors, who,
for the same cases, were less likely to recommend a TKA if the patient was a woman. However, it is
important to note that this study has the limitation of the composed scenarios not represent the truth
complexity of the clinical practice [35].

16
3.2.2. Early-Onset Scoliosis (EOS)
Vitale et al., in 2011, studied the variability in surgical decision making for treatment of children
with EOS. Scoliosis is a deviation of the spine axis and, despite having a set of treatment options, there
is not a most appropriate one [36].
For the observation of the variability, thirteen experienced spine surgeons submitted,
electronically, a case of EOS and they were presented with twelve cases, all cases except the one they
submitted. They were asked, and the variability was assessed, about four areas: choosing type of
treatment, choosing type of construct, choosing construct location, and saying whether a thoracotomy
(a procedure to access the thoracic organs) should be executed. Six months later, surgeons gave a
second set of responses, following the same instructions. The results were analysed descriptively and
using a software of statistical analysis [36].
In the second assessment, some recommendations of the surgeons changed. The study
contributed to demonstrate the surgical variability, as intended. As it happens with many other studies,
this study exhibits the importance of the development of strategies to help surgeons decide in a more
standardized way, especially in diseases that don’t have an optimal treatment, as in the EOS cases [36].
As seen in these studies, there is a particular interest in the study of the variability resultant of
doctors’ different opinions. Additionally, the standardization of the procedures seems to be a curious
subject to explore. The next section searches the use of multicriteria decision analysis in healthcare,
which can be a useful way of observing opinions and develop a more standardize way of acting.
3.3. Multicriteria Decision Analysis (MCDA) in Healthcare
Since the surgeons mentioned that deciding the treatment in acute cholecystitis patients has
several concerns and dimensions to evaluate, the possibility of collapsing all the dimensions in a score
that evaluates how beneficial is the treatment seems to be a suitable approach to follow. MCDA
approach allows obtaining a score that translates the overall value of an option, providing an ordering
of the options’ set [37][38]. In 1976, Keeney and Raiffa were the first ones to completely expose MCDA
using decision trees to settle multi-attributed consequences [38].
In 2014, G. Adunlin et al. conducted a systematic review and bibliometric analysis about MCDA
in healthcare. It included English language studies since January 1, 1980, until October 1, 2013. For
this period of time, electronic databases were accessed and conference proceedings were hand
searched for the investigation. MCDA was noted as one of the most often used approaches in decision
making and it has been applied in several areas, with success, being recognised as a big potential
approach for improving and supporting decisions in health. Its potential is characterized by its capacity
to turn the decision process more “explicit, rational and efficient”. This systematic review differentiates
itself because it tries to include all the MCDA techniques and not only focus in a specific one. To be
included in the review, the studies had to describe the used MCDA method, to answer a health related
problem and to explicit the stakeholders’ preferences and/or values. The review included 66
17
publications, and it is possible to see the number of studies per year, in the graph presented in figure 8,
below [39].
This review has some limitations: it is possible that it does not include all the publications,
because it only included English language studies and some could have not been identified; there is not
a standard report for the included studies, which affects the quality of the review; and some publications
could have bias. Nevertheless, it has a more strict and clear approach for reviewing and it has larger
time frame than previous reviews [39].
Previous studies had emphasized that the application of these techniques could improve the
decision making, which was confirmed by this review. Moreover, the number of studies over the years
reveals the growth of MCDA in healthcare area [39].
The most used technique recognized in the studies was Analytic Hierarchy Process (AHP), the
top area of application was “Diagnosis and Treatment” (39% of the studies), cancer was the most
researched issue and the country with more studies was the USA (United States of America) [39].
Despite AHP technique being used in several studies it is criticised by several studies. One of the
criticisms, presented by C. Bana e Costa and J. C. Vansnick, is that it violates the “Condition of Order
Preservation”, which defends that in a set of alternatives the order of preference must be preserved as
well as the order of intensity of preference [40].
MACBETH (Measuring Attractiveness by a Categorical Based Evaluation Technique) is another
approach of MCDA. It is, according to C. Bana e Costa, an “humanistic, interactive and constructive
approach” and it allows building a quantitative model based on qualitative judgements of difference of
attractiveness [41]. Expressing the preference judgments numerically was already characterised as
difficult and cognitively uneasy [42], so the possibility of obtaining a quantitative model based on
qualitative preference judgments is an impressive characteristic of this approach.
Typically, this approach starts by a structuring phase where the problem context is explored,
defining the multiple criteria of the decision and their descriptors of performance. The descriptors of
Figure 8. Number of publications included in the systematic review per year of publication [39].

18
performance allows to turn the criteria comprehensible, providing a performance scale that allows to
characterize an option’s performance on each criterion. The performance scales are then converted to
value scales by comparing the levels, two at a time, and collecting qualitative judgments about their
differences of attractiveness. When comparing the levels, the qualitative judgments are asked to be
given according to a set of categories: no (when the levels are equally attractive), very weak, weak,
moderate, strong, very strong and extreme; being allowed hesitation between more than one
consecutive categories. When some judgment is given, the consistency of all the judgments collected
until then is verified and if there are inconsistent judgments suggestions are made to correct it [42][43].
After building all the value scales, the criteria weights are also obtained considering qualitative
preference judgments. The value scales have always two reference levels, 0 and 100, and
improvements on all the criteria, between these reference levels, are compared, ranked and its
attractiveness is classified in a MACBETH category providing the weights to the criteria [43].
MACBETH approach was already used in several studies in the healthcare context in matters
such as hospital auditing [42], prioritization of community care programmes [44], evaluation of health
and safety risks [45], planning of decisions in long-term care [46] or assisting in the diagnosis of
Alzheimer’s disease [47].
3.3.1. MCDA in Surgical Decision Making
In the healthcare area, MCDA techniques are used to several ends, such as new technologies’
evaluation, incorporation of stakeholder preferences, resource allocation, prioritization of investments
and evaluation of new drugs.
However, considering what is intended in this thesis, there are not so much examples to report
using a MCDA technique to evaluate treatment options. A comparison was made between AHP and
Conjoint Analysis to observe the differences in detecting patient preferences for treatment alternatives
for stroke rehabilitation by surveying the patients using questions according to the two methods [48].
Nevertheless, patient preferences are not the purpose of this thesis.
Evaluating treatment options considering the impact to the patient quality of life, in the surgeons’
points of view, is a more difficult matter to search. Seeing the problem from this perspective is believed
to be an important issue, too, because surgeons many times already do what they consider the best to
their patients’ quality of life, without considering the patients’ preferences, so, observe if they are doing
it well and/or consistently becomes important since the moment they started to do it.
Until now, it was explored the variability in surgery as a consequence of the different opinions of the
surgeons and it was elucidated the controversy associated with the decision of the treatment to acute
cholecystitis for patients with more than 72 hours of symptoms. It was mentioned that when deciding
which treatment to choose, a surgeon must take into account several parameters, which turns the
decision process into a much more complex task, bringing the concept of MCDA to this thesis.
Considering this situation, it became interesting the development of a multicriteria decision support

19
model to aid in the treatment choice for acute cholecystitis patients. As the exploration of the variability
between surgeons’ opinions remains as the initial proposed goal of this thesis, it would be interesting
the merging of the two subjects: explore the variability in surgeons’ opinions making use of multicriteria
methods to explore and understand how surgeons make decisions concerning the treatment of acute
cholecystitis patients, as well as build a decision support model to assist surgeons in the choice of
treatment. To achieve it, a methodology is proposed and explained in the next chapter.

20
4. Methodology
To meet the mentioned objectives, the building of a multimethodology based on the MACBETH
multicriteria approach as well as its application are explained in this chapter. The multimethodology will
be applied to 10 surgeons from Hospital de Santa Maria in Lisbon and it starts by using exploratory
interviews to understand and structure the multiple factors that surgeons consider in the evaluation of
patients and in the choice of treatments. Then, making use of a web-based platform that makes
MACBETH based questions, it is constructed an individual model that captures the views of each
surgeon. Then all surgeons are set to participate in a decision conference and a MACBETH group model
is built.
With the application of this multimethodology to surgeons, it is possible to explore the variability
across surgeons’ views, the convergence towards a group model, as well as, based on the group model,
to build a decision support model to assist them in future surgical decisions. Therefore, some hypothesis
can be investigated, such as:
How does a surgeon choose a path for a patient? Will the surgeon behave the same way to
other patients?
And other surgeons, what would they do in the same situation? Will they be in agreement?
And even with different judgments, the final result will be the same? How convergent will the
opinions be, between each one of them and with each one and the group?
Before explaining in more detail each step of the multimethodology and its application, there is an
overview of the steps and a section dedicated to the MACBETH approach, since it will be used in the
modelling of the individual and group models. Then, each section of this thesis tries to answer the
intermediate obstacles that must be overcame to achieve the objectives. First, the models have to be
structured: section 4.2 is dedicated to the structuring of the models (definition of criteria and descriptors
of performance), making use of exploratory interviews. After the structuring, the individual models are
built in section 4.3, where there is a need for planning and implementing a web-based platform for
collecting the judgments that allow the building of the value scales and the determination of the criteria
weights. Finally, section 4.4 is concerned with the compromise model for the group, which involves a
decision conference. So, in that section it is explained the planning and protocol of the decision
conference and how the model is created, on-the-spot.
4.1. Proposed Multimethodology
The proposed methodology to achieve the objectives mentioned before is a multimethodology
because it combines different techniques that complement themselves [49]. The multimethodology
follows a socio-technical approach since it involves a technical component, as the modelling of
surgeons’ choices in a multicriteria model, and a social component to obtain the information to be used
in the modelling. The advantages of this approach, according to L. Philips and C. Bana e Costa, are that
[37]: “(…) socio-technical process improves communication (…), develops shared understanding (…)

21
and generates a sense of common purpose (…)”, very important goals to reach specially in the
compromise model phase, once this phase produces the decision support model for the hospital, which
must be accepted by all the members of the group. The steps of the multimethodology are presented in
the scheme of figure 9 and the expected outputs in figure 10.
As said, the same steps of figure 9, above, are presented in figure 10, below, but together with the
expected outputs of each step.
Socio-Technical Approach
Social Component Technical Component
Exploratory
Interviews
Web-based
platform
Decision
Conference
Individual multicriteria models:
Modelling individual choices of
the surgeons using MACBETH
approach
Compromise multicriteria model:
Modelling choices of the group of
surgeons using MACBETH
approach
Database Access
Variability between
surgeons;
Individual multicriteria
models.
Variability between individuals and group; Compromise model: Decision support model.
Final Model
Structuring the multicriteria
models
Outputs
Figure 10. Socio-Technical approach that will be followed in this thesis. There are three paths, the grey, the green and the blue and the objectives of each path are presented at right.
Figure 9. Social and technical components of socio-technical approach that describes the multimethodology. The numbers
indicate the sequential order of the steps.

22
The figures presented a set of connected steps that use different tools. The technical component
will involve the use of MACBETH approach in the development of the individual and compromise
multicriteria models. For that reason, next section is dedicated to this approach, since it makes sense
to clarify it before entering in the detailed explanation of the steps of the multimethodology. The social
component will support the technical component, providing the information needed for the development
of the models using exploratory interviews, a web-based platform and a decision conference to interact
with the surgeons.
Initially and following the schemes of the figures, the models must be structured, i.e., the criteria
and their descriptors of performance must be defined for the decision problem. For that, individual
exploratory interviews will be made. These interviews will allow the study of the decision context and
the exploration if a multicriteria model is, in fact, appropriate for the problem. The answers of the
surgeons will be open, they can speak about their concerns and their objectives about acute cholecystitis
patients, but some relevant topics for the structuring of the models must be explored in all the interviews.
This way, it is easier to obtain information that can be used to develop the models without restraining
the surgeons’ opinions. The information obtained will be organized and after the interviews it is expected
to define the criteria and the descriptors of performance used to all the models, individual and group,
which makes them comparable.
After structuring the models, they can be developed. However, the individual models have to be
made first (as indicated in the numeration of figure 9), for the opinion of each surgeon not to be
influenced by the others. Thus, next step is the development of the individual multicriteria models, which
is made by building a value scale for each criterion and obtaining weights for the criteria. For accomplish
that, some questions have to be made to each surgeon and is here that the social component is inserted,
by the development of a web-based platform that provides all the needed information, enabling the
development of the individual models and, consequently, the exploration of the variability between each
surgeon.
Only after obtaining the individual models, the surgeons will be placed together for the development
of the compromise model for the group. The compromise model will also depend on the building of a
value scale for each criterion and obtaining weights for the criteria but, in this case, it will be made on-
the-spot in a decision conference. The decision conference intends to collect the same type of
information of the web-based platform, once again to allow the comparison of the models, but
considering the opinion of the group. So, after this phase, the compromise model is concluded and the
variability between the individual surgeons and the group can be also explored.
The compromise model provides a decision support model for the hospital, to support the decision
of treatment of acute cholecystitis patients (with more than 72 hours of symptoms). The model evaluates,
by an overall score, a patient state according to surgeons’ opinion allowing to get information about how
much each way of treatment contributes to improve the quality of life of a patient, telling the doctors
which treatment would bring more benefit in each case.
After the development of the decision support model, it would be possible to analyse the differences
between what was done in the past, in the hospital, and what would be done according to the model,

23
accessing the hospital database. This can be used to look for aspects that can be changed in the model,
allowing its improvement.
Using this multimethodology it is possible to obtain a decision support tool to assist the doctors in
evaluating which acute cholecystitis treatment brings more benefit to each patient. Additionally, and
since the models are developed with a similar structure for individual and for the group, it is possible to
observe the variability between the opinions of the surgeons, exploring the hypothesis brought up in the
initial stage of this thesis.
After explaining the MACBETH approach, the following sections of this chapter provide more
detailed information about the steps of the methodology. To provide an easy understanding, every
section tries to follow a similar structure: first, the intermediate goals of the technical steps are
mentioned; to achieve them the social components, if involved, are explained; and then the intermediate
goals are accomplished (application of the methods).
4.1.1. Multicriteria Models – MACBETH Approach
Multicriteria decision analysis (MCDA) is a way of breaking a complex problem into “manageable
pieces” and then putting the pieces together providing a global result to decision makers. A multicriteria
model will allow the balancing of different criteria, inclusion of possible uncertainty and trade-offs [38].
The MACBETH (Measuring Attractiveness through a Category Based Evaluation Technique)
approach is a MCDA technique. The main advantage of the MACBETH approach is that it only needs
“qualitative judgments about the difference of attractiveness” when comparing two elements in a set, at
a time, being the judgments (about the difference of attractiveness) chosen from a given scale: no, very
weak, weak, moderate, strong, very strong, extreme. It is a non-numerical method and it originates
numerical scores from the qualitative judgments of the decision maker(s), which allows the creation of
a value scale per criterion and weights for the criteria. For each option, the value score on each criterion
multiplied by the criterion’s weight are aggregated additively to all the criteria giving rise to the overall
score of the option, translating its attractiveness [50]. In other words, the overall score V(p) of an option
p considering n criteria is obtained by aggregating the partial values vj(p) of each option p in the criterion
j (j=1, …, n), as follows [43]:
𝑉(𝑝) = ∑ 𝑘𝑗 . 𝑣𝑗(𝑝)
𝑛
𝑗=1
𝑤𝑖𝑡ℎ ∑ 𝑘𝑗 = 1 𝑎𝑛𝑑 𝑘𝑗 > 0
𝑛
𝑗=1
𝑎𝑛𝑑 {𝑣𝑗(𝑔𝑜𝑜𝑑𝑗) = 100
𝑣𝑗(𝑛𝑒𝑢𝑡𝑟𝑎𝑙𝑗) = 0 (1)
being kj the weight assigned to criterion j.
Besides additive, it is a compensatory model because a high performance in a criterion can
compensate a low performance in another.
To develop a multicriteria model, it is necessary the definition of criteria. A criterion, also known
as fundamental point of view, should have the following properties [38]:
Relevance – relevant to the goals of the decision;

24
Understandability – it must exist a shared understanding on its meaning;
Measurability – each option should have its performance measured according to each criterion;
Non-redundancy – two or more criteria cannot measure the same factor;
Independency – the preference score given to a criterion should not be influenced by the
preference scores of the other criteria;
Exhaustiveness and conciseness – all the crucial aspects should be considered but, at the same
time, the model should be simple.
After the definition of the criteria and according to the measurability property, a descriptor of
performance has to be defined to each criterion, which turns the criterion intelligible. The descriptor of
performance is constituted by a set of levels, ordered by preference. It measures, quantitatively or
qualitatively, how a criterion is satisfied by an option, so, the levels must describe objectively the impacts
on the criterion to not give rise to ambiguities when classifying the performance of an option. It is
important to not insert redundancy in the model, so, each descriptor should be related to only one
criterion, and, of course, every criteria must have one descriptor [51]. Besides the descriptors of
performance, anchors must be defined, i.e., a level must be assigned to the 0 and another to the 100.
It can be chosen an approach of considering the ‘neutral’ and the ‘good’ levels, representing the 0 and
the 100 of the value scale, respectively. This anchors allows the improvement of the intelligibility of the
criterion, because, for example, if level A is better than B it does not mean that A is good (with the
anchor, one could compare level A with the ‘good’ level to see if A is worse or better than ‘good’);
anchors avoid choosing an option worse than ‘neutral’ even if it is the best option available; and this
‘neutral’-‘good’ approach is valid with the theoretical framework of the additive model [52].
After the definition of the criteria and the descriptors of performance, the achievement of the
value scales will be reached using the M-MACBETH software [50]. In the software, for every criterion,
there is a matrix of judgments where the differences of attractiveness between each pair of performance
levels, according to the judgments of the decision maker, can be assigned to the cells. It is not necessary
to provide every judgment, if there are n performance levels, filling a minimum of (n-1) judgments is
acceptable, however, the more judgments filled, the better [53]. The judgments not provided are filled
by the software by transitivity. As each judgment is inserted in the software, it automatically verifies if
the judgment is consistent with the judgments provided before, if it is not, the software identifies it as an
inconsistency and offers suggestions of alterations to fix it [42]. The consistency is evaluated according
to the following properties [41]:
If level A is more attractive than level B, then the score of level A is higher than the
score of level B;
If levels A and B are equally attractive, then their score is the same;
If the difference of attractiveness in two levels A and B is higher than the difference of
attractiveness of another two levels C and D, then the score assigned to the difference
between A and B is higher to the one assigned between C and D.
When the matrix is complete and consistent, a value scale is reached to the criterion, as in the
example of figure 11. The given scale can be adjusted by the decision maker, in certain limits that

25
respect his previous judgments. The validation of the value scale occurs once the decision maker agrees
with it [42].
After the determination of the value scales for all the criteria, a weights scale must be
determined, to assign weights to the criteria. So, the next step of the model development is to obtain a
ranking to the criteria, provided by the decision maker. This can be accomplished by asking him if all
the criteria were in the ‘neutral’ performance level and he could improve only one criterion to the ‘good’
level which improvement he would choose. He must choose based on the improvements and not only
in the criteria, if not he would fall in the “most common critical mistake” of decision making [42]. After his
choice, he must choose what improvement he would do next, and do that until there is no more criteria
available. When he does this choice, he must evaluate the difference of attractiveness of the
improvements according to the MACBETH scale (no, very weak, weak, moderate, strong, very strong,
extreme). This allows the filling of the weighting matrix of judgments in the software and the weights can
be adjusted with the decision maker, within certain limits consistent with the judgments, as it happens
in the creation of value scales [42]. With the value scales for the criteria and the attribution of the weights
completed, the overall score of options can be acquired, after inserting the options and its performance
in the software.
As it was showed in the proposed framework, it is expected to obtain a multicriteria model for
each surgeon, and then a compromise model for the group, to allow the comparison and observe the
variability and the convergence of opinions. Following the steps mentioned in this section, for the
individual and group judgments, it is possible to obtain the expected models. In the next sections it is
possible to see how the information about the qualitative judgments, needed to all these
accomplishments, was obtained.
4.2. Structuring the Multicriteria Models
The first step to accomplish in the multimethodology of this thesis is the structuring of the
models. As seen in the MACBETH approach section, structuring the models consists in the definition of
criteria and descriptors of performance. To obtain relevant data for this definition, exploratory interviews
will be made to 9 surgeons to explore the decision context and then the information must be organized
to give the expected answer of this step. Professor Mendes de Almeida will support the organization of
Figure 11. Example of a consistent matrix of judgements with the assigned value scale [42].

26
the information in criteria and descriptors of performance, having a different role only in this step of the
multimethodology. After that, the 10 surgeons will always have a similar role.
4.2.1. Exploratory Interviews
Usually, to make a decision, a person thinks about all the possible alternatives and then chooses
the best one in the set, what is defined as “alternative-focused thinking” by Keeney et al. [54]. Here, the
goal is to try to choose the path that puts the decision makers closer of getting all that they want, being
this defined as “value-focused thinking” which defends “first deciding on what you want and then figuring
out how to get it” [54].
Following a “value-focused thinking” approach to explore objectives and surgeons’ thoughts for
the treatment choice of acute cholecystitis, exploratory interviews were made. They allow the exploration
if a multicriteria model could really be the appropriate kind of model to this problem because they can
provide information about all the concerns of the surgeons when deciding which treatment to choose.
This information can be organized in a way to obtain what is expected in this phase (criteria and
descriptors of performance), allowing, at the same time, the development of the next one.
These interviews are classified as unstructured and their use is recommended when there is
not much knowledge in the situation [55], which is the case in this preliminary phase of the methodology.
There will be few specific questions with open answers that must translate the perspective of each
surgeon. Instead of being a restrict questionnaire with answers’ options, as it happens in the structured
interviews, these interviews have some topics that are expected to explore but which are also expected
to emerge naturally in the conversation [55].
The interviews should let each surgeon comfortable in talking about the issues of the decision,
however, in every interview it must be accomplished the goal of obtaining relevant information to define
the criteria and the descriptors of performance. Only then it will be possible the development of the web-
based platform, the way intended.
In the beginning, each surgeon was asked to suppose that he has to treat a patient with an
acute cholecystitis crises, with more than 72 hours since the beginning of the symptoms. The topics
explored in all the interviews are mentioned below. The topics are presented as questions but they were
not always asked with this specific structure:
1. What options do you have to treat the patient?
2. What do you expect to reach when you make a choice of treatment? What is the goal of the
treatment, if you could explain it in one sentence?
3. Now, suppose that you chose an option of treatment. How can you evaluate the result? What
are the factors that differentiate how successful was the intervention?
4. To each factor:
a. Can this factor be subdivided in more components? Which ones?
b. Can some of them be grouped?

27
c. If two patients have the same behaviour in these factors, is there another factor to
differentiate the patients’ result?
In this set of topics, the third and the fourth ones are especially dedicated to the exploration of
the criteria. It is expected to obtain important evaluating factors about the impact of any chosen
treatment in the patient quality of life, but always in the surgeon’s point of view. After the interviews, the
information was organized and clustered in criteria and the descriptors of performance were defined
with Professor Mendes de Almeida’s support, as it is possible to see next.
4.2.2. Defining Criteria and Descriptors of Performance
In the exploratory interviews, nine surgeons were interviewed, being three interns, three of
general surgery and the other three of hepatobiliary speciality.
Regarding the first topic of the interviews mentioned before, the options of cholecystectomy,
early (ELC – early laparoscopic cholecystectomy) or after the conservative treatment (ILC – interval
laparoscopic cholecystectomy), were referred by all the interviews and cholecystostomy was referred
by eight of the nine. As cholecystostomy is a specific approach for specific patients (severely ill patients,
as mentioned in chapter 3), the models will consider two treatment’s options: ELC and ILC. ELC
describes the surgery made in the first hospital admission of the patient and ILC describes the surgery
made after an antibiotic therapy, in another hospital admission.
When speaking about the goals of the decision, the surgeons’ main concern was about
recovering the patient, as it is presented in table 2.
Table 2. Answers of the surgeons when questioned about the goals of the decision.
Interview Goals of the treatment
1 Maximize the disease control and the recuperation of the patient, putting him back in his familiar,
social and professional environment.
2 Maximize patient recovery and satisfaction, minimizing future complications and costs.
3 Re-establish, as much as possible, the physiologic functions of the patient (as they were before of
the cholecystitis episode), maximizing patient satisfaction with less costs.
4 Maximize patient recovery, controlling as much as possible the infection, improving his satisfaction
with less costs.
5 Maximize the septic focus control to improve survival, reducing future complications and costs.
6 Maximize patient recovery and satisfaction, with less costs.
7 Maximize patient recovery, with less costs.
8 Maximize patient recovery and satisfaction, minimizing morbidity, hospitalization time and costs.
9 Maximize patient recovery, with less costs.
The information collected in the questions whose objective was the exploration of the criteria
was discussed with Professor Mendes de Almeida and the factors mentioned by the surgeons as
important to evaluate the result of the treatment were clustered in criteria. The mentioned factors and
28
the clustering are presented in table 3. Pain and regularization of the inflammatory parameters were
also mentioned in the interviews but they were suppressed because it was considered as being less
applicable in this condition than the other factors.
Table 3. Clustering of the evaluating factors mentioned in the interviews in criteria. The criteria were defined at the same time, after analysing the factors and the way of clustering them.
Factors considered important by the
surgeons to evaluate the success of
the intervention
Criteria to evaluate the decision in the model Hospital
costs Morbidity Functional
recovery Satisfaction
Patient
costs
Hospitalisation time X
Antibiotic therapy time X
Absenteeism from work X
Functional state recovery (previous to
the cholecystitis episode) X
Surgery time X
Conversion rate X
Gastrointestinal functions recovery X
Hospital costs X
Patient costs X
Patient satisfaction (aesthetic) X
Medical/surgical complications X
Mortality X
Morbidity X
The organization of the criteria in a value tree is presented in the figure 12 (below). The hospital
costs will not be considered because the model is concerned with the impact at the patient level. Patient
costs were divided in medication, extra visits to the hospital and absenteeism from work because it was
considered that extra visits to the hospital brings more inconvenience to the patient than medication
costs and absenteeism from work can change patient’s incomes, bringing even a more negative impact.
Support the decision of choosing the treatment of acute cholecystitis, measuring the value to the patient that each treatment brings, in the surgeons’ point of view
Impact to the patient
Satisfaction
Aesthetics
Clinical evaluation
Functional recovery
Gastrointestinal recovery
Mobility
Morbidity
Morbidity
Mortality
Costs
Patient costs
Absenteeism from work
Medication
Extra visits to the hospital
Figure 12. Organization of the criteria in a tree. The criteria are in the green boxes, below them (in light blue) there are factors mentioned in the interviews and above them (in dark blue) there are the areas of impact.

29
After the clustering, descriptors of performance were defined, as well as the anchors ‘neutral’
and ‘good’, and are presented in the table 4.
Table 4. Definition of the descriptors of performance and of the anchors ‘neutral’ and ‘good’.
Criteria Descriptors of Performance Levels
Morbidity
Long-term morbidities classified according to Clavien-Dindo scale [56].
No morbidity;
Grade I (therapeutic necessity such: antiemetic, antipyretics, analgesics, diuretics
and electrolytes) - GOOD;
Grade II (other pharmacological therapeutic as antibiotics, parenteral nutrition) –
NEUTRAL;
Grade III (Requiring surgical, endoscopic or radiological intervention, with or
without anesthesia);
Grade IV (simple or multi organ dysfunction);
Grade V (Death).
Functional
Recovery
Symptoms presented by the patient.
Asymptomatic;
Reposition of the state previous to the acute episode - GOOD;
Minimal symptoms - NEUTRAL;
Limitative symptoms;
Incapacitate symptoms.
Satisfaction of
the patient
Satisfaction of the patient, considering the aesthetic results of the treatment.
Very satisfied;
Satisfied - GOOD;
Not unsatisfied or satisfied - NEUTRAL;
Unsatisfied;
Very unsatisfied.
Patient Costs
Costs to the patient.
Without costs and without alteration of the economic balance;
With medication costs. Without extra hospital visits costs and without alteration of
the economic balance - GOOD;
With extra hospital visits costs. Without medication costs and without alteration of
the economic balance;
With medication costs and extra hospital visits costs. Without alteration of the
economic balance - NEUTRAL;
Without costs but with alteration of the economic balance;
With medication costs and with alteration of the economic balance. Without extra
hospital visits costs;
With extra hospital visits costs and with alteration of the economic balance.
Without medication costs;
With medication costs, extra hospital visits costs and alteration of the economic
balance;

30
Regarding the performance levels of patient costs criterion, the ‘alteration of the economic
balance’ was defined as: ‘Despite many patients have retirements or other fixed incomes, this alteration
refers to the people whose incomes are modified due to situations such as sick leave’. Additionally, but
considering the functional recovery performance levels, it was defined the meaning of minimal, limitative
and incapacitate symptoms as:
Minimal symptoms: symptoms that don’t affect normal or pre-disease life;
Limitative symptoms: symptoms that affect some normal pre-disease activities;
Incapacitate symptoms: symptoms that stop activities or force to remain at home or even imply
other people support to assure daily tasks.
These explanations have to be always associated with the levels, to not bring ambiguity to the
descriptor. After establishing the criteria and descriptors of performance, the structuring phase was
concluded, it was possible to enter in the next phase, the development of the individual multicriteria
models, explained next.
4.3. Individual Multicriteria Models
Having now the multicriteria models structured, it is possible to start the development of the
models. As said, it is important to develop first the individual models and only then reunite the surgeons
to the model of the group, for the individual models not to be influenced.
The development of the individual models consists in building value scales and obtaining criteria
weights, for each surgeon, which depends on collecting some specific judgments of the surgeons about
differences of attractiveness between some of the performance levels obtained previously.
To collect these individual judgments, a web-based platform will be implemented. So, in this
section, first it will be presented the planning of the web-based platform to understand how the needed
judgments can be obtained. After explaining the planning, the protocol of the web-based platform using
previous information will be presented. The section ends with the building of the value scales and the
determination of the criteria weights of the individual models.
4.3.1. Web-Based Platform
The use of a web-based platform intends to be a quicker and simpler way of getting the individual
judgments of the surgeons. It is more efficient than interviewing each surgeon again, allowing each
person to answer whenever it is more convenient. The web-based platform was developed in Google
Forms and the individual judgments collected are crucial for the building of the value scales and the
determination of the criteria weights that define the individual multicriteria models. For that, the platform
has to collect some judgments of the surgeons according to the criteria and the descriptors of
performance defined in the previous phase.

31
The platform must have two parts: one that allows the building of the value scales and other that
allows obtaining the criteria weights.
To build the value scales, the first part has a section for each criterion and each section should
be intended to collect the qualitative judgments within the criterion. The descriptors of performance
levels should be exposed as well as its definitions, when applicable, and surgeons must be asked to
select the importance of the improvements (differences of attractiveness) between some pairs according
to the categorical scale of MACBETH approach (no, very weak, weak, moderate, strong, very strong,
extreme). All the questions of this part of the platform must have a common structure to all the criteria,
to pass on simplicity and better understanding, thus, it will be always asked “To the quality of life of the
patient, say the importance of each one of the following improvements in the [Criterion]”. In this case,
the improvements asked in the answer will be the comparison between each performance level and the
least attractive one and between each consecutive pair of performance levels, which corresponds to the
last column and the diagonal above the main diagonal of the matrix of judgments of the M-MACBETH
software, respectively [50]. The other improvements within the criterion would be filled by transitivity.
After having all the needed judgments, value scales are built to each criterion.
The second part should be intended to obtain qualitative judgments of overall attractiveness.
Surgeons should rank the improvements of the ‘neutral’ to the ‘good’ level in all the criteria in terms of
overall attractiveness and, as they choose a criterion, they should also classify its difference of
attractiveness according to MACBETH scale. In the platform, it should be asked the ranking of the
improvement they would choose comparing with all the criteria being in the ‘neutral’ level. The difference
of attractiveness between having only one criterion, at a time, in the ‘good’ level and all the criteria being
in the ‘neutral’ level will allow the insertion of the judgments corresponding to the last column of the
weighting matrix of judgments in the software [50]; the other cells of this matrix will also be filled by
transitivity. After these judgments, weights are assigned to the criteria.
The collection of the judgments according to each surgeon allows the modelling of ten individual
models and the observation of the variability in their opinions. Now, it is presented in more detail the
implementation of the platform using the information obtained in the structuring of the model and then
the building of the value scales and the determination of the criteria weights will be exposed.
4.3.2. Web-Based Platform: Protocol
In the first part of the platform, there were a section for each criterion, as mentioned. The
performance levels are clarified in the section, for not bringing ambiguity, and then there is the question
that each surgeon should fill with the difference of attractiveness between some levels, the ones
corresponding to the cells of the matrix of judgments wanted for the building of the value scales: the
differences of attractiveness corresponding to the last column and to the diagonal above the main
diagonal of the matrix of judgments. It is possible to see the case of ‘Functional Recovery’ criterion, as
an example, in figure 13. Every criterion had a similar section.

32
After a set of similar questions for all the criteria, the second part of the platform was
implemented. To obtain the overall attractiveness, first, it was presented a set of all the criteria with the
‘neutral’ and ‘good’ levels, showed in figure 14, and the surgeon was asked to suppose that a patient,
after a treatment, was in the state defined by all the yellow levels (corresponding to the ‘neutral’ levels)
in the four criteria, i.e., in level II of Clavien-Dindo classification respecting to morbidity, with minimal
symptoms respecting to functional recovery, not unsatisfied or satisfied respecting to satisfaction and
with costs of medication and of extra visits to the hospital.
After this scheme, surgeons were asked: ‘To improve the quality of life of the patient, if you
could improve a level in one of the four factors (i.e. improve A, B, C or D) which one would you choose?’.
After selecting an option, they were asked: ‘To the quality of life of the patient, what is the attractiveness
of the chosen improvement?’ and in the answer they could select one of the MACBETH categories.
Then it was asked to exclude the chosen factor and the same questions were asked. This process of
excluding factors and repeat the questions was made until the end of the criteria.
In the end, a ranking of the improvements of the criteria was expected to be obtained and it
would be possible to complete the information of the software respecting to the overall attractiveness:
the weighting matrix of judgments, presented in figure 15. In the matrix, the criteria (which in the figure
and by default presents the order Morbidity-Functional Recovery-Satisfaction-Costs) were ordered
according to the ranking given by the surgeon and the judgments obtained by the questions were
inserted in the last column.
Figure 13. Question regarding the Functional Recovery criterion in the first part of the web-based platform. First, the performance levels are presented and then it is asked, for the quality of life of the patient, to evaluate the difference of attractiveness between some levels – the levels that correspond to the last column (first four lines) and the diagonal above the main diagonal (last three lines) of the M-MACBETH matrixes, as it is possible to see in the matrix of judgments at left.

33
After the implementation of the web-based platform it was possible to collect the judgments of
the ten surgeons and, consequently, insert them into M-MACBETH and obtain the value scales and the
weights for the criteria, according to each surgeon.
Figure 14. Ranking of the improvements. Here, surgeons were asked to suppose that a patient, after a treatment, is in the state defined by all the yellow levels in the four criteria, i.e., in level II of Clavien-Dindo classification respecting to morbidity, with minimal symptoms respecting to functional recovery, not unsatisfied or satisfied respecting to satisfaction and with costs of medication and of extra visits to the hospital.
Figure 15. Weighting matrix of judgments given by default by the software.

34
4.3.3. Building Value Scales for the Criteria
As mentioned, all the questions of the first part had a common structure and in all the answers
the surgeons were asked to compare each performance level to the least attractive one and each
consecutive pair of performance levels according to only one category of the MACBETH scale. The
value scales were built inserting these judgments in M-MACBETH software.
When inconsistencies occurred, suggestions of the software were accepted, because in this
phase there was not physical contact with the decision makers to discuss these events. Furthermore
and for the same reason, the value scales were not adjusted or validated by the decision makers. Next
tables present the value scales proposed by the software for the ten surgeons, after the insertion of the
judgments. Each table presents the value scales of a criterion.
Table 5. Value scales obtained by the individual judgments to the 'Morbidity' criterion.
Interviewed Doctors (D) Morbidity Value Scales
No morbidity Grade I Grade II Grade III Grade IV Grade V
D1 175 100 0 -100 -200 -350
D2 180 100 0 -100 -200 -280
D3 200 100 0 -100 -200 -320
D4 200 100 0 -133 -266 -366
D5 450 100 0 -75 -150 -225
D6 175 100 0 -125 -225 -375
D7 133 100 0 -133 -266 -433
D8 200 100 0 -400 -800 -1400
D9 200 100 0 -133 -266 -433
D10 200 100 0 -133 -300 -500
Table 6. Value scales obtained by the individual judgments to the 'Functional Recovery' criterion.
Interviewed Doctors (D) Functional Recovery Value Scales
Level 1 Level 2 Level 3 Level 4 Level 5
D1 267 100 0 -133 -266
D2 267 100 0 -166 -266
D3 200 100 0 -100 -220
D4 300 100 0 -400 -700
D5 167 100 0 -133 -266
D6 500 100 0 -133 -266
D7 133 100 0 -166 -300
D8 150 100 0 -200 -400
D9 200 100 0 -166 -300
D10 200 100 0 -100 -233

35
Table 7. Value scales obtained by the individual judgments to the 'Patient Satisfaction' criterion.
Interviewed Doctors (D) Patient Satisfaction Value Scales
Level 1 Level 2 Level 3 Level 4 Level 5
D1 267 100 0 -16 -50
D2 214 100 0 -42 -85
D3 180 100 0 -100 -200
D4 167 100 0 -66 -100
D5 167 100 0 -100 -200
D6 183 100 0 -33 -50
D7 133 100 0 -133 -233
D8 117 100 0 -50 -66
D9 200 100 0 -75 -125
D10 175 100 0 -75 -150
Table 8. Value scales obtained by the individual judgments to the 'Patient Costs' criterion.
Interviewed
Doctors (D)
Patient Costs Value Scales
Level 1 Level 2 Level 3 Level 4 Level 5 Level 6 Level 7 Level 8
D1 162 100 50 0 -62 -125 -162 -212
D2 200 100 50 0 -50 -65 -80 -95
D3 267 100 78 0 -88 -111 -133 -155
D4 140 100 40 0 -120 -180 -240 -280
D5 164 100 45 0 -54 -81 -100 -118
D6 133 100 67 0 -233 -300 -366 -433
D7 125 100 50 0 -75 -225 -300 -350
D8 150 100 50 0 -116 -166 -216 -266
D9 160 100 60 0 -140 -280 -340 -400
D10 120 100 60 0 -100 -160 -180 -280
4.3.4. Obtaining Criteria Weights
The answers to the second part of the platform allowed to obtain the ranking of the
improvements and the criteria weights. As happened in the first part, inconsistencies here were also
solved with the suggestions of the software and the criteria weights are the ones given by default
because there was not validation by the decision makers.
Figure 16, below, presents a graph where it can be seen the ranking and the weights assigned
to each criteria, for the ten surgeons.

36
4.4. Compromise Multicriteria Model
After obtaining the individual models, it is time to develop the compromise model for the group.
This compromise model will be the decision support tool for the hospital and, at the same time, it is
useful to observe the variability between the opinions of the individual surgeons and the group.
In this section, for the development of the compromise model, the value scales must be built
and the criteria weights must be determined, this time according to the group. As in the individual models
phase, reaching this objectives involves acquiring some specific judgments of the surgeons about
differences of attractiveness between performance levels obtained in the structuring phase. To collect
the needed group judgments, all of the ten surgeons involved in the previous phases should be brought
together. For that, a decision conference will be made.
This section presents first the decision conference planning to understand how the needed
judgments will be obtained. After explaining the planning, the protocol will be presented, as well as the
building of the value scales and the determination of the criteria weights for the group model.
4.4.1. Decision Conference
A decision conference is a gathering of people who want to solve an important matter. It is
assisted by a facilitator, who has to be impartial in the content discussed and uses a model, created on-
D1 D2 D3 D4 D5 D6 D7 D8 D9 D10
Morbidity 23 32 32 28 21 17 29 28 28 14
Functional Recovery 32 27 27 33 29 33 36 33 33 36
Patient Satisfaction 27 23 23 22 36 28 21 22 17 29
Patient costs 18 18 18 17 14 22 14 17 22 21
0
5
10
15
20
25
30
35
40
INDIVIDUAL MODELS: CRITERIA WEIGHTS
Figure 16. Criteria weights according to the individual answers of the surgeons.

37
the-spot, to guide the group in thinking more clearly about the matter. The created model won’t give the
solution but it will guide the group learning process and it is hoped to be, according to L. Philips and C.
Bana e Costa, a ‘requisite’ model, i.e., it is hoped to be “sufficient in form and content to resolve the
issues at hand”. A decision conference will also allow different opinions and views, creativity, shared
understanding, sense of common purpose and a quicker way of reaching agreement. Thus, the created
model is a compromise of all participants’ views and, since everyone participates and watches it being
created, they will, more likely, have trust in the results [37].
Usually, there are four stages in a decision conference: (1) the issues are explored, (2) the
model is built according to the judgments given by the participants, (3) the model is explored to see if
there are discrepancies to solve and, finally, (4) an action plan is settled to follow in the future [37] [57].
In the decision conference, it should be asked the same judgments of the web-based platform,
to obtain comparable information with the individual judgments. Thus, the decision conference will also
have two parts: one with the questions about the differences of attractiveness within each criterion, to
build the value scales; and another with the questions about the overall attractiveness, to obtain the
criteria weights. Nevertheless, there are three fundamental differences in relation to the development of
the individual models: first, here it will be accepted more than one category of the MACBETH scale if
the decision makers are in doubt between sequential categories; second, if inconsistencies occur, than
can be discussed with the decision makers and they can choose what suggestion to adopt; and third,
the value scales and the criteria weights can be adjusted, in intervals consistent with the judgments, and
validated by the decision makers.
A presentation must be prepared with the questions of the needed judgments but it can be in a
more eye-catching way than it was in the platform, since there is less restrictions in the layout.
Nevertheless, the questions of each part should also have a common structure, also for the simplicity
and easier understanding.
In the first part, every question will have the following structure: ‘For the quality of life of the
patient, going from [Level A] to [Level B] is of [category selected by the surgeons] importance’. The
MACBETH scale should be always presented for the surgeons to choose the category or categories.
Once again, the judgments asked will be the comparison between each performance level and the least
attractive one and between each consecutive pair of performance levels (the last column and the
diagonal above the main diagonal of the matrix of judgments of the M-MACBETH software, respectively
[50]). The other improvements within the criterion would be filled by transitivity. After having all the
needed judgments, value scales are built to each criterion. Then, when building each value scale, it
must be presented to the decision makers and they must validate it, adjusting first in the allowed intervals
if they want.
In the second part it should be ranked the improvements of the ‘neutral’ to the ‘good’ level in all
the criteria in terms of overall attractiveness and, then, they should also classify its difference of
attractiveness according to MACBETH scale. It should be asked the ranking of the improvement they
would choose comparing with all the criteria being in the ‘neutral’ level. The difference of attractiveness
between having only one criterion, at a time, in the ‘good’ level and all the criteria being in the ‘neutral’
level will be inserted in the last column of the weighting matrix of judgments in the software [50]; the

38
other cells of this matrix will also be filled by transitivity. After these judgments, weights are assigned to
the criteria. Then, the decision makers must validate the weights, adjusting them in the allowed intervals
if they want, too.
After the confirmation of the value scales and the criteria weights with the surgeons, it is possible
to observe how the model evaluates patient cases, according to each treatment’s way, and to compare
it with the information obtained with the individual models.
4.4.2. Decision Conference: Protocol
In the first part of the decision conference, the one dedicated to build the value scales, it was
supposed to ask the surgeons the same judgments of the first part of the web-based platform. As
happened in the protocol of the platform, in this section it will be possible to see examples of the type of
questions of the decision conference and how it contributes to achieve the objectives (value scales and
criteria weights). Figure 17 shows an example of a question of the ‘Functional Recovery’ criterion.
All the questions regarding the value scales were made with a similar structure, excepting the
questions of the ‘Patient Costs’ criterion. These questions tried to be more intuitive because all the
possible combinations of the three types of costs (medication, extra visits and alteration of the economic
balance) could be confusing. Figure 18 shows an example of the structure of these questions: it is asked
the importance (difference of attractiveness) of going from A to B and states A and B present each one
three boxes, according to the type of cost: medication, extra visits to the hospital and alteration of the
economic balance, and each cost may or not exist in the state; in the figure, the state A has all the costs
and the B has only the costs associated with the first box, that is, medication costs.
Figure 17. Example of a question of the decision conference. This question of the slide asks 'For the quality of life of the patient, going from: Reposition of the state previous to the acute episode to Asymptomatic is of [surgeons much choose a category] importance.’ The answer given in this question is inserted in the indicated cell of the matrix.

39
The questions regarding the definition of the criteria weights take place after all the questions
regarding the judgments within each criterion and the validation of the value scales by the surgeons. To
obtain the overall attractiveness, first, it was presented a set of all the criteria with the ‘neutral’ and ‘good’
levels, the same scheme presented in the web-based platform, figure 19 at left, and the surgeons were
asked to suppose that a patient, after a treatment, was in the state defined by the ‘neutral’ levels in all
the criteria. The surgeons must say in what order they would do the improvements to the ‘good’ level.
Then, they must evaluate the improvements for all the criteria according to the MACBETH scale, which
is asked as presented in the example of figure 19 at right using ‘Functional Recovery’ improvement.
4.4.3. Building Value Scales for the Criteria
In this phase, there were no inconsistencies in the given judgments. After collecting and
inserting them in the matrix of judgments in M-MACBETH software, the value scales were presented to
the decision makers for being adjusted, if needed, according to the consistent limits of the judgments,
and to be validated.
Figure 18. Example of question for the 'Patient Costs' criterion. It is asked 'For the quality of life of the patient, the importance of going from: A (having costs of medication, of extra visits to the hospital and alteration of the economic balance) to B (having only medication costs) is [surgeons much choose a category]’.
Figure 19. At left it is the question where the surgeons chose the ranking of the improvements from the ‘neutral’ (yellow) to the ‘good’ (green) level. At right, it is an example of how the difference of attractiveness was asked, in this example for the 'Functional Recovery' criterion.

40
The ‘Morbidity’ criterion was the first to collect the judgments. There were inconsistencies, so,
the value scale was built after collecting the data. After building the value scale, it was adjusted by the
surgeons. The interval between the ‘0’ that correspond to the ‘No morbidity’ performance level and the
‘Grade I’ was decreased, when adjusting the scale because it was not considered so different in terms
of attractiveness. In the contrary, the intervals ‘Grade III’-‘Grade IV’ and ‘Grade IV‘-‘Grade V’ were
intensified. Then, the surgeons validate it and it is presented in figure 20.
The ‘Functional Recovery’ value scale was the second to be built (figure 21). It had also some
adjustments. The intervals between the first and the second levels and between the fourth and the fifth
levels were incremented before the validation by the surgeons.
The ‘Patient Satisfaction’ matrix didn’t need adjustment because it was in agreement with the
surgeons, so it was immediately validated. Figure 22 presents the matrix of judgment and the value
scale of this criterion.
Figure 20. Matrix of judgments and value scale for the 'Morbidity' criterion.
Figure 21. Matrix of judgments and value scale for the 'Functional Recovery' criterion.

41
The questions regarding the ‘Patient Costs’ criterion had the schemes with the boxes, as
explained in the section of the protocol, due to the different dimensions of costs (medication, extra visits
to the hospital and alteration of the economic balance) that could combine in several ways. These
questions were of easy understanding, as intended. The judgments given in the first place were
consistent, however when looking at the value scale, surgeons wanted to adjust the score of only having
medication costs in a way not compatible with the judgments. Thus, the judgments given to the
difference of attractiveness between the medication costs and extra hospital visits costs and between
this one and the medications more extra visits costs were changed to be possible the adjustment the
way the surgeons wanted. Then, the value scale was in agreement with them and thy validate it. Figure
23 shows the matrix of judgments and the value scale of this criterion.
Figure 22. Matrix of judgments and value scale for the 'Patient Satisfaction’ criterion.
Figure 23. Matrix of judgments and value scale for the 'Patient Costs’ criterion.

42
4.4.4. Obtaining Criteria Weights
After ranking the improvements, surgeons gave inconsistent judgements with the ranking. It was
solved by explaining that they must look to the attractiveness of the improvement and not to the criterion
per se. After that, they changed their ranking, being the judgements consistent with the new ranking.
They agreed with the given weights, so the adjustments at this point were not needed, being the weights
validated by the surgeons. The weights assigned to the criteria are presented in figure 24.
In this chapter it was observed how the steps of the multimethodology were planned and applied
to 10 surgeons of Hospital de Santa Maria in Lisbon. After the structuring of the multicriteria models
using exploratory interviews, a web-based platform collected individual opinions to understand how
surgeons make decisions concerning the treatment of acute cholecystitis, developing individual
multicriteria models, and then a decision conference allowed to do the same for the group. After
obtaining the group model it could be adapted to a decision support model for the treatment choice of
acute cholecystitis. So, the hospital database could be accessed to see how the model would evaluate
patients and if possible be improved, resulting in a final model.
Now, the next chapter presents the results about the variability in surgeons’ opinions concerning
the treatment of acute cholecystitis and the way of supporting that decision making use of the
compromise model.
Figure 24. Weighting matrix of judgments and weights for the criteria. The ranking is in the following order: 'Patient Satisfaction', 'Morbidity', 'Functional Recovery' and 'Patient Costs'.

43
5. Results
In this chapter the results of the multimethodology will be presented. Comparisons will be made
between the individual and group models to explore the variability in their opinions. Then, using patient
cases, the use of the models will be illustrated, which allows the observation of the influence of the
opinions in a final result for the patient and the elucidation of how the group model can be a useful tool,
assisting the doctors in their decision.
5.1. Comparing the Individual and Group Models
In this section, individual and group opinions are compared for each criterion, presenting the
preference judgments given and the associated value scales. After presenting the qualitative judgments
and the value scales for all the criteria, the standard deviation of each level of each criterion is presented
in a graph to observe in a general way the extent to which the individual surgeons analyse patients in
the same way. When presenting the individual opinions, the detected inconsistencies are mentioned as
well as the suggestions adopted to fix them. After the value scales, the criteria weights will be compared,
also presenting the inconsistencies noticed in the individual phase.
The value scales and criteria weights presented for each surgeon in the individual models could
be a little different if the inconsistencies and validation were confirmed by the surgeons, and here the
quantitative comparisons are made with those not confirmed values. Including a way to detect this cases
and to validate the procedures in the web-based platform could solve this problem. In the group model
this problem does not exist because the decision conference allowed surgeons to participate in every
step of the model development, solving inconsistencies and validating always when necessary.
5.1.1. Morbidity
Morbidity criterion presented six levels of performance, since a state of no morbidity to death.
The judgments of differences of attractiveness given by the surgeons were made regarding the
comparison of the death state (the least attractive level) with all the others and the comparison of all the
consecutive pairs of levels of performance. Table 9 presents the classification according to the
MACBETH scale given by each surgeon and by the group.
In the given judgments, the comparisons made with the death state were all classified as
‘Extreme’ by 50% of the surgeons and by the group. The comparisons which classification was more
divergent in the individual opinions were the ones between Grade I and 0 (no morbidity) and between
Grade II and Grade I, since they had classifications in a range from ‘Very Weak’ to ‘Very Strong’.
In the opinion of the group, the comparisons that brought hesitations to the group were classified
with two categories, since it is allowed by the MACBETH approach.

44
After presenting the qualitative judgments according to each surgeon and to the group in table
9, figure 25 presents the number of surgeons that attributed each MACBETH category to each
performance level and compares it, side by side, to the group answer, in a more straightforward way.
When there are two categories in the group answer, it means that both were considered due to the
hesitations of the surgeons.
Table 9. Qualitative judgments attributed to the comparisons of Morbidity criterion by every surgeon and the group. The initials are according to MACBETH scale: N – No; VW – Very Weak; W – Weak; M – Moderate; S – Strong; VS – Very Strong; E – Extreme. The hyphen represents that more than one categories were attributed and the strikethrough represents an inconsistent judgment, being the correction adopted presented after the arrow.
Interviewed
Doctors (D)
Morbidity: Differences of Attractiveness
Grade
V - 0
Grade
V - I
Grade
V - II
Grade
V - III
Grade
V - IV
Grade
I - 0
Grade
II - I
Grade
III – II
Grade
IV - III
D1 E E E E E M S S S
D2 E E VS VS S S VS VS VS D3 E E E E E VS VS VS VS D4 E VS S S M M M S VS S
D5 E M S S VS S M VS S M M
D6 E E E E E M S VS S
D7 E E E VS VS VW M S S
D8 E E E E E VW VW S S
D9 E E E VS VS M M S S
D10 E E E E E M M S VS
GROUP E E E E E W S - VS S S - VS
G R A D E I V - I I I
G R A D E I I I - I I
G R A D E I I - I
G R A D E I - 0
G R A D E V - I V
G R A D E V - I I I
G R A D E V - I I
G R A D E V - I
G R A D E V - 0
MORBIDITY: GROUP JUDGMENTS
No Very Weak Weak Moderate
Strong Very Strong Extreme
1
2
1
1
4
5
2
1
5
6
3
1
1
1
2
4
3
2
2
2
4
1
1
5
5
7
8
10
G R A D E I V - I I I
G R A D E I I I - I I
G R A D E I I - I
G R A D E I - 0
G R A D E V - I V
G R A D E V - I I I
G R A D E V - I I
G R A D E V - I
G R A D E V - 0
MORBIDITY: INDIVIDUAL JUDGMENTS
No Very Weak Weak Moderate
Strong Very Strong Extreme
Figure 25. Quantification of MACBETH categories by performance levels. At left there are the individual opinions, considering the inconsistent judgments and not its corrections and at right it is the category or categories selected by the group.

45
After looking at the graphs of figure 25 it is possible to say in seven of nine comparisons the
group opinion translates the majority of individual opinions, being one of them together with the second
most chosen (Grade IV-III). Grade I-0 was classified as ‘Weak’ by the group, which is a category that
was not chosen in the individual opinions and it translates less impact than the categories chosen by
eight of ten surgeons when asked individually. Grade II-I was classified by two categories, the ones that
were chosen in second and third place in the individual opinions by a total of five surgeons. Looking at
the individual judgements, the first four comparisons together with the last two present more similar
answers than the other comparisons. So, we can say that respecting Morbidity, surgeons analyse more
differently comparisons of attractiveness between consecutive performance levels than between the
least attractive level and the other levels. Nevertheless, in the group answer, they could easily choose
an evaluation together.
Table 10 presents the value scales of the individual and group models obtained by the given
qualitative judgments.
Table 10. Value Scales built according to the consistent qualitative judgments for the individual and group opinions.
Interviewed Doctors
(D)
Morbidity Value Scales
No morbidity Grade I Grade II Grade III Grade IV Grade V
D1 175 100 0 -100 -200 -350
D2 180 100 0 -100 -200 -280
D3 200 100 0 -100 -200 -320
D4 200 100 0 -133 -266 -366
D5 450 100 0 -75 -150 -225
D6 175 100 0 -125 -225 -375
D7 133 100 0 -133 -266 -433
D8 200 100 0 -400 -800 -1400
D9 200 100 0 -133 -266 -433
D10 200 100 0 -133 -300 -500
Average 211,3 100 0 -143,2 -287,3 -468,2
Standard Deviation 86,5 0 0 92,5 185,6 336,9
GROUP 125 100 0 -100 -250 -500
Grade I and grade II are the anchors of the value scale, the good and the neutral levels, so their
values are 100 and 0 in all situations, not having variation.
Value scales are interval scales thus the length of the interval between performance levels
translates the attractiveness of the improvement given by surgeons. So, when the validation was made,
in group model, questions such “do you agree that the difference of attractiveness of the improvement
between Grade III and Grade II is the same of the improvement between Grade II and Grade I?” were
asked.
For a better understanding of the interval scales presented in this chapter, looking at the first
three levels it is possible to say that the individual value scales translate that five (D3, D4, D8, D9, D10)

46
of ten surgeons considered the improvement from Grade I to No morbidity equally attractive to the
improvement from Grade II to Grade I, since both intervals have 100 points. The other surgeons
considered it as less attractive, with the exception of D5 that considered it as three and a half times
more attractive and which contributed to an average of more than 200 to the value attributed to No
morbidity level. In group, and explaining these comparisons of attractiveness, surgeons defended that
Grade II to Grade I is a more attractive improvement than Grade I to No morbidity so this latter level was
validated at 125, which means that the improvement Grade II to Grade I is four times more attractive
than Grade I to No morbidity (first interval has 100-0=100 points and the other 125-100=25).
Regarding the level Grade III, there is two values that capture the attention: -75 and -400, the
other values are closer to the group value that was -100. According to the group, the improvement
between Grade III and Grade II is equally attractive to the neutral-good improvement (between Grade II
and Grade I). The -75 case considered the first improvement (Grade III-Grade II) less attractive while
the -400 case considered it four times more attractive, both compared to the neutral-good improvement.
In the level Grade IV, the values that diverge more are -150 and -800. The group obtained a
value of -250 so for the group the improvement between Grade IV and Grade III was considered one
and a half time more attractive than the improvement between Grade III and Grade II. In the individual
opinions, for eight surgeons (D1-D5, D7-D9) these improvements were considered as equally attractive,
despite the intervals have different between the surgeons, and for the other two surgeons, D6
considered Grade IV to Grade III a less attractive improvement than Grade III to Grade II and D10
considered the opposite.
Finally and respecting the level Grade V, its more discrepant value is -1400, however if the
improvements Grade V to Grade IV and Grade IV to Grade II (neutral level) are compared the latter
ones are always more attractive, two times in the D5 case and less than that in the others. If Grade V
to Grade II (neutral level) is compared with the neutral-good (Grade II-Grade I) improvement, it is always
more than two times more attractive, being 14 times in the -1400 case (D8); for the group it is five times
more attractive.
In the individual value scales obtained, it was observed that:
All surgeons agree that the Grade IV to Grade II improvement has more impact for the
patient quality of life than the Grade V to Grade IV improvement;
All surgeons agree that the Grade V to Grade II improvement has more impact for the
patient quality of life than the Grade II to Grade I improvement.
The majority of surgeons (80%) consider that the Grade IV to Grade III and Grade III to
Grade II improvements are equally attractive.
60% of the surgeons considered that Grade III to Grade II improvement has more
impact for the patient quality of life than the Grade II to Grade I improvement.
These assumptions are important for the multicriteria models attribute more or less length in the
intermediate intervals (the intervals between the levels of performance).
Now that the interval scales are explained as well as its meaning in the performance levels, the
different opinions will be analysed in the other criteria in a briefer way.

47
5.1.2. Functional Recovery
Following the same structure of Morbidity criterion, the qualitative judgements according
Functional Recovery criterion are presented below in table 11 and figure 26 presents the number of
surgeons that attributed each MACBETH category to each performance level comparing it to the group
answer.
Table 11. Qualitative judgments attributed to the comparisons of Functional Recovery criterion by every surgeon and the group. The initials are according to MACBETH scale: N – No; VW – Very Weak; W – Weak; M – Moderate; S – Strong; VS – Very Strong; E – Extreme. The hyphen represents that more than one categories were attributed and the strikethrough represents an inconsistent judgment, being the correction adopted presented after the arrow.
Interviewed
Doctors (D)
Functional Recovery: Differences of Attractiveness
Level 5 to
Level 1
Level 5 to
Level 2
Level 5 to
Level 3
Level 5 to
Level 4
Level 2 to
Level 1
Level 3 to
Level 2
Level 4 to
Level 3
D1 E E E S VS M S
D2 E VS VS M VS M VS
D3 E E E E VS VS VS
D4 E S VS VS M W VW S
D5 E VS M S S W M S
D6 E N S VW S S VS N M S
D7 E E VS S VW M VS
D8 E E E S VW W S
D9 E VS VS S M M VS
D10 E E E S M M S M
GROUP VS-E VS S-VS S W-M W-M S-VS
1
1
1
2
1
2
1
1
2
2
6
1
6
3
4
7
4
1
4
10
5
4
1
L E V E L S : 5 T O 1
L E V E L S : 5 T O 2
L E V E L S : 5 T O 3
L E V E L S : 5 T O 4
L E V E L S : 2 T O 1
L E V E L S : 3 T O 2
L E V E L S : 4 T O 3
FUNCTIONAL RECOVERY: INDIVIDUAL JUDGMENTS
No Very Weak Weak Moderate
Strong Very Strong Extreme
L E V E L S : 5 T O 1
L E V E L S : 5 T O 2
L E V E L S : 5 T O 3
L E V E L S : 5 T O 4
L E V E L S : 2 T O 1
L E V E L S : 3 T O 2
L E V E L S : 4 T O 3
FUNCTIONAL RECOVERY: GROUP JUDGMENTS
No Very Weak Weak Moderate
Strong Very Strong Extreme
Figure 26. Quantification of MACBETH categories by performance levels. At left there are the individual opinions, considering the inconsistent judgments and not its corrections and at right it is the category or categories selected by the group.

48
In the given judgments, the comparisons which classification was more divergent in the
individual opinions were the ones from Level 2 to Level 1 and from Level 3 to Level 2 with a range of
classifications from ‘Very Weak’ to ‘Very Strong’. There is complete agreement in the attractiveness of
the improvement from Level 5 (Incapacitate symptoms) to Level 1 (Asymptomatic), being ‘Extreme’ the
MACBETH category attributed in the individual opinions and ‘Extreme-Very Strong’ by the group.
D6 presented inconsistencies involving Level 2 (Reposition of the state previous to the acute
episode) that must be a misunderstanding by the surgeon about the Level 2 because he considered
Level 2 with no difference of attractiveness related to Level 5 (Incapacitate symptoms).
After looking at the figure it is easier to see that the group discussion led to choosing categories
that not always were selected by the majority of surgeons and for example the improvement from Level
5 to Level 4 was classified as ‘Strong’ despite this category not have been selected in the individual
phase.
Table 12 presents the value scales that translate the individual and group opinions, obtained by
the given qualitative judgments or its adopted suggestions when inconsistencies occurred.
Table 12. Value Scales built according to the consistent qualitative judgments for the individual and group opinions.
Interviewed Doctors
(D)
Functional Recovery Value Scales
Level 1 Level 2 Level 3 Level 4 Level 5
D1 267 100 0 -133 -266
D2 267 100 0 -166 -266
D3 200 100 0 -100 -220
D4 300 100 0 -400 -700
D5 167 100 0 -133 -266
D6 500 100 0 -133 -266
D7 133 100 0 -166 -300
D8 150 100 0 -200 -400
D9 200 100 0 -166 -300
D10 200 100 0 -100 -233
Average 238,4 100 0 -169,7 -321,7
Standard Deviation 106,6 0 0 86,8 141,7
GROUP 250 100 0 -200 -450
In the table it is possible to see that:
The Level 2 to Level 1 improvement was considered as more attractive than the neutral-
good (Level 3 to Level 2) improvement by four surgeons (D1, D2, D4, D6), less attractive
by three surgeons (D5, D7, D8) and equally attractive by the others. The group opinion
classifies that improvement as one and a half times more attractive than the neutral-
good one;
80% of the surgeons consider the Level 4 to Level 3 improvement as more attractive to
the patient quality of life than the neutral-good improvement and the other two surgeons

49
(D3, D10) consider both improvements equally attractive. In the group value scale it is
classified as two times more attractive than the neutral-good improvement;
The Level 5 to Level 4 improvement is considered equally attractive to the Level 4 to
Level 3 improvement by four surgeons (D1, D5, D6, D8), two surgeons (D3, D10)
considered it more attractive and the other four considered it less attractive. The group
considered it as more attractive.
All surgeons agree that the Level 5 to neutral level (Level 3) improvement has more
impact to the patient quality of life than the neutral-good improvement, being four and a
half times more attractive in the group judgment.
5.1.3. Patient Satisfaction
The qualitative judgments that translate the individual and group opinions are in table 13. Patient
Satisfaction is the criterion with less inconsistencies and they occur in D6: the Level 4-Level 3
improvement is classified as ‘Moderate’ which is not consistent because the Level 5-Level 4 and Level
5-Level 3 improvements were classified as ‘Very Weak’ and ‘Weak’ respectively; and in D7: the Level
5-Level 4 improvement is classified as ‘Moderate’ and the Level 4-Level 3 as ‘Strong’ and then the Level
5-Level 3 improvement cannot be classified as ‘Moderate’.
Table 13. Qualitative judgments attributed to the comparisons of Patient Satisfaction criterion by every surgeon and the group. The initials are according to MACBETH scale: N – No; VW – Very Weak; W – Weak; M – Moderate; S – Strong; VS – Very Strong; E – Extreme. The hyphen represents that more than one categories were attributed and the strikethrough represents an inconsistent judgment, being the correction adopted presented after the arrow.
Interviewed
Doctors (D)
Patient Satisfaction: Differences of Attractiveness
Level 5 to
Level 1
Level 5 to
Level 2
Level 5 to
Level 3
Level 5 to
Level 4
Level 2 to
Level 1
Level 3 to
Level 2
Level 4 to
Level 3
D1 E VS W W E VS VW
D2 E E M M VS S M
D3 E E E VS S VS VS
D4 E VS M VW W M W
D5 E S M W VW W W
D6 E VS W VW S VS M W
D7 E VS M S M VW M S
D8 VS VS M VW VW VS M
D9 E VS S W S S M
D10 VS VS S M M S M
GROUP E VS S-VS M M S S
The first two improvements have 80% and 70% of agreement in ‘Extreme’ and ‘Very Strong’
categories, respectively, being the group judgment in concordance with the majority. Level 5 to Level 4,
that is Very Unsatisfied to Unsatisfied, has a range from ‘Very Weak’ to ‘Very Strong’ in the answers,
which also occurs with Level 2-Level 1 (Satisfied to Very Satisfied) and with Level 4-Level 3 (Unsatisfied

50
to Not Unsatisfied or Satisfied). The group attributes ‘Moderate’ category to the first two cases and
‘Strong’ to the last one because they consider that a patient who is no longer unsatisfied and starts to
be not unsatisfied or satisfied is a more attractive improvement than a patient who starts to be even
more satisfied or even less unsatisfied.
Figure 27 shows the quantification of the judgments by improvements according to each
surgeon and compares it with the group answer.
In the group opinion, the first two categories are in agreement with the majority of the individual
opinions, as said before. For the other improvements, it is demonstrated once again that discussing the
subjects in a group, with everyone exposing their opinions, can lead to an agreement in a way not
thought before, or thought by few people.
Table 14 presents the value scales obtained by the qualitative judgments attributed in the
Patient Satisfaction criterion and it can be seen that:
70 % of the surgeons consider the Level 2 to Level 1 improvement as less attractive
than the neutral-good improvement (Level 3 to Level 2). It is considered more attractive
by two surgeons (D1, D2) and equally attractive by one surgeon (D9).
70 % of the surgeons consider that the Level 4 to Level 3 improvement is less attractive
than the neutral-good improvement. It is considered more attractive by surgeon D7,
equally attractive by surgeons D3 and D5.
50% of the surgeons consider the Level 5 to Level 4 improvement less attractive than
the Level 4 to Level 3 one. It is considered more attractive by two surgeons (D1, D2)
and equally attractive by three surgeons (D3, D5, D10).
The group considered that the neutral-good improvement is equally attractive to the
Level 4 to Level 3 improvement and these improvements are more attractive than the
ones between Level 2 and Level 1 (Satisfied-Very Satisfied) and between Level 5 and
Level 4 (Very Unsatisfied-Unsatisfied), which are equally attractive between each other.
1
3
3
1
3
1
1
2
1
3
1
2
5
1
3
3
1
2
7
4
1
1
4
1
8
2
4
1
L E V E L S : 5 T O 1
L E V E L S : 5 T O 2
L E V E L S : 5 T O 3
L E V E L S : 5 T O 4
L E V E L S : 2 T O 1
L E V E L S : 3 T O 2
L E V E L S : 4 T O 3
PATIENT SATISFACTION: INDIVIDUAL JUDGMENTS
No Very Weak Weak Moderate
Strong Very Strong Extreme
L E V E L S : 5 T O 1
L E V E L S : 5 T O 2
L E V E L S : 5 T O 3
L E V E L S : 5 T O 4
L E V E L S : 2 T O 1
L E V E L S : 3 T O 2
L E V E L S : 4 T O 3
P AT IENT S AT IS FAC T IO N: GR O UP JUDGMENT S
No Very Weak Weak Moderate
Strong Very Strong Extreme
Figure 27. Quantification of MACBETH categories by performance levels. At left there are the individual opinions, considering the inconsistent judgments and not its corrections and at right it is the category or categories selected by the group.

51
Table 14. Value Scales built according to the consistent qualitative judgments for the individual and group opinions.
Interviewed
Doctors (D)
Patient Satisfaction Value Scales
Level 1 Level 2 Level 3 Level 4 Level 5
D1 267 100 0 -16 -50
D2 214 100 0 -42 -85
D3 180 100 0 -100 -200
D4 167 100 0 -66 -100
D5 167 100 0 -100 -200
D6 183 100 0 -33 -50
D7 133 100 0 -133 -233
D8 117 100 0 -50 -66
D9 200 100 0 -75 -125
D10 175 100 0 -75 -150
Average 180,3 100 0 -69 -125,9
Standard Deviation 41,7 0 0 35,4 67,1
GROUP 175 100 0 -100 -175
5.1.4. Patient Costs
Table 5 presents the qualitative judgments given, individually and in group, considering the
Patient Costs criterion. This criterion presents more inconsistencies but it has also more comparisons
asked to the surgeons. Questions regarding this criterion were considered easier to answer discussing
them in group, in the decision conference, than when they were asked in the web-based platform, which
happened due to all the possible combinations in the type of costs.
The comparisons with more inconsistencies are from Level 8 to 4 (from costs of medication and
extra visits to the hospital plus alteration of the economic balance to the same costs but without alteration
of the economic balance) and from Level 7 to 6 (from costs of medication plus alteration of the economic
balance to costs of extra visits to the hospital plus alteration of the economic balance).
The first comparison between the least and the most attractive levels almost had total
agreement in the classification, having nine surgeons and the group classifying it as ‘Extreme’ and only
one surgeon (D8) classifying it as ‘Very Strong, which makes sense since they are the levels associated
with more and less attractiveness in the descriptor. Between Levels 2 and 1 the given classifications
were from ‘Very Weak’ to ‘Very Strong’, being in the group opinion classified as ‘Weak’.
Figure 28 is presented after table 5 and it shows the number of answers classifying each
category and compares it, once again, to the group opinion.
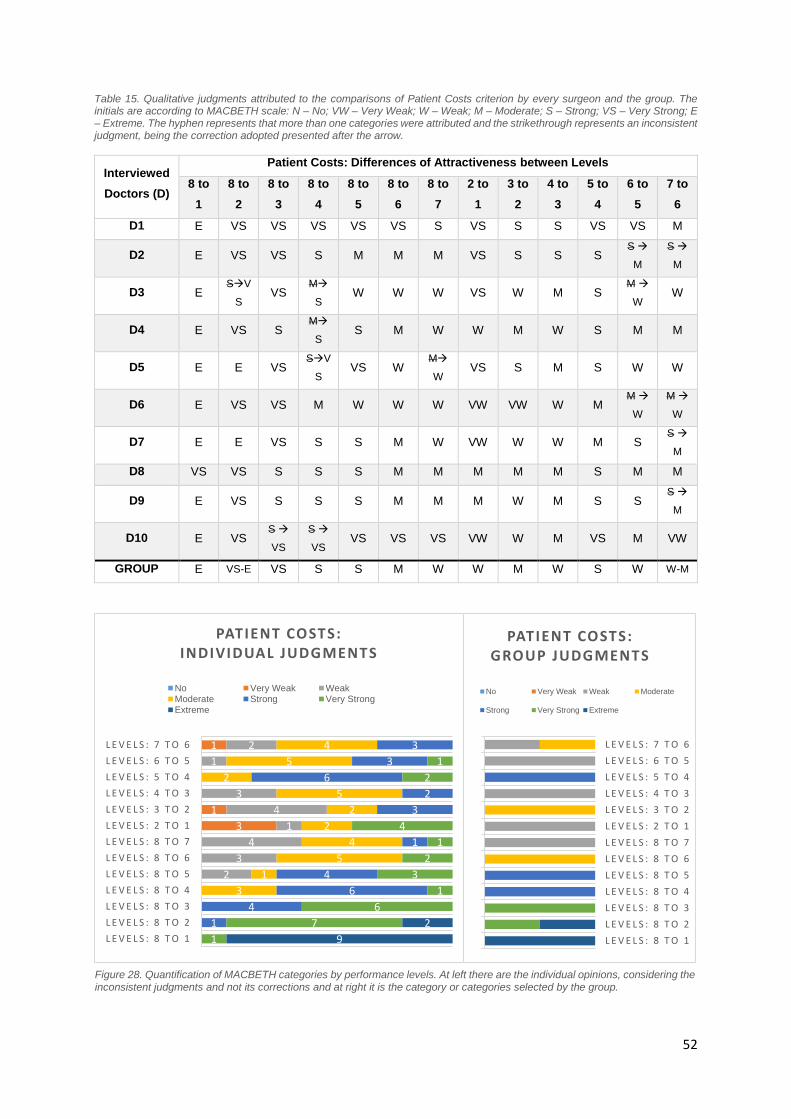
52
Table 15. Qualitative judgments attributed to the comparisons of Patient Costs criterion by every surgeon and the group. The initials are according to MACBETH scale: N – No; VW – Very Weak; W – Weak; M – Moderate; S – Strong; VS – Very Strong; E – Extreme. The hyphen represents that more than one categories were attributed and the strikethrough represents an inconsistent judgment, being the correction adopted presented after the arrow.
Interviewed
Doctors (D)
Patient Costs: Differences of Attractiveness between Levels
8 to
1
8 to
2
8 to
3
8 to
4
8 to
5
8 to
6
8 to
7
2 to
1
3 to
2
4 to
3
5 to
4
6 to
5
7 to
6
D1 E VS VS VS VS VS S VS S S VS VS M
D2 E VS VS S M M M VS S S S S
M
S
M
D3 E SV
S VS
M
S W W W VS W M S
M
W W
D4 E VS S M
S S M W W M W S M M
D5 E E VS SV
S VS W
M
W VS S M S W W
D6 E VS VS M W W W VW VW W M M
W
M
W
D7 E E VS S S M W VW W W M S S
M
D8 VS VS S S S M M M M M S M M
D9 E VS S S S M M M W M S S S
M
D10 E VS S
VS
S
VS VS VS VS VW W M VS M VW
GROUP E VS-E VS S S M W W M W S W W-M
3
1
1
2
3
4
1
4
3
1
2
3
1
5
4
2
2
5
2
5
4
1
4
6
4
1
3
2
6
3
3
1
7
6
1
3
2
1
4
2
1
9
2
L E V E L S : 8 T O 1
L E V E L S : 8 T O 2
L E V E L S : 8 T O 3
L E V E L S : 8 T O 4
L E V E L S : 8 T O 5
L E V E L S : 8 T O 6
L E V E L S : 8 T O 7
L E V E L S : 2 T O 1
L E V E L S : 3 T O 2
L E V E L S : 4 T O 3
L E V E L S : 5 T O 4
L E V E L S : 6 T O 5
L E V E L S : 7 T O 6
PATIENT COSTS: INDIVIDUAL JUDGMENTS
No Very Weak WeakModerate Strong Very StrongExtreme
L E V E L S : 8 T O 1
L E V E L S : 8 T O 2
L E V E L S : 8 T O 3
L E V E L S : 8 T O 4
L E V E L S : 8 T O 5
L E V E L S : 8 T O 6
L E V E L S : 8 T O 7
L E V E L S : 2 T O 1
L E V E L S : 3 T O 2
L E V E L S : 4 T O 3
L E V E L S : 5 T O 4
L E V E L S : 6 T O 5
L E V E L S : 7 T O 6
PATIENT COSTS: GROUP JUDGMENTS
No Very Weak Weak Moderate
Strong Very Strong Extreme
Figure 28. Quantification of MACBETH categories by performance levels. At left there are the individual opinions, considering the inconsistent judgments and not its corrections and at right it is the category or categories selected by the group.

53
Some judgments of the group opinion translate the individual opinion of the majority of the
surgeons however it does not occur always like that, the agreement was reached sometimes according
to different judgments.
Table 16 shows the value scales obtained after the qualitative judgments for the individual and
group opinions.
Table 16. Value Scales built according to the consistent qualitative judgments for the individual and group opinions.
Interviewed Doctors
(D)
Patient Costs Value Scales
Level 1 Level 2 Level 3 Level 4 Level 5 Level 6 Level 7 Level 8
D1 162 100 50 0 -62 -125 -162 -212
D2 200 100 50 0 -50 -65 -80 -95
D3 267 100 78 0 -88 -111 -133 -155
D4 140 100 40 0 -120 -180 -240 -280
D5 164 100 45 0 -54 -81 -100 -118
D6 133 100 67 0 -233 -300 -366 -433
D7 125 100 50 0 -75 -225 -300 -350
D8 150 100 50 0 -116 -166 -216 -266
D9 160 100 60 0 -140 -280 -340 -400
D10 120 100 60 0 -100 -160 -180 -280
Average 162,1 100 55 0 -103,8 -169,3 -211,7 -258,9
Standard Deviation 43,6 0 11,3 0 54,4 79,4 99,1 115,1
GROUP 140 100 40 0 -100 -140 -180 -220
According to these value scales:
80% of the surgeons considered the first improvement (Level 2 to Level 1) less attractive
than the neutral-good improvement (Level 4 to Level 2). Only D2 considered it as
equally attractive and D3 as more attractive.
Only two surgeons (D4, D5) considered the Level 4 to Level 3 improvement as less
attractive than Level 3 to Level 2, which was also the group opinion. The other surgeons
were divided between equally and more attractive.
In the consecutive comparisons of levels since Level 5 to 8, the group considered that
all the intervals should have the same length (in this case 40 points), which translates
that they consider these three pairs of improvements equally attractive between each
other. This situation also occurred in surgeon D8 but with intervals of 50 points. As
mentioned, the length of the interval translates the impact of the improvement, i.e., the
difference of attractiveness of that change, according to the surgeon, so according to
D8, despite all those improvements being equally attractive, they are considered more
attractive than in the group opinion.
70% of the surgeons consider the Level 8 to neutral level improvement less than four
and a half times more attractive than the neutral-good improvement.

54
5.1.5. Comparisons of Standard Deviations
The standard deviations of the individual opinions were presented in the tables of the value
scales obtained, however, here the standard deviations respecting all the criteria levels are together.
Patient Satisfaction criterion is the one with more agreement, having lower standard deviation
values, and Morbidity the one with less. Morbidity criterion presents the higher standard deviation in the
last performance level (death state) because the value of death in the value scale goes from -225 to -
1400 in the individual models, having an average of -468.
Considering the averages of the values of each level, the group judgments are always in the
interval given by the standard deviation added and subtracted in the average, except in the case that
the standard deviation is 11.3 in the Patient Costs criterion. Here, the group judgment is outside of the
interval however it is by less than four units. Thus, there are not values in group value scales that diverge
a lot from the individual ones. Most of the times, in the individual value scales, it was observed similarity
in the opinions comparing the attractiveness of improvements.
5.1.6. Criteria Weighting
Table 17 presents the ranking given by the surgeons and the group when they were confronted
with all the criteria in the neutral level and they had to choose the order in which they would do the
improvements.
86
,5 10
6,6
41
,7
43
,6
0,0
0,0
0,0
0,0
0,0
0,0
0,0 1
1,3
92
,5
86
,8
35
,4
0,0
18
5,6
14
1,7
67
,1
54
,4
33
6,9
79
,4 99
,1 11
5,1
M O R B I D I T Y F U N C T I O N A L R E C O V E R Y
P A T I E N T S A T I S F A C T I O N
P A T I E N T C O S T S
STANDARD DEVIATION OF EACH PERFORMANCE LEVEL ON VALUE SCALES
Figure 29. Standard deviation of the performance levels of each criterion in the individual opinions. The zeros are the anchors (neutral and good levels), they have not deviation from their values because the anchors are fixed values in the value scales, which are always 0 for the neutral level and 100 for the good level.

55
Table 17. Ranking of the criteria according to the attractiveness of the neutral-good improvement and its classification using MACBETH scale: N – No; VW – Very Weak; W – Weak; M – Moderate; S – Strong; VS – Very Strong; E – Extreme. In the cells in boxes (D5) the ranking was inconsistent with the judgments and the order was swapped.
Interviewed
Doctors (D)
Criteria weighting: Ranking
Ranked 1st
(qualitative judgment)
Ranked 2nd
(qualitative judgment)
Ranked 3rd
(qualitative judgment)
Ranked 4th
(qualitative judgment)
D1 Functional Recovery
(VS)
Patient Satisfaction
(VS)
Morbidity
(VS)
Patient Costs
(S)
D2 Morbidity
(S)
Functional Recovery
(S)
Patient Satisfaction
(S)
Patient Costs
(S)
D3 Morbidity
(E)
Functional Recovery
(E)
Patient Satisfaction
(VS)
Patient Costs
(S)
D4 Functional Recovery
(VS)
Morbidity
(S)
Patient Satisfaction
(S)
Patient Costs
(M)
D5 Patient Satisfaction
(S)
Morbidity
(M)
Functional Recovery
(S)
Patient Costs
(W)
D6 Functional Recovery
(VS)
Patient Satisfaction
(S)
Patient Costs
(M)
Morbidity
(M)
D7 Functional Recovery
(M)
Morbidity
(M)
Patient Satisfaction
(W)
Patient Costs
(W)
D8 Functional Recovery
(S)
Morbidity
(S)
Patient Satisfaction
(M)
Patient Costs
(M)
D9 Functional Recovery
(VS)
Morbidity
(S)
Patient Costs
(S)
Patient Satisfaction
(M)
D10 Functional Recovery
(VS)
Patient Satisfaction
(S)
Patient Costs
(M)
Morbidity
(W)
GROUP Patient Satisfaction
(M)
Morbidity
(M)
Functional Recovery
(W)
Patient Costs
(VW)
In the decision conference it was perceptible that the surgeons were ranking the options not
considering the neutral-good improvement but they were looking just at the criterion, thinking about what
is the more important instead of the improvement they wanted to do first. This reveals how important is
involving the decision makers in the development of the multicriteria model and how the on-the-spot
development brought advantages. This fact explains why the group ranking has a first option so different
of the individual models.
Patient costs criterion, however, reveals itself 70% of the times in the 4th placed in the individual
opinions and in the group opinion. In the individual models Morbidity criterion is placed in 2nd by 5 of 10
surgeons but in the other 5 it goes from the 1st to the 4th place and Functional Recovery criterion is
placed 1st by 7 of 10 surgeons. This information is more perceptible in the graph of figure 30 that presents
the ranking according to individual opinions and then figure 31 presents the quantitative values that is
the criteria weights according to all the surgeons.

56
In the graphs it is possible to see the impact of the decision conference in the ranking and in the
weights. Patient Satisfaction was treated very differently by the group, after understanding that the rank
should be based on the attractiveness of the improvements.
5.2. The Models Illustrated by Patient Cases
Each multicriteria model developed evaluates the benefit that each treatment brings to the
patient quality of life, in the surgeons’ point of view. It can be a useful tool because evaluating all the
possibilities allows the observation of what is associated with a higher overall value. However, to
measure the benefit of each possibility, it is needed to know the impact of all the possibilities in the
1
7
2
3
3
4
3
5
2
7
1
2
P A T I E N T C O S T S
S A T I S F A C T I O N
F U N C T I O N A L R E C O V E R Y
M O R B I D I T Y
DISTRIBUTION OF SURGEONS' RANKINGS
Ranked 1st Ranked 2nd Ranked 3rd Ranked 4th
Figure 30. Distribution of criteria by the ranking according individual opinions.
D1 D2 D3 D4 D5 D6 D7 D8 D9 D10AVERAG
EGROUP
Morbidity 23 32 32 28 21 17 29 28 28 14 25 30
Functional Recovery 32 27 27 33 29 33 36 33 33 36 32 20
Patient Satisfaction 27 23 23 22 36 28 21 22 17 29 25 40
Patient costs 18 18 18 17 14 22 14 17 22 21 18 10
05
1015202530354045
INDIVIDUAL AND GROUP MODELS: CRITERIA WEIGHTS
Morbidity Functional Recovery Patient Satisfaction Patient costs
Figure 31. Criteria weights and ranking according to individual opinions and to the group opinion.

57
patient, according to the criteria of interest (Morbidity, Functional Recovery, Patient Satisfaction and
Patient Costs).
Patient cases were constructed with the impacts on the criteria to see how the models evaluate
each case. Next section presents how the cases were constructed and their performances. Then, it is
made the comparison between models to observe the impact of the opinions in the answer of the model.
Finally, it is explained how the compromise model of the group can be a useful tool for the hospital,
aiding in the decision making process.
5.2.1. Patient Cases
Patient cases were constructed accessing the hospital database. However, the information
about the impact of both ways of treatment, ELC and ILC, according to the criteria of the model was not
available. First, because if a patient undergoes an ELC, the impact about an ILC could not be
documented and second because, even for the chosen approach, the needed information was not
documented in the database.
To overcome this difficulty, patients with similar medical history were grouped and two groups
were chosen to be surveyed by telephone about the needed information: the patients with no clinical
history and the patients with diabetes mellitus type II (DMII). DMII cases were chosen for having an
increased risk of complications [58]. In these groups there were patients that underwent both ways of
treatment. Questioning the patients about the criteria of interest allowed to overcome the second
difficulty pointed out about not having the information about the impacts on the criteria. To overcome
the first difficulty (about just having the impacts on a way of treatment for a patient), the information of
the groups was brought together and two generic patients were constructed, one for each group: patient
A – a generic patient without clinical history; and patient B – a generic patient with DMII. The generic
patients A and B used the data of all the patients of the groups, the impacts of all the patients with no
clinical history and the impacts of all the patients with DMII respectively, allowing to know the impacts
on the criteria according to both ways of treatment, since there were patients of ELC and of ILC in both
groups. For each generic patient, a best and a worst cases were made with the best and the worst
impacts obtained.
First, the impacts on the criteria were assembled considering the more obtained answers of the
patients. However, the groups with the wanted specifications about clinical history and with more than
72 hours since the onset of the symptoms that answered by telephone were composed by a really small
number of people: eight people to build patient A and nine to build patient B so the cases were built
using the data of very few people just to show how the models evaluation process works.
Table 18 is presented next with the general cases made with the more obtained values. After
that, two more tables are presented, one for patient A best and worst impacts obtained and another for
patient B best and worst impacts obtained.

58
Table 18. Patient A and B performances in ELC and ILC according to the answers obtained by the patients.
Criteria Patient A Patient B
ELC
Morbidity No morbidity No morbidity
Functional
Recovery Asymptomatic Asymptomatic
Satisfaction Satisfied Satisfied
Costs
With extra hospital visits costs and
with alteration of the economic
balance. Without medication costs.
With medication costs, extra hospital
visits costs and alteration of the
economic balance.
ILC
Morbidity No morbidity No morbidity
Functional
Recovery Limitative Symptoms Minimal Symptoms
Satisfaction Very Satisfied Very Satisfied
Costs
With extra hospital visits costs.
Without medication costs and without
alteration of the economic balance.
Without costs but with alteration of
the economic balance.
Table 19 and 20, below, are the ones that present the best and worst cases for patient A and
B, respectively.
Table 19. Patient A best and worst cases reported by the patients of the two treatment options.
Patient Criteria Best Case Worst Case
A
ELC
Morbidity No morbidity Grade III
Functional
Recovery Asymptomatic Limitative Symptoms
Satisfaction Very Satisfied Satisfied
Costs
With medication costs and extra
hospital visits costs. Without
alteration of the economic balance
With extra hospital visits costs and
with alteration of the economic
balance. Without medication costs
ILC
Morbidity No morbidity Grade III
Functional
Recovery Asymptomatic Limitative Symptoms
Satisfaction Very Satisfied Very Satisfied
Costs Without costs and without alteration
of the economic balance
With medication costs, extra hospital
visits costs and alteration of the
economic balance

59
Table 20. Patient B best and worst cases reported by the patients of the two treatment options.
Patient Criteria Best Case Worst Case
B
ELC
Morbidity No morbidity No morbidity
Functional
Recovery Asymptomatic Limitative Symptoms
Satisfaction Very Satisfied Not unsatisfied or satisfied
Costs Without costs and without alteration of
the economic balance
With medication costs, extra
hospital visits costs and alteration
of the economic balance
ILC
Morbidity No morbidity No morbidity
Functional
Recovery Asymptomatic Minimal Symptoms
Satisfaction Very Satisfied Satisfied
Costs
With medication costs. Without extra
hospital visits costs and without
alteration of the economic balance
Without costs but with alteration of
the economic balance
These cases allow to observe the answer of the models for those patients however the cases
are very wide-ranging and they must be improved. Speaking only about the clinical history is scarce
information. Besides, the patients with DMII can also have other co-morbidities and to investigate the
effect of multiple co-morbidities on the outcomes of the patient is an important matter. Ideally, the patient
cases would provide enough information for the doctors to imagine the patient itself. Thus, a lot of work
can be posteriorly done here. Next section presents the evaluation of the models to the performances
of these patients.
5.2.2. Comparing Results of the Multicriteria Models
The performances of patients A and B are presented in figure 32, below.
-50
0
50
100
150
200
D1
D2
D3
D4
D5
D6
D7
D8
D9
D1
0
AV
ERA
GE
GR
OU
P
Patient A
ELC ILC
0
50
100
150
200
D1
D2
D3
D4
D5
D6
D7
D8
D9
D1
0
AV
ERA
GE
GR
OU
P
Patient B
ELC ILC
Figure 32. Evaluation of the multicriteria models for patient A at left and patient B at right.

60
Patients A and B have the same performance on Morbidity, the level with the highest score on
the value scale, so, for the two approaches all the patients are evaluated with the maximum partial score
on this criterion.
Regarding the other criteria, for patient A an ELC provides a better performance for Functional
Recovery criterion but ILC does the same for the Patient Satisfaction and Patient Costs criteria. Looking
at the graph, it is possible to see that ELC has always more value than ILC which happens due to the
poor performance of ILC reported in Functional Recovery criterion which cannot be compensated by the
satisfaction and the costs because, even for the cases that Patient Satisfaction has a higher weight than
Functional Recovery, its performance on patient A is not considered so low in the value scale as the
performance of Functional Recovery. The same happens with the costs. For example, the negative
value associated with the ILC in D4 happens because this surgeon attributed the weight of 33 to this
criterion and the performance level of this patient for ILC is associated with -400 in the value scale, so
the partial score of Functional Recovery criterion is -400 x 33 = -13 200 while if we look at D5, Functional
Recovery is associated with a weight of 29 and a value on the value scale of -133, contributing with -
133 x 29 = -3 857 to the overall score, and this result is very different from the previous one. All this
values can be consulted in the previous section, where the comparisons of the values are made.
For patient B, the values of both treatment options are similar, in general. The Functional
Recovery for this patient varies between Minimal Symptoms or Asymptomatic which is not so much as
in patient A. D6 differentiates itself for the major difference between the values of ELC and ILC and D9
differentiates itself because is the only one which model attributes more value to ILC. D6 attributes more
value to the asymptomatic state on the Functional Recovery value scale than the other surgeons which
contributes a lot to increase the value of ELC because in the ILC it is in the neutral level so the interval
in this case is given by the value. D9 evaluates the cost levels with a higher impact than the other
surgeons, comparing the interval between the level of ELC and ILC, so for this surgeon’s model this
partial score impact is sufficient for providing a different result.
Now, it is possible to see the results of the models for the best and the worst to both patients.
0
50
100
150
200
250
300
D1
D2
D3
D4
D5
D6
D7
D8
D9
D1
0
AV
ERA
GE
GR
OU
P
Patient A - Best Case
ELC ILC
-200
-150
-100
-50
0
D1
D2
D3
D4
D5
D6
D7
D8
D9
D1
0
AV
ERA
GE
GR
OU
P
Patient A - Worst Case
ELC ILC
Figure 33. Evaluation of the multicriteria models for the patient A best and worst cases.

61
In patient A the best impacts obtained with the few patients questioned only differ in the Patient
Costs criterion, which are worst in ELC so, obviously, it had to always give more value to the ILC
treatment. In the worst case, the only differences are in Patient Satisfaction and Patient Costs. The first
has a better performance in ILC and the second in ELC so in the graph at right of the previous figure
(figure 33) we can see the results according to each model. In the majority of the evaluations, the values
of ELC and ILC are not so different because the differences between the levels of ELC and ILC (for both
criteria) are not so big. In the group model, Patient Satisfaction is the criterion with the highest weight
and Patient Costs with the lowest so, even with a little difference between the levels on both approaches,
the weights influence that difference of value. In D5 it happens the same with the weights of the criteria
but in the other cases the differences are mainly attributed to the differences on value scales, once the
majority of surgeons does not have weights so different for this criteria.
For patient B, the best and worst cases reported are presented below in figure 34. Once again,
the best impacts obtained only differ in the Patient Costs criterion, which are worst in ILC so, obviously,
it had to always give more value to the ELC treatment. All the patients of group B, ELC and ILC patients,
presented no morbidity and the ones undergoing ILC presented better impacts in the three remaining
criteria Patient Satisfaction, Patient Costs and Functional Recovery, so, in this case the treatment with
more value was also obvious. The worst performance level reported by patients of ILC in group B were
satisfied which together with the no morbidity contributes to a positive overall score of Patient B in ILC
even in the worst case graph.
These cases of best and worst reported performances are sometimes obvious and they are not
good examples to show the application of the model, they have to be refined to be possible a better
observation of the results. Like they are now, they are very contrasting. However, the first cases
presented contributed to give an idea of how, even with different performances, the multicriteria models
result in a score because they had some different impacts in both approaches, pros and cons for each
way of treatment, which usually happens in these matters. In those cases the Morbidity was constant
0
50
100
150
200
250
300
D1
D2
D3
D4
D5
D6
D7
D8
D9
D1
0
AV
ERA
GE
GR
OU
P
Patient B - Best Case
ELC ILC
-150
-100
-50
0
50
100
150
D1
D2
D3
D4
D5
D6
D7
D8
D9
D1
0
AV
ERA
GE
GR
OU
P
Patient B - Worst Case
ELC ILC
Figure 34. Evaluation of the multicriteria models for the patient B best and worst cases.

62
because the information obtained did not have some differences in this criterion, but it would be even
more interesting observing the answers of the models to cases in which all the criteria have differences.
In general, despite the different opinions obtained in the qualitative judgments of the surgeons,
the answers of the models are similar, converging to a same result for the patients. Next section explain
how the compromise model can be used as a decision support model for the hospital.
5.2.3. The Compromise Model as a Decision Support Model
As mentioned, each multicriteria model developed can be a useful tool in evaluating the benefit
that each treatment brings to the patient quality of life, in the surgeons’ point of view, allowing to know
which treatment is associated with a higher value. This way, surgeons could have a way not for obtain
a solution but to acquire relevant information in a consistent and well-thought way.
Here in this section, the compromise model results are presented (figure 35) to the patient cases
created before, however and because the evaluation of each possibility needs the information about the
impact of all the possibilities in the patient according to the criteria of interest (Morbidity, Functional
Recovery, Patient Satisfaction and Patient Costs) it would be interesting to add this kind of information
in the hospital database. This way and in a long term, several cases could be compared and clustered
according to much more specific characteristics of the patients, obtaining more specific patient cases to
evaluate with the model. For now, patient cases must also be supported by the literature, trying to obtain
information on how single and multiple co-morbidities influence the criteria of the model to specific
patient profiles, which must be made more specifically than the cases obtained here.
Figure 35. Results of the compromise model for the patient cases presented before. At left there is the table of scores with all the values attributed to each option and the weights of the criteria. At the middle the overall thermometer and at right the overall thermometer without the best and worst cases. (Blue and green boxes are the neutral and good levels, respectively).

63
So here, if we look at the overall thermometer at right in figure 35 we can say that for patient A
an ELC provides more benefit to the quality of life of the patient than an ILC, with an overall performance
better than the good level. This is the way that this model intends to help the surgeons: informing them
about what is considered better for each patient according to their given notions of importance,
attractiveness and requirements. That is why it is so important the restriction of the patient cases
because patients are different in several ways, each difference can induce a different outcome and the
outcomes must be as much accurate as possible to have the expected performances to insert in the
model and see the results.

64
6. Discussion
This section compares the multimethodology with what was known according to the literature
review. Additionally, it is presented a section with the major pros and cons of the followed
multimethodology.
6.1. Comparison of the Multimethodology with the Current Literature
In the literature review the problem of the timing in the treatment of acute cholecystitis patients
was explored. Despite the existence of Tokyo Guidelines concerning the optimal timing and treatment
for these cases, there is no agreement and, consequently, no optimal solution when patients present
more than 72 hours since the onset of symptoms. Additionally, studies concerning variability found were
based on interviews or surveys, only. Merging the interests, this thesis make use of MACBETH
multicriteria approach to explore how surgeons make decisions regarding the choice of treatment of
acute cholecystitis as well as to construct a decision support model to assist surgeons in that choice.
Multicriteria decision analysis (MCDA) technique and, particularly, the MACBETH approach was
sometimes used in healthcare but cases for choosing the treatment in a set of options were not found
to report. In this work, this approach allows to consider several dimensions of the problem because it
incorporates multiple criteria which had their weights determined first making use of a web-based
platform to access individual opinions and then in a decision conference, on-the-spot, with everyone
exposing their opinions and concerns in a group and feeling part of the development of the model.
Surgeons’ different opinions are explored, to understand their impact on the variability, and a model to
support the treatment choice is developed, giving an overall score to a patient state after all the ways of
treatment and observing which way is associated with a higher value.
This multimethodology was applied to the acute cholecystitis cases due to the lack of information
detected in these cases, however, it can be adapted to other diseases providing information on how
surgeons think alone and, at the same time, preparing them with the type of questions for a more
dynamic decision conference culminating in the development of a decision support model to assist them.
6.2. Multimethodology: Pros and Cons
The followed multimethodology involved a socio-technical approach that contributed to obtain
the needed information together with the decision makers, surgeons in this case. It involved several
steps: the structuring of the multicriteria models making use of exploratory interviews, the development
of the individual models after obtaining the individual judgments in a web-based platform, and the
development of the compromise model by a decision conference bringing all the surgeons involved in
the individual models together.
65
The use of all the methodologies in each step could have been more intensely studied, however,
the fact that the surgeons were always participating created a more acceptance in the decision support
model and during the development of each phase they could be aware of what was happening and gain
confidence and familiarization with the processes and questions’ type. This familiarization is very
important because guidelines and other tools are not followed by a lot of surgeons mainly because they
do not think it is useful, as mentioned in the literature review. Additionally, involving surgeons in the
development process was mentioned as a good strategy for them to use that information.
In the beginning it was noted a difficulty in having the surgeons thinking following a value-
focused thinking, especially in providing information about what they expected to obtain when they are
choosing the treatment without giving specific information about the patients, i.e., in a more general way
to explore the criteria. But in the end, especially in the decision conference, it was noted adaptation to
the process and willingness to discuss all the matters. So, an alternative way for looking at the
problematics were presented and it ended up accepted.
The use of MACBETH approach was also valorised for asking for qualitative judgments instead
of quantitative information. In the group they showed they were getting used to the scale and to think
about differences of attractiveness, except when they were establishing the criteria weights that they
showed misunderstanding in the individual web-based platform questions. Nevertheless, they were
clarified during the decision conference. The possibility of inserting more than one category when they
were evaluating differences of attractiveness was also very useful in hesitation cases.
The major limitation is the fact that the patient cases are much general and that way the results
of the model are not accurately observed. The needed information to do it more precisely was not
available in the hospital database and there was no available time to do it with an extensive literature
search, however, this is a thrilling path to follow in the future. Additionally, and as mentioned in the
results chapter, when inconsistencies occurred in the individual judgments, suggestions of M-
MACBETH software were accepted without discussing it with the surgeons. This way, value scales and
criteria weights can be a little different from surgeons’ opinions, which biases the comparison of views.
Ideally, solving inconsistencies and validating the procedures should be made by each surgeon,
however, the web-based platform had not the capacity of detecting inconsistencies and asking for the
validation of the steps, which is also an improving point for the future.

66
7. Conclusion
Decision making situations in surgery are something that a surgeon is always exposed to and in
which using capabilities acquired by experience and training and the knowledge obtained in guidelines
and norms is a constant. However, evidence reported in the literature points out for a large and
inexplicable variability in surgical decision making, even in areas in which scientific data exist. Thus, this
thesis tried to explore and understand how surgeons think when making the treatment choice for acute
cholecystitis patients. This disease was selected because it has a lack of evidence and tools to assist
doctors in their decisions about which treatment to choose in patients with more than 72 hours of
symptoms, so, besides exploring how surgeons think, a decision support model for this choice is also
developed.
To achieve the objectives of explore and understand how surgeons make decisions concerning the
treatment of acute cholecystitis patients, as well as construct a decision support model to assist
surgeons in the choice of treatment, this thesis built a multimethodology that develops and applies
multicriteria methods. First, it uses exploratory interviews to recognise and structure the several issues
that surgeons consider in the evaluation of the choice of treatments for a patient. Then, making use of
MACBETH based questions in a web-based platform it is constructed an individual model that captures
the views of surgeon, for each one of ten surgeons of Hospital de Santa Maria in Lisbon. Then all
surgeons are brought together to take part of a decision conference, building then a MACBETH group
model on-the-spot. The decision support model intends to evaluate the benefit that each treatment
option brings to the patient quality of life, in the surgeons’ point of view, for aiding in the choice of the
treatment that brings more value to the patient.
This multimethodology was useful to accomplish the objectives, the variability between surgeons’
opinions was explored, it was not found influence on a final decision for a patient for the observed patient
cases even with some different opinions on the judgments, and the decision support model was built.
The fact that the socio-technical approach allowed the familiarization of the surgeons with the process,
gaining confidence in it, was a topic of much interest.
Nevertheless, there is a need for improving the web-based platform for the detection of
inconsistencies and possibility of validation and for the development of patient cases more specified in
a future work. Besides the improvement of patient cases with a more exhaustive literature research and
inserting the needed information in the hospital database, an application can be developed for the
surgeons just to insert the patients’ characteristics in it and obtain the value of each option of treatment
for that particular patient. The application could compare the characteristics with the improved patient
cases, obtained by the literature and from more data of the hospital.
This multimethodology can also be applied to other diseases that need some guidance on the
thinking process.
.

67
8. References
[1] P. J. Kennedy, C. M. Leathley, and C. F. Hughes, “Clinical practice variation,” Med. J. Aust., vol.
193, no. 8, pp. 97–99, 2010.
[2] D. M. a Francis, “Surgical decision making,” ANZ J. Surg., vol. 79, pp. 886–891, 2009.
[3] K. Pauley, R. Flin, S. Yule, and G. Youngson, “Surgeons’ intraoperative decision making and
risk management,” Am. J. Surg., vol. 202, no. 4, pp. 375–381, 2011.
[4] R. Flin, G. Youngson, and S. Yule, “How do surgeons make intraoperative decisions?,” Qual.
Saf. Health Care, vol. 16, pp. 235–239, 2007.
[5] S. M. Cristancho, M. Vanstone, L. Lingard, M. E. Lebel, and M. Ott, “When surgeons face
intraoperative challenges: A naturalistic model of surgical decision making,” Am. J. Surg., vol. 205, no.
2, pp. 156–162, 2013.
[6] Center for the Evaluative Clinical Sciences, “Preference-Sensitive Care,” A Dartmouth Atlas
Proj. Top. Br., no. 603, 2007.
[7] S. Jones, S. Registrar, and S. A. Dewi, “Demand and variation in elective surgical procedures,”
2010.
[8] D. C. Goodman, Variation in the Care of Surgical Conditions: A Dartmouth Atlas of Health Care
Series. Dartmouth Institute for Health Policy & Clinical Practice, 2015.
[9] J. D. Birkmeyer, B. N. Reames, P. McCulloch, A. J. Carr, W. B. Campbell, and J. E. Wennberg,
“Understanding of regional variation in the use of surgery,” Lancet, vol. 382, no. 9898, pp. 1121–1129,
2013.
[10] J. D. Birkmeyer, S. M. Sharp, S. R. Finlayson, E. S. Fisher, and J. E. Wennberg, “Variation
profiles of common surgical procedures.,” Surgery, vol. 124, pp. 917–923, 1998.
[11] M. A. Gilligan, J. Neuner, R. Sparapani, P. W. Laud, and A. B. Nattinger, “Surgeon
characteristics and variations in treatment for early-stage breast cancer.,” Arch. Surg., vol. 142, pp. 17–
22, 2007.
[12] H. M. a Kaafarani, “Surgeon preference and variation of surgical care,” Am. J. Surg., vol. 201,
pp. 702–704, 2011.
[13] F. M. Hajjaj, M. S. Salek, M. K. A. Basra, and A. Y. Finlay, “Non-clinical influences on clinical
decision-making: a major challenge to evidence-based practice.,” J. R. Soc. Med., vol. 103, no. 5, pp.
178–87, May 2010.
[14] “Cholecystectomy - Online Medical Encyclopedia - University of Rochester Medical Center.”
[Online]. Available:
https://www.urmc.rochester.edu/encyclopedia/content.aspx?ContentTypeID=92&ContentID=P07689.
[Accessed: 12-Sep-2015].
[15] K. S. Gurusamy and K. Samraj, “Early versus delayed laparoscopic cholecystectomy for acute
cholecystitis.,” Cochrane Database Syst. Rev., no. 4, p. CD005440, 2006.
[16] M. Zhou, X. Gu, J. Xiang, and Z. Chen, “Comparison of Clinical Safety and Outcomes of Early
versus Delayed Laparoscopic Cholecystectomy for Acute Cholecystitis : A Meta-Analysis,” Sci. World
J., vol. 2014, pp. 1–8, 2014.

68
[17] S. M. Strasberg, “Acute Calculous Cholecystitis,” N. Engl. J. Med., vol. 359, no. 3, pp. 325–325,
2008.
[18] V. Halpin, “Acute cholecystitis,” Clin. Evid. (Online)., pp. 1–24, 2014.
[19] M. G. Gu, T. N. Kim, J. Song, Y. J. Nam, J. Y. Lee, and J. S. Park, “Risk Factors and Therapeutic
Outcomes of Acute Acalculous Cholecystitis,” Digestion, vol. 90, no. 2, pp. 75–80, 2014.
[20] “Acute cholecystitis: MedlinePlus Medical Encyclopedia.” [Online]. Available:
https://www.nlm.nih.gov/medlineplus/ency/article/000264.htm. [Accessed: 21-Oct-2015].
[21] M. G. Toneto, C. C. Mohr, and M. H. I. Lopes, “Das grandes incisões cirúrgicas à colecistectomia
laparoscópica : uma reflexão sobre o impacto de novas tecnologias,” Sci. Med. (Porto. Alegre)., vol. 17,
no. 1, pp. 31–35, 2007.
[22] W. Reynolds, “The First Laparoscopic Cholecystectomy,” JSLS J. Soc. Laparoendosc. Surg.,
vol. 5, no. 1, pp. 89–94, 2001.
[23] S. R. Eachempati, C. S. Cocanour, L. a. Dultz, U. R. Phatak, R. Albarado, and S. Rob Todd,
“Acute cholecystitis in the sick patient,” Curr. Probl. Surg., vol. 51, no. 11, pp. 441–466, 2014.
[24] J. M. Schiappa, “COLECISTECTOMIA LAPAROSCÓPICA 20 Anos Depois: Perspectivas e
Opções Actuais – uma visão pessoal – José,” Revista Portuguesa de Cardiologia, vol. 19, pp. 19–25,
2011.
[25] M. S. Kim, H.-J. Kwon, H. W. Park, J. Y. Park, E.-C. Chung, H.-J. Park, H. J. Kwag, and H. P.
Hong, “Preoperative Prediction Model for Conversion of Laparoscopic to Open Cholecystectomy in
Patient With Acute Cholecystitis: Based on Clinical, Laboratory, and CT Parameters.,” J. Comput. Assist.
Tomogr., vol. 105, no. 5, pp. 727–732, 2014.
[26] E. B. Sneider, J. Lewis, A. Friedrich, K. Baratta, M. Whitman, Y. Li, M. Biswas, D. E. M. Litwin,
and M. A. Cahan, “Timing and Choice of Intervention Influences Outcome in Acute Cholecystitis : A
Prospective Study,” Surg. Laparosc. Endosc. Percutan. Tech., vol. 24, no. 5, pp. 414–419, 2014.
[27] “Cholecystostomy.” [Online]. Available:
http://www.lookfordiagnosis.com/mesh_info.php?term=Cholecystostomy&lang=1. [Accessed: 13-Sep-
2015].
[28] W. Hartwig and M. W. Büchler, “Acute Cholecystitis Early Versus Delayed Surgery,” Adv. Surg.,
vol. 48, no. 1, pp. 155–164, 2014.
[29] A. Venara, V. Carretier, J. Lebigot, and E. Lermite, “Technique and indications of percutaneous
cholecystostomy in the management of cholecystitis in 2014,” J. Visc. Surg., vol. 151, no. 6, pp. 435–
439, 2014.
[30] C. H. M. Tan, T. C. Y. Pang, W. W. L. Woon, J. K. Low, and S. P. Junnarkar, “Analysis of actual
healthcare costs of early versus interval cholecystectomy in acute cholecystitis,” J. Hepatobiliary.
Pancreat. Sci., vol. 22, no. 3, pp. 237–243, 2015.
[31] H. Lau, C. Y. Lo, N. G. Patil, and W. K. Yuen, “Early versus delayed-interval laparoscopic
cholecystectomy for acute cholecystitis: A metaanalysis,” Surg. Endosc. Other Interv. Tech., vol. 20, no.
1, pp. 82–87, 2006.
[32] Y. Yamashita, T. Takada, Y. Kawarada, Y. Nimura, M. Hirota, F. Miura, T. Mayumi, M. Yoshida,
S. Strasberg, H. a. Pitt, E. de Santibanes, J. Belghiti, M. W. Büchler, D. J. Gouma, S. T. Fan, S. C.
69
Hilvano, J. W. Y. Lau, S. W. Kim, G. Belli, J. a. Windsor, K. H. Liau, and V. Sachakul, “Surgical treatment
of patients with acute cholecystitis: Tokyo guidelines,” J. Hepatobiliary. Pancreat. Surg., vol. 14, no. 1,
pp. 91–97, 2007.
[33] M. Yokoe, T. Takada, S. M. Strasberg, J. S. Solomkin, T. Mayumi, H. Gomi, H. a. Pitt, O. J.
Garden, S. Kiriyama, J. Hata, T. Gabata, M. Yoshida, F. Miura, K. Okamoto, T. Tsuyuguchi, T. Itoi, Y.
Yamashita, C. Dervenis, A. C. W. Chan, W. Y. Lau, A. N. Supe, G. Belli, S. C. Hilvano, K. H. Liau, M.
H. Kim, S. W. Kim, and C. G. Ker, “TG13 diagnostic criteria and severity grading of acute cholecystitis
(with videos),” J. Hepatobiliary. Pancreat. Sci., vol. 20, no. 1, pp. 35–46, 2013.
[34] J. I. González-Muñoz, M. Angoso, J. M. Sayagués, A. B. Sánchez-Casado, A. Hernández, A.
Velasco, and L. Muñoz-Bellvis, “Improving the outcome of acute cholecystitis: the non-standardized
treatment must no longer be employed,” Langenbeck’s Arch. Surg., vol. 399, no. 8, pp. 1065–1070,
2014.
[35] C. J. Dy, S. Lyman, C. Boutin-Foster, K. Felix, Y. Kang, and M. L. Parks, “Do Patient Race and
Sex Change Surgeon Recommendations for TKA?,” Clin. Orthop. Relat. Res., vol. 473, no. 2, pp. 410–
417, 2014.
[36] M. G. Vitale, J. a. Gomez, H. Matsumoto, D. P. Roye, R. R. Betz, R. M. Campbell, J. B. Emans,
J. M. Flynn, N. Ramirez-Lluch, B. Snyder, P. F. Sturm, K. M. Song, J. T. Smith, and J. S. Shilt, “Variability
of expert opinion in treatment of early-onset scoliosis,” Clin. Orthop. Relat. Res., vol. 469, pp. 1317–
1322, 2011.
[37] L. D. Phillips and C. a. Bana E Costa, “Transparent prioritisation, budgeting and resource
allocation with multi-criteria decision analysis and decision conferencing,” Ann. Oper. Res., vol. 154, no.
1, pp. 51–68, 2007.
[38] F. Mussen, S. Salek, and S. Walker, Benefit-Risk Appraisal of Medicines: A systematic
approach to decision-making. John Wiley & Sons, 2009.
[39] G. Adunlin, V. Diaby, and H. Xiao, “Application of multicriteria decision analysis in health care:
a systematic review and bibliometric analysis,” Heal. Expect., p. n/a–n/a, 2014.
[40] C. a. Bana e Costa and J. C. Vansnick, “A critical analysis of the eigenvalue method used to
derive priorities in AHP,” Eur. J. Oper. Res., vol. 187, no. 3, pp. 1422–1428, 2008.
[41] C. a. Bana e Costa, J.-M. De Corte, and J.-C. Vansnick, “Macbeth,” Work. Pap. LSEOR, pp. 1–
40, 2003.
[42] C. a. Bana E Costa, M. C. Carnero, and M. D. Oliveira, “A multi-criteria model for auditing a
Predictive Maintenance Programme,” Eur. J. Oper. Res., vol. 217, no. 2, pp. 381–393, 2012.
[43] C. A. Bana e Costa, J. A. A. Ferreira, and É. C. Corrêa, “Metodologia Multicritério de Apoio à
Avaliação de Propostas em Concursos Públicos,” Casos de Aplicação da Investigação Operacional,
C.H. Antunes, L.V. Tavares (eds.), McGraw-Hill, Lisbon, pp. 336–363, 2000.
[44] M. D. Oliveira, T. C. Rodrigues, C. A. Bana e Costa, and A. B. De Sá, “Prioritizing health care
interventions: A multicriteria resource allocation model to inform the choice of community care
programmes,” in Advanced Decision Making Methods Applied to Health Care, vol. 173, E. Tànfani and
A. Testi, Eds. Milano: Springer Milan, 2012, pp. 141–154.

70
[45] D. F. Lopes, M. D. Oliveira, and C. a Bana e Costa, “Occupational health and safety: Designing
and building with MACBETH a value risk-matrix for evaluating health and safety risks,” J. Phys. Conf.
Ser., vol. 616, p. 012010, 2015.
[46] T. Cardoso, M. D. Oliveira, A. Barbosa-Póvoa, and S. Nickel, “Moving towards an equitable
long-term care network: A multi-objective and multi-period planning approach,” Omega, vol. 58, pp. 69–
85, 2016.
[47] P. Pinheiro, A. Castro, and M. Pinheiro, “A Multicriteria Model Applied in the Diagnosis of
Alzheimer’s Disease: A Bayesian Network.,” 11th IEEE Int. Conf. Comput. Sci. Eng., pp. 15–22, 2008.
[48] M. J. IJzerman, J. A. van Til, and J. F. P. Bridges, “A Comparison of Analytic Hierarchy Process
and Conjoint Analysis Methods in Assessing Treatment Alternatives for Stroke Rehabilitation,” Patient
Patient-Centered Outcomes Res., vol. 5, no. 1, pp. 45–56, Mar. 2012.
[49] J. Mingers and J. Brocklesby, “Multimethodology: Towards a framework for mixing
methodologies,” Omega, vol. 25, no. 5, pp. 489–509, 1997.
[50] C. A. Bana e Costa, J.-M. De Corte, J.-C. Vansnick, J. C. B. Costa, M. P. Chagas, É. C. Corrêa,
I. M. João, F. M. Lopes, J. C. Lourenço, and R. Sánchez-López, “M-MACBETH Version 2.4.0 User’s
Guide,” 2005.
[51] C. A. Bana e Costa and E. Beinat, “Estruturação de Modelos de Análise Multicritério de
Problemas de Decisão Pública,” Lisbon, 3, 2010.
[52] C. A. Bana e Costa and E. Beinat, “Model-structuring in public decision-aiding,” 2005.
[53] C. A. Bana e Costa, J. C. Lourenço, M. P. Chagas, and J. C. Bana e Costa, “Development of
reusable bid evaluation models for the Portugese Electric Transmission Company,” Decis. Anal., vol. 5,
no. 1, pp. 22–42, 2008.
[54] R. L. KEENEY, Value-Focused Thinking. Harvard University Press, 1996.
[55] A. Bowling, Research Methods in Health: Investigating Health and Health Services. Open
University Press, 1997.
[56] “Clavien-Dindo Classification.” [Online]. Available: http://www.surgicalcomplication.info/index-
2.html. [Accessed: 31-Aug-2015].
[57] “Decision conferencing.” [Online]. Available:
http://www.lawrencephillips.net/Decision_conferencing.html. [Accessed: 11-Oct-2015].
[58] R. Gelbard, E. Karamanos, P. G. Teixeira, E. Beale, P. Talving, K. Inaba, and D. Demetriades,
“Effect of delaying same-admission cholecystectomy on outcomes in patients with diabetes.,” Br. J.
Surg., vol. 101, no. 2, pp. 74–8, 2014.