explaining intergenerational income persistence jo blanden paul gregg lindsey macmillan family...
Post on 20-Dec-2015
220 views
TRANSCRIPT
Explaining intergenerational income persistence
Jo BlandenPaul Gregg
Lindsey Macmillan
Family Background and Child Development: The Emerging Story
CMPO/CASE 18th July 2006

Intergenerational Mobility in socio-economic circumstances
• Literature has mostly been concerned with measurement, i.e. the strength of the correlation between income across generations.
• More recently comparisons across countries and across time have begun to emerge
• 2 interesting findings:
– UK relatively immobile
– Mobility in UK has declined between 1958 and 1970 birth
cohorts
• But why?
Possible explanations
• Those characteristics influenced by parental income that lead to higher earnings in later life.
• Several avenues are suggested by the literature. • Physical Health (birth weight, obesity, childhood height
etc.)• Cognitive skills• Behavioural and Non-cognitive skills • Education• Labour market experience
Plan of the Paper
• Consider the routes through which income persists for the 1970 (BCS) cohort. The objective is to understand the level of persistence.
• Analysis is restricted to sons at this stage. • Make comparisons between the 1958 (NCDS) and 1970
cohorts in an attempt to understand why intergenerational transmissions have strengthened.

Modelling approach (1)
Measure intergenerational persistence,
ln lnchildren parentsi i iY Y
Part of this persistence will operate through a characteristic, say non-cognitive skill.
Non-cognitive skill is related to parental income.
iparents
ii YNoncog 11 ln
Non-cognitive skill has returns in the labour market
iichild
i uNoncogInY 11
Therefore )(ln
)ln,( 1parents
i
parentsii
YVar
YuCov

Modelling approach (2)
• Measure relationship between all mediating factors and family income.
• Measure returns to these characteristics in an earnings equations.
• Estimating sequential earnings equations enables the relationships between the mediating factors to be made clear.
iichild
i uExamNoncogInY 22 16
)(ln
)ln,( 2parents
i
parentsii
YVar
YuCov

Data – British Cohort Study (1)
• Parental income data available at ages 10 and 16, average these.
• Sons’ earnings at age 33. • Cognitive tests at age 5 and 10.• Mother reports on behaviour age 5.• Teacher reports on behaviour and self-reported
measures at age 10. • Detailed education information including exam results.• Work history records from age 30 enable the
construction of number of months unemployed and out of labour force.
Data – British Cohort Study (2)• Cognitive tests
– Age 5: copying and english picture vocab test– Age 10: reading, maths, British ability scale
• Non-cognitive measures– Mum, age 5: neurotic, anti-social– Teacher, age 10: application, clumsiness,
extroversion, hyper-activity, anxious.– Child, age 10: locus of control, self-confidence.– Child, age 16: malaise.
• All cognitive and non-cognitive measures are normalised to mean 0, standard deviation 1.
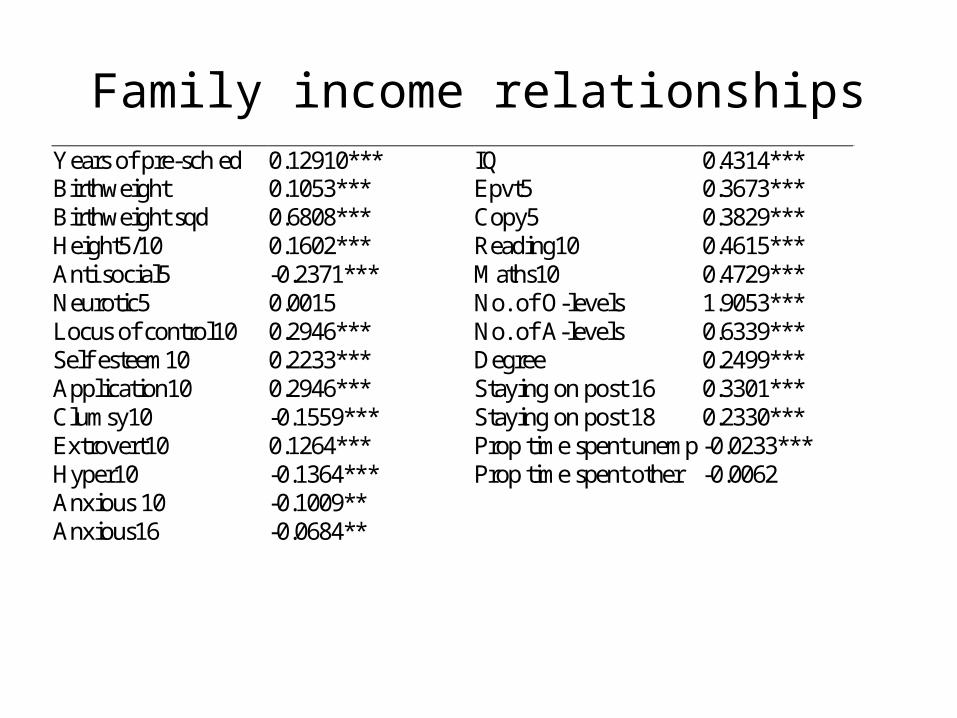
Family income relationshipsYears of pre-sch ed 0.12910*** IQ 0.4314*** Birthweight 0.1053*** Epvt5 0.3673*** Birthweight sqd 0.6808*** Copy5 0.3829*** Height5/10 0.1602*** Reading10 0.4615*** Anti social5 -0.2371*** Maths10 0.4729*** Neurotic5 0.0015 No. of O-levels 1.9053*** Locus of control10 0.2946*** No. of A-levels 0.6339*** Self esteem10 0.2233*** Degree 0.2499*** Application10 0.2946*** Staying on post 16 0.3301*** Clumsy10 -0.1559*** Staying on post 18 0.2330*** Extrovert10 0.1264*** Prop time spent unemp -0.0233*** Hyper10 -0.1364*** Prop time spent other -0.0062 Anxious 10 -0.1009** Anxious16 -0.0684**
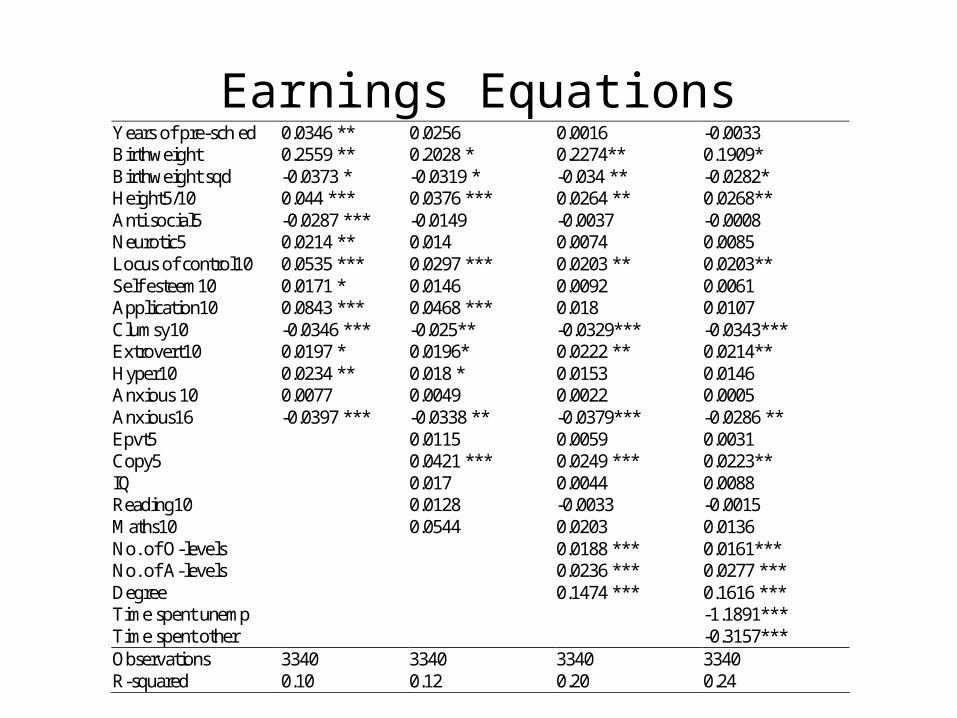
Earnings EquationsYears of pre-sch ed 0.0346 ** 0.0256 0.0016 -0.0033 Birthweight 0.2559 ** 0.2028 * 0.2274** 0.1909* Birthweight sqd -0.0373 * -0.0319 * -0.034 ** -0.0282* Height5/10 0.044 *** 0.0376 *** 0.0264 ** 0.0268** Anti social5 -0.0287 *** -0.0149 -0.0037 -0.0008 Neurotic5 0.0214 ** 0.014 0.0074 0.0085 Locus of control10 0.0535 *** 0.0297 *** 0.0203 ** 0.0203** Self esteem10 0.0171 * 0.0146 0.0092 0.0061 Application10 0.0843 *** 0.0468 *** 0.018 0.0107 Clumsy10 -0.0346 *** -0.025** -0.0329*** -0.0343*** Extrovert10 0.0197 * 0.0196* 0.0222 ** 0.0214** Hyper10 0.0234 ** 0.018 * 0.0153 0.0146 Anxious 10 0.0077 0.0049 0.0022 0.0005 Anxious16 -0.0397 *** -0.0338 ** -0.0379*** -0.0286 ** Epvt5 0.0115 0.0059 0.0031 Copy5 0.0421 *** 0.0249 *** 0.0223** IQ 0.017 0.0044 0.0088 Reading10 0.0128 -0.0033 -0.0015 Maths10 0.0544 0.0203 0.0136 No. of O-levels 0.0188 *** 0.0161*** No. of A-levels 0.0236 *** 0.0277 *** Degree 0.1474 *** 0.1616 *** Time spent unemp -1.1891*** Time spent other -0.3157*** Observations 3340 3340 3340 3340 R-squared 0.10 0.12 0.20 0.24
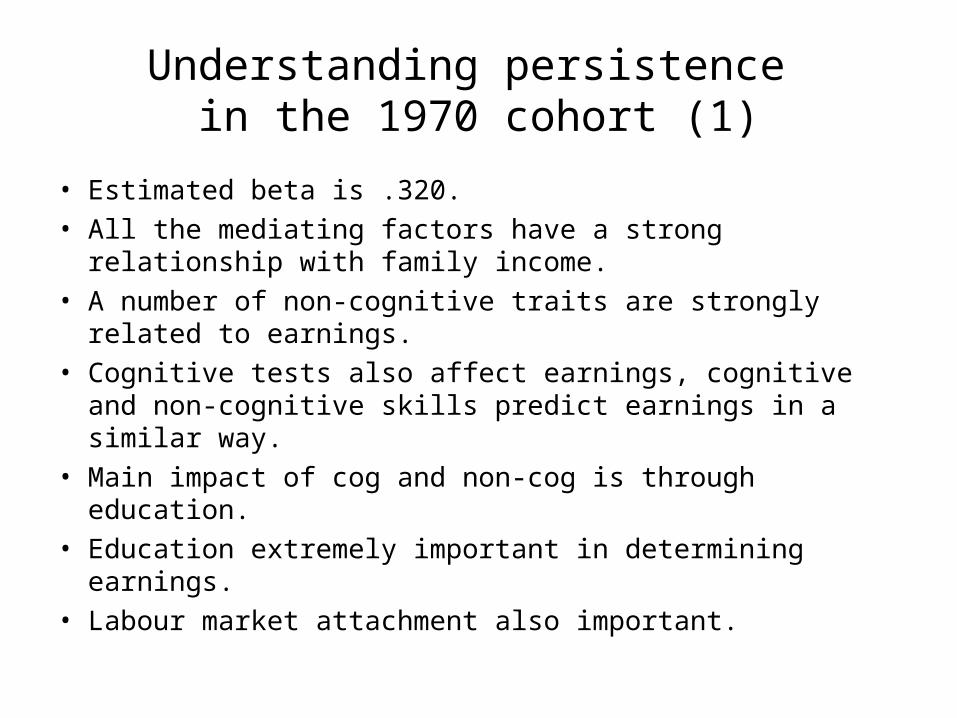
Understanding persistence in the 1970 cohort (1)
• Estimated beta is .320.• All the mediating factors have a strong relationship with
family income.• A number of non-cognitive traits are strongly related to
earnings.• Cognitive tests also affect earnings, cognitive and non-
cognitive skills predict earnings in a similar way. • Main impact of cog and non-cog is through education. • Education extremely important in determining earnings. • Labour market attachment also important.
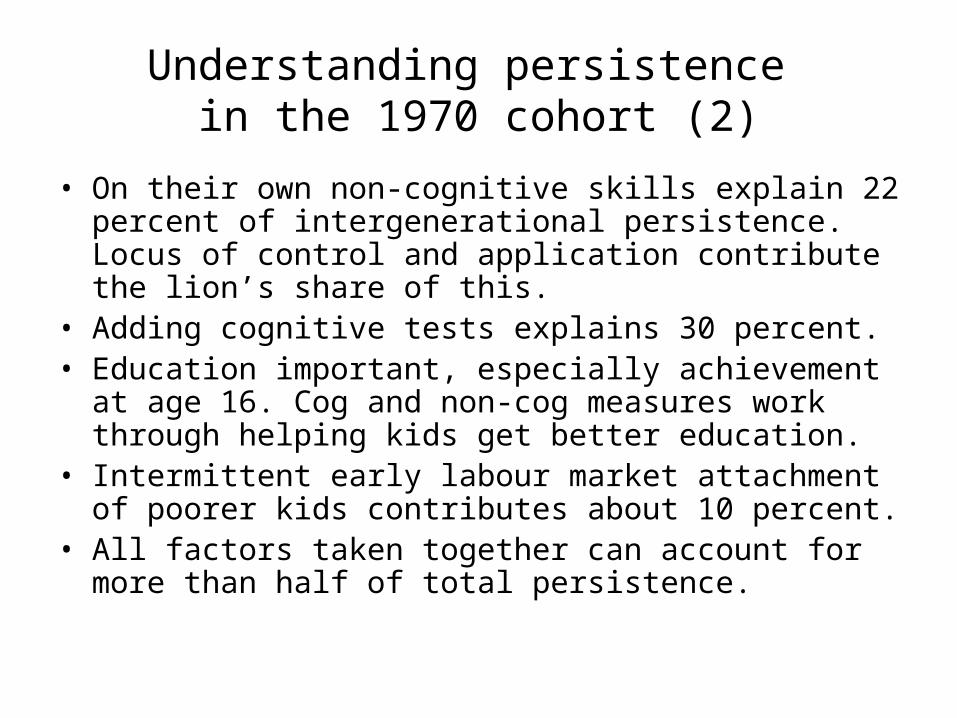
• On their own non-cognitive skills explain 22 percent of intergenerational persistence. Locus of control and application contribute the lion’s share of this.
• Adding cognitive tests explains 30 percent. • Education important, especially achievement at age 16.
Cog and non-cog measures work through helping kids get better education.
• Intermittent early labour market attachment of poorer kids contributes about 10 percent.
• All factors taken together can account for more than half of total persistence.
Understanding persistence in the 1970 cohort (2)
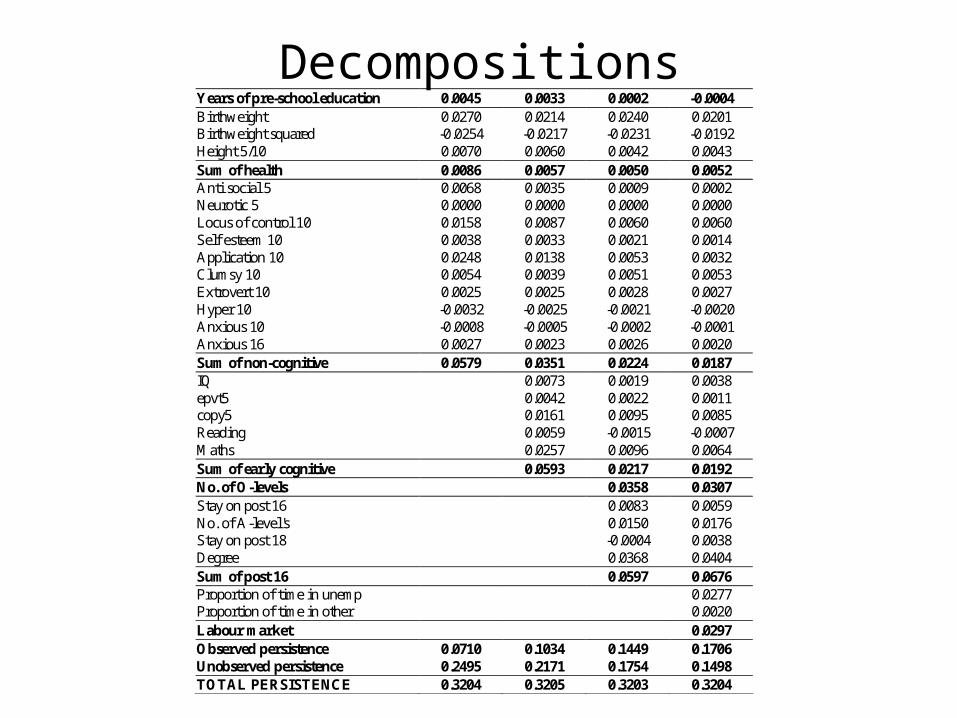
Decompositions
Years of pre-school education 0.0045 0.0033 0.0002 -0.0004 Birthweight 0.0270 0.0214 0.0240 0.0201 Birthweight squared -0.0254 -0.0217 -0.0231 -0.0192 Height 5/10 0.0070 0.0060 0.0042 0.0043 Sum of health 0.0086 0.0057 0.0050 0.0052 Anti social 5 0.0068 0.0035 0.0009 0.0002 Neurotic 5 0.0000 0.0000 0.0000 0.0000 Locus of control 10 0.0158 0.0087 0.0060 0.0060 Self esteem 10 0.0038 0.0033 0.0021 0.0014 Application 10 0.0248 0.0138 0.0053 0.0032 Clumsy 10 0.0054 0.0039 0.0051 0.0053 Extrovert 10 0.0025 0.0025 0.0028 0.0027 Hyper 10 -0.0032 -0.0025 -0.0021 -0.0020 Anxious 10 -0.0008 -0.0005 -0.0002 -0.0001 Anxious 16 0.0027 0.0023 0.0026 0.0020 Sum of non-cognitive 0.0579 0.0351 0.0224 0.0187 IQ 0.0073 0.0019 0.0038 epvt5 0.0042 0.0022 0.0011 copy5 0.0161 0.0095 0.0085 Reading 0.0059 -0.0015 -0.0007 Maths 0.0257 0.0096 0.0064 Sum of early cognitive 0.0593 0.0217 0.0192 No. of O-levels 0.0358 0.0307 Stay on post 16 0.0083 0.0059 No. of A-level's 0.0150 0.0176 Stay on post 18 -0.0004 0.0038 Degree 0.0368 0.0404 Sum of post 16 0.0597 0.0676 Proportion of time in unemp 0.0277 Proportion of time in other 0.0020 Labour market 0.0297 Observed persistence 0.0710 0.1034 0.1449 0.1706 Unobserved persistence 0.2495 0.2171 0.1754 0.1498 TOTAL PERSISTENCE 0.3204 0.3205 0.3203 0.3204

Decompositions
-20%
0%
20%
40%
60%
80%
100%
1 2 3 4
Early years education Health Non-cognitive Early cognitive scores
No. of O-levels Post 16 education Labour market attachment Unobserved
Data – Cross cohort comparison• Income is only available at age 16 in NCDS. Earnings are
from age 33. • Cognitive tests for reading, maths and general ability at 11,
similar to BCS.• Non-cognitive tests are different between the cohorts, use
Bristol social adjustment scales for NCDS. – unforthcoming, withdrawn, depressed, anxious for
acceptance adults, hostile to adults, ‘writing off’ adults, anxious for acceptance kids, hostility to kids, restless, inconsequential behaviour, misc.
• For both cohorts mother reports generate two measures from rutter scales at age 10, internalising and externalising.
• Concerns about attrition and non-response in both cohorts, no evidence that this is responsible for cross-cohort differences.
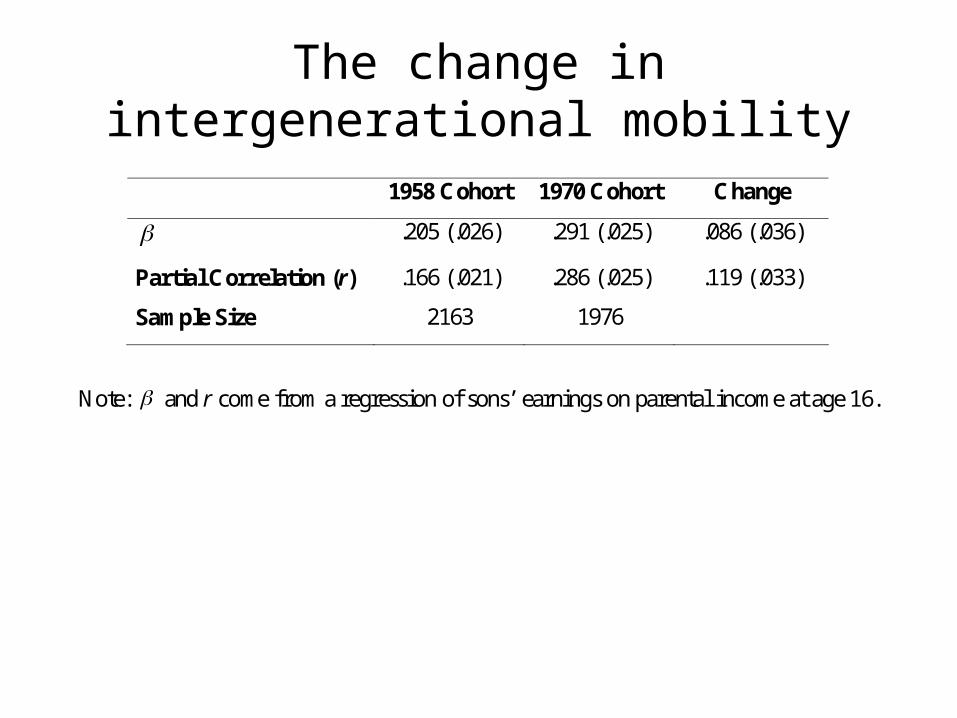
The change in intergenerational mobility
1958 Cohort 1970 Cohort Change
.205 (.026) .291 (.025) .086 (.036)
Partial Correlation (r) .166 (.021) .286 (.025) .119 (.033)
Sample Size 2163 1976
Note: and r come from a regression of sons’ earnings on parental income at age 16.
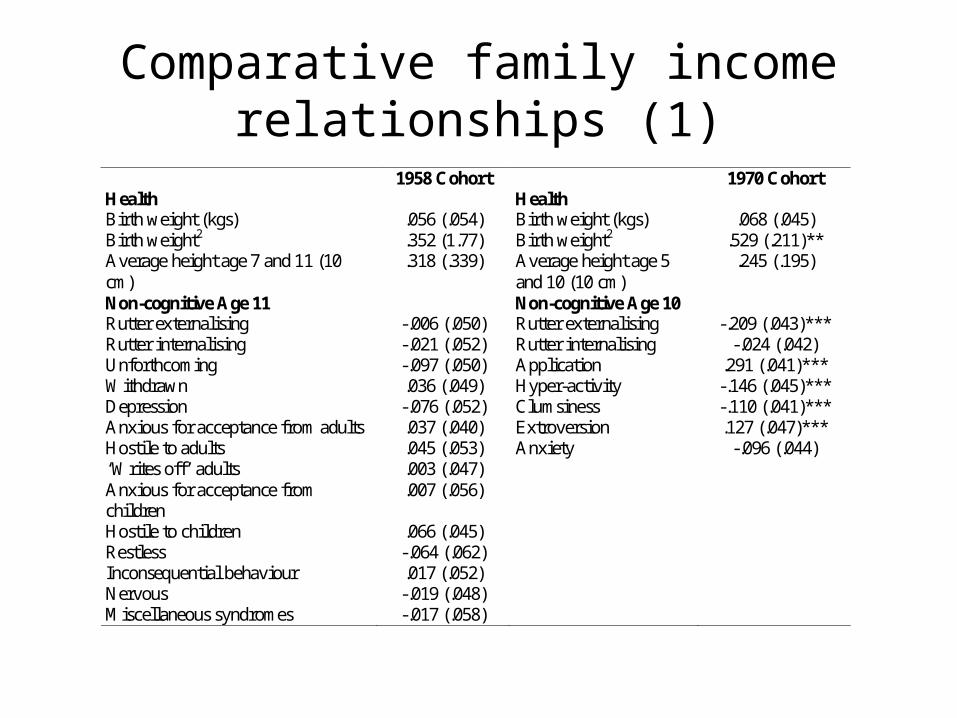
Comparative family income relationships (1)
1958 Cohort 1970 Cohort Health Health Birth weight (kgs) .056 (.054) Birth weight (kgs) .068 (.045) Birth weight2 .352 (1.77) Birth weight2 .529 (.211)** Average height age 7 and 11 (10 cm)
.318 (.339) Average height age 5 and 10 (10 cm)
.245 (.195)
Non-cognitive Age 11 Non-cognitive Age 10 Rutter externalising -.006 (.050) Rutter externalising -.209 (.043)*** Rutter internalising -.021 (.052) Rutter internalising -.024 (.042) Unforthcoming -.097 (.050) Application .291 (.041)*** Withdrawn .036 (.049) Hyper-activity -.146 (.045)*** Depression -.076 (.052) Clumsiness -.110 (.041)*** Anxious for acceptance from adults .037 (.040) Extroversion .127 (.047)*** Hostile to adults .045 (.053) Anxiety -.096 (.044) ‘Writes off’ adults .003 (.047) Anxious for acceptance from children
.007 (.056)
Hostile to children .066 (.045) Restless -.064 (.062) Inconsequential behaviour .017 (.052) Nervous -.019 (.048) Miscellaneous syndromes -.017 (.058)
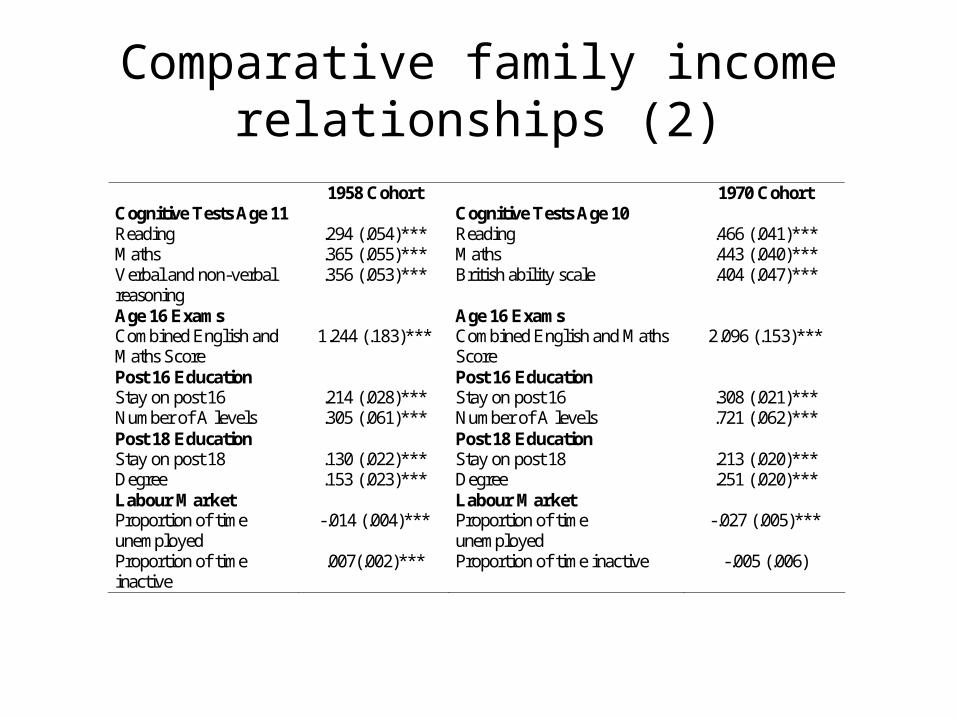
Comparative family income relationships (2)
1958 Cohort 1970 Cohort Cognitive Tests Age 11 Cognitive Tests Age 10 Reading .294 (.054)*** Reading .466 (.041)*** Maths .365 (.055)*** Maths .443 (.040)*** Verbal and non-verbal reasoning
.356 (.053)*** British ability scale .404 (.047)***
Age 16 Exams Age 16 Exams Combined English and Maths Score
1.244 (.183)*** Combined English and Maths Score
2.096 (.153)***
Post 16 Education Post 16 Education Stay on post 16 .214 (.028)*** Stay on post 16 .308 (.021)*** Number of A levels .305 (.061)*** Number of A levels .721 (.062)*** Post 18 Education Post 18 Education Stay on post 18 .130 (.022)*** Stay on post 18 .213 (.020)*** Degree .153 (.023)*** Degree .251 (.020)*** Labour Market Labour Market Proportion of time unemployed
-.014 (.004)*** Proportion of time unemployed
-.027 (.005)***
Proportion of time inactive
.007(.002)*** Proportion of time inactive -.005 (.006)
Comparative analysis
• Stronger relationships in the second cohort between family income and non-cognitive skills, education and unemployment.
• Not much change for cognitive ability.• Suggests possible explanations for the rise in
persistence. • How traits impact on intergenerational mobility
depends also on their changing returns in the labour market. Results mixed on this.
• To see how changes affect intergenerational mobility need to look at decompositions.
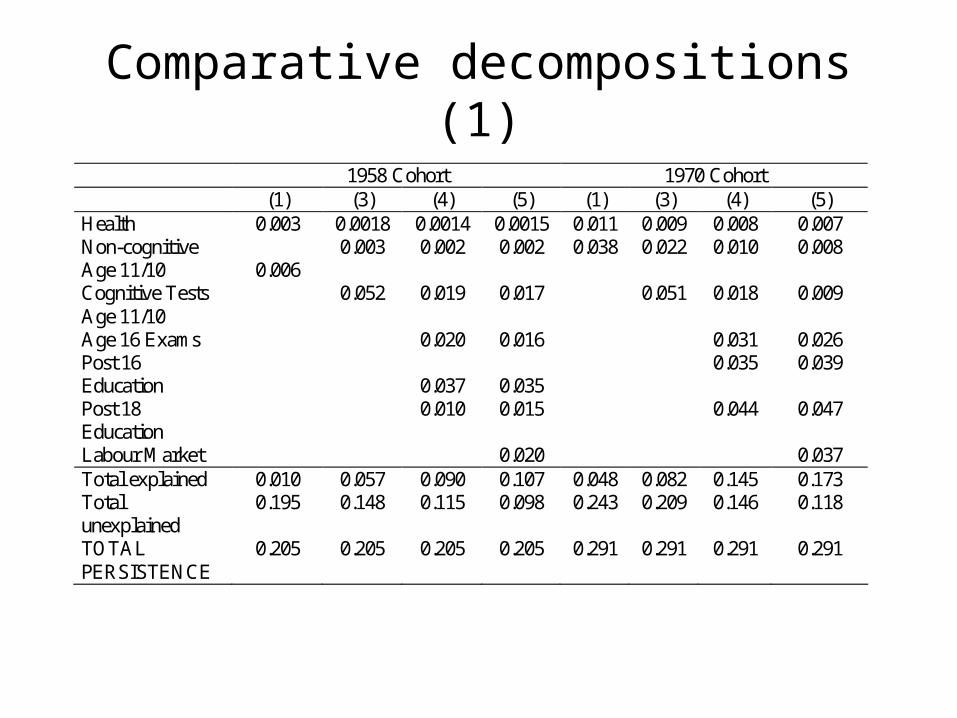
Comparative decompositions (1)
1958 Cohort 1970 Cohort (1) (3) (4) (5) (1) (3) (4) (5) Health 0.003 0.0018 0.0014 0.0015 0.011 0.009 0.008 0.007 Non-cognitive Age 11/10 0.006
0.003 0.002 0.002 0.038 0.022 0.010 0.008
Cognitive Tests Age 11/10
0.052 0.019 0.017 0.051 0.018 0.009
Age 16 Exams 0.020 0.016 0.031 0.026 Post 16 Education
0.037 0.035
0.035 0.039
Post 18 Education
0.010 0.015 0.044 0.047
Labour Market 0.020 0.037 Total explained 0.010 0.057 0.090 0.107 0.048 0.082 0.145 0.173 Total unexplained
0.195 0.148 0.115 0.098 0.243 0.209 0.146 0.118
TOTAL PERSISTENCE
0.205 0.205 0.205 0.205 0.291 0.291 0.291 0.291
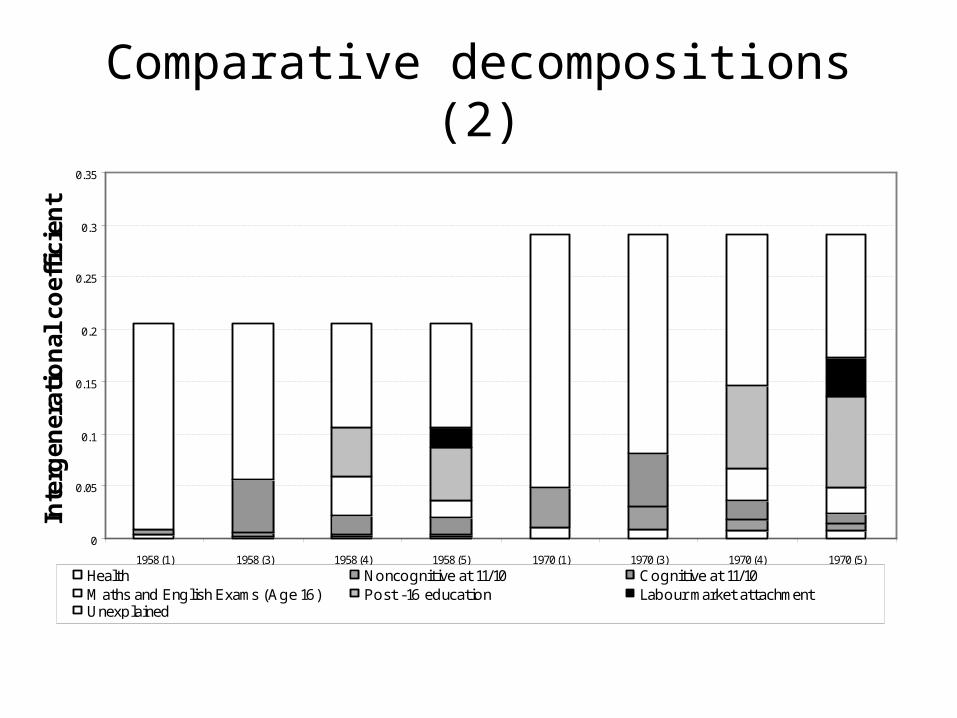
Comparative decompositions (2)
0
0.05
0.1
0.15
0.2
0.25
0.3
0.35
1958 (1) 1958 (3) 1958 (4) 1958 (5) 1970 (1) 1970 (3) 1970 (4) 1970 (5)
Inte
rgen
erat
ion
al c
oef
fici
ent
Health Noncognitive at 11/10 Cognitive at 11/10Maths and English Exams (Age 16) Post -16 education Labour market attachment Unexplained
Findings from decompositions• Non-cognitive traits explain more of intergenerational
relationship in the second cohort, due to their stronger relationship with family income.
• Education is also more important for the same reason (some of this is explained by non-cog).
• The strengthened relationship between early unemployment and family income also has a role to play in higher intergenerational persistence.
• Can explain .066 of the .086 rise in the intergenerational coefficient. 3/4 of the change.

Policy implications
• Fall in mobility is explained by growing relationship between family income and non-cognitive skills, education and early unemployment.
• Not due to IQ or cognitive skills.• 3 possible policy routes• Close gap in non-cognitive skills (especially personal
efficacy and concentration).• Educational performance at age 16 and beyond.
• Help in early career (policies to avoid NEET).