explaining gender disparity in child health in haryana ... · pdf fileher recent research work...
TRANSCRIPT
Explaining Gender Disparity in Child Health in Haryana State of India
Santosh Jatrana
ASIAN METACENTRE RESEARCH PAPER SERIES
no.16
ASIAN METACENTRE FOR POPULATION AND SUSTAINABLE DEVELOPMENT ANALYSIS
HEADQUARTERS AT ASIA RESEARCH INSTITUTE NATIONAL UNIVERSITY of SINGAPORE
1
Santosh Jatrana is a postdoctoral fellow at Asian MetaCentre for Population and Sustainable Development Analysis, Singapore. She is a demographer with particular research interests in child survival, women’s health ands welfare issues, aging and health, HIV/AIDS, demography of ethnic minority population, gender issues and implementation of population policies and programs. She obtained her PhD in Demography from the Australian National University, Canberra, M.Phil in Population Studies and M.A. in Geography with specialization in Population Geography from Jawaharlal Nehru University, New Delhi. Her work experience in India and Australia covers a wide range of institutional set-ups including academic as well as governmental organisations. Her recent research work includes explaining gender disparity in child health in India and examining health issues of older adults in Singapore.
2
Abstract
he strong preference for sons over daughters and resulting discrimination against daughters in India is well known, though the preference is not uniformly observed across different regions of the country. India exhibits wide variations in
the degree of sons' preference, with strong son preference found in northern India than in the south. Using data from the ethnographic survey carried out in Haryana State and the second National Family Health Survey (NFHS-2), this paper aims to update the documentation and examine patterns of gender disparities for children in Haryana state of North India in health outcomes. Specifically it addresses the following questions: Are there gender differences in child health status, disease incidence, and use of preventive and curative health care services? If so, does the extent of promale bias depend on socioeconomic status, caste, religion, education, rural/urban residence of the head of the household? The findings challenge the growing body of literature which suggests that girls in South Asia are discriminated against in the provision of health care but are not neglected in nutritional allocations.
T
3
Acknowledgements
n earlier version of this paper was presented in the session 133 Excess Female Mortality and Morbidity at the Annual Conference of Population Association of America held in Minnesota, May 2003. I am thankful to Elizabeth M.
Armstrong, the discussant of the session and the participants for providing valuable comments and suggestions. I would also like to acknowledge the financial support from the Asian MetaCentre to attend the conference. I also thank the editor and reviewer of the manuscript for their helpful comments.
A
4
List of Tables Table 1 Selected Indicators of Son Preference, Haryana and India, 1992-93 and
1998-99 Table 2 Neonatal, Postneonatal, Child and Under Five Mortality by Sex of the
Child in Haryana State, 1998-99 Table 3 Percentage of Children Under Age 3 Years According to Selected
Demographic and Socioeconomic Characteristics, Haryana, 1998-99 Table 4 Percentage of Children Aged 12-35 Months, by Source of Information
and Specific Vaccination, According to the Sex of the Child, Haryana, 1998-99
Table 5 Logistic Regression Analysis of Adequacy of Immunization for Children Aged 12-35 Months, by Selected Demographic and Socioeconomic Characteristics, Haryana, 1998-99
Table 6 Percentage of Children Under Age 3 Who Were Ill with Diarrhoea During the Two Weeks Preceding the Survey, and Who Were Not Treated for Diarrhoea, by Where They Were Treated, According to the Sex of the Child, Haryana, 1998-99
Table 7 Percentage of Children Under Age 3 Classified as Undernourished on Three Anthropometric Indices of Nutritional Status, According to the Sex of the Child, Haryana, 1998-99
Table 8 Summary Results from the Logistic Regression Analysis of the Low Weight-for-Age as a Function of Selected Explanatory Variables, Haryana, 1998-99
Table 9 Summary Results from the Logistic Regression Analysis of the Low Height-for-Age as a Function of Selected Explanatory Variables, Haryana, 1998-99
5
Background
n most populations, female mortality rates are lower than those for males at all ages (Hill and Upchurch, 1995: 129), apparently both because of males’ higher degree of biologically-based susceptibility to disease and because of a higher prevalence of
poor health habits and risky behaviour, especially among adolescent and adult men (Waldron, 1986). However, in many parts of South Asia with strong son preference attitudes, the situation is reversed with higher mortality for females particularly during the second half of the first year and childhood (Arnold 1997; D’Souza and Chen, 1980; Meegama, 1980). The evidence of an excess of female deaths in childhood is usually interpreted as the result of parental discrimination against daughters in the allocation of food (Behrman, 1988; Chen et al., 1981) and health care (Rahaman et al., 1982 ), neglect or even abuse of girls (Miller, 1981) and relative medical and nutritional neglect of the girl child (Das Gupta, 1987; Basu, 1989) within the household. It has also been postulated that where behaviour can be sufficiently powerful to influence outcome, there is consistent discrimination against female children in comparison to male children (Chen et al., 1981:66).
That parents in South Asia favour their sons is no longer controversial, however, the nature of this favour is a debatable issue. There is a growing body of literature which suggests that girls in South Asia are discriminated against in the provision of health care but are not neglected in nutritional allocations. For example, in studies of six Deccan villages surveyed by ICRISAT, Walker and Ryan (1990) find that more boys than girls of pre-school (1-6) and school age (7-12) were poorly nourished on a standard weight-for-age. In two studies of North and South Indian residents of a Delhi slum, Basu (1989, 1993) finds that, despite supposed greater discrimination against girls in Northern India, there was a higher incidence of severe malnutrition among boys in the North Indian sample. The converse was true in the South Indian sample. Indeed, North Indian girls had a slightly better diet than their brothers in the case of some choice foods such as fruit and eggs, although they fared a little worse in milk consumption. Numerous other studies (e.g., Chaudhury, 1987; Gopalan, 1987, Nutrition Foundation of India, 1988) suggest that nutritional imbalances are not a major part of gender inequalities in the region.
On the other hand, Singh, Gordon and Wyon (1962) find that girls in rural Punjab, India, receive less and worse medical care than boys in the treatment of fatal illness. Aziz (1977) finds that, of boys and girls who perish of illness in Bangladesh, girls are less likely to receive medical care. Chen, Huq and D’Souza (1981) find that, despite free treatment of diarrhoeal disease in a thana (sub-district administrative unit) in Bangladesh and equal incidence of diarrhoea among boys and girls, boys are more likely to be brought to the treatment centre. Summary of data from the NFHS (Kurz and Johnson-Welch, 1997) also suggest that boys are more likely to be immunised and receive health care at a medical facility.
The strong preference for sons over daughters and resulting discrimination against daughters in India is well known, though the preference is not uniformly observed across different regions of the country. India exhibits wide variations in the degree of sons' preference, with stronger son preference found in northern India than in the south (Dyson and Moore, 1983). A review of literature on this topic indicates that while the existing studies in India document the existence of sex bias,
I
6
detailed state level explorations into the extent, pattern and nature of gender disparity in various possible parameters of discrimination has not been undertaken. Most research of this type has been concentrated in Punjab state of India (Das Gupta, 1987).
This paper deals with Haryana state of North India. It examines patterns of gender disparities for children in health outcomes, including disease incidence, use of preventive and curative health care services and nutrition. The focus on health outcomes for children is mainly for the reason that these outcomes, such as child morbidity, are relatively less influenced by choices of the children themselves and potentially more indicative of differential treatment by their parents (and other adults) and hence may indicate more clearly one particular source of gender disparity. Specifically it addresses the following questions:
First, are boys more likely to have complete vaccination coverage than girls? Second, are girls more likely to suffer from diarrhoea? Are boys more likely to receive care for an episode of diarrhoea, and are they more likely to receive “better” care than girls? Third, are girls more likely to be malnourished than boys? If so, does the extent of pro-male bias depend on various socioeconomic and demographic factors?
A knowledge of levels and patterns of sex differentials in ill-health, malnutrition, and treatment is important for policy makers and programme managers to understand in order to (1) ensure equitable access to service utilisation and (2) avoid any adverse impact of a preference in a population. For example, a high level of son preference in countries with low level of fertility has resulted in a skewed sex ratio at birth because the women have access to methods of identifying the sex of foetuses and to induced abortions (Park and Cho, 1995). A skewed sex ratio, in turn, has worrisome implications for future population structure, the marriage and labour market, and personality development. In this regard, population policy needs to pay special attention to the possible consequences of high son preference that go beyond the retardation of fertility decline. This is particularly important in states like Haryana where the practice of sex-selective abortion is most widespread (Das Gupta and Mari Bhat, 1997: 312).
Sex discrimination in nutrition has implications for reproductive health. Some women face difficulties in carrying a pregnancy successfully to completion because of childhood discrimination (Royston and Armstrong, 1989). Failure to nourish girl children can limit their capacity for healthy motherhood through, for example stunting and a small pelvis, while a reluctance to provide medical care may compound these problems (World Health Organisation (WHO), 1998). If a pregnancy goes wrong, lack of obstetric care may be fatal and millions of women continue to face such risks every year (Thaddeus and Maine, 1991; Royston and Armstrong, 1989).
7
Why Haryana State?
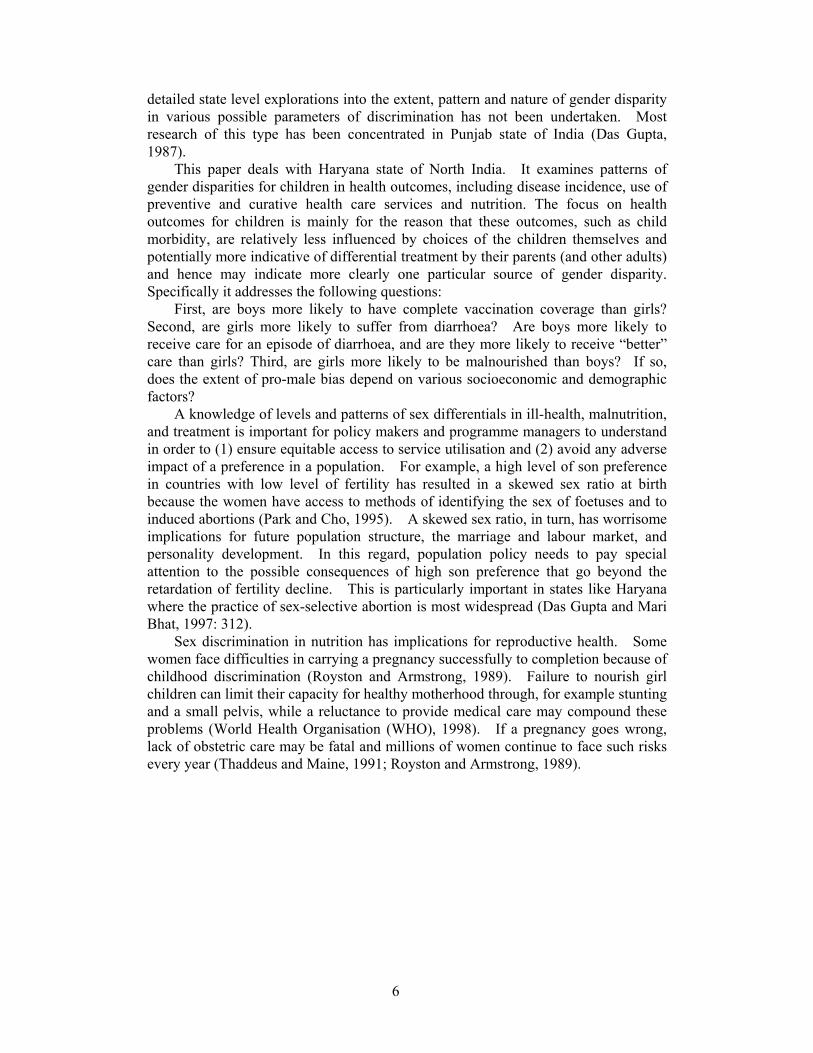
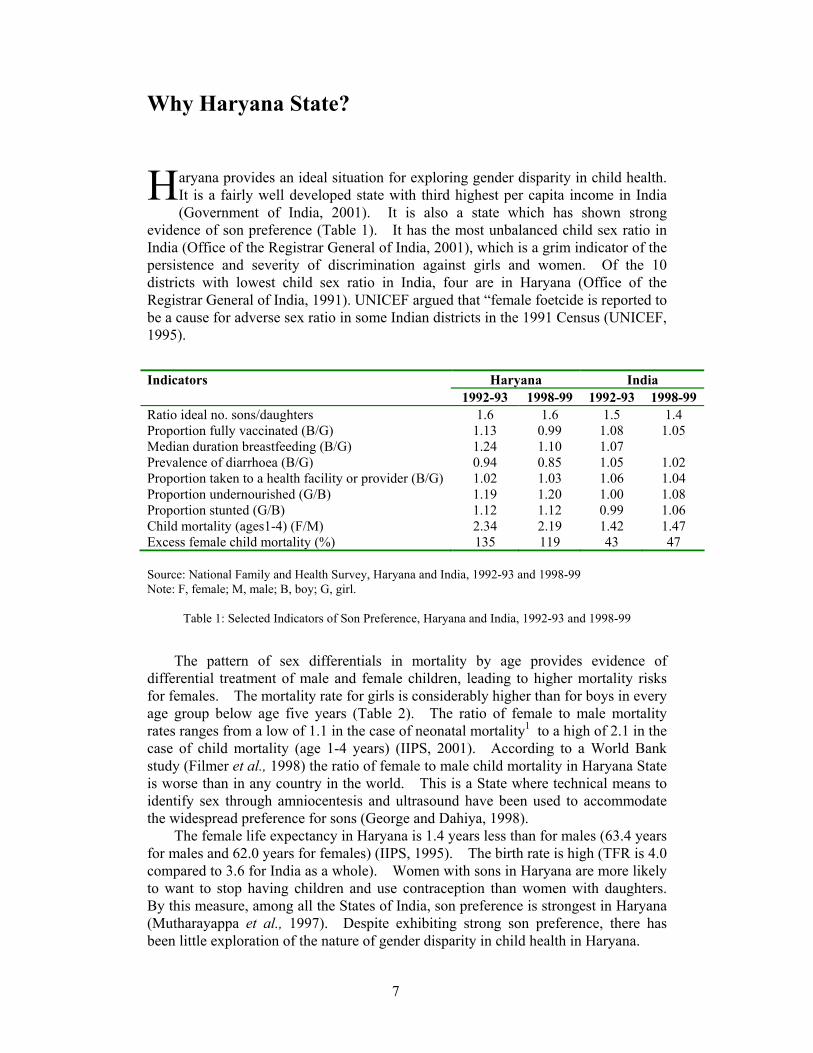
aryana provides an ideal situation for exploring gender disparity in child health. It is a fairly well developed state with third highest per capita income in India (Government of India, 2001). It is also a state which has shown strong
evidence of son preference (Table 1). It has the most unbalanced child sex ratio in India (Office of the Registrar General of India, 2001), which is a grim indicator of the persistence and severity of discrimination against girls and women. Of the 10 districts with lowest child sex ratio in India, four are in Haryana (Office of the Registrar General of India, 1991). UNICEF argued that “female foetcide is reported to be a cause for adverse sex ratio in some Indian districts in the 1991 Census (UNICEF, 1995).
Indicators Haryana India 1992-93 1998-99 1992-93 1998-99 Ratio ideal no. sons/daughters 1.6 1.6 1.5 1.4 Proportion fully vaccinated (B/G) 1.13 0.99 1.08 1.05 Median duration breastfeeding (B/G) 1.24 1.10 1.07 Prevalence of diarrhoea (B/G) 0.94 0.85 1.05 1.02 Proportion taken to a health facility or provider (B/G) 1.02 1.03 1.06 1.04 Proportion undernourished (G/B) 1.19 1.20 1.00 1.08 Proportion stunted (G/B) 1.12 1.12 0.99 1.06 Child mortality (ages1-4) (F/M) 2.34 2.19 1.42 1.47 Excess female child mortality (%) 135 119 43 47 Source: National Family and Health Survey, Haryana and India, 1992-93 and 1998-99 Note: F, female; M, male; B, boy; G, girl.
Table 1: Selected Indicators of Son Preference, Haryana and India, 1992-93 and 1998-99
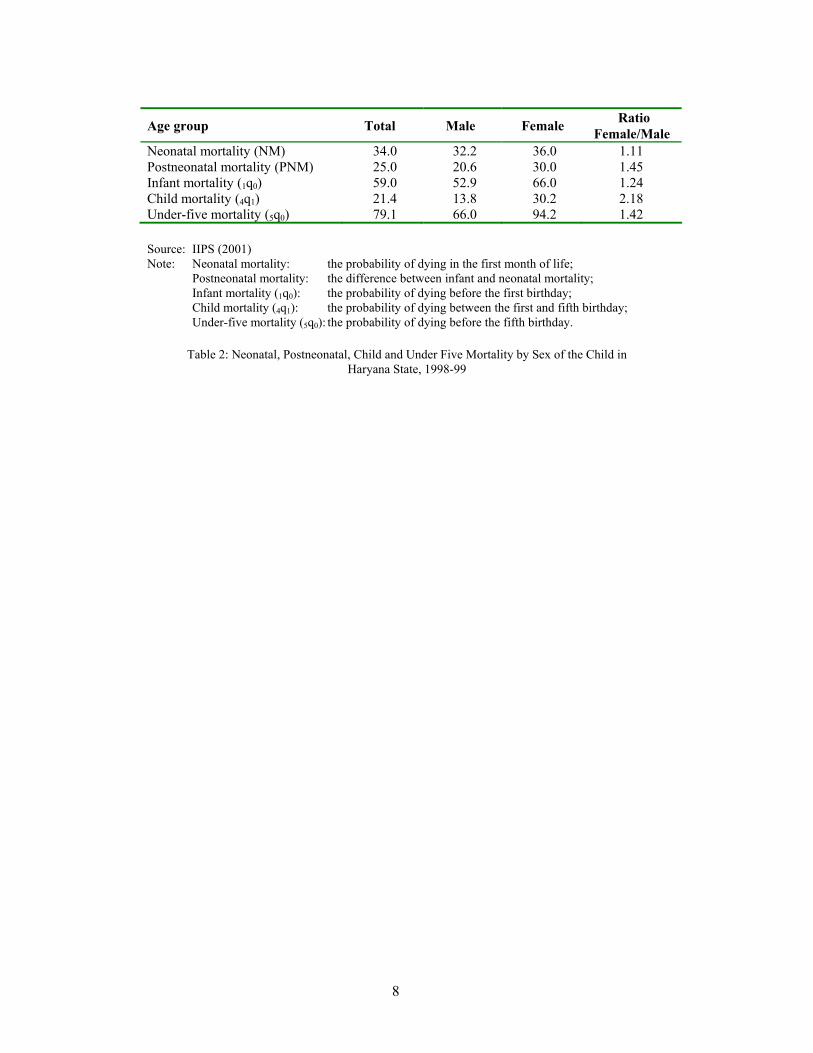
The pattern of sex differentials in mortality by age provides evidence of differential treatment of male and female children, leading to higher mortality risks for females. The mortality rate for girls is considerably higher than for boys in every age group below age five years (Table 2). The ratio of female to male mortality rates ranges from a low of 1.1 in the case of neonatal mortality1 to a high of 2.1 in the case of child mortality (age 1-4 years) (IIPS, 2001). According to a World Bank study (Filmer et al., 1998) the ratio of female to male child mortality in Haryana State is worse than in any country in the world. This is a State where technical means to identify sex through amniocentesis and ultrasound have been used to accommodate the widespread preference for sons (George and Dahiya, 1998).
The female life expectancy in Haryana is 1.4 years less than for males (63.4 years for males and 62.0 years for females) (IIPS, 1995). The birth rate is high (TFR is 4.0 compared to 3.6 for India as a whole). Women with sons in Haryana are more likely to want to stop having children and use contraception than women with daughters. By this measure, among all the States of India, son preference is strongest in Haryana (Mutharayappa et al., 1997). Despite exhibiting strong son preference, there has been little exploration of the nature of gender disparity in child health in Haryana.
H
8
Age group Total Male Female Ratio Female/Male
Neonatal mortality (NM) 34.0 32.2 36.0 1.11 Postneonatal mortality (PNM) 25.0 20.6 30.0 1.45 Infant mortality (1q0) 59.0 52.9 66.0 1.24 Child mortality (4q1) 21.4 13.8 30.2 2.18 Under-five mortality (5q0) 79.1 66.0 94.2 1.42 Source: IIPS (2001) Note: Neonatal mortality: the probability of dying in the first month of life; Postneonatal mortality: the difference between infant and neonatal mortality; Infant mortality (1q0): the probability of dying before the first birthday; Child mortality (4q1): the probability of dying between the first and fifth birthday; Under-five mortality (5q0): the probability of dying before the fifth birthday.
Table 2: Neonatal, Postneonatal, Child and Under Five Mortality by Sex of the Child in Haryana State, 1998-99
9
Data
he data for this research are mainly drawn from the second National Family and Health Survey (NFHS-2), undertaken in 1998-99. But the quantitative results are supported by qualitative information obtained during a field survey (called
Mewat, 1996) conducted between April 1996 and February 1997 of factors affecting infant and child survival in Mewat region of Haryana State as part of PhD field work at Australian National University. The qualitative data comprised of in-depth interviews with key functionaries, informal interviews with women and participant observation.
The quantitative analysis gives an understanding of the relationship between dependent and independent variables, thus establishing the overall patterns and correlates of gender disparity. The qualitative information provides a clear insight into the social dynamics and processes by which these independent variables themselves are influenced. For example, while quantitative data establish the link between gender disparity in child health outcomes, qualitative information explores why in Haryana a significant proportion of female children are discriminated against. The role of qualitative data in this study was to provide not statistically generalisable information, but rather information that could expose the attitudes, opinions and belief patterns underlying factors affecting gender disparity.
The NFHS-2 is a nationally representative survey, first of its kind, which was conducted in 26 Indian States using a format very similar to that of the Demographic and Health Surveys (DHS), modified to meet Indian conditions and the needs of policy makers and programme planners. The survey covered a representative sample of more than 90,000 ever-married women age 15-49. In Haryana, NFHS-2 collected information from 2,908 eligible women. The analyses for this paper are based on data from a sub sample of 994 children born to eligible women in the three years preceding the surveys and who were alive at the time of survey. The NFHS-2 provides high-quality, up-to-date information on all of the key variables required for the analysis. It has collected extensive information on child health indicators such as immunisation coverage; prevalence and treatment of diarrhoea among children; and anthropometric indicators of nutritional status for children born three year preceding the survey—all of which can be examined by sex of child. Compared with previously available data, the survey permits substantial expansion of the examination of gender differences in child health practices.
Because this analysis uses information about children alive at the time of survey, addressing the question of censoring is very important; that is, children who died before the survey will be excluded from the analysis. If excess female mortality were high enough, this would imply a bias in the sample towards including surviving girls for those families that do not discriminate against girls, thus to some extent invalidating any analysis of differential treatment. However, an examination of the sex ratios in the sample, when children who have died are included or excluded, shows that they are not significantly different from each other2, suggesting that the selectivity bias of the sample should be negligible. Another point to note about the sample used in the analysis is that all children born three years preceding the survey were included; in other words, if a woman gave birth to two children in this time period, both the children were included in the subsample.
T
10
One important limitation of this study is the small number of cases on which the analyses are based. The present study focuses on child health among alive children below three years of age in Haryana state. Only 994 cases met the criteria. This limitation might have an effect on the analysis; in particular, the small number of cases will limit the statistical methods to be used. This is particularly important in the analyses of the morbidity data on the occurrence and treatment of diarrhoea when only 136 children were reported as having diarrhoea during the two weeks preceding the survey. Even with a short recall period of two weeks, and extensive training of interviewers, the chances of underreporting or mis-reporting cannot be discounted. Over-reporting, on the other hand, is unlikely, so that measures have an inherent negative bias. In addition, since all children who met the criteria were included in the analyses, some characteristics of women and their husbands may be duplicated if they had more than one child. However, the number of children who falls in such groups is quite small, and thus will not have a significant effect on variables under study.
Secondly, the validity of anthropometric indices is determined by many factors, including the coverage of the population of children and accuracy of the anthropometric measurements. The NFHS-2 was not able to measure the height and weight of all eligible children, usually because the child was not at home at the time of the health investigator’s visit or because the mother refused to allow the child to be weighed and measured. In Haryana, NFHS-2 failed to measure 4 percent of children under age three, a much lower nonresponse rate than the national rate of 13 percent (IIPS, 2001). Moreover, weight-for-age and height-for-age indices are sensitive to misreporting of children’s ages, including heaping on preferred digits. This problem was well known before NFHS-2 began; therefore, interviewer training stressed this issue to try to reduce the extent of biases due to misreporting. Age reporting including the completeness of data on birth dates is exceptionally good in Haryana (IIPS, 2001).
11
Methods of Analysis
he data were analysed using two approaches. In the first part of the analysis, all indicators of gender disparity are measured either as percentages or as ratios—the estimates for girls divided by the estimates for boys. This level of analysis
simply examined the relationship between the sex of the child and health disparity indicator without taking into account other explanatory variables. Having established the detailed patterns of gender disparity, I move on to my second level of analysis. In this section we estimate the effect of the sex of the child on the various outcomes of gender disparity, controlling for the demographic and socio-economic characteristics of women. Given the dichotomous nature of the dependent variable (0, 1), this is done using binary-logistic regression. For the analysis of completeness of immunization, the dependent variable was equal to 1 if the child is fully immunized and 0 otherwise. For the analysis of the undernourished children, the dependent variable was equal to 1 if the child’s z-score was below -2 standard deviation units (under-nourished child) and equal to 0 if a z-score falls above -2 standard deviation (well nourished child). Due to the small number of cases the effect of the sex of the child on the choice of a treatment alternative is not assessed in a regression model3.
Coefficients are estimated using the maximum likelihood method (MLM) of estimation. The independent variables are recoded into categorical indicator variables. One value of each variable is chosen to be the reference category. The reference category was the first category of the variable. For ease of interpretation, the results are discussed in terms of the odds ratios. The odds ratio is a measure that approximates how much more likely, (or unlikely) it is for the outcome, in this case, for example, being fully immunized, to be present among those with a given attribute relative to the reference category. The odds ratio for the reference category is equal to 1.0. If an odds ratio is greater than 1.0 this indicates an increased likelihood of the event occurring, while an odds ratio less than 1.0 indicates a decreased likelihood of its occurring. A variable was considered significantly associated with mortality when its p value was below 0.5.
T
12
Study Variables
he study variables are defined into two broad categories: dependent and explanatory variables. The dependent variable, health status of children, is expressed in terms of immunization status, prevalence and treatment of diarrhoea
and nutritional status, whereas sex of the child is considered as the explanatory variable. A set of demographic and socioeconomic variables are considered as control variables. These variables are defined below. Dependent variables Vaccinations: Immunisation against the major childhood diseases, tuberculosis, diphtheria, poliomyelitis, whooping cough and measles, can greatly enhance child survival (IIPS, 1995). To address the first question (Do boys receive better immunization coverage than girls?), immunization coverage for children aged 12-35 months is considered, and the question is asked whether boys are more likely than girls to be fully immunized. According to the Universal Immunization Programme that was introduced in 1985-86 in India and which was used in NFHS-2, children who at age one have received three vaccination doses of diphtheria, pertussis, and tetanus each, three doses of poliomyelitis vaccine, a dose of measles vaccine, and a dose of tuberculosis vaccine (BCG) are considered to be fully vaccinated. The NFHS-2 collected information from mothers on vaccination for each child born three years preceding the survey. Children aged 12-35 months old were chosen for the analysis because both international and Government of India (GOI) guidelines specify that children should be fully immunized by the time they complete their first year of life. The ratio of females to males with all vaccinations (i.e., BCG, measles, and three doses of DPT and polio vaccine) and with no vaccinations is used to indicate underlying gender discriminating behaviour that produces disparity in vaccination coverage. Logistic regression is used to model the effect of the sex of the child on the likelihood of having been fully immunized. Prevalence of diarrhoea and treatment: Diarrhoeal disease is one of the leading causes of death among infants and young children in India (Government of India (GOI), 1998). Prevalence of diarrhoea often reflects poor environmental conditions, including social, physical and biological, in which the child lives (Black, 1984; Black et al., 1984; Tomkins and Watson, 1989; Briscoe et al., 1991). In this study, diarrhoea is defined as the proportion of children who experienced diarrhoea in the two weeks preceding the survey. In NFHS-2, mothers of children born during the three years preceding the surveys were asked if their children suffered from diarrhoea during the two weeks preceding the survey, and if so, the type of treatment given. To address the second question (Are boys more likely to receive care for an episode of diarrhoea, and are they more likely to receive “better” care than girls?), first, the ratio of female to male in the incidence of these diseases is used to see whether actually contracting diseases is equally likely for both genders or whether it indicates gender disparity in the episode of diarrhoea. Secondly, the ratio of female versus males receiving "no treatment" when suffering from diarrhoea and receiving treatment
T
13
at a private health facility is used to see discrimination behaviour in treatment. The assumption is that in case of discrimination, a female versus a male child was more likely to have received “no treatment” when suffering from diarrhoea; and because private care costs more than that at public facilities, the stronger the preference for sons, the more likely that they will be taken to private versus public facilities. Anthropometrics among children: The NFHS-2 provides information on three summary indices of nutritional status: weight-for -age, height- for-age, and weight-for-height. Only weight-for-age and height-for age are used in the analyses. Weight-for-height is left out of the analysis due to the prevalence of low weight-for-height or wasting among the study population being very low (5.3 percent). These two indices of nutritional status are expressed in standard deviation units (z-score) from the median for the international reference population. Ratio of female to male children of 0-35 months of age is used to measure gender disparity in nutrition status4. For logistic regression analyses, the nutritional status variables (weight-for-age and height-for-age) which are continuous variables, were treated as dichotomous , with two values ‘well-nourished’ and ‘under-nourished’. In order to assess malnutrition, cut-off points need to be used to estimate the prevalence of anthropometric abnormality. The conventional cut-off point, which is applied in the present study, is -2 standard deviation units (z-score) from the median reference population. Children whose z-score falls below -2 standard deviation units are classified as under-nourished (coded 1) and those above -2 standard deviation as well nourished (coded 0). Independent and control variables The independent or control variables are composed of a set of socioeconomic and demographic variables. The selection of control variables is guided by theoretical reasons, availability of data and prior research on discrimination against female children. The categorisation of the independent variables was based on theoretical grounds, as well as on the basis of the distribution of births with respect to the different variables. The following variables are included:
• Sex of the child categorised as male and female. • Age of the child classified as 0-11, 12-23 and 24-35 months. • Birth order is considered to be one of the factors influencing child health,
which captures a woman’s past experience in child bearing and rearing. Three categories were classified: first, second and third and fourth or higher birth order.
• Age of woman was grouped into three broad age groups: below 19, 20-29 and 30 years or more.
• Preceding birth interval was classified into two categories; first birth and more than or equal to 24 months and less than 24 months.
• Education of mother is viewed as important in health behaviour and health practices which have a great influence on the health and survival of young children (Caldwell, 1979; Schultz, 1984). In this study education of both women and their husbands were categorised as either illiterate or literate including primary, middle or secondary or higher.
14
• Mother’s current work status can greatly influence child health through lack of time for child care and feeding, particularly breast-feeding. This variable was categorised as currently not working and working.
• Caste was grouped into scheduled caste and non-scheduled caste. • Religion was classified into Hindu and non-Hindu. • Area of residence was classified into urban and rural. • Access to amenities was categorised into not having access to either piped
water or flush or pit toilet, having access to one and having access to both the amenities.
• Ownership of asset is categorised as not owning a television or refrigerator or motorcycle, owning one to two and owning all three assets. This variable is used as a proxy for economic status of the household.
• Watching television every week is grouped into yes and no. • Listening to radio every week is classified into yes and no.
15
Results
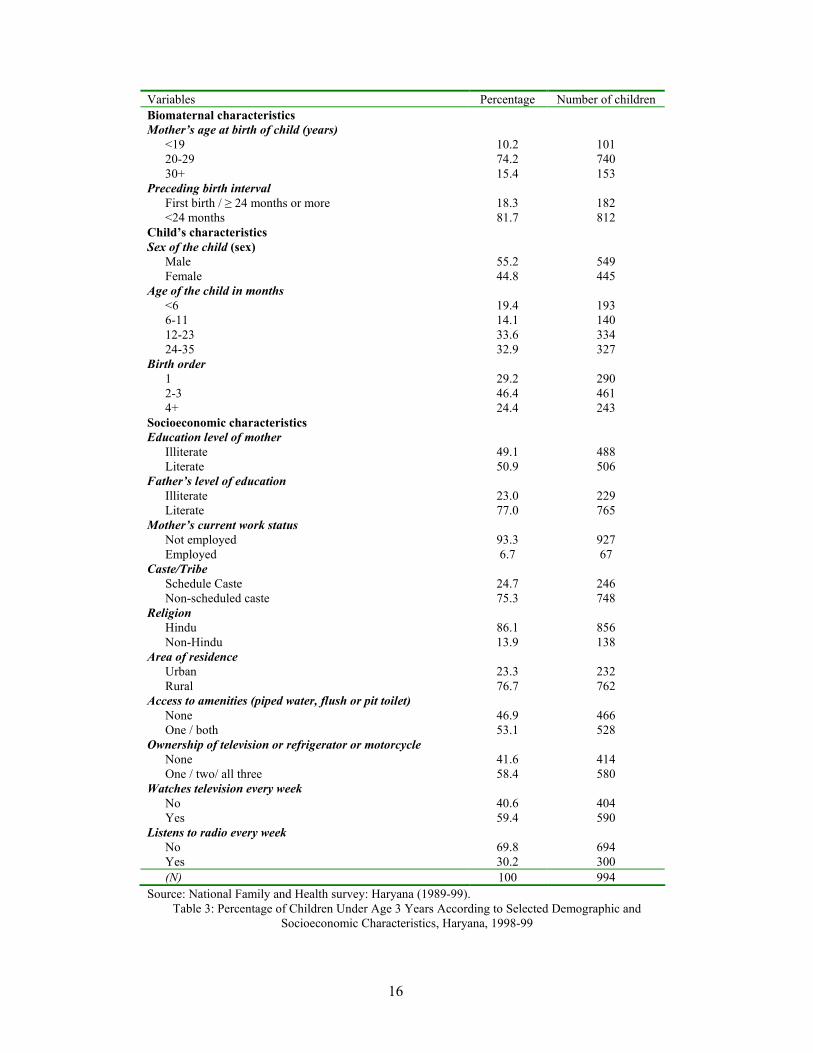
able 3 presents information about the sample that was used in this analysis and summarizes some of its characteristics. Of the mothers in the sample, around 50 percent have received no education, compared with 23 percent of the fathers.
This finding is congruent with the lower levels of female literacy in Haryana. It also indicates that 77 percent of the sample lives in rural areas. 53 percent of the sample have access to either piped water, flush or pit toilet, 42 percent own a television, refrigerator or motorcycle. 60 percent of the sample watches television every week and 30 percent listens to radio every week.
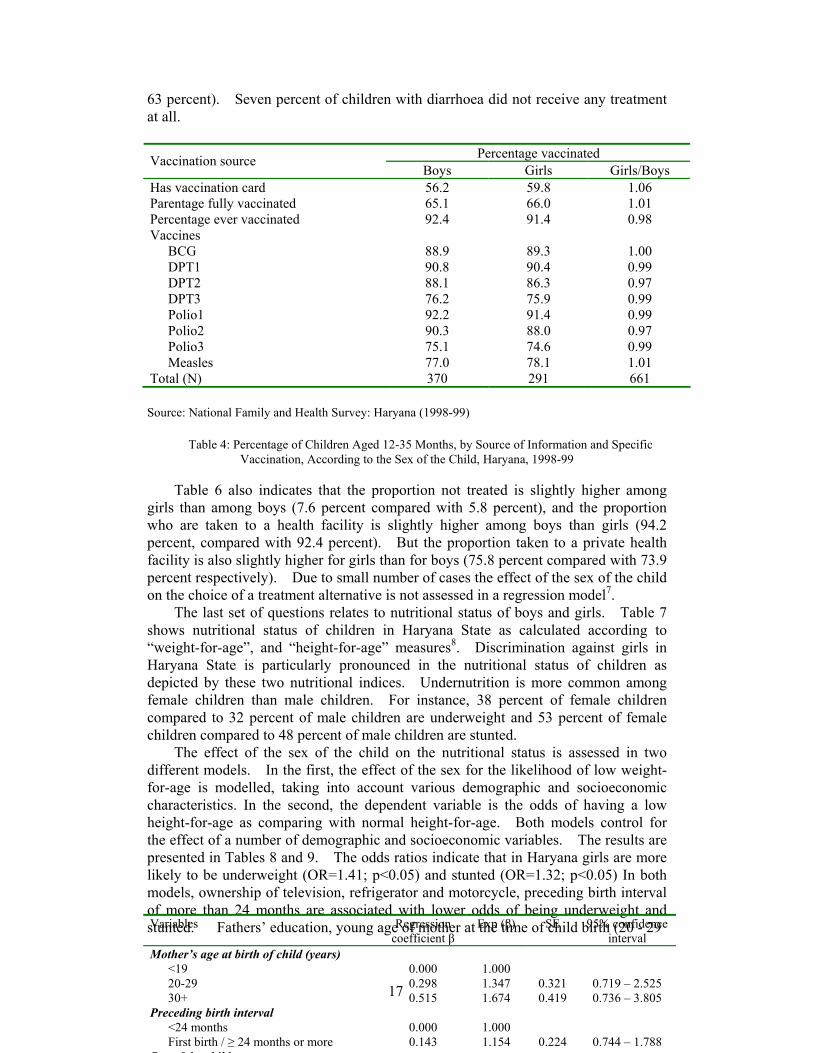
The first step in the analysis is to consider immunization coverage among the subsample of children aged 12-35 months. Based on information obtained from a card or reported by the mother (‘either source’), 65.5 percent of children aged 12-35 months are fully vaccinated, and only 8 percent have not received any vaccination. Coverage for each vaccination is much higher than the percentage fully vaccinated. BCG, the first and second dose of DPT and polio vaccine has each been received by at least 87 percent of children (Table 4). Although DPT and polio vaccination are given at the same time as part of routine immunization, the coverage rates are slightly higher for polio than for DPT, which may be because of Pulse Polio campaigns5. The overall figures for immunization coverage suggests that girls are slightly more likely to be fully vaccinated than boys (66 percent versus 65 percent). However, girls are slightly less likely to have received each of the individual vaccinations except measles. Mothers showed vaccination card for 26 percent of boys and 22 percent of girls6.
To investigate whether these differences are statistically significant, the adequacy of immunization was modelled taking into account the sex of the child, along with a number of other background variables. The odds ratios presented in Table 5 indicate that the effect of the sex of the child is not significant in Haryana (OR=1.07; p>0.10). Immunization adequacy is also influenced by some demographic variables such as age of the child and birth order of the child and also by socioeconomic status, as measured by education and exposure to radio. Woman’s education shows a positive association but not statistically significant. Surprisingly, children of working mothers are less likely to be fully immunized than children of non-working mothers. Perhaps this is because the opportunity cost of not going to work is greater than the immunization effect of children. But the effect of mother’s work on adequacy of immunization is not statistically significant.
The next set of questions relate to the occurrence of diarrhoea and the treatment that is provided to children who have diarrhoea. Table 6 shows that 14 percent of children under age three suffered from diarrhoea in the two-week period before the interview. Among children under age three, boys (13 percent) are somewhat less likely to have suffered from diarrhoea than girls (15 percent). This Table also shows the percent of boys and girls under age three with diarrhoea during the two weeks preceding the survey, who were and were not treated for diarrhoea, by where they were treated. For 93 percent of children in Haryana who suffered from diarrhoea during the two weeks preceding the survey, medical advice or treatment was sought from a health facility or provider (a much higher percentage than the national level of
T
16
Variables Percentage Number of children Biomaternal characteristics Mother’s age at birth of child (years)
<19 10.2 101 20-29 74.2 740 30+ 15.4 153
Preceding birth interval First birth / ≥ 24 months or more 18.3 182 <24 months 81.7 812
Child’s characteristics Sex of the child (sex)
Male 55.2 549 Female 44.8 445
Age of the child in months <6 19.4 193 6-11 14.1 140 12-23 33.6 334 24-35 32.9 327
Birth order 1 29.2 290 2-3 46.4 461 4+ 24.4 243
Socioeconomic characteristics Education level of mother
Illiterate 49.1 488 Literate 50.9 506
Father’s level of education Illiterate 23.0 229 Literate 77.0 765
Mother’s current work status Not employed 93.3 927 Employed 6.7 67
Caste/Tribe Schedule Caste 24.7 246 Non-scheduled caste 75.3 748
Religion Hindu 86.1 856 Non-Hindu 13.9 138
Area of residence Urban 23.3 232 Rural 76.7 762
Access to amenities (piped water, flush or pit toilet) None 46.9 466 One / both 53.1 528
Ownership of television or refrigerator or motorcycle None 41.6 414 One / two/ all three 58.4 580
Watches television every week No 40.6 404 Yes 59.4 590
Listens to radio every week No 69.8 694 Yes 30.2 300 (N) 100 994
Source: National Family and Health survey: Haryana (1989-99). Table 3: Percentage of Children Under Age 3 Years According to Selected Demographic and
Socioeconomic Characteristics, Haryana, 1998-99
17
63 percent). Seven percent of children with diarrhoea did not receive any treatment at all.
Source: National Family and Health Survey: Haryana (1998-99)
Table 4: Percentage of Children Aged 12-35 Months, by Source of Information and Specific Vaccination, According to the Sex of the Child, Haryana, 1998-99
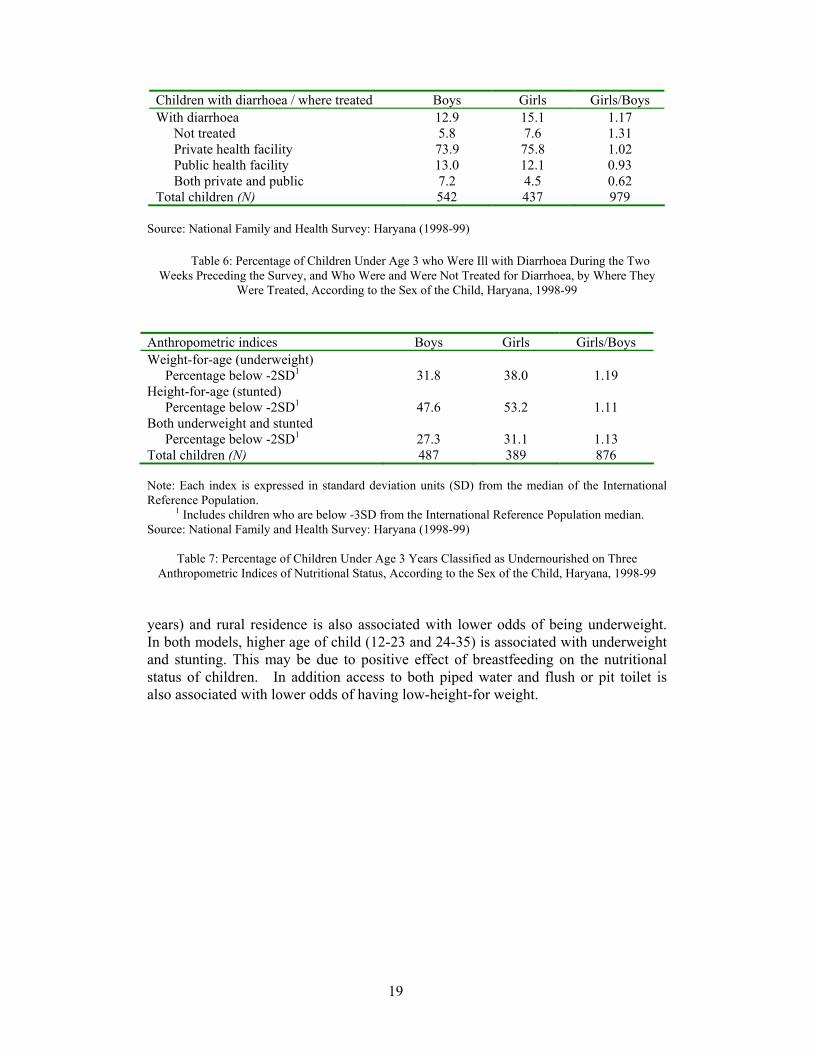
Table 6 also indicates that the proportion not treated is slightly higher among
girls than among boys (7.6 percent compared with 5.8 percent), and the proportion who are taken to a health facility is slightly higher among boys than girls (94.2 percent, compared with 92.4 percent). But the proportion taken to a private health facility is also slightly higher for girls than for boys (75.8 percent compared with 73.9 percent respectively). Due to small number of cases the effect of the sex of the child on the choice of a treatment alternative is not assessed in a regression model7.
The last set of questions relates to nutritional status of boys and girls. Table 7 shows nutritional status of children in Haryana State as calculated according to “weight-for-age”, and “height-for-age” measures8. Discrimination against girls in Haryana State is particularly pronounced in the nutritional status of children as depicted by these two nutritional indices. Undernutrition is more common among female children than male children. For instance, 38 percent of female children compared to 32 percent of male children are underweight and 53 percent of female children compared to 48 percent of male children are stunted.
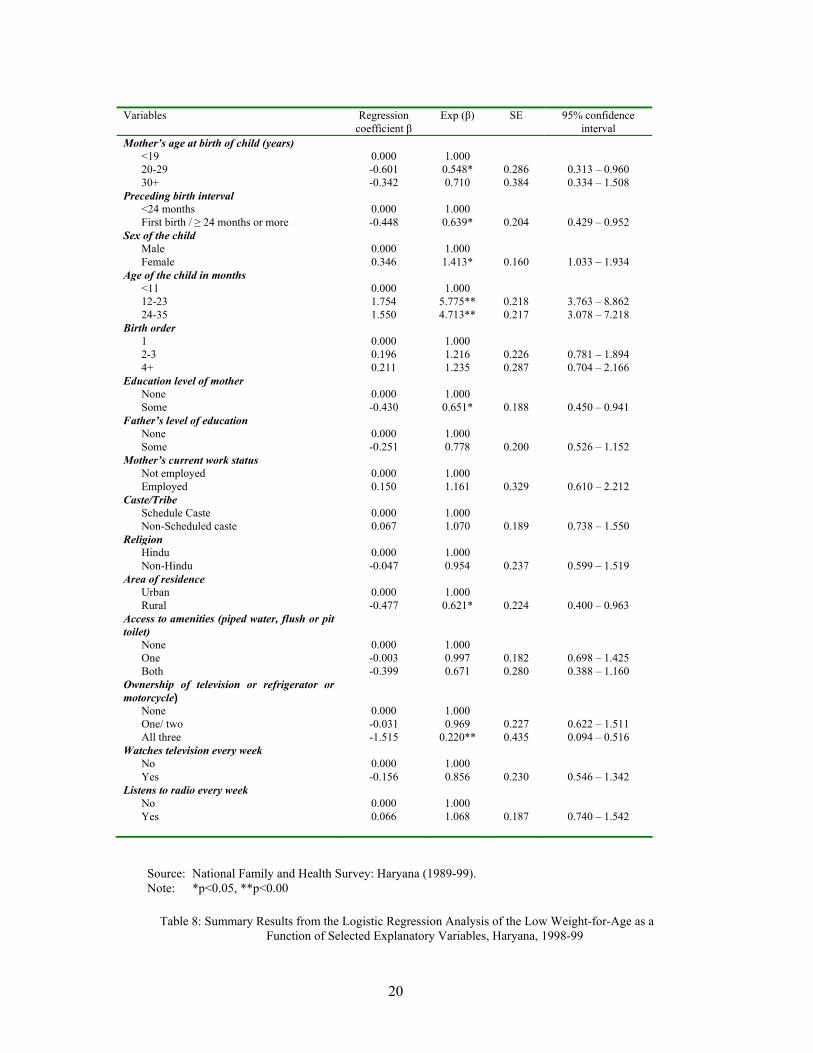
The effect of the sex of the child on the nutritional status is assessed in two different models. In the first, the effect of the sex for the likelihood of low weight-for-age is modelled, taking into account various demographic and socioeconomic characteristics. In the second, the dependent variable is the odds of having a low height-for-age as comparing with normal height-for-age. Both models control for the effect of a number of demographic and socioeconomic variables. The results are presented in Tables 8 and 9. The odds ratios indicate that in Haryana girls are more likely to be underweight (OR=1.41; p<0.05) and stunted (OR=1.32; p<0.05) In both models, ownership of television, refrigerator and motorcycle, preceding birth interval of more than 24 months are associated with lower odds of being underweight and stunted. Fathers’ education, young age of mother at the time of child birth (20 - 29
Percentage vaccinated Vaccination source Boys Girls Girls/Boys
Has vaccination card 56.2 59.8 1.06 Parentage fully vaccinated 65.1 66.0 1.01 Percentage ever vaccinated 92.4 91.4 0.98 Vaccines
BCG 88.9 89.3 1.00 DPT1 90.8 90.4 0.99 DPT2 88.1 86.3 0.97 DPT3 76.2 75.9 0.99 Polio1 92.2 91.4 0.99 Polio2 90.3 88.0 0.97 Polio3 75.1 74.6 0.99 Measles 77.0 78.1 1.01
Total (N) 370 291 661
Variables Regression coefficient β
Exp (β) SE 95% confidence interval
Mother’s age at birth of child (years) <19 0.000 1.000 20-29 0.298 1.347 0.321 0.719 – 2.525 30+ 0.515 1.674 0.419 0.736 – 3.805
Preceding birth interval <24 months 0.000 1.000 First birth / ≥ 24 months or more 0.143 1.154 0.224 0.744 – 1.788
S f h hild

18
Source: National Family and Health Survey: Haryana (1989-99). Note: Adequate immunization = a dose of BCG vaccine, three doses of diphtheria, pertussis and
tetanus, three doses of polio, and a dose of measles. *p<0.10, **p<0.05, ***p<0.00
Table 5: Logistic Regression Analysis of Adequacy of Immunization for Children Aged 12-35 Months, by Selected Demographic and Socioeconomic Characteristics, Haryana, 1998-99
19
Children with diarrhoea / where treated Boys Girls Girls/Boys With diarrhoea 12.9 15.1 1.17
Not treated 5.8 7.6 1.31 Private health facility 73.9 75.8 1.02 Public health facility 13.0 12.1 0.93 Both private and public 7.2 4.5 0.62
Total children (N) 542 437 979 Source: National Family and Health Survey: Haryana (1998-99)
Table 6: Percentage of Children Under Age 3 who Were Ill with Diarrhoea During the Two
Weeks Preceding the Survey, and Who Were and Were Not Treated for Diarrhoea, by Where They Were Treated, According to the Sex of the Child, Haryana, 1998-99
Anthropometric indices Boys Girls Girls/Boys Weight-for-age (underweight)
Percentage below -2SD1 31.8 38.0 1.19 Height-for-age (stunted)
Percentage below -2SD1 47.6 53.2 1.11 Both underweight and stunted
Percentage below -2SD1 27.3 31.1 1.13 Total children (N) 487 389 876 Note: Each index is expressed in standard deviation units (SD) from the median of the International Reference Population. 1 Includes children who are below -3SD from the International Reference Population median. Source: National Family and Health Survey: Haryana (1998-99)
Table 7: Percentage of Children Under Age 3 Years Classified as Undernourished on Three Anthropometric Indices of Nutritional Status, According to the Sex of the Child, Haryana, 1998-99
years) and rural residence is also associated with lower odds of being underweight. In both models, higher age of child (12-23 and 24-35) is associated with underweight and stunting. This may be due to positive effect of breastfeeding on the nutritional status of children. In addition access to both piped water and flush or pit toilet is also associated with lower odds of having low-height-for weight.
20
Source: National Family and Health Survey: Haryana (1989-99). Note: *p<0.05, **p<0.00
Table 8: Summary Results from the Logistic Regression Analysis of the Low Weight-for-Age as a
Function of Selected Explanatory Variables, Haryana, 1998-99
Variables Regression coefficient β
Exp (β) SE 95% confidence interval
Mother’s age at birth of child (years) <19 0.000 1.000 20-29 -0.601 0.548* 0.286 0.313 – 0.960 30+ -0.342 0.710 0.384 0.334 – 1.508
Preceding birth interval <24 months 0.000 1.000 First birth / ≥ 24 months or more -0.448 0.639* 0.204 0.429 – 0.952
Sex of the child Male 0.000 1.000 Female 0.346 1.413* 0.160 1.033 – 1.934
Age of the child in months <11 0.000 1.000 12-23 1.754 5.775** 0.218 3.763 – 8.862 24-35 1.550 4.713** 0.217 3.078 – 7.218
Birth order 1 0.000 1.000 2-3 0.196 1.216 0.226 0.781 – 1.894 4+ 0.211 1.235 0.287 0.704 – 2.166
Education level of mother None 0.000 1.000 Some -0.430 0.651* 0.188 0.450 – 0.941
Father’s level of education None 0.000 1.000 Some -0.251 0.778 0.200 0.526 – 1.152
Mother’s current work status Not employed 0.000 1.000 Employed 0.150 1.161 0.329 0.610 – 2.212
Caste/Tribe Schedule Caste 0.000 1.000 Non-Scheduled caste 0.067 1.070 0.189 0.738 – 1.550
Religion Hindu 0.000 1.000 Non-Hindu -0.047 0.954 0.237 0.599 – 1.519
Area of residence Urban 0.000 1.000 Rural -0.477 0.621* 0.224 0.400 – 0.963
Access to amenities (piped water, flush or pit toilet)
None 0.000 1.000 One -0.003 0.997 0.182 0.698 – 1.425 Both -0.399 0.671 0.280 0.388 – 1.160
Ownership of television or refrigerator or motorcycle)
None 0.000 1.000 One/ two -0.031 0.969 0.227 0.622 – 1.511 All three -1.515 0.220** 0.435 0.094 – 0.516
Watches television every week No 0.000 1.000 Yes -0.156 0.856 0.230 0.546 – 1.342
Listens to radio every week No 0.000 1.000 Yes 0.066 1.068 0.187 0.740 – 1.542

21
Source: National Family and Health Survey: Haryana (1989-99). Note: **p<0.00, *p<0.05
Table 9: Summary Results from the Logistic Regression Analysis of the Low Height-for-Age as a
Function of Selected Explanatory Variables, Haryana, 1998-99
Variables Regression coefficient β
Exp (β) SE 95% confidence interval
Mother’s age at birth of child (years) <19 0.000 1.000 20-29 0.027 1.028 0.282 0.592 – 1.785 30+ 0.018 1.018 0.385 0.479 – 2.163
Preceding birth interval <24 months 0.000 1.000 First birth / ≥ 24 months or more -0.619 0.538** 0.209 0.357 – 0.811
Sex of the child Male 0.000 1.000 Female 0.282 1.326* 0.157 0.976 – 1.803
Age of the child in months <11 0.000 1.000 12-23 1.896 6.661** 0.198 4.515 – 9.827 24-35 1.701 5.481** 0.196 3.735 – 8.042
Birth order 1 0.000 1.000 2-3 -0.238 0.788 0.208 0.524 – 1.186 4+ 0.223 1.250 0.278 0.726 – 2.154
Education level of mother None 0.000 1.000 Some -0.262 0.769 0.184 0.536 – 1.104
Father’s level of education None 0.000 1.000 Some -0.207 0.813 0.206 0.544 – 1.217
Mother’s current work status Not employed 0.000 1.000 Employed 0.255 1.291 0.328 0.679 – 2.454
Caste/Tribe Schedule caste 0.000 1.000 Non-Scheduled caste -0.003 0.997 0.189 0.688 – 1.445
Religion Hindu 0.000 1.000 Non-Hindu 0.104 1.110 0.232 0.704 – 1.748
Area of residence Urban 0.000 1.000 Rural -0.057 0.945 0.217 0.618 – 1.445
Access to amenities (piped water, flush or pit toilet)
None 0.000 1.000 One -0.136 0.873 0.179 0.614 – 1.241 Both -0.504 0.604* 0.264 0.360 – 1.014
Ownership of television or refrigerator or motorcycle)
None 0.000 1.000 One/ two 0.057 1.058 0.227 0.679 – 1.650 All three -0.984 0.374** 0.358 0.185 – 0.753
Watches television every week No 0.000 1.000 Yes -0.346 0.707 0.230 0.451 – 1.110
Listens to radio every week No 0.000 1.000 Yes 0.244 1.276 0.179 0.898 – 1.813 (N)
22
Discussion and Conclusion
he most notable finding from all these analyses is that evidence for the preferential treatment of boys is very strong in case of nutrition. There is some evidence, as well, of sex differences in immunization coverage and diarrhoea
treatment. Where differences are found favouring boys in immunization coverage and in treatment of diarrhoea, they are relatively small and not significant.
These results are in contrast with the growing body of literature which suggests that girls in South Asia are discriminated against in the provision of health care but are not neglected in nutritional allocations (see section on Background of this paper). But the direction and magnitude of the differences are supported by my qualitative research. The focus of my qualitative research in this article is on women’s perceptions and experiences of bearing sons and daughters and differential allocation of food in the family, supported by local rural sayings. But before I explain that, I argue that gender bias in nutrition reflects behavioural mechanisms of those who care for children or who influence the care and through which sex-biased attitudes and practices might operate to affect the outcome—in this case better nutritional status of boys as compared to girls. On the other hand, gender bias in immunization coverage and treatment for various illnesses is also a reflection of number of health centres and greater proliferation of health services. While the latter can be changed by government efforts, changing the behaviour influencing sex discrimination in nutrition is difficult to achieve by government efforts alone. This has been reflected in immunization and health care variables if one compares the results of NFHS-1 and NFHS-2. For example, NFHS-1 data documented discrimination against girls in vaccination coverage as well as in medical treatment of ARI, fever and diarrhoea (IIPS, 1995), while my present study found very small differences in these two attributes. But differences in nutritional status remained in both the surveys and I argue that in societies where son preference exists, sons may receive preferential treatment in provision of food. Parental discriminating behaviour in Haryana favouring boys in nutrition is culturally imbedded and is unlikely to change. Technology under the guise of sex determination tests had given an added boost to male child preference.
Haryana, particularly its rural part, reflects a particularly high level of son preference, as indicated by many studies based on NFHS-1 data (Mutharayappa et al., 1997; Arnold, Choe and Roy, 1998). Even the summary of the data from NFHS-1 of 14 Indian states (Kurz and Johnson-Welch, 1997) which suggested that there are no notable gender differences in nutritional status among 0-5 year old children, found that girls in Haryana state have much lower value for many of the health and nutritional variables than boys. In Haryana, parents consider their daughters to be less valuable and provide inferior care in terms of food allocation. For example the median duration of any breastfeeding in Haryana is 25.8 months for male children and 23.5 months for female children (IIPS, 2001). NFHS data supports this finding in Haryana State:
Boys are breastfed for a slightly longer period of time than girls in India as a whole. The duration of breastfeeding is much shorter for girls than for boys in Haryana, Rajasthan and Madhya Pradesh. One reason
T
23
for the shorter period of breastfeeding for girls is the parents’ desire to have another child sooner after the birth of a girl than after the birth of a boy, in the hope of having a boy for the next birth. Although the intent of parents may not always be to provide less adequate nutrition to daughters by weaning them earlier, the effect is the same (Mutharayappa et al., 1997: 12).
Sex differential in Haryana is found not only in anthropometric measure but also in actual food and calories and protein intake (Jatrana, 1999: 12). Sex differentials were more marked in poor families and in case of protein intake. The reason for this lies in the fact that girls are given more cereals (major constituents of calories), while boys are given more milk and fats (which are expensive and highly valued foods) along with cereals. Since milk and fats are rich in protein, they make differences greatest in the case of protein. Moreover, from informal talks with women during field survey, it was found that male children (even of low-income families) are ensured with regular supply of milk and fats while female children have to go without it. This means that girls receive much less fats and milk than males. Thus, the pattern of protein and calories intake conclusively demonstrates that female children are markedly disadvantaged in terms of food intake as compared to boys. If a girls demands milk she will be questioned:
Do you have to plough the field that you need milk and ghee? (Kya tene hal jotna hai jo gee-doodh chahiye)
Though the discrimination against women in the matter of food allocation becomes more acute in families with limited resources, even in well-off families, boys get the best in terms of food. This discrimination against girls in food intake, especially milk intake, is particularly present in the lean period. Based on the nutritional survey data in the study villages, Behrman (1988) evaluated 269 boy-girl comparisons for households having children of different sex in the same age group-one to three, four to six, and seven to twelve. He documented a small but statistically significant pro-boy bias of about 5 percent in RDA (Recommended Daily Allowance) in the lean food availability season. That difference disappeared in the surplus season.
Mothers not only tend to breastfeed boys longer than girls and give better food to boys, but also pay more attention to the feeding needs of male infants. For example, I was told by one of my respondents that if a male infant (particularly born after daughters) starts crying, the in-laws will ask the mother to attend the child and give him feed and also to rest a while from the household chores. But she is denied even the customary rest of 45 days following the birth of a daughter (Jatrana, 2001). Greater concern for the safety of infant boys was apparent from my informal discussions with mothers who had daughters as well as sons. The following response from one of my respondents is an example of the relative lack of concern for the health and food requirements of little girls:
There is no need to care for the girls, not even in infancy. They are like Kikar (acacia, a thorny plant which grows without any care). Girls will grow up without any care just as the Kikar tree grows up without any care. But boys are like Shisham (a precious timber wood tree which needs special care to grow). Moreover, caring for a girl
24
means caring for someone else’s baag (garden) because she is a Paraya Dhan (other’s property) and will go to others’ house after marriage (mother of three daughters and one son; Field Notes, Mewat, 1996).
During my field survey, I witnessed that girl children were fed with left overs and
parents did not let a girl child eat her fill, fearing she would grow too big quickly and they would have to worry about her wedding. Nutritionally, the female child struggles for survival with her dietary intake inferior in both quality and quantity to that of her male counterparts. It is the people’s, particularly women’s, attitude that works against the female babies. It is often said that a woman is the enemy of another woman. Though the neglect of girl children in terms of nutrition can be conscious or unconscious9, it is in response to the prevalent societal and historical norms10 of strong preference for sons and is resistant to change. The presence of dowry system, a culture in which sons inherit family land and are responsible for taking care of elderly parents, continue the family line and the lesser economic worth of a women, who are less well educated and less likely to work outside the home than are men, all contribute to this preference (Miller, 1981). She is considered as paraya dhan (someone else’s property) by her parents and parayi beti (someone else’s daughter) by her-in-laws. She does not belong anywhere. During the turbulent centuries of war and invasions, a woman was a liability to her family and her status had always been elevated with the birth of a male child. In general, the birth of a female baby in Haryana is not a happy occasion. “Experienced nurses in public hospitals report that the desire to get rid of girl babies is so strong that some mothers have to be forced to feed them”, (Trehan and Sethi, 1980). Thus, we may infer that parental discrimination against girls in nutrition is in response to societal norms but we need more qualitative data to identify and reduce gender difference in nutrition as well as in other fields of life.
25
References Arnold, F. (1997) ‘Gender preferences for children: Findings from the Demographic and
Health Surveys’, Paper presented for the 23rd General Population Conference of the International Union for the Scientific Study of Population (IUSSP), Beijing, 11-17 October.
Arnold, F., Choe, M.K. and Roy, T.K. (1998) ‘Son preference, the family building process, and child mortality in India’, Population Studies, 52(2), 301-315.
Aziz, K.M.A. (1977) ‘Present trends in medical consultations prior to death in rural Bangladesh’, Bangladesh Medical Journal, 6.
Basu, A.M. (1989) ‘Is discrimination in food really necessary for explaining sex differences in childhood mortality?’, Population Studies, 43(2), 193-210.
Basu, A.M. (1993) ‘How pervasive are sex differentials in childhood nutritional levels in South Asia?’, Social Biology, 40(1-2), 25-37.
Black, R.E. (1984) ‘Diarrhoeal diseases and child morbidity and mortality’, in W.H. Mosley and L.C. Chen (eds.), Child Survival Strategies for Research, Population and Development Review, A supplement to Vol. 10, 141-161.
Black, R.E., Brown, K.H. and Becker, S. (1984) ‘Malnutrition is a determining factor in diarrhoeal duration, but not incidence among young children in a longitudinal study in rural Bangladesh’, American Journal of Clinical Nutrition, 39, 82-94.
Behrman, J.R. (1988) ‘Intrahousehold allocation of nutrients in rural India: Are boys favoured? Do parents exhibit inequality aversion?’, Oxford Economic Papers, 40, 32-54.
Briscoe, J.L.S.A., Akin, J.S., Guilkey, D.K., Popkin, B.M., Black, R.E. and Flieger, W., (1991) ‘Underlying and proximate determinants of child health: The Cebu Longitudinal Health and Nutrition Study’, American Journal of Epidemiology, 133(2), 185-201.
Caldwell, J. C. (1979) ‘Education as a factor in mortality decline: An examination of Nigerian data’, Population Studies, 23(2), 395-413.
Chaudhury, R.H. (1987) ‘Dietary adequacy and sex bias: Preschool children in rural Bangladesh’, Social Action, 31.
Chen, L.C., Huq, E. and D'Souza, S. (1981) ‘Sex bias in the family allocation of food and health care in rural Bangladesh’, Population and Development Review, 7, 1, 55-70.
Das Gupta, M. (1987) ‘Selective discrimination against female children in rural Punjab, India’, Population and Development Review, 13, 1, 77-100.
Das Gupta, M. and Mari Bhat, P.N. (1997) ‘Fertility decline and increased manifestation of sex bias in India’, Population Studies, 51, 307-315.
D'Souza, S. and Chen, L.C. (1980) ‘Sex differentials in mortality in rural Bangladesh’, Population and Development Review, 6, 2, 257-270.
Dyson, T. and Moore, M. (1983) ‘On kinship structure, female autonomy, and demographic balance’, Population and Development Review, 9, 35-60.
Filmer, D., King, E.M. and Pritchett, L. (1998) ‘Gender disparity in South Asia: Comparisons between and within countries’, World Bank Working Paper No. 1867.
George, S.M. and Dahiya, R.S. (1998) ‘Female feticide in rural Haryana’, Economic and Political Weekly, August 8, 2191-2198.
Gopalan, C. (1987) Gender Bias in Health and Nutrition Care, Nutrition Foundation of India, Bulletin 8.
26
Government of India. (1998) Annual Report 1997-98, Ministry of Health and Family welfare, Government of India, New Delhi.
Government of India. (2001) Economic Survey, Central Statistical Organisation, New Delhi. Hill, K. and Upchurch, D.M. (1995) ‘Gender differences in child health: Evidence from the
Demographic and Health Surveys’, Population and Development Review, 21, 1, 127-151. International Institute for Population Sciences (IIPS) (1995) National Family Health Survey,
Haryana 1992-93, Bombay. International Institute for Population Sciences (IIPS) (2001) National Family Health Survey,
Haryana 1998-99, Bombay. Jatrana, S. (1999) ‘Discrimination and violence against girl child in the family in Indian
society’, Paper prepared for presentation in the fourth International Conference on the Child Violence organised by the Organisation for the Protection of Children’s Rights (OPCR), Montreal, 13-15 October, 1999.
Jatrana, S. (2001) ‘Does maternal employment affect child care arrangements and breastfeeding differently to boys and girls? Evidence from rural north India ‘, Paper presented in the session: S57 Women’s labour: production and reproduction of the 23rd IUSSP Conference held in Brazil, 18-24 August 2001.
Kurz, K.M. and Johnson-Welch, C. (1997) ‘Gender bias in health care among children 0-5 years: Opportunities for child survival programs’, International Center for Research on Women, BASICS Review paper.
Meegama, S.A. (1980) ‘Socio-economic determinants of infant and child mortality in Sri Lanka: An analysis of post-war experience’, WFS Scientific Reports, No. 8, London, World Fertility Survey.
Miller, B.D. (1981) The Endangered Sex: Neglect of Female Children in Rural North India, Ithaca, NY, Cornell University Press.
Mutharayappa, R., Choe, M.K., Arnold, F. and Roy, T.K. (1997) ‘Son Preference and its effect on fertility in India’, National Family Health Survey Subject Reports No. 3., International Institute for Population Sciences, Mumbai, India and East-West Centre Program on Population, Honolulu, Hawaii, U.S.A.
Nutritional Foundation of India (1988) ‘Profile of undernutrition and underdevelopment: Studies of poor communities in seven regions of the country’, NFI Scientific Report No. 8, Delhi.
Office of the Registrar General of India. (1991) Census of India, Primary Census Abstract, General Population, Series 1- India, Part II-B (i).
Office of the Registrar General of India. (2001) Census of India 2001, Provisional Population Totals, Series 1, Paper 1 of 2001, Office of Registrar General & Census Commissioner, New Delhi, accesses at http:/www.censusindia.net
Park, C.B. and Cho, N.H. (1995) ‘Consequences of son preference in low fertility countries in East Asia: Rising imbalance of sex ratio at birth’, Population and Development Review, 21, 59-84.
Rahaman, M.M., Aziz, K.M.S., Munshi, M.H., Patwani, Y. and Rahman, M. (1982), ‘A diarrhoea clinic in rural Bangladesh: Influence of distance, age, and sex on attendance and diarrhoeal mortality’, American Journal of Public Health, 72, 1124.
Royston, E. and Armstrong, S. (1989), Preventing Maternal Deaths, Geneva, World Health Organisation.
Schultz, P.T. (1984), ‘Studying the impact of household economic and community variables on child mortality’, in W.H. Mosley and L.C. Chen (eds.), Population and Development Review, Supplement to Vol. 10, Child Survival: Strategies for Research, New York: Cambridge University Press.
27
Singh, S., Gordon, J.E. and Wyon, J.B. (1962) ‘Medical care in fatal illness of a rural Punjab population: Some social, biological and cultural factors and their ecological implications’, Indian Journal of Medical Research, 50(November).
Thaddeus, S. and Maine, D. (1991) Too Far to Walk: Maternal Mortality in Context, New York, Centre for Population and Family Health, Faculty of Medicine, Faculty of Medicine, Columbia University.
Tomkins, A. and Watson, F. (1989) ‘Malnutrition and infection’, in A. Tomkins and F. Watson (eds.), Malnutrition and Infection: A Review, ACC/SCN state-of-the-art Series, Nutrition Policy Discussion Paper No. 5, UN Administrative Committee on Coordination Subcommittee on Nutrition.
Trehan, M. and Sethi, S. (1980) ‘A time for reckoning’, India Today, Aug 1-15, 34-37. UNICEF (1995) The State of the World Chidren, Oxford, Oxford University Press. Waldron, I. (1986) ‘What do we know about causes of sex differences in mortality? A review
of the literature’, Population Bulletin of United Nations, 18, 59-76. Walker, T.S. and Ryan, J.G. (1990) Village and Household Economies in India’s Semi-Arid
Tropics, Baltimore, MD, Johns Hopkins University Press. World Health Organisation (WHO) (1998) Gender and Health: Technical Paper, Geneva,
World Health Organisation, Women's Health and Development.

28
Notes 1 A slightly higher neonatal mortality rate for girls than for boys (12 percent higher) is unexpected, because neonatal mortality (which largely reflects mortality due to congenital conditions) tends to be higher for boys than for girls in most populations. Neonatal mortality was higher for boys than for girls in NFHS-1 (IIPS,1995). 2 The sex ratio of children in both cases is about 123 males per hundred females. Moreover, the differential in health indicators in favour of boys, if any, would be lower if treatment had been identical. 3 There were only 136 children with diarrhoea, out of which 10 did not receive any treatment. A portioning of this sample in various treatment alternatives and with various background characteristics produces such small sub-groups that estimates are unstable and the interpretation of results difficult. 4 Ideally, children under one year of age should have been excluded from the analysis to cancel out the effect of breastfeeding. But the results donot change whether we include or exclude those children. 5 These results show that there has been considerable improvement in full vaccination coverage in Haryana since the times of NFHS-1, when the proportion of children fully vaccinated was 54 percent. The proportion of children who did not receive any vaccination declined substantially, from 18 percent in NFHS-1 to 8 percent in NFHS-2. The coverage of each specific vaccination has also improved considerably since NFHS-1, suggesting that many more children were brought into the programme in the six years between the two surveys. 6 In NFHS-1, vaccination coverage was higher for boys than for girls and vaccination cards were shown for a higher proportion of boys than girls. 7 There were only 136 children with diarrhea, out of which 10 did not receive any treatment. A portioning of this sample in various treatment alternatives and with background characteristics produces such small sub-groups that estimates are unstable and the interpretation of results difficult. 8 The two nutritional status indices provide somewhat different information about nutritional status of children. The height-for-age index measures linear growth retardation among children. Children who are more than two standard deviations below the median of the reference population in terms of height-for-age are considered short for their age or stunted. The percentage in this category indicates the prevalence of chronic undernutrition which often leads to chronic or recurrent diarrhoea. Stunting is typically associated with inadequate food intake resulting from poor feeding practices or from the lack of sufficient food, as well as the existence of adverse environmental conditions for an extended period of time. Height-for-age, therefore, is a measure of the long-term effects of undernutrition. Weight-for-age is a composite measure which takes into account both chronic and acute undernutrition. Children who are more than two standard deviations below the reference median on this index are considered underweight. 9 If it is conscious, it will be heavily against some of the girls, particularly, higher order girl but if it is unconsciously, then it will be in a more generalized way against all the girls in the family. 10 It was perhaps the consequence of repeated invasions and subjugation of the indigenous population, especially the atrocities committed on the local women by victorious invaders, that women began to be perceived as a liability in society. This might explain why the frontier states in north western India which faced the brunt of most invasions, display into the most adverse sex ratio.
29
OTHER TITLES IN THIS SERIES: Asian MetaCentre Research Paper Series No. 1 Age-Sex Pattern of Migrants and Movers: A Multilevel Analysis on an Indonesian Data Set Aris Ananta, Evi Nurvidya Anwar and Riyana Miranti Asian MetaCentre Research Papaer Series No. 2 The Future Population of China: Prospects to 2045 by Place of Residence and by Level of Education Cao Gui-Ying Asian MetaCentre Research Paper Series No. 3 Singapore’s Changing Age Structure and the Policy Implications for Financial Security, Employment, Living Arrangements and Health Care Angelique Chan Asian MetaCentre Research Paper Series No. 4 The Effect of Social Interaction on Desired Family Size and Contraceptive Use Among Women in Bangladesh Lisa Marten Asian MetaCentre Research Paper Series No. 5 Modeling Contraceptive Prevalence in Bangladesh: A Hierarchical Approach E.M. Nazmul Kalam and H.T. Abdullah Khan Asian MetaCentre Research Paper Series No. 6 Health Consequences of Population Changes in Asia: What Are the Issues? (A summary paper from an Asian MetaCentre workshop held in Bangkok, Thailand, 13-14 June 2002) Asian MetaCentre Research Paper Series No. 7 Age Structural Transition and Economic Growth: Evidences from South and Southeast Asia Kannan Navaneetham Asian MetaCentre Research Paper Series No. 8 Asians on the Move: Spouses, Dependants and Households (Special collection of papers by Chotib, Siew-Ean Khoo, Salut Muhidin, Zhou Hao and S.K. Singh) Asian MetaCentre Research Paper Series No. 9 The Relationship Between Formal and Familial Support of the Elderly in Singapore and Taiwan Angelique Chan, Ann E. Biddlecom, Mary Beth Ofstedal and Albert I. Hermalin Asian MetaCentre Ressearch Paper Series No. 10 Organisations that Care: The Necessity for an Eldercare Leave Scheme for Caregivers of the Elderly in Singapore Theresa W. Devasahayam
30
Asian MetaCentre Ressearch Paper Series No. 11 The “Flight from Marriage” in South-East and East Asia Gavin W. Jones Asian MetaCentre Ressearch Paper Series No. 12 Fertility and the Family: An Overview of Pro-natalist Population Policies in Singapore Theresa Wong and Brenda S.A. Yeoh Asian MetaCentre Ressearch Paper Series No. 13 Strategies and Achievements in Expanding Lower Secondary Enrollments: Thailand and Indonesia Gavin W. Jones Asian MetaCentre Ressearch Paper Series No. 14 Infant Mortality in a Backward Region of North India: Does Ethnicity Matter? Santosh Jatrana Asian MetaCentre Ressearch Paper Series No. 15 Factors Associated with Contraceptive Discontinuation in Bali, Indonesia: A Multilevel Discrete-time Competing Risks Hazard Model Evi Nurvidya Arifin