explaining fiscal decentralisation: geography, colonial history, economic … · 2011-01-13 ·...
TRANSCRIPT

Explaining fiscal decentralisation: geography, colonial
history, economic development, and political institutions
Daniel Treisman
Department of Political Science University of California, Los Angeles
4289 Bunche Hall Los Angeles, CA 90095-1472
Keywords: Fiscal decentralisation, economic development, federalism, democracy, political institutions
August 2006
Forthcoming in Journal of Commonwealth and Comparative Politics, 44, 3, 2006.

Abstract
Why are some countries more fiscally decentralised than others? Scholars have attributed such differences to geographical, cultural, institutional, and economic factors. Using a dataset of 66 countries, I test various hypotheses. The results suggest territorially larger—but not necessarily more populous—countries are more fiscally decentralised. Former colonies of Spain or Portugal are more centralised, while former Soviet states are particularly decentralised.Economic development leads to greater expenditure decentralisation, but affects revenue decentralisation less, rendering local governments in richer countries more dependent on central transfers. Federal states are more decentralised, in part because federalism is more common among more developed countries. Ethnolinguistic divisions did not correlate with decentralisation. Neither the level nor duration of democracy had any clear effect. Longitudinal analysis suggested democratisation is associated with a significant but tiny increase in decentralisation.
2
Introduction
Why are some countries more fiscally decentralised than others? Many scholars have sought to
understand the consequences of decentralisation. Far less effort has gone into discerning its
causes.1 Yet the huge variation in the degree to which countries have devolved fiscal resources
and expenditure responsibilities to local and regional governments presents a prima facie puzzle.
As of the mid-1990s, the share of subnational governments in total government expenditures
ranged from zero per cent in Singapore, which has no subnational governments, to 57 per cent in
Canada (see Figure 1).2 The subnational share in total government revenues ranged from zero to
54 per cent (again for Singapore and Canada).
Many factors might contribute to these differences. Some are geographical or cultural.
The challenges of governing very large or ethnically diverse countries might, over time, lead to a
decentralisation of government activity. Others relate to accidents of history. Patterns of fiscal
organisation are likely to be influenced by countries’ institutional past, and in much of the world
that past involved colonisation by external powers. Which imperial power occupied a given
country’s territory might well affect how decentralised its fiscal structures are today. At the same
time, fiscal decentralisation might increase or decrease with economic development. And the
character of the existing regime—whether democratic or authoritarian, federal or unitary—might
also influence the distribution of fiscal resources.
[FIGURE 1 ABOUT HERE]
In this paper, I explore available crossnational fiscal data for meaningful patterns.
Measuring fiscal decentralisation is both difficult and controversial. Various studies have used the
share of subnational governments in total state expenditures or revenues, usually based on data
published in the IMF’s Government Finance Statistics Yearbooks. I adopt this approach here and
study fiscal decentralisation defined as the subnational share of either revenues or expenditures.
3
As some have pointed out, the pattern of revenue and expenditure decentralisation will
not always coincide with the division of political decisionmaking among levels of the state.3
Expenditures financed from subnational budgets are sometimes mandated by central
governments. Subnational revenues often include shares of central taxes. Even taxes whose
revenues are wholly assigned to subnational governments may have their rates and bases set by
the center. For this reason, it is important to define and distinguish fiscal and decisionmaking
decentralisation clearly and to study each separately, making sure the concept chosen is
appropriate to the particular theoretical arguments at stake.4 In this paper, I focus on the former,
and results should not be loosely extrapolated to the latter.
The analysis suggests a number of tentative conclusions. Country size and colonial
history together explain more than half the variation in both expenditure and revenue
decentralisation. Former British colonies, French colonies, Russian colonies, and countries that
were never colonised in modern times were significantly more decentralised than former Spanish
or Portuguese colonies. This was true of the British and non-colonies in part because they tended
to be more economically developed. Greater economic development was strongly linked to
greater decentralisation (and this was true in instrumental variables as well as OLS regressions).
The Russian colony effect probably reflects a powerful legacy of Soviet rule. Ethnic division—at
least in the formulation I used—was not related to fiscal decentralisation. (It appeared at first
negatively associated, but this was likely caused by a negative effect of ethnic division on
income.) Federalism correlated strongly with fiscal decentralisation, although this was caused in
part by the greater frequency of federal structures at higher levels of economic development.
Democracy—either the current extent of political freedoms or the duration of democratic
rule—was not significantly related to fiscal decentralisation in the cross-sectional regressions
controlling for colonial history and economic development. This was surprising given the
common association of decentralisation with transitions from authoritarianism. I therefore tried
running panel regressions to see whether changes in the level of democracy (as measured by

4
Freedom House scores) were followed by changes in fiscal decentralisation. The panel included
data from a range of countries in the period 1972-2000. I found evidence of a very small but
significant positive relationship between increases in democracy and subsequent increases in
expenditure decentralisation. There was no relationship between democratisation and revenue
decentralisation. I illustrate the lack of a clear pattern with several examples. Although Spain
decentralised dramatically during its first decades of democracy, Estonia centralised fiscal
resources during its transition from Soviet rule. Zimbabwe, in the late 1980s, centralised fiscally
while becoming more authoritarian. But Belarus’ slide into autocracy in the late 1990s was
accompanied by a decentralisation of expenditures.
The next section discusses a number of hypothetical determinants of fiscal
decentralisation. I then review the data and methods of the analysis, and present results, before
exploring the dynamic relationship between decentralisation and democracy.
Possible Determinants
Existing scholarship suggests a number of possible reasons why some countries are more fiscally
decentralised than others. I examine below the strengths and weaknesses of these arguments,
before attempting to test them empirically in the following section.
Ethnic division
Two types of argument are often made relating fiscal decentralisation to ethnic heterogeneity.
The first focuses on practical politics. Where ethnic divisions are politicised (and ethnic groups
are territorially compact), decentralising authority over such contentious policy issues as
education and culture may help to restrain communal violence or even prevent civil war.5 Such
policy decentralisation is a key feature of ‘consociational democracy’, a design of democratic
institutions thought to help preserve peace in divided societies (Lijphart, 1977, 1993). To be
credible, policy decentralisation must have some fiscal component. Thus, to preserve stability,

5
central elites in more ethnically divided societies may choose a higher level of fiscal
decentralisation.
Of course, they also may not. Central leaders may care more about other goals—retaining
fiscal resources at the center, for instance—than about avoiding communal violence. And, even if
they do decentralise, this may fail to prevent ethnic violence and to preempt demands for
secession. Consociational arrangments have failed on many occasions—most notably, in Lebanon
in 1975. Aleman and Treisman studied the post-war histories of four ethnically-divided federal
states—India, Pakistan, Nigeria, and Yugoslavia—and found no relationship between the degree
of fiscal decentralisation and the incidence of secessionist violence (Aleman and Treisman,
2005). If fiscal decentralisation is an unreliable means of restraining ethnic conflict, central
leaders may not use it.
A second, related argument is about economic efficiency. Tastes for public goods and
services are likely to vary across ethnic groups. If so, and if certain other conditions are met,6
more total utility will result if different baskets of public goods and services are provided in
different, ethnically homogeneous subregions. If education policy, say, is made at regional rather
than central level, then different ethnic minorities can set syllabi and levels of education financing
in their home regions to suit their tastes. Oates (1972) considered this a strong argument for fiscal
decentralisation. 7 However, the assumption that central governments can only provide goods
uniformly has come in for criticism. 8 On the face of it, any decentralised expenditure scheme
could also be implemented by a centralised government, so the efficiency argument requires some
additional assumption. A common one is that local governments are either more efficient at
collecting information about tastes or better able to get local constituents to reveal such
information (Tanzi, 2000). Note that this argument—at most—establishes the possibility that
decentralised provis ion would be more efficient. One must assume in addition that local
governments are not captured by predatory elites to a greater extent than central ones (Bardhan
and Mookherjee, 2000). Finally, this is an argument about efficiency. Few economists—and still

6
fewer political scientists—believe that actual arrangements are always the most efficient ones. So
even if fiscal decentralisation is more efficient in ethnically divided societies, that does not imply
ethnically divided societies would tend to be more fiscally decentralised.
Country size
Several common arguments predict that fiscal decentralisation will be greater in more populous
or territorially larger states. Although these arguments appear common-sensical, the logic is not
as compelling as it might seem. A first reason to expect greater fiscal decentralisation in larger
states is that there are likely to be diseconomies of scale in government. The relevant
diseconomies are not those associated with provision of particular public goods or services—such
goods or services could still be provided at the optimal scale by decentralised agents of a fiscally
unitary government, just as optimally sized plants can operate under a single firm’s financial
management. The key is the notion that certain central supervisory functions cannot be provided
as effectively in very large units. As John Stuart Mill put it: ‘There is a limit to the extent of
country which can advantageously be governed, or even whose government can be conveniently
superintended, from a single centre’ (Mill, 1991). For Mill, this constituted a reason for
federalism and decentralisation in large states.9
A second reason why larger countries might have greater fiscal decentralisation is derived
by combining the efficiency argument about heterogeneity with the assumption that heterogeneity
of tastes is likely to be greater in larger states. Thus, larger countries are assumed to be more
diverse, and therefore to have greater efficiency gains to realize from decentralisation.
Both these arguments are about the efficiency of decentralisation in large countries. As
already noted, however, there is little reason to be confident that the most efficient arrangement
will generally be chosen. It is less clear why the process of political organisation and bargaining
7
would lead to greater fiscal decentralisation in large than in small states. This is a theoretical gap
that, given the results I present below, needs to be filled.
Colonial history
Most countries of the world were colonised within the last two centuries by one or other of the
major powers.10 The colonists introduced systems of government and administration that
reshaped political life. The styles and strategies of political control differed markedly. Various
writers have contrasted the British willingness to introduce indirect government in their imperial
possessions, and—at least in the Americas—to devolve considerable decisionmaking power to
elected legislatures of colonial settlers. Tocqueville (2000 [1833]), in the early 19th Century, was
struck by the contrast between British and French styles of colonial administration in North
America:
For several centuries, the central government in France has worked constantly to control every decision itself; today, we can say that it does not just govern but administers all the separate parts of the realm… Nearby, on the ocean coast, the English come to settle…. From the start, they have their political assemblies and tribunals, they appoint most of their magistrates, organise their militia, provide for their needs, and make their own municipal regulations and laws. The metropole gets involved in almost none of their internal affairs; it acts only to protect their commerce and to secure them against attack by foreigners.
When it withdrew from most of its overseas possessions more than a century later, Britain was
more prone than other empires to leave behind federal structures.11
The tradition in Spain’s overseas dominions is usually seen as one of overcentralisation,
leavened by weakness of central enforcement and local corruption. The motives of Spanish
colonists have often been described as particularly mercenary. Diderot unfavourably compared
the ‘soif d’or’ of the conquistadores with the religious fervor of the British Puritans. The first
Spanish settlements—the self-governing cabildos—were probably quite autonomous, with
considerable powers of taxation and expenditure. But these were reined in by the centralising
8
Habsburg monarchs, desperate to raise revenues for their European campaigns. Frontier
democracy was replaced by the sale of Crown offices. As a result, ‘Spain’s legacy to Latin
America was a tradition of extreme centralisation in governmental decisionmaking’ (Nickson,
1995: 15). In the post-independence years, local government was neglected and ‘often suppressed
altogether’ (Ibid.). ‘Local governments had almost no power to tax or to administer local social
programs’ (Wiarda and Kline, 1996: 45).
Within each colonial empire, the colonies differed in type. Some—for instance, the North
American colonies and Australia—were settlement colonies, to which large numbers of
Europeans emigrated and either drove out or exterminated the aboriginal population. Others—
British colonies in what would become the US South, Brazil, the Caribbean—were plantation
colonies, in which natives or imported slaves were employed in agriculture by relatively small
European settler elites. Still others—Hong Kong, the Dutch colonies in Indonesia, Aden—were
essentially strategic or trade outposts, with surrounding populations mostly left to their own
devices. The type of institutions introduced is likely to have varied with the type of colony
(Acemoglu, Johnson, and Robinson, 2001). In particular, one might expect greater
decentralisation of colonial institutions—and, perhaps, of the states that followed
decolonisation—in colonies that had a larger proportion of European settlers.
Economic development
Fiscal decentralisation might tend to be higher in more economically developed countries for two
reasons. First, decentralisation may itself be ‘a superior good, the demand for which is likely to
grow with per capita income’ (Tanzi, 2000). As people become richer, more educated, and more
urbanised, they may have more time and a greater motivation to participate in making local
political decisions. They may also become more skilled at organising to pressure the central
government to devolve authority and fiscal resources.
9
Second, increases in development may induce a shift in tastes towards public goods and
services that are most efficiently provided locally. Musgrave (1969: 79) suggested that as
societies grow more affluent, an increasing share of private consumption ‘flows into ‘adult toys’
for leisure time use… pleasure cars, motorboats and other durables’ the operation of which
requires public investment and services—the building of ‘high-speed roads, marinas, parks, and
so forth’ or the organisation of ‘traffic patrols, park services, or weather reporting’. While
weather reporting probably involves significant economies of scale, the construction and
maintenance of marinas, parks, and local roads, as well as the organisation of traffic patrols can
efficiently occur at local or regional scale. As population density rises with urbanisation, the risks
of crime or accident may also rise at a disproportionate rate, requiring greater proportional public
spending on policemen, firemen, and health inspectors to achieve the same level of public safety.
There are no great economies of scale in any of these activities. As with some of the previous
arguments, this one suggests that decentralisation might become more efficient as income rises;
some more explicitly political argument would still be needed to explain why such efficiency
gains would be realized.
Democracy
Some have suggested there is a natural affinity between democracy and decentralisation. Central
democrats might wish to institute strong subnational governments for various reasons.
Participation in local government, as Tocqueville and Mill argued, might educate citizens in
democratic practices and values. Jefferson admired the fervor for liberty inspired by participation
in the New England townships. ‘Where every man is a sharer in the direction of his ward-
republic, or of some of the higher ones, and feels that he is a participator in the government of
affairs, not merely at an election one day in the year, but every day; when there shall not be a man
in the State who will not be a member of some one of its councils, great or small, he will let the
heart be torn out of his body sooner than his power be wrested from him by a Caesar or a

10
Bonaparte’ (Appleby and Ball, 1999: 205). At the same time, strong local governments might
serve as a check on abusive central authorities. Tocqueville (1969 [1835]: 263), concerned that
the central government could be captured by a tyrannical majority, saw municipal and county
governments as ‘so many hidden reefs retarding or dividing the flood of the popular will.’
More recently, the fall of authoritarian governments has led to either spontaneous
dissipation of central power or the deliberate assertion of local rights. Across Eastern Europe, the
collapse of regimes in which power was centralised in the communist party prompted a strong
demand for autonomous local self-government (World Bank, 2001). Burki, Perry, and Dillinger
(1999: 1) argue that decentralisation in Latin America since the early 1980s has been ‘part of a
broader trend toward democracy in the region.’
Federalism and decentralised political institutions
Federal constitutions may directly mandate a high level of fiscal decentralisation. The 1988
Brazilian constitution, for instance, requires that the states and municipalities receive 47 per cent
of income tax receipts and 10 per cent of receipts from the tax on industrial products (Article
159). Federal constitutions may also assign particular taxes entirely to state or local governments.
Even if constitutions do not dictate fiscal relations, they may provide political and institutional
leverage for state governments to press for a larger share of revenues. For instance, systems in
which the upper house of parliament represents regional governments and has a veto over
financial laws, as for instance in Germany, are likely to exhibit greater fiscal decentralisation.
The degree of fiscal decentralisation might also be affected by another political
institution—the party system. Riker (1964) argued that the degree of decisionmaking
centralisation in a federation will vary with the centralisation of the main parties. Garman,
Haggard, and Willis (2001: 206) develop this insight and apply it to fiscal decentralisation: ‘if
parties are more centralised, any bargaining over intergovernmental fiscal relations will favour
the center and the fiscal structure of the state will be more centralised. Conversely, if party

11
control is less centralised, the state's fiscal structure will also tend be more decentralised, other
things being equal.’
Data and methods
Data
How well do the various factors discussed in the previous section explain current crossnational
differences in fiscal decentralisation? I tried to assess this using multiple regressions. The main
dependent variables were measures of the subnational shares of state expenditures and of state
revenues, averaged for 1993-5. As will be seen, the results were generally similar whichever of
these was used, but there were some interesting differences.
Finding data on ethnic division posed a challenge. I used data compiled by Gunnemark
(1991) on the share of the population that spoke a language other than the official language at
home. I updated this to include the postcommunist states, almost all of which were excluded from
the Gunnemark data set, using data from a variety of sources.12 As a robustness check, I also used
the index of ethnolinguistic fractionalisation constructed from data compiled by a team of Soviet
anthropologists in the early 1960s, published in the Atlas Narodov Mira. This has been criticised
recently for (1) being out of date13, and (2) focusing on just one of many potentially salient
cultural divisions, while ignoring others such as religion, caste, and tribe. The Gunnemark data
are also subject to the second criticism, though not the first. Since no comprehensive,
crossnational accounting of which cultural cleavages were politically salient in different periods
exists, this was the best alternative available. For country size, I used both the log of countries’
surface area and the log of their 1994 population.
Dummies for colonial heritage were constructed from a variety of sources. I focus on the
period since the American Revolution, so countries that became independent before this are
coded as non-colonies. Ethiopia was coded a non-colony despite the relatively short Italian

12
occupation from 1935-41. If states were constructed from territories colonised by two powers, I
code them as .5 for each—e.g., Cameroon is .5 ‘former British colony’ and .5 ‘former French
colony’. If, on the other hand, a country underwent an extended period of colonisation by more
than one country (since 1775)—for instance, Mauritius, which was under French, then British
rule—it is coded as a former colony of each. Among British colonies, I distinguish three types,
following Fieldhouse: settlement colonies, the Indian states, and others.
To measure economic development, I use per capita GNP in purchasing power parity
terms, as of 1995, as calculated by the World Bank.14 In assessing the effect of democracy on
fiscal decentralisation, several specifications might be relevant. First, I used the Freedom House
ratings of countries’ political rights as of 1993-4. These scores, which range from 1 to 7, are
based on the estimates of experts, who rank countries on a checklist of specific aspects of
political freedom.15 I adjusted the data so that 7 corresponds to completely democratic and 1 to
completely authoritarian. Second, since the effect of democracy on fiscal decentralisation may be
gradual, I tried using a measure of the number of consecutive years that the country had been
democratic as of 1995, in the definition of Przeworski et al.16
Establishing which countries are federal is not an easy task.17 One might go by which
countries label themselves ‘federal’ or ‘federations’ in their constitutions. Alternatively, one
might follow the classification of scholars of federalism. A third option would be to apply an
authoritative definition of federalism. Using each approach, I arrived at a different—although
overlapping—list of states. Of 130 countries whose constitutions I studied, 21 had constitutions
that referred to the state as ‘federal’ (notably, not including the USA). The second option turned
out to be problematic because scholarly consensus on which states are federal does not seem to
exist. While Riker classified 18 states as federations, Wheare considered only four of these to be
federal (the US, Canada, Australia, and Switzerland) (Riker, 1964; Wheare, 1963). Elazar (1987)
singled out 19 states. Elazar (1995) listed 20. Some scholars insist that to be federal, a state must
be democratic (Stepan, 2001: 318). Others include authoritarian states such as Pakistan, or semi-

13
democracies such as Russia.18 Probably the most authoritative definition is that of Riker. Federal
states are those (1) that have (at least) two levels of government, and (2) in which each level has
‘at least one area of action in which it is autonomous.’ The latter requirement must be formally
guaranteed, for instance in a constitution (Riker, 1967). Strictly applying this definition, produced
a list of 27 countries in which the constitution assigned at least on policy area exclusively to
subnational governments, or gave subnational governments residual authority over policy areas
not assigned (Treisman, 2002). In the analysis below, I tried using three alternative variables for
federalism: (1) a dummy for the 21 whose constitutions called them ‘federal’, (2) a dummy for
the 20 classified as ‘federal’ by Elazar (1995), and (3) a dummy for the 27 that met the Riker
definition.
Using data from Tsebelis and Money, I constructed a dummy variable picking out the
eight countries that had upper houses of parliament that were chosen on a regional basis and
which could veto lower house financial legislation (Tsebelis and Money, 1997).19 I was not able
to find crossnational data for many countries on the centralisation of party systems, so I was not
able to test this hypothesis.
Method
Assessing the influence of these variables on the degree of fiscal decentralisation involved several
complications. Of the explanatory variables, only colonial history can be considered completely
exogenous. Some may influence each other—for instance, ethnic divisions are often thought to
affect the rate of growth and the prospects for democracy; country size may well influence
whether a given state is federal. Economic development may even be affected by fiscal
decentralisation itself; some have argued that decentralisation is a cause of more rapid growth
(Qian and Weingast, 1997).
My strategy was to run a series of regressions, starting with just the most notionally
exogenous geographical, ethnic, and historical variables, and gradually adding those relating to
14
political institutions and economic development that might be caused by these. By comparing
how coefficients change across models, it is possible to make some tentative inferences about
paths of causation. To adjust for the possible endogeneity of economic development, I ran a two
stage least squares model using countries’ latitudinal distance from the Equator as an instrument.
The criteria for a good instrument are that the variable is correlated with the relevant endogenous
independent variable and that it does not affect the dependent variable by any other path. Distance
from the Equator correlates with log 1995 per capita GNP at .52. I could not think of any way that
distance from the Equator would affect fiscal decentralisation other than via its effect on
economic development. Democracy (as of the 1990s) might also be affected by past levels of
political and fiscal decentralisation. I therefore ran two stage least squares models when
democracy was included, using a dummy for whether the country was a democracy as of 1950 as
an instrument for current democracy or for the number of years democratic since 1950. (The
correlations between the instrument and the two democracy variables were .50 and .69
respectively.)
A final methodological concern is that the subnational share of spending or revenues is
by construction censored: it cannot exceed 100 per cent or be lower than zero (Panizza, 1999).
This could render OLS inappropriate. However, since only one of the 66 cases in my data set took
the limit value (Singapore, which had subnational shares of zero), this seems unlikely to be a
problem in practice. To adjust for heteroskedasticity, I present White-corrected standard errors.
Results
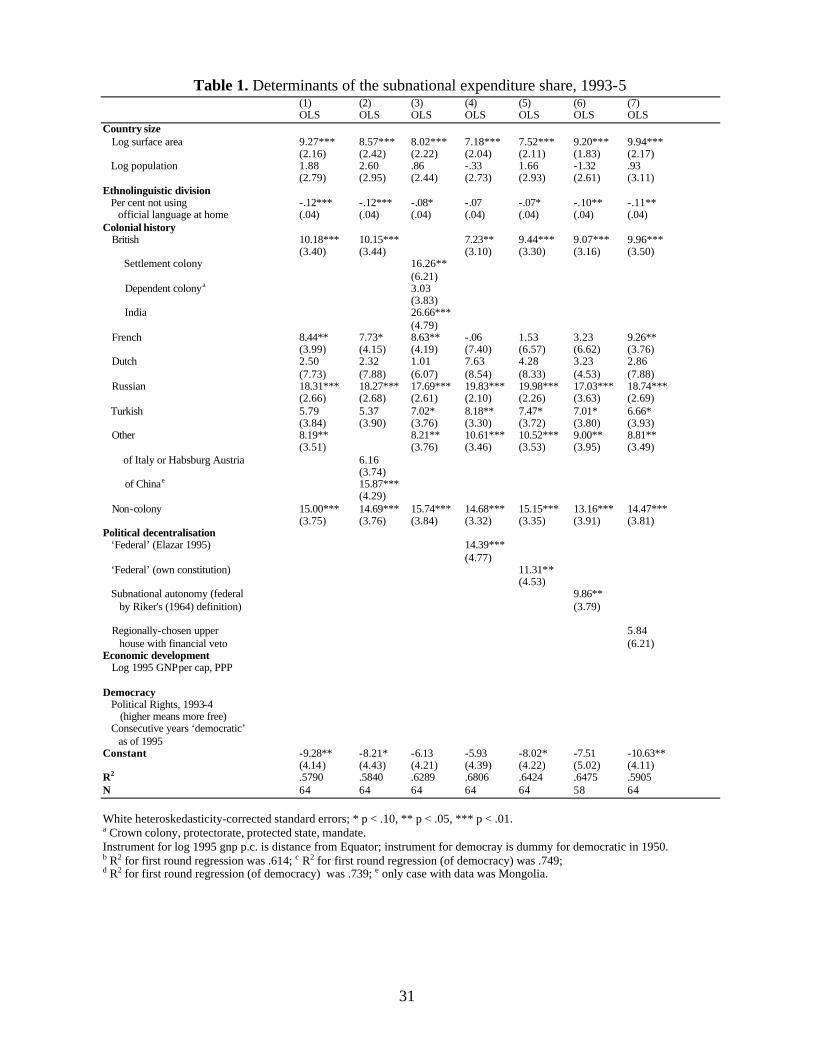
Tables 1 and 2 present the regressions. The results for country size were strong and consistent
across models. Territorially larger countries—but not necessarily more populous ones—tended to
be more fiscally decentralised. The result was highly significant whether fiscal decentralisation
was measured by the subnational expenditure or revenue share. The estimates imply that a tenfold
increase in surface area—the difference, say, between New Zealand and Argentina—is associated

15
with an increase in the subnational governments’ share of revenues by some 8-12 per centage
points, and in their share of expenditures by some 7-10 per centage points.
[TABLES 1 AND 2 HERE]
The results for ethnic division are interesting, and at first sight surprising. In the simplest
models, there is a significant negative relationship between ethnic division and fiscal
decentralisation, using either indicator. The greater the share of the population that did not speak
the official language at home, the lower was fiscal decentralisation. 20 Controlling for political
decentralisation reduces the relationship somewhat in some models. But an interesting change
occurs in the two stage least squares models that control properly for economic development:
now ethnic division has a positive effect, although not significant. The most plausible
interpretation is that greater ethnic division tends to slow economic development, while economic
development leads to greater fiscal decentralisation. 21 By slowing economic development—and
the fiscal decentralisation that tends to accompany it—ethnic divisions may delay the devolution
of power and resources that faster development brings.
The results suggest some clear relationships between decentralisation and colonial
history. The excluded category in the regressions is ‘former colony of Spain or Portugal’.
Controlling only for ethnolinguistic division and country size (models 1-3), former colonies of
Britain, France, and Russia, as well as countries never colonised in the modern era, were
significantly more decentralised than former Spanish or Portuguese colonies, using either
indicator. This was probably also true of former colonies of Italy or Habsburg Austria, although
the difference was not quite significant for expenditures. Former Dutch or Ottoman Turkish
colonies were not significantly different. The one former Chinese colony included—Mongolia—
had significantly greater expenditure—but not revenue—decentralisation. Some of the effects
were large. Controlling only for size and ethnic division, former Russian colonies had subnational

16
expenditure shares some 18 per centage points higher and subnational revenue shares some 16-17
points higher than former Spanish or Portuguese colonies. Countries not colonised (since 1775)
had subnational expenditures some 15 per centage points—and revenue shares 12-13 points—
higher. Former British colonies had expenditure shares some 10 points and revenue shares some
11 points higher. For former French colonies, the differences were about 8 and 7-8 points,
respectively. (Notice that, although former British colonies were more decentralised than former
French colonies, the difference was not as large as one might have expected from reading
Tocqueville. There would be a larger difference if one contrasted British settlement colonies such
as the USA and Canada with the average French colony, but the diversity of types of British
colonies brings the average down.) Thus, the results do support the notion that the former
possessions of Spain and Portugal are unusually centralised.
A surprising result was the robustly high and significant coefficient on the dummy for
‘former Russian colony’. The very large differences remained—and, in fact, increased—as I
added controls for federalism, development, and democracy. Was this a specifically Russian
phenomenon, or was a high level of fiscal decentralisation common to all postcommunist
countries? In fact the mean subnational expenditure shares for postcommunist and other states
were quite close—22.7 and 20.0 per cent, respectively—and the difference between them was not
significant. When I added a dummy for postcommunism to model 1, the coefficient on ‘former
Russian colony’ was virtually unchanged and remained highly significant; postcommunism was
not significant and had a negative sign.22 The overlap between ‘former Russian colony’ and
former members of the Soviet Union was extremely close, and it is likely that the high fiscal
decentralisation is a particularly Soviet inheritance. The only divergent cases were Finland (a
former Grand Duchy of the Russian Empire), Poland (which I coded as .5 for ‘former Russian
colony’, taking into account the partition with Prussia and Austria -Hungary), and Russia itself
(coded ‘not a colony’). One might note, however, that the fit was better with the Russian colony
variable than with a fomer Soviet Union dummy: when both were included in a regression,

17
‘former Russian colony’ remained significant at p < .01, while the former Soviet dummy was
insignificant. The data notwithstanding, it seemed to me implausible that histories of Russian rule
are why Finland and Poland are relatively decentralised today. High fiscal decentralisation
appears to be a distinctive legacy of Soviet rule.
Model 3 breaks down the British colonies into ‘settlement colonies’, ‘dependent
colonies’, and India.23 All three have positive signs, but here some interesting divergences emerge
between the correlates of expenditure and revenue decentralisation. Former settlement colonies
tended to have subnational expenditure shares some 16 per centage points higher than former
Spanish or Portuguese colonies.24 However, their revenues were on average only about 9 per
centage points higher, and the difference was not statistically significant. By contrast, former
British Crown colonies, protectorates, protected states, and mandates had expenditure shares
statistically indistinguishable from those of the former Spanish and Portuguese colonies; but their
revenue shares were some 11 per centage points higher (significant at p < .01). Thus, both
settlement and dependent colonies of Britain were more fiscally decentralised in at least one
regard. The most striking finding concerns India, which stands out as an extreme outlier on both
indicators. India had a rate of fiscal decentralisation some 24-27 per centage points higher than
one would expect in a former Spanish or Portuguese colony with the same size and ethnic
characteristics.25
Settlement colonies were far more common in the British than in other empires.
However, the rate at which Europeans settled varied across all the colonies (Acemoglu et al.,
2001). Were colonies in which Europeans made up a larger share of the population more likely to
have decentralised governments in the 1990s? Answering this is difficult given the sparsity of
reliable data. Acemoglu et al. provide some rough estimates of the share of European settlers in
the populations of various colonies as of 1900. These data were available for only 26 of the
countries for which I had fiscal data, so elaborate statistical analyses were not possible. However,
there was a correlation between the share of European settlers as of 1900 and the degree of fiscal
18
decentralisation in 1993-5 (.51 for expenditure share, and .59 for revenue share). Controlling for
country size the correlations were similar (.57 and .55, respectively). There are two possible
explanations for these correlations, and the weakness of the data makes it difficult to choose
between them. First, greater concentrations of European settlers might have led to a more
decentralised structure of administration in the colonies, which in turn led to greater
decentralisation in the post-colonial states. Second, greater concentrations of European settlers
might have led to better protections of property rights, which fueled faster growth, which in turn
increased pressures for decentralisation at a later date. Given the very small number of countries
for which data were available, these findings should be viewed with particular caution.
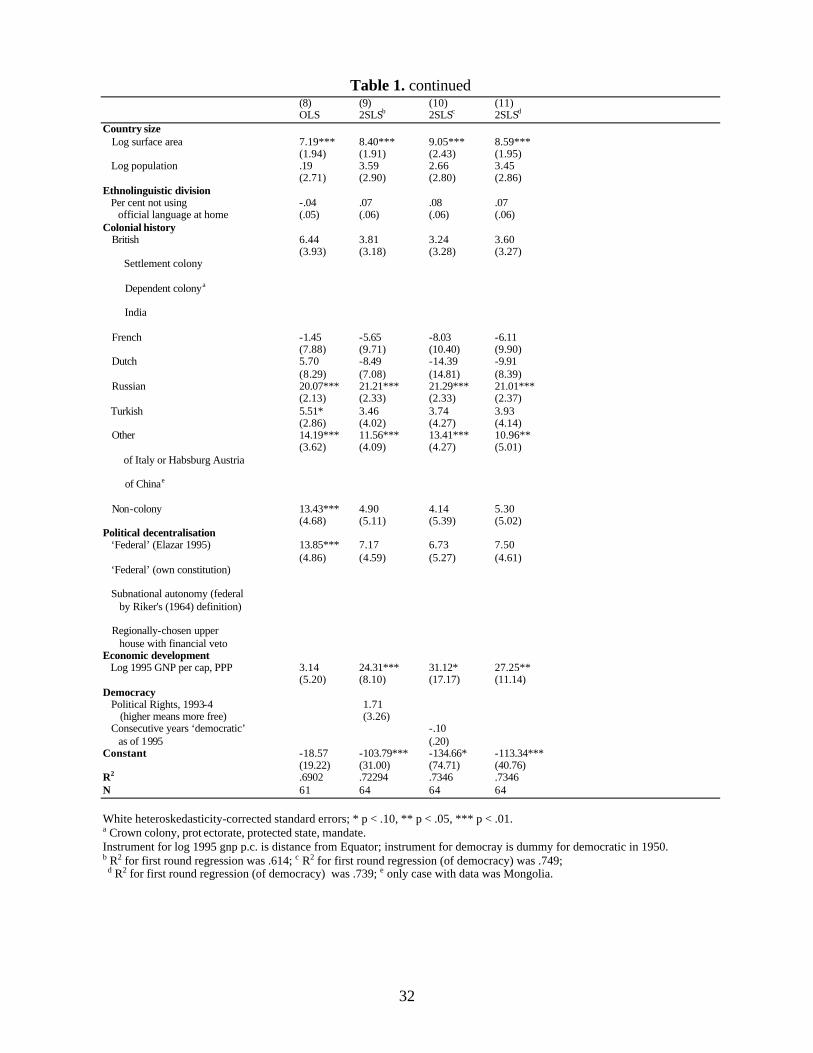
Why are the former colonies of some powers today more fiscally decentralised than those
of others? Observing how the coefficients change as additional variables are entered suggests
some hints about the causal pathway. In part, the former British colonies appear to be more
decentralised than former Spanish and Portuguese colonies because they tend to be more
economically developed. The British colony coefficient in the subnational expenditure
regressions falls from about 7 per centage points (model 4) to 3-4 points (models 9-11), when I
control properly for economic development. (The drop in the revenue decentralisation regressions
is from about 8 to about 6 per centage points.) The mean 1995 per capita GNP for former British
colonies was about $4,900 compared to $3,550 for former Spanish or Portuguese colonies. It is
harder to interpret the French colony effect. This effect became insignificant and the estimated
coefficients dropped when I controlled for federal structure or economic development. Since
former French colonies tended to be somewhat less developed and less likely to be federal than
Spanish or Portuguese colonies, this was surprising. The Turkish colony effect falls a bit as I
control for income, suggesting that in part the former Turkish colonies are more decentralised
than Spanish and Portuguese ones because they tend to be more developed (average 1995 per
capita GNP of $8,500 for the former, compared to $3,550 for the latter). Similarly, non-colonies’
19
greater fiscal decentralisation appears mostly due to their higher income—the coefficient falls
quite sharply controlling for economic development.
Federalism, by any of the three measures, was associated with greater fiscal
decentralisation, by either indicator. (In models 8-11, I use the Elazar classification, since this is
the most significant and does not require the dropping of cases.) However, the federal effect
dropped quite sharply (and became insignificant) once I controlled for economic development.
Federalism is more common among richer countries, which also tend to be more fiscally
decentralised.26 It is less clear to what extent the choice of political institutions independently
affects the division of fiscal tasks and resources. There was no evidence that merely having a
regionally-chosen upper house of parliament that could veto financial legislation increased fiscal
decentralisation (model 7). This does not seem to be why federations tend to be more
decentralised.27
The results for economic development are quite dramatic. In a simple OLS model, there
appears to be just about no relationship. However, in the two stage least squares models
(instrumenting with the country’s latidudinal distance from the equator), a very large effect
appears in the expenditure decentralisation regressions: for every ten-fold increase in per capita
GNP, a country tends to increase expenditure decentralisation by some 25 per centage points or
more. The estimated relationship between revenue decentralisation and income was weaker, and
not significant at conventional levels. Thus, while economic development is strongly associated
with greater decentralisation of government expenditures, the increased expenditures tend to be
paid for in part by higher central transfers as well as higher subnational revenues.28
Finally, neither indicator of democracy was significant in the two stage least squares
regressions controlling for income, for either measure of decentralisation. For countries at a given
level of income and political decentralisation, greater democracy is not significantly associated
with greater fiscal decentralisation. (This was also true if I left the federal variable out of the
analysis.) Nor did controlling for democracy cause major changes in the coefficients on colonial

20
history. Former colonies apparently did not differ in their levels of fiscal decentralisation because
their respective colonial heritages were more or less conducive to democracy.
To sum up, territorially larger—but not necessarily more populous—countries tend to be
more fiscally decentralised. Economic development appears to cause countries to increase their
expenditure decentralisation—but not always their revenue decentralisation. (The two stage least
squares results make it reasonable to talk of causation here, although the result could certainly
have other interpretations.) The smaller the share of their population speaking the official
language, the less fiscally decentralised countries tended to be. This was probably explained by
the lower average level of economic development in more linguistically divided countries.
Former colonies of Britain, France, and Russia, as well as countries that were not colonised in the
modern era, all tended to be more fiscally decentralised than former Spanish or Portuguese
colonies. In the cases of the British settlement colonies and the non-colonies, this was probably
due in part to their higher average level of development. The situation with French, Dutch, and
Turkish former colonies was harder to read from the data. India, Mongolia, and the former Soviet
republics stood out as extremely decentralised given their other characteristics. Federal states
were significantly more decentralised, but a considerable part of the difference is attributable to
the fact that federal states tend to be more economically developed. Finally, the degree or
duration of democracy did not seem to make a difference.
The result regarding economic development corresponds to various previous studies
(Oates, 1972; Panizza, 1999; Bird, 1995; Diaz-Cayeros, 2000), but is particularly strong since the
two stage least squares estimation corrects for endogeneity. The finding of an apparently greater
effect of economic development on expenditure than on revenue decentralisation corresponds to
that of Bird (1995). Various studies have also found a relationship with country size, although
sometimes with population rather than area. My results differ from previous studies in several
ways. I did not find a significant positive relationship between ethnic heterogeneity and fiscal
decentralisation, as some others have reported. This may be because I control for colonial history.

21
Looking for a relationship between ethnicity and decentralisation is complicated by the fact that
both are related to income. Given the paucity of reliable data, it is good to be cautious on this
question. I do find, like Oates, that federal states were more decentralised, but attribute a
significant part of this not to a direct relationship but to the fact that federal structure is more
common at higher income levels.
Decentralisation and democracy
The lack of any clear relationship between the level or duration of democracy and the degree of
fiscal decentralisation in a cross-section of countries was surprising. Observers have often linked
the major decentralisation reforms of the 1980s and 1990s to the ongoing ‘Third Wave’ of
democratisation. Is there any justification for the view that fiscal decentralisation is more
common in countries moving toward greater democracy?
To answer this question requires a more dynamic analysis than cross-sections can
provide. The Government Finance Statistics Yearbooks publish data on a number of countries
over the course of several decades. Up to about 1,400 country-years were available for both the
subnational revenue share and the subnational expenditure share. I tried running panel regressions
to see whether changes in the degree of democracy (as measured by Freedom House scores) led
to changes in the degree of fiscal decentralisation. I tried two formulations, one assuming that one
year changes in democracy were translated the following year into changes in decentralisation,
one looking at changes over five years. Specifically, I ran regressions of the form:
(1) Dt = a + bDt-2 + c(FHt-1 – FHt-2) + dFHt-2 and
(2) Dt = a + bDt-6 + c(FHt-1 – FHt-6) + dFHt-6
where D is fiscal decentralisation (either the subnational revenue or expenditure share) and FH is
the Freedom House score. I included a lag of the dependent variable to correct for
autocorrelation, so the results measure the effect of a prior change in democracy on the change in

22
the degree of decentralisation. Including the lagged dependent variable also controls for any
characteristics of the country that were essentially fixed as of the start of the period (e.g.,
geography, ethnic division, colonial origin, federalism, rough level of economic development).
Including the lagged Freedom House score as well as the recent change makes it possible to
distinguish the effects of the level of democracy from those of recent democratisation. One
should note that these regressions do not control in any way for endogeneity; if decentralisation
causes democratisation as well as the reverse, the results will be biased. I report panel corrected
standard errors, which are more accurate than those calculated by GLS (Beck and Katz 1995).
[TABLE 3 HERE]
Modeling with either a one-year or a five-year lag, I did find a marginally significant
relationship between democratisation and subsequent increases in the subnational expenditure
share. If we ignore concerns about endogeneity, this supports the view that democratisation leads
to expenditure decentralisation. However, the effect is tiny. A one-point increase in a country’s
democratisation rating (on Freedom House’s seven-point scale) leads to an increase in the
subnational expenditure share of just .27 per centage points within one year. A one-point increase
in democracy over the course of five years (from t-6 to t-1) leads to an increase in the expenditure
share of .35 per centage points (between t-6 and t). Thus, even a maximal 6-point
democratisation—from ‘pure authoritarianism’ to ‘pure democracy’—would increase a country’s
subnational expenditure share the next year by less than two per centage points (e.g. from 20 to
22 per cent of total government expenditures) and by slightly more than two per centage points
over a five-year period.
There was no significant relationship between democratisation and change in the
subnational governments’ share of revenues (in fact, although not significant, the coefficient
suggested a negative relationship.) These regressions did find a relationship between a higher

23
level of democracy and greater revenue decentralisation (suggesting that such a relationship may
have been stronger in other years between 1972 and 2000 than 1993-5, the years of the cross-
sectional regressions in Tables 1 and 2.) Still, here too, the effect appears very small. A ‘pure
democracy’ (with an adjusted FH score of 7) is predicted to have a subnational revenue share just
.60 to .84 per centage points greater than a ‘pure autocracy’ (with an adjusted score of 1).
In short, a higher level of democracy may be associated with a higher level of revenue
decentralisation and recent democratisation may also lead to an increase in expenditure
decentralisation. But in both cases, the estimated impact is tiny. These very weak relationships
are plotted in Figure 2. Looking at individual countries, some fit the expectation—as Spain cast
aside the Fanco era, it also shifted some 20 per cent of expenditures down to regions and
localities. But there are also cases of democratisers that centralised—e.g., Thailand. Among
countries where the level of democracy changed little in the last 20 years, some centralised by as
much as 13 per centage points (Sweden), while others decentralised (Mexico shifted about 7 per
centage points downward).29 Democratisation is neither a sufficient nor a necessary condition for
decentralisation.
In fact, it is easy to find examples of all four polar relationships between decentralisation
and democratisation (see Figure 3). Some countries, like Spain (Figure 3A), decentralised
expenditures as they democratised. Others, like Estonia (Figure 3B), reduced the subnational
expenditure share as they became more democratic. Yet others, like Belarus (Figure 3C),
decentralised expenditures as they became steadily more authoritarian. Finally, some, like
Zimbabwe in the late 1980s (Figure 3D), centralised expenditures as their governments became
more autocratic.
[FIGURES 2 AND 3 ABOUT HERE]

24
Conclusions and Discussion
Much of the literature on fiscal decentralisation has focused on normative questions—in
particular, how much decentralisation is consistent with efficiency. This paper sought to answer a
positive one: why do some countries have so much more decentralised fiscal systems than others?
Like several previous studies, I found that fiscal decentralisation tends to be greater in territorially
larger countries, in those with federal constitutions, and in those at higher levels of economic
development. As some writers have suggested, former British colonies—especially those where
more Britons settled—do tend to be relatively decentralised, while former Spanish and
Portuguese colonies tend to be relatively centralised.
Unlike certain previous studies, I did not find a positive relationship between ethnic
division and fiscal decentralisation. This might reflect the particular data I used, or the fact that I
control for colonial history. It may also reflect a more complicated interaction of decentralisation
with both ethnicity and economic development. If ethnic divisions slow economic growth, as
argued for instance by Easterly and Levine, this should reduce the decentralising pressures that
come with economic development, offsetting any direct effect that ethnicity has on politicians’
incentives to decentralise (Easterly and Levine, 1997). However, since there is little clear
evidence to support the common view that greater fiscal decentralisation reduces social tensions
in ethnically divided societies, it is not clear why we should expect political leaders in such
countries to decentralise at all.
I also found no relationship between the current degree of democracy in a country or the
number of years for which it had been democratic and fiscal decentralisation as of the early
1990s.30 Looking longitudinally instead of cross-sectionally, there was a very small positive
relationship between change in the degree of democracy and in the extent of fiscal
decentralisation between 1972 and 2000. Closer examination suggested possible reasons for some
of the patterns in the data. Federal states, former British colonies, and countries not colonised in
25
the modern era all tend to be relatively fiscally decentralised, in part, because they are on average
more economically developed.
Certain results merit further examination. The relationship between country size and
fiscal decentralisation emerges strongly from the data. But we do not have a compelling theory to
explain why this should be the case. Most theoretical analysis of this question has been
normative, showing that in larger countries greater fiscal decentralisation is likely to be more
efficient. But since decisions to decentralise result from bargaining between self-interested central
and local politicians, it is not clear why efficiency would tend to win the day. In larger countries,
the benefits to central officials of concentrating all public resources in their hands would seem to
be even greater than in smaller countries. To make sense of this result, we need a theory that
shows why local demands for more fiscal resources are more politically powerful when the
country’s territory is larger.
Economic development increases fiscal decentralisation. But it appears to increase
decentralisation of expenditures more than revenues. As a result, the relative size of center-region
transfers (or subnational borrowing) must tend to grow with income. This is the case in this data
set: the average excess of subnational expenditures over pre-tansfer revenues in countries with
1995 per capita GNP above $10,000 was 5.8 per cent of GDP in 1994; for countries with per
capita GNP below $10,000, the average was 2.8 per cent. By and large, it is rich countries that
have local governments that are the most heavily dependent on central transfers—for example,
Denmark with a pre-tranfers subnational deficit of some 14 per cent of GDP, the Netherlands
with 11 per cent of GDP, or Canada with 10 per cent.31 High vertical fiscal imbalance—the
difference between local revenues and expenditure responsibilities—is frequently faulted by
public finance specialists for reducing the accountability of those making expenditures.
Empirically—at least according to the Government Finance Statistics Yearbooks data—aggregate
imbalances appear to be a problem almost entirely of rich countries. There is a paradoxical
26
positive correlation between aggregate vertical fiscal imbalance and subjective indexes of the
quality of government.32
As interesting as the general findings were those about particular countries and regions
that bucked the trend. India is much more fiscally decentralised than one would expect, even
taking into account its vast size. Mongolia had far greater expenditure—but not revenue—
decentralisation than one might have predicted.33 And countries of the former Soviet Union had
on average nearly 20 per centage points more of spending and revenues at subnational levels than
former Spanish and Portuguese colonies of similar size and economic development. They were
also far more fiscally decentralised than other countries in general.34 This appears to reflect the
the legacy of fiscal practices in the pre-transition Soviet Union. Ironically, since budgeting was a
formality that merely implemented central plans, Moscow allowed a large share of budget
resources to be notionally assigned to republic and local levels. As of 1990, the USSR union
budget accounted for just 47 per cent of total expenditures and 45 per cent of total revenues
(Goskomstat SSSR, 1991: 17). Although data are hard to find, it is likely that resources were
officially quite decentralised within each union republic as well. The collapse of central power
turned the accounting fiction into a fiscal reality, creating 15 newly independent states with fiscal
structures far more decentralised than in most other countries at their levels of development.
These empirical findings raise intriguing questions. What are the political processes that
lead territoria lly larger states to decentralise fiscal resources? What, in such states, strengthens
local actors at the expense of central politicians? Are fiscal resources decentralised by the sheer
administrative difficulty of monitoring over large distances? Or, is the bargaining power of local
politicians greater in larger states? Does this have to do with the size of the subnational units
(perhaps units large enough to credibly threaten secession are better able to demand more fiscal
resources)? Does it relate to the path by which states were formed (if a weak center had to bargain
with regional barons, that might have created decentralisation from the start)? At this point, one
can only conjecture.

27
The association of economic development with decentralisation appears strong, once
reverse causation is taken into account. But the theoretical link is rather weak. Is there evidence
that the demand for subnational expenditure grows faster than the demand for central expenditure
as income rises? If so, why are central officials motivated to meet such demands even when it
means giving up resources? Independent of democracy or other aspects of the political regime,
does economic development strengthen subnational political elites relative to central ones? And
why does the reverse causal path appear so powerful? Have countries that were fiscally
decentralised in the past grown much faster or slower than others?
Finally, if accountability is best preserved by locating revenue-raising and spending
decisions at the same level, it is odd to see this principle systematically violated in many
industrialised countries (in which local governments depend heavily on central transfers). Why do
such problems have so little notable effect on the quality of government? The Scandinavian
countries, Canada, Australia, and the Netherlands all have high aggregate vertical imbalances in
this sense. Yet they have among the most honest and effective governments in the world. These
questions await further research.
28
I am grateful for research support from the John Simon Guggenheim Foundation, the German Marshall Fund of the USA, and the UCLA Academic Senate.
FOOTNOTES
1 Two important exceptions are Panizza (1999) and Garman, Haggard, and Willis (2001). An ealier
discussion occurs in Oates (1972).
2 Figures are averages for 1993-5. The dataset for the analysis in this chapter was constructed from the
IMF’s Government Finance Statistics Yearbooks as presented in a dataset comp iled by the World Bank. It
included 66 countries for subnational expenditures and 65 for subnational revenues. This is a relatively
small number, and this renders conclusions somewhat tenative.
3 Ebel and Yilmaz (2002); see also Bird (2000).
4 Some arguments about the consequences of decentralisation apply to decisionmaking, others to the
location of fiscal resources. For example, in discussing corruption it is often the latter that matters. Corrupt
actions often occur in the implementation of spending or taxation decisions rather than in the
decisionmaking stage, so the relevant type of decentralisation will be that related to actual spending or
taxation.
5 See, for instance, Hechter (2000).
6 Ethnic groups need to be compactly located; externalities between subnational units and diseconomies of
scale must not be too great.
7 It is also the logic that, in Alesina and Spolaore’s (1997) model of public good provision and spatially
differentiated tastes, leads large states to disintegrate as lower international trade barriers reduce the advantages
to regions of staying politically united. The advantages of narrowly differentiated baskets of local public goods
come to loom larger. However, as Montesquieu (1989 [1748]) first noted, there is no need for states to
disintegrate if they can just decentralise certain functions.
8 See the discussion of the ‘uniformity assumption’ in (Breton, 2000).
9 The relevant type of ‘largeness’ could be either population or territory.
29
10 Of the 167 countries in my data set, 142 were colonies at some point in the period since the American
Revolution, which I take as an arbitrary dividing point. (I do classify the US as a fomer British colony.)
11 See Riker (1964), Elazar (1987). Others have emphasised the diversity of forms of rule within the British
Empire, ranging from the relatively autonomous settlement colonies to certain highly centralised and
dependent Crown colonies. Major changes also occurred over time (see, e.g., Fieldhouse (1982)).
12 Primarily, the CIA’s World Factbook 1996, and the Ethnologue database at
http://www.sil.org/ethnologue/.
13 Linguistic divisions are not completely exogenous to political processes, as is usually assumed. ‘Take the
case of Somalia. At independence, Isaaqs (from former British Somaliland) and Hawiyes (from former
Italian Somalia) insisted they spoke the same language, and any survey of linguistic diversity undertaken at
the time would have reflected this. In recent years, however, Isaaqs have begun consciously differentiating
their speech forms from those of the Hawiyes as part of an attempt to justify recognition for their
secessionist republic—much as Croat and Serb intellecturals and linguists have done over the past fifteen
years in the Balkans’ (Posner and Laitin, 2001: 14).
14 I use 1995 data because choosing an earlier year would require dropping many cases due to lack of data.
Economic development is clearly endogenous; as discussed below, I run a two stage least squares model.
15 For more details, see http://freedomhouse.org/research/freeworld/2000/methodology2.htm.
16 In this definition, a country is democratic if: (1) the chief executive is elected, (2) the legislature (at least
its lower house) is elected, (3) more than one party contests elections, and (4) during the last three elections
of a chief executive there has been at least one turnover of power between parties (see Przeworski, Alvarez,
Cheibub, and Limongi, 2000). Note that the definition focuses exclusively on the contested election of
governments. Under this definition, a country remains ‘democratic’ even if the leader imposes a state of
emergency and suspends civil and political rights (as did Indira Gandhi between 1975 and 1977) so long as
that leader was elected and does not violate or change the rules on holding new elections and leaving office.
The 1975 Indian state of emergency was approved by both houses of the legislature. Mrs. Gandhi did call
elections in 1977, and left power constitutionally when she lost. By contrast, when a leader, e.g. President
Park in Korea, unconstitutionally changes the rules for selection of political officials, then that regime is
classified as not democratic.

30
17 For a discussion, see Treisman (2002).
18 Riker (1967: 140) asserts that ‘a number of federalisms simultaneously have been dictatorships’.
19 Note that this included upper houses that were elected on a regional basis as well as those in which
regional governments themselves chose representatives to the upper house.
20 I tried also running this regression using the Atlas Narodov Mira ethnolinguistic fractionalisation index
instead. This required dropping all the post-Soviet countries and reduced the number of cases from 64 to
47. The coefficient on fractionalisation was still negative though not significant (-.06, with standard error
.11 in the subnational expenditure regression).
21 The latter finding is borne out by the data; see below. In this data set, the ethnolinguistic division variable
was negatively correlated with log 1995 per capita GNP at -.51.
22 This was true using either the subnational expenditure or revenue share.
23 Fiscal data were not available for any of the other countries formed fro m what was British India—
Pakistan, Bangladesh, and Sri Lanka.
24 The ‘settlement colonies’ were Australia, Canada, Ireland, New Zealand, South Africa (coded .5 to take
into account the large Dutch influence), and the USA.
25 In part, this is probably explained by India’s federal status—the coefficient falls to about 19 controlling
for this. However, controlling for income (using 2SLS) increases the coefficient again. Given its low
income, India’s fiscal decentralisation is all the more surprising.
26 Among countries with 1995 per capita GNP above $10,000, every fourth country was a federation;
among those with incomes below this threshold, only about one in ten was a federal state.
27 In any case, this feature is not distinctive to federations. The eight countries I identified whose
constitutions give a regionally chosen upper house this right were the Dominican Republic, Germany,
Haiti, Italy, Liberia, the Netherlands, Switzerland, and the USA. Of these, only Germany, the USA, and
Switzerland are usually considered federations.
28 Bird also found in an empirical study that on average local governments in the industrialised countries
financed a smaller share of their expenditures with own resources than local governments in the developing
countries (see Bird (1995) and the discussion in Bird and Vaillancourt (1998)).

31
29 These figures are for the period 1975-95. One might contend that there were small movements in the
direction of greater political freedom in Mexico during these years, perhaps too small to merit a one-point
jump in the Freedom House score.
30 Panel regressions suggest there might be a very weak relationship between democratisation and the level
of revenue decentralisation in some other years.
31 This refers to the average. There are certainly some subnational governments in many developing
countries that are heavily dependent on central transfers. Note also that there is greater variance among
high income countries. Some rich countries—New Zealand, Iceland, for instance—had pre-transfer
subnational aggregate deficits of less than 3 per cent of GDP.
32 For instance, scholars at the World Bank calculated an index of ‘graft’ for about 150 countries in the late
1990s, based on aggregating various subjective ratings (see Kaufmann, Kraay, and Zoido-Lobaton, 1999).
This correlates at r = -.49 with the aggregate subnational deficit (i.e., countries with larger subnational
deficits are less corrupt). More surprisingly, the correlation was still -.43 and highly significant controlling
for income. The aggregate subnational deficit may not reflect the fiscal imbalance in the average region,
however. Even if the aggregate subnational deficit is low, there may be a high level of interregional
redistribution (some regions run large deficits, others export large surpluses).
33 China was also an outlier, with a far greater decentralisation level than predicted.
34 Running two state least squares models similar to model 10, but leaving out all colonial variables except
for ‘former Russian colony’, I estimate a former Russian colony effect of about 20 percentage points for the
subnational expenditure share and about 17 points for the subnational revenue share.
31
Table 1. Determinants of the subnational expenditure share, 1993-5 (1) (2) (3) (4) (5) (6) (7) OLS OLS OLS OLS OLS OLS OLS Country size Log surface area 9.27*** 8.57*** 8.02*** 7.18*** 7.52*** 9.20*** 9.94*** (2.16) (2.42) (2.22) (2.04) (2.11) (1.83) (2.17) Log population 1.88 2.60 .86 -.33 1.66 -1.32 .93 (2.79) (2.95) (2.44) (2.73) (2.93) (2.61) (3.11) Ethnolinguistic division Per cent not using -.12*** -.12*** -.08* -.07 -.07* -.10** -.11** official language at home (.04) (.04) (.04) (.04) (.04) (.04) (.04) Colonial history British 10.18*** 10.15*** 7.23** 9.44*** 9.07*** 9.96*** (3.40) (3.44) (3.10) (3.30) (3.16) (3.50) Settlement colony 16.26** (6.21) Dependent colonya 3.03 (3.83) India 26.66*** (4.79) French 8.44** 7.73* 8.63** -.06 1.53 3.23 9.26** (3.99) (4.15) (4.19) (7.40) (6.57) (6.62) (3.76) Dutch 2.50 2.32 1.01 7.63 4.28 3.23 2.86 (7.73) (7.88) (6.07) (8.54) (8.33) (4.53) (7.88) Russian 18.31*** 18.27*** 17.69*** 19.83*** 19.98*** 17.03*** 18.74*** (2.66) (2.68) (2.61) (2.10) (2.26) (3.63) (2.69) Turkish 5.79 5.37 7.02* 8.18** 7.47* 7.01* 6.66* (3.84) (3.90) (3.76) (3.30) (3.72) (3.80) (3.93) Other 8.19** 8.21** 10.61*** 10.52*** 9.00** 8.81** (3.51) (3.76) (3.46) (3.53) (3.95) (3.49) of Italy or Habsburg Austria 6.16 (3.74) of Chinae 15.87*** (4.29) Non-colony 15.00*** 14.69*** 15.74*** 14.68*** 15.15*** 13.16*** 14.47*** (3.75) (3.76) (3.84) (3.32) (3.35) (3.91) (3.81) Political decentralisation ‘Federal’ (Elazar 1995) 14.39*** (4.77) ‘Federal’ (own constitution) 11.31** (4.53) Subnational autonomy (federal 9.86** by Riker's (1964) definition) (3.79) Regionally-chosen upper 5.84 house with financial veto (6.21) Economic development Log 1995 GNP per cap, PPP Democracy Political Rights, 1993-4 (higher means more free) Consecutive years ‘democratic’ as of 1995 Constant -9.28** -8.21* -6.13 -5.93 -8.02* -7.51 -10.63** (4.14) (4.43) (4.21) (4.39) (4.22) (5.02) (4.11) R2 .5790 .5840 .6289 .6806 .6424 .6475 .5905 N 64 64 64 64 64 58 64 White heteroskedasticity-corrected standard errors; * p < .10, ** p < .05, *** p < .01. a Crown colony, protectorate, protected state, mandate. Instrument for log 1995 gnp p.c. is distance from Equator; instrument for democray is dummy for democratic in 1950. b R2 for first round regression was .614; c R2 for first round regression (of democracy) was .749; d R2 for first round regression (of democracy) was .739; e only case with data was Mongolia.
32
Table 1. continued (8) (9) (10) (11) OLS 2SLSb 2SLSc 2SLSd Country size Log surface area 7.19*** 8.40*** 9.05*** 8.59*** (1.94) (1.91) (2.43) (1.95) Log population .19 3.59 2.66 3.45 (2.71) (2.90) (2.80) (2.86) Ethnolinguistic division Per cent not using -.04 .07 .08 .07 official language at home (.05) (.06) (.06) (.06) Colonial history British 6.44 3.81 3.24 3.60 (3.93) (3.18) (3.28) (3.27) Settlement colony Dependent colonya India French -1.45 -5.65 -8.03 -6.11 (7.88) (9.71) (10.40) (9.90) Dutch 5.70 -8.49 -14.39 -9.91 (8.29) (7.08) (14.81) (8.39) Russian 20.07*** 21.21*** 21.29*** 21.01*** (2.13) (2.33) (2.33) (2.37) Turkish 5.51* 3.46 3.74 3.93 (2.86) (4.02) (4.27) (4.14) Other 14.19*** 11.56*** 13.41*** 10.96** (3.62) (4.09) (4.27) (5.01) of Italy or Habsburg Austria of Chinae Non-colony 13.43*** 4.90 4.14 5.30 (4.68) (5.11) (5.39) (5.02) Political decentralisation ‘Federal’ (Elazar 1995) 13.85*** 7.17 6.73 7.50 (4.86) (4.59) (5.27) (4.61) ‘Federal’ (own constitution) Subnational autonomy (federal by Riker's (1964) definition) Regionally-chosen upper house with financial veto Economic development Log 1995 GNP per cap, PPP 3.14 24.31*** 31.12* 27.25** (5.20) (8.10) (17.17) (11.14) Democracy Political Rights, 1993-4 1.71 (higher means more free) (3.26) Consecutive years ‘democratic’ -.10 as of 1995 (.20) Constant -18.57 -103.79*** -134.66* -113.34*** (19.22) (31.00) (74.71) (40.76) R2 .6902 .72294 .7346 .7346 N 61 64 64 64 White heteroskedasticity-corrected standard errors; * p < .10, ** p < .05, *** p < .01. a Crown colony, prot ectorate, protected state, mandate. Instrument for log 1995 gnp p.c. is distance from Equator; instrument for democray is dummy for democratic in 1950. b R2 for first round regression was .614; c R2 for first round regression (of democracy) was .749;
d R2 for first round regression (of democracy) was .739; e only case with data was Mongolia.

33
Table 2. Determinants of the subnational revenue share, 1993-5 (1) (2) (3) (4) (5) (6) (7) OLS OLS OLS OLS OLS OLS OLS Country size Log surface area 10.81*** 11.04*** 11.51*** 8.72*** 8.83*** 9.81*** 11.39*** (1.78) (2.08) (2.01) (1.82) (1.82) (1.83) (1.80) Log population -1.45 -1.68 -2.92 -2.99 -1.29 -2.41 -2.26 (2.32) (2.59) (2.46) (2.72) (2.56) (2.59) (2.67) Ethnolinguistic division Per cent not using -.10** -.10** -.11*** -.05 -.05 -.07* -.09** official language at home (.04) (.04) (.03) (.04) (.04) (.04) (.04) Colonial history British 10.91*** 10.94*** 8.10*** 10.04*** 9.14*** 10.78*** (3.09) (3.13) (2.90) (3.10) (3.22) (3.12) Settlement colony 9.27 (5.88) Dependent colonya 11.04*** (2.57) India 24.19*** (4.36) French 7.17** 7.39** 7.87** -.28 .25 3.22 7.86** (3.33) (3.48) (3.75) (6.86) (6.19) (5.76) (3.16) Dutch -6.62 -6.55 -3.86 -2.34 -5.03 -6.99 -6.30 (4.00) (4.07) (3.89) (4.86) (4.56) (4.45) (4.21) Russian 16.72*** 16.73*** 16.41*** 18.30*** 18.70*** 16.70*** 17.10*** (2.34) (2.36) (2.41) (2.05) (2.11) (3.25) (2.40) Turkish 1.33 1.46 1.33 3.62* 3.24 3.10 2.08 (2.27) (2.31) (2.33) (2.03) (2.08) (2.57) (2.41) Other 5.15** 4.69* 7.39*** 7.67*** 6.84** 5.72** (2.52) (2.69) (2.02) (2.13) (2.87) (2.67) of Italy or Habsburg Austria 5.66** (2.62) of Chinae 2.84 (4.05) Non-colony 12.64*** 12.73*** 12.69*** 12.49*** 12.97*** 11.74*** 12.22*** (3.56) (3.53) (3.69) (3.21) (3.05) (3.77) (3.52) Political decentralisation ‘Federal’ (Elazar 1995) 12.69** (5.40) ‘Federal’ (own constitution) 11.43** (4.68) Subnational autonomy (federal 7.98* by Riker's (1964) definition) (4.03) Regionally-chosen upper 4.87 house with financial veto (6.76) Economic development Log 1995 GNP per cap, PPP Democracy Political Rights, 1993-4 (higher means more free) Consecutive years ‘democratic’ as of 1995 Constant -13.04*** -13.37*** -12.76*** -10.16** -11.93*** -12.07** -14.20*** (3.61) (3.87) (4.05) (4.14) (3.65) (4.51) (3.62) R2 .6113 .6118 .6247 .7030 .6861 .6421 .6208 N 63 63 63 63 63 59 63 White heteroskedasticity-corrected standard errors; * p < .10, ** p < .05, *** p < .01. Instrument for log 1995 gnp p.c. is distance from Equator; instrument for democray is dummy for democratic in 1950. a Crown colony, protectorate, protected state, mandate; b R2 for first round regression was .614; c R2 for first round regression (of democracy) was .749; d R2 for first round regression (of democracy) was .739 e only case with data was Mongolia

34
Table 2. continued (8) (9) (10) (11) OLS 2SLSb 2SLSc 2SLSd Country size Log surface area 8.63*** 9.24*** 9.70*** 9.49*** (1.91) (1.80) (2.14) (1.98) Log population -3.26 -.75 -1.54 -.72 (2.41) (2.55) (1.94) (2.62) Ethnolinguistic division Per cent not using -.06 .03 .02 0.2 official language at home (.05) (.05) (.06) (.06) Colonial history British 8.61** 5.99* 5.64 5.92 (3.52) (3.15) (3.62) (3.79) Settlement colony Dependent colonya India French .32 -3.38 -5.31 -3.84 (7.70) (8.38) (8.98) (9.49) Dutch -1.23 -11.05** -15.53 -13.09* (4.27) (5.25) (10.41) (7.31) Russian 18.09*** 18.98*** 18.85*** 18.55*** (2.12) (2.18) (2.15) (2.14) Turkish 4.52** 1.05 1.41 .75 (2.20) (3.02) (2.94) (3.49) Other 7.12*** 7.70*** 8.74** 6.14** (2.58) (2.12) (3.39) (2.49) of Italy or Habsburg Austria of Chinae Non-colony 13.17*** 7.16 6.65 7.41 (4.38) (5.38) (5.97) (5.94) Political decentralisation ‘Federal’ (Elazar 1995) 13.03** 8.93 8.72 8.95 (5.26) (5.57) (6.12) (5.89) ‘Federal’ (own constitution) Subnational autonomy (federal by Riker's (1964) definition) Regionally-chosen upper house with financial veto Economic development Log 1995 GNP per cap, PPP -1.73 12.96 18.08 16.85 (4.53) (8.37) (13.19) (11.83) Democracy Political Rights, 1993-4 1.40 (higher means more free) (2.15) Consecutive years ‘democratic’ -.12 as of 1995 (.19) Constant -3.05 -62.10* -85.29 -74.87* (16.80) (32.32) (55.99) (44.13) R2 .6954 .7187 .7204 .7204 N 60 63 62 62 White heteroskedasticity-corrected standard errors; * p < .10, ** p < .05, *** p < .01. Instrument for log 1995 gnp p.c. is distance from Equator; instrument for democray is dummy for democratic in 1950. a Crown colony, protectorate, protected state, mandate; b R2 for first round regression was .614; c R2 for first round regression (of democracy) was .749; d R2 for first round regression (of democracy) was .739 e only case with data was Mongolia

35
Table 3. Democratisation and decentralisation, panel regressions (1) (2) (3) (4) Expenditure
share Expenditure
share Revenue share
Revenue share
Dependent variable t–2 .99***
(.01) .99***
(.01)
Dependent variable t–6 .97*** (.01)
.99*** (.01)
Freedom House score t–2 .06 (.04)
.10** (.04)
Change in Freedom House score t–2 to t–1
.27* (.15)
-.07 (.14)
Freedom House score t–6 .18** (.08)
.14*** (.04)
Change in Freedom House score t–6 to t–1
.35* (.20)
-.20 (.19)
Constant .37* (.21)
1.06*** (.33)
.49*** (.16)
.77*** (.23)
R2 .98 .94 .97 .95 Number of observations 1170 836 1177 834 Number of countries 88 71 91 72
Panel corrected standard errors in brackets; sigma computed by pairwise selection. *** p < .01, ** p < .05, * p < .10. Freedom House scores adjusted so that higher scores indicate more democratic government.

36
Figure 1. Fiscal decentralisation in the early 1990s
Subnational revenue share 1993-5 (%)
706050403020100-10
Sub
natio
nal e
xpen
ditu
re s
hare
199
3-5
(%)
70
60
50
40
30
20
10
0
-10
ZIM
USA
UK
TT
THA
SWI
SWESPA
SLV
SIN
SAF
RUS
ROMPOR
POL
PHI
PER
PARPAN
NOR
NICNZ
NET
MON
MOLMEX
MAU
MLYLUX
LIT
LAT
KEN
ITA
ISR
IRE
IDO
IND
ICEHUN
GUA
GER
FRA
FIN
FIJ
EST
DR
DEN
CZE
CRO
CR
CHI
CHL
CAN
BUL
BRA
BOL
BEL
BLR
BHR
AZE
AUT
AUS ARG
ALB
Source: IMF, Government Finance Statistics Yearbooks, various years, as collected in World Bank fiscal indicators database. Subnational share is (local + state)*100/(local + state + central).
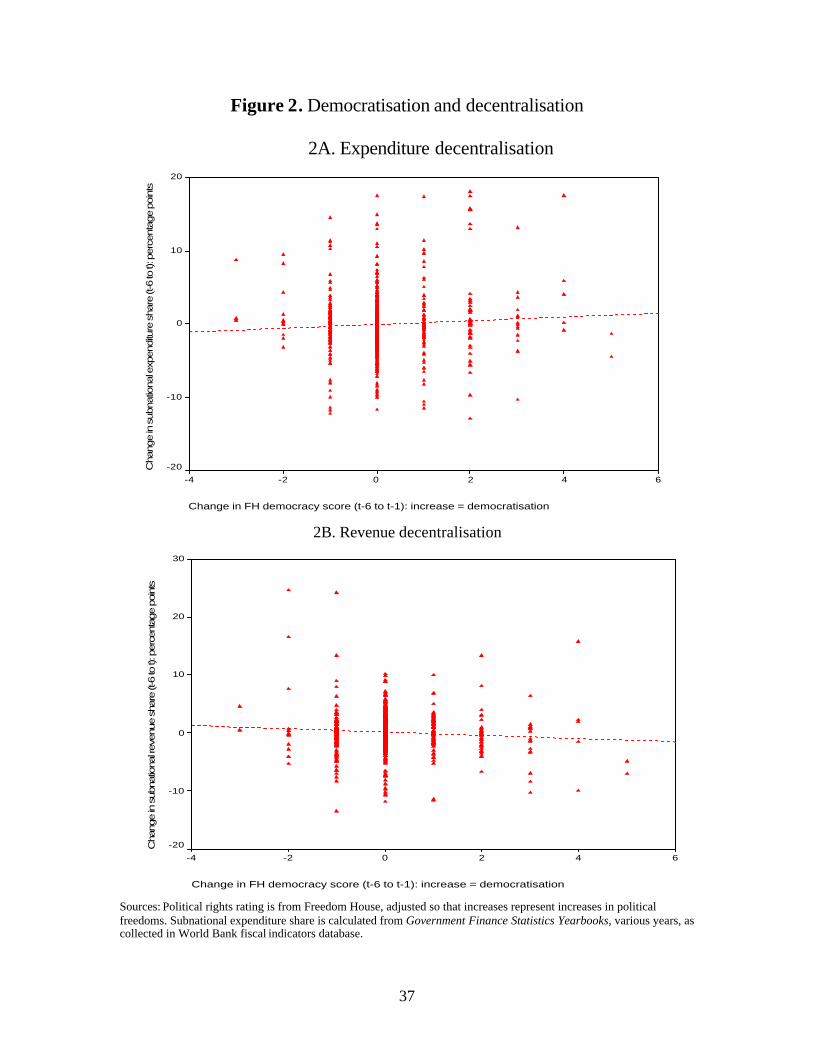
37
Figure 2. Democratisation and decentralisation
2A. Expenditure decentralisation
Change in FH democracy score (t-6 to t-1): increase = democratisation
6420-2-4
Cha
nge
in s
ubna
tiona
l exp
endi
ture
sha
re (t
-6 to
t): p
erce
ntag
e po
ints
20
10
0
-10
-20
2B. Revenue decentralisation
Change in FH democracy score (t-6 to t-1): increase = democratisation
6420-2-4
Cha
nge
in s
ubna
tiona
l rev
enue
sha
re (t
-6 to
t): p
erce
ntag
e po
ints
30
20
10
0
-10
-20
Sources: Political rights rating is from Freedom House, adjusted so that increases represent increases in political freedoms. Subnational expenditure share is calculated from Government Finance Statistics Yearbooks, various years, as collected in World Bank fiscal indicators database.

38
Figure 3A. Democratisation and Decentralisation: Spain
0
1
2
3
4
5
6
7
8
1975 1976 1977 1978 1979 1980 1981 1982 1983 1984 1985
Po
litic
al r
igh
ts
0
5
10
15
20
25
Per
cen
t of
GD
P
subnational expenditure share
political rights (maximum 7)
Figure 3B: Democratisation and Centralisation: Estonia
0
1
2
3
4
5
6
7
8
1991 1992 1993 1994 1995 1996 1997 1998 1999
Po
litic
al r
igh
ts
0
5
10
15
20
25
30
35
Per
cen
t of
GD
P
subnational expenditure share
political rights (maximum 7)

39
Figure 3C: Increasing Authoritarianism and Decentralisation: Belarus
0
1
2
3
4
5
6
7
8
1992 1993 1994 1995 1996 1997 1998 1999
Po
litic
al r
igh
ts
0
5
10
15
20
25
30
35
40
45
Per
cen
t of
GD
P
subnational expenditure share
political rights (maximum 7)
Figure 3D: Increasing Authoritarianism and Centralisation: Zimbabwe
0
1
2
3
4
5
6
7
8
1985 1986 1987 1988 1989 1990 1991
Po
litic
al r
igh
ts
0
5
10
15
20
25
30
Per
cen
t of
GD
P
subnational expenditure share
political rights (maximum 7)
40
References
Acemoglu, D., Johnson, S., & Robinson, J. (2001) The Colonial Origins of Comparative Economic Development: An Empirical Investigation, American Economic Review, 91(5) (December), pp. 1369-1401. Aleman, E., & Treisman, D., (2005) Fiscal Politics in ‘Ethnically-Mined’, Developing, Federal States: Central Strategies and Secessionist Violence, in: P. Roeder & D. Rothchild (Eds) Sustainable Peace: Power and Democracy After Civil Wars, pp. 173-216 (Ithaca: Cornell University Press). Alesina, A. & Spolaore, E. (1997) On the Number and Size of Nations, Quarterly Journal of Economics 112(4) (November), pp. 1027-56. Appleby, J. & Ball, T. (Eds.) (1999) Jefferson: Political Writings (New York: Cambridge University Press). Bardhan, P. & Mookherjee, D. (2000) Capture and Governance at Local and National Levels, American Economic Review, 90(2) (May), pp. 135-9. Beck, N. & Katz, J.N. (1995) What to Do (and Not to Do) with Time-Series-Cross-Section Data, American Political Science Review, 89(3) (September), pp. 634-47. Bird, R. M. (1995) Financing Local Services: Patterns, Problems, and Possiblities (Toronto: University of Toronto Press). Bird, R. M. (2000) Fiscal Decentralisation and Competitive Governments, in: G. Galeotti, P. Salmon, & R. Wintrobe (Eds) Competition and Structure: The Political Economy of Collective Decisions: Essays in Honor of Albert Breton, pp. 129-49 (New York: Cambridge University Press). Bird, R. M. & Vaillancourt, F. (1998) Fiscal Decentralisation in Developing Countries: An Overview, in: R. Bird & F. Vaillancourt (Eds) Fiscal Decentralisation in Developing Countries, pp. 1-48 (New York: Cambridge University Press). Breton, A. (2000) An Introduction to Decentralisation Failure (Washington, DC: IMF). Burki, S., Perry, G. & Dillinger, W. (1999) Beyond the Center: Decentralising the State (Washington, DC: World Bank). Diaz-Cayeros, A. (2000) Decentralisation of Taxation and Expenditure: A Latin American Phenomenon? (Stanford University: unpublished paper). Easterly, W. & Levine, R. (1997) Africa’s Growth Tragedy: Policies and Ethnic Divisions, Quarterly Journal of Economics, 112(4) (December), pp. 1203-50. Ebel, R. D. & Yilmaz, S. (2002) On the Measurement and Impact of Fiscal Decentralisation (Washington, DC: World Bank).
41
Elazar, D. J. (1987) Exploring Federalism (Tuscaloosa: University of Alabama Press). Elazar, D. J. (1995) From Statism to Federalism: A Paradigm Shift, Publius, 25(2) (Spring), pp. 5-18. Fieldhouse, D.K. (1982) The Colonial Empires: A Comparative Survey From the Eighteenth Century, 2nd Edition (London: Macmillan). Garman, C., Haggard, S. & Willis, E. (2001) Fiscal Decentralisation: A Political Theory with Latin American Cases, World Politics, 52(2), pp. 205-36. Goskomstat SSSR. (1991) Narodnoe khoziaistvo SSSR v 1990 g. (Moscow: Finansi i Statistika). Gunnemark, E. V. (1991) Countries, Peoples and Their Languages: the Linguistic Handbook (Gothenburg, Sweden: Lanstryckeriet). Hechter, M. (2000) Containing Nationalism (New York: Oxford University Press). Kaufmann, D., Kraay, A. & Zoido-Lobaton, P. (1999) Aggregating Governance Indicators (Washington DC: The World Bank). Lijphart, A. (1977) Democracy in Plural Societies: A Comparative Exploration (New Haven: Yale University Press). Lijphart, A. (1993) Consociational Democracy, in: J. Krieger (Ed) The Oxford Companion to Politics of the World (New York: Oxford University Press). Mill, J.S. (1991) On Representative Government, in: J. Gray (Ed) John Stuart Mill: On Liberty and Other Essays (New York: Oxford University Press). Montesquieu, C. (1989 [1748]) L’esprit des lois, translated and edited by A. Cohler, B. Miller & H. Stone (New York: Cambridge University Press). Musgrave, R. A. (1969) Fiscal Systems (New Haven: Yale University Press). Nickson, R. A.. (1995) Local Government in Latin America (Boulder: Lynne Reiner). Oates, W. E. (1972) Fiscal Federalism (New York: Harcourt Brace Jovanovich). Qian, Y. & Weingast, B.R. (1997) Federalism as a Commitment to Preserving Market Incentives, Journal of Economic Perspectives, 11(4), pp. 83-92. Panizza, U. (1999) On the determinants of fiscal decentralisation: theory and evidence, Journal of Public Economics, 74(1), pp.97-139. Posner, D. & Laitin, D. (2001) The implications of constructivism for constructing ethnic fractionalisation indices, APSA-CP, 12(1) (Winter), pp. 13-7.
42
Przeworski, A., Alvarez, M.E., Cheibub, J.A. & Limongi, F. (2000) Democracy and Development: Political Institutions and Well-Being in the World, 1950-1990 (New York: Cambridge University Press). Riker, W.H. (1964) Federalism: Origin, Operation, Significance (Boston: Little Brown and Co). Stepan, A. (2001) Arguing Comparative Politics (New York: Oxford University Press). Tanzi, V. (2000) Fiscal Federalism: Issues to Worry About (Washington, DC: IMF). Tocqueville, A. (2000 [1833]) Some Ideas About What Prevents the French from Having Good Colonies, in : J. Pitts (Ed) Alexis de Tocqueville: Writings on Empire and Slavery, pp. 1-4 (Baltimore: Johns Hopkins University Press). Tocqueville, A. (1969 [1835]) Democracy in America, J.P. Mayer (Ed) (New York: Harper Perennial). Treisman, D. (2002) Defining and Measuring Decentralisation: A Global Perspective (UCLA: manuscript). Tsebelis, G. & Money, J. (1997) Bicameralism (New York: Cambridge University Press). Wheare, K. C. (1963) Federal Government, 4th Edition, (New York: Oxford University Press). Wiarda, H.J. & Kline, H.F. (1996) Latin American Politics and Development, 4th Edition, (Boulder: Westview Press). World Bank. (2001) Decentralisation in the Transition Economies: Challenges and the Road Ahead (Washington, DC: World Bank).