expert group report on recommended practices micro …
TRANSCRIPT

EXPERT GROUP REPORT ON
RECOMMENDED PRACTICES
MICRO-SITING SMALL WIND TURBINES FOR HIGHLY TURBULENT SITES
1st EDITION, 2018
Submitted to the Executive Committee
of the International Energy Agency Programme
for
Co-operation in the Research, Development and Deployment
of Wind Energy Systems (IEA WIND)
October 2018

IEA Wind TCP RP19: Micro-Siting Small Wind Turbines for Highly Turbulent Sites ii
EXPERT GROUP REPORT ON
RECOMMENDED PRACTICES
MICRO-SITING SMALL WIND TURBINES FOR HIGHLY TURBULENT SITES
1st EDITION, 2018
Edited by:
Trudy Forsyth
Wind Advisors Team
8460 W. 106th Avenue
Broomfield, Colorado 80021
United States
With contributions from:
• Raymond Byrne, Dundalk Institute of Technology, Ireland
• Charlie Dou, Chinese Wind Energy Association, Jianwen Wang, Liru Zhang, Yali Hou,
Wenxin Wang, Inner Mongolia University of Technology, China
• Heidi Tinnesand, National Renewable Energy Laboratory, Michael Sagrillo, Sagrillo
Power and Light, United States
• Ignacio Cruz Cruz, Francisco Toja, Luis Cano, Luis Arribas, CIEMAT, Spain
• Mauro Peppoloni, Kurt Leonhartsberger University of Applied Sciences Technikum,
Wien, Austria
• Mark Runacres, Vrije Universiteit Brussels, Belgium
• Jonathan Whale, Amir Tabrizi, Anup KC, Murdoch University, Australia
• Takaaki Kono, Kanazawa University, Hikaru Matsumiya, Hikaru Wind, Japan
• Seok-woo Kim, Korea Institute of Energy Research, Republic of Korea
• Peggy Friis and Davide Conti, Technical University of Denmark, Denmark
• Hsu, Chung-Chun, Taiwan Small and Medium Wind Association, Taiwan
• Maciej Karczewski, Piotr Domagalski, Institute of Turbomachinery, Lodz University of
Technology, Poland

IEA Wind TCP RP19: Micro-Siting Small Wind Turbines for Highly Turbulent Sites iii
Foreword
The International Energy Agency Implementing Agreement for Co-operation in the Research,
Development and Deployment of Wind Energy Systems (IEA Wind) is a vehicle for member
countries to exchange information on the planning and execution of national, large-scale wind
and to undertake co-operative research and development projects called Tasks or Annexes.
As a final result of research carried out in the IEA Wind Technology Collaboration Programme
(TCP) Tasks, Recommended Practices, Best Practices or Expert Group Reports may be issued.
These documents have been developed and reviewed by experts in the specialized area they
address. They have been reviewed and approved by participants in the research Task, and they
have been reviewed and approved by the IEA Wind Executive Committee as useful guidelines
for the development and deployment of wind energy systems. Use of these documents is
completely voluntary. However, these documents are often adopted in part or in total by other
standards-making bodies.
A Recommended Practices document includes actions and procedures recommended by the
experts involved in the research project. A Best Practices document includes suggested actions
and procedures based on good industry practices collected during the research project. An
Expert Group Report includes the latest background information on the topic as well as a
survey of practices, where possible.
Previously issued IEA Wind Recommended Practices, Best Practices and Expert Group
Reports can be found at www.ieawind.org.
This document strives to collect lessons learned from extensive data collection and modelling
activities and present results of research and analysis efforts in the area of micro-siting small
wind turbines for highly turbulent sites. It is hoped that this body of work may be used as a
“stepping stone” to understanding the turbulent wind resource and its impacts on small wind
turbine production and design loads.

IEA Wind TCP RP19: Micro-Siting Small Wind Turbines for Highly Turbulent Sites iv
Preface
This Expert Group Report provides recommendations on how to assess the local wind resource
for optimum small wind turbine siting. It is based on more than six years of work within the
IEA Wind TCP Task 27: Small Wind Turbine Research.
IEA Wind TCP Task 27 work started from the linkage of back-to-back meetings of small wind
turbine experts who developed both the third revision of the International Electrotechnical
Commission (IEC) 61400-2 “Part 2: Small wind turbines” and the Recommended Practice (RP
12) titled “Consumer Labels for Small Wind Turbines.” During the development of the IEC
standard, it became apparent that turbulence design requirements were likely inadequate to
capture actual turbulence impacts on small wind turbine design. (see IEC 61400-2 Informative
Annex M on wind conditions.)
The IEA Wind TCP Task 27 working group shifted its priorities from setting a basis for global
certification through international standards and labels to conducting research to inform the
next standards-making body. (The IEA Recommended Practice became an informative annex
within the third revision of IEC 61400-2.) A new research effort began in 2012 to learn more
about the impacts of turbulence from a practical and mathematical perspective.
This report is issued as an IEA Wind TCP Recommended Practice document to provide
practical guidance to owners, site assessors, installers, regulators, permitting authorities and
policymakers developing incentive policy programs. If incentive programs have multi-year
funding, site assessors can help educate owners on realistic production estimates and siting
optimization. In the United States, certified site assessors complete reports for owners as part of
the owner’s application to receive incentive funds.
This Expert Group Report generally describes typical small wind turbine sites, ways to qualify
the site, ways to quantify the site, general siting guidelines and recommendations for future
work.
The group wishes to thank an informal team of U.S. small wind site assessors who have
tirelessly refined and formalized a verbal method of site assessment that has been used by state
funding agencies, owners and other stakeholders. These methods are used as a basis of
comparison with actual field test results. The most recent conference presentations show site
assessment estimations to be within a 5% difference of the actual performance. They have
shared their knowledge for this document.
Trudy Forsyth, Operating Agent Ignacio Cruz Cruz, Operating Agent
IEA Wind TCP, Task 27 IEA Wind TCP, Task 27
www.ieawind.org www.ieawind.org
October 2018
DISCLAIMER:
IEA Wind TCP functions within a framework created by the IEA. The views, findings and
publication of this report do not necessarily represent the views or policies of the IEA
Secretariat or of all of its individual member countries.
IEA Wind TCP RP19: Micro-Siting Small Wind Turbines for Highly Turbulent Sites v
Executive Summary
Challenges
Small wind turbines operate relatively close to the ground as compared with the larger, modern
multi-megawatt machines now operating in wind farms onshore and offshore, and the methods
to assess the wind resource are different. Small wind turbines can be installed in a wide variety
of locations, ranging from unobstructed flat terrain, to land with varying combinations of
natural and manmade obstructions, forests and complex landforms. In addition, because of their
size, small wind turbine installations are often located within and atop urban buildings (known
as “rooftop wind”).
Rooftop and complex terrain sites are the most challenging because of high turbulence, wind
shear, vertical velocity and the influence of atmospheric stability. While rooftop projects do not
meet energy production estimates, the owners may view the installation as successful because
of the perceived marketing benefits (i.e., the installation boosts the project owner’s “green”
image).
Complex terrain sites are typical small wind turbine sites and pose another challenge in
accurately estimating wind turbine production. Underproduction was originally believed to be
dominantly due to uncertified turbines and inconsistent turbine rating approaches; but as more
turbines have become certified and wind turbine ratings are more globally consistent,
underproduction is believed to be a strong function of the local, micro wind conditions.
Measuring the wind resource is the most definitive method for understanding the local wind
conditions and estimating wind turbine production. But wind measurement is typically cost
prohibitive for most small wind turbine owners, leaving them to educate themselves on wind
turbine micro-siting or hire professional site assessors to perform site assessments.
Another approach to understanding local, wind condition impacts is to apply practical rules of
thumb for decreasing production estimates from terrain features, surface roughness and
obstacles. This document is intended as a practical summary for micro-siting small wind
turbines in highly turbulent sites.
Approach
Three approaches to understanding micro-site variation impacts were based on data from
Sustainable Energy Authority of Ireland (SEAI) field trials, three-dimensional wind resource
measurements from Task 27 experts and input from United States wind site assessors. Results
from SEAI field trials included actual wind turbine production, micro-site details and wind data
for each of sixteen sites.
Task 27 experts made many three-dimensional wind measurements in areas of high turbulence
such as rooftops or urban sites. These measurements helped to validate the site assessors’
practical approach and the wind shear, alpha values used. Sites included:
• Austria: a test building at the Lichtenegg test site
• Australia: the Bunnings warehouse roof in Port Kennedy
• Belgium: nine sites across the country (2-D and 3-D)
• China: Inner Mongolia University of Technology on simple buildings with varying roof
shapes (2-D)
• Denmark: Danish Technical University Fence Experiment

IEA Wind TCP RP19: Micro-Siting Small Wind Turbines for Highly Turbulent Sites vi
• Ireland: six SEAI sites across the country (2-D)
• Japan: rooftops of the Nasu-Denki Tekko building and Ashikaga Institute of
Technology
• Poland: in cooperation with Norwegian University of Science and Technology
Trondheim, Norway, on Frøya Island for sites near open sea, over land and complex
terrain
• Republic of Korea: rooftop of the Korean Institute of Energy Research building
• Spain: a building rooftop at the CIEMAT/CEDER test site
• United States: Johnson Space Center on the rooftop of Building 12.
In the Danish Fence experiment, measurement results using 3-dimensional LiDAR
measurements downstream of the fence were used to develop input parameters for WaSP (see
http://www.wasp.dk/). This has refined the WaSP model and has been shown to produce more
accurate estimates of actual turbine production for many small wind turbines installed in
Denmark.
Task 27 experts created computational fluid dynamics (CFD) simulations to understand flow
around simple shapes, different roof shapes and then actual Task 27 measurement sites. Japan
developed a comprehensive CFD simulation of a V52 wind turbine installed at the Dundalk
Institute of Technology campus. The simulation included the low-rise and high-rise buildings
found around the campus and is in part the basis for some rules of thumb.
Much of this work has been documented in journal articles, technical papers and a
“Compendium of Task 27 Country Case Studies.” Technical results that may impact future
version of the IEC 61400-2 standard are documented in a companion document, “IEA Wind
TCP Task 27 Small Wind Turbine Technical Report,” which will provide preliminary
recommendations on characterizing turbulence, changing the normal turbulence model,
developing a new high turbulence design classification, and developing new structural design
requirements around rated power in weakly stable atmospheric wind flow. These two
documents provide the technical detail that is used as a basis for this practical Recommended
Practice document.
Because of its practical approach, the document’s usefulness will span varying levels of market
maturity found in world markets.
Key Recommendations
This document provides rules of thumb and key recommendations on how to practically assess
small wind turbine production for turbulent sites, which include:
• To get good estimates of wind turbine production, the micro-site must be assessed with
a site visit.
• Understand the dominant wind direction(s) and directional blockages from terrain
features, surface roughness and obstacles. Wind and electrical energy roses are critical
tools.
• Support the development of site assessment techniques and education, credentialing and
accreditation of site assessors. Their services can be used to ease consumer education
needs, evaluate their micro-sites, optimize the wind turbine locations and estimate
production and costs.

IEA Wind TCP RP19: Micro-Siting Small Wind Turbines for Highly Turbulent Sites vii
• Document certified small wind turbine energy production estimates with a caveat
stating that certification production estimates are for open field test sites, which is not
typical of most small wind turbine owner sites.
• Follow the rules of thumb to improve the accuracy of wind turbine energy production.
The Future
Understanding three-dimensional inflow for smaller wind turbine rotors is difficult. Task 27
efforts have begun to show the sensitivities of turbulent inflow seen by wind turbine rotors and
the impact to the turbine system design and definitive energy production.
Over time, new modelling tools, site assessment technology and study methodologies will
evolve past this Recommended Practice. For example, today there are new, inexpensive wind
measurement systems and better technical understanding of the impact and details of the
inflow. As a result, new qualitative and quantitative methods will evolve.
The timing and the growth of this evolution will be heavily influenced by the speed and growth
of global small wind turbine markets. There will continue to be an interest in international
collaboration on new research topics, and this is an important role that IEA research provides a
basis for future standards development, which will have direct impact on better wind turbine
designs.
The global market for small wind turbines is potentially very large, but in many ways the
technology has not yet had significant market impact. Part of that is the long time it takes to
make purchase decisions because the owners must educate themselves. Without streamlined,
customer-friendly approaches, the small wind turbine market will continue to be a smaller,
niche market. Better site assessment can be a step to easing owner purchase decisions.

IEA Wind TCP RP19: Micro-Siting Small Wind Turbines for Highly Turbulent Sites viii
List of Abbreviations
CFD computational fluid dynamics
IEA International Energy Agency
IEC International Electrotechnical Commission
SEAI Sustainable Energy Authority of Ireland
TCP Technology Collaboration Programme
TI turbulence intensity
List of Definitions
d displacement height
D rotor diameter
h met mast measurement height
H obstacle height
Hhub turbine height
Href
height of measured data
Small wind turbine turbine with a swept area of 200 m2 or less
W obstacle width

IEA Wind TCP RP19: Micro-Siting Small Wind Turbines for Highly Turbulent Sites ix
CONTENTS
FOREWORD ............................................................................................................................ III
PREFACE ................................................................................................................................. IV
EXECUTIVE SUMMARY ........................................................................................................ V
CHALLENGES ............................................................................................................................. V
APPROACH ................................................................................................................................ V
KEY RECOMMENDATIONS ........................................................................................................ VI
THE FUTURE ............................................................................................................................ VII
LIST OF ABBREVIATIONS ............................................................................................... VIII
LIST OF DEFINITIONS ...................................................................................................... VIII
1. INTRODUCTION ............................................................................................................... 1
1.1 SCOPE AND FIELD OF APPLICATION .................................................................................... 1
2. GENERAL SMALL WIND TURBINE SITES ................................................................ 2
2.1 SMALL WIND TURBINE SITES ............................................................................................. 2
2.2 URBAN AND ROOFTOP SITES .............................................................................................. 3
2.3 PERI-URBAN AND RURAL SITES ......................................................................................... 3
3. QUALIFY THE SITE ......................................................................................................... 3
3.1 INITIAL APPROACH ............................................................................................................. 4
3.2 SITE ASSESSMENT .............................................................................................................. 6
3.2.1 Land-Use and Other Considerations ........................................................................ 8
3.2.2 Wind Roses ................................................................................................................ 8
3.2.3 Terrain Features ....................................................................................................... 9
3.2.4 Obstacles ................................................................................................................. 11
3.2.5 Surface Roughness .................................................................................................. 14
3.2.6 Adjustments for Turbulence .................................................................................... 15
4. QUANTIFY THE SITE .................................................................................................... 17
4.1 WIND MAPS ..................................................................................................................... 18
4.2 WIND SHEAR ................................................................................................................... 19
4.3 MODEL-BASED APPROACH FOR ENERGY PRODUCTION ESTIMATES ................................. 22
4.4 WIND RESOURCE MEASUREMENTS .................................................................................. 22
4.5 VALIDATION OF SITE INFLUENCE ..................................................................................... 23
5. RULES OF THUMB ......................................................................................................... 25
5.1 GENERAL SITING .............................................................................................................. 25
5.2 DISPLACEMENT HEIGHT ................................................................................................... 25
5.3 WIND SPEED ESTIMATES .................................................................................................. 25
5.4 TOWER HEIGHT ................................................................................................................ 26
5.5 ROOFTOP RULES............................................................................................................... 26
5.6 CFD SIMULATIONS .......................................................................................................... 26

IEA Wind TCP RP19: Micro-Siting Small Wind Turbines for Highly Turbulent Sites x
6. CONCLUSIONS................................................................................................................ 28
APPENDIX A CASE STUDY: TWELVE WEST LOCATION: PORTLAND, OR .......... 29
APPENDIX B: EXAMPLES OF GOOD AND BAD SMALL WIND TURBINE SITES .. 31
B.1 SITE A ................................................................................................................................ 31
B.1.1 Wind Turbine System Description ............................................................................. 32
B.1.2 Site A Description ...................................................................................................... 32
B.1.3 Site A Performance .................................................................................................... 33
B.1.4 Site A Wind Resource Analysis and Power Curve Performance ............................... 34
B.1.5 Site A Directional Power and Turbulence Curves and Analysis ............................... 35
B.1.6 Directional Energy and Obstacles ............................................................................. 35
B.2 SITE B ................................................................................................................................ 37
B.2.1 Site B System Description .......................................................................................... 38
B.2.2 Site B Performance Summary .................................................................................... 39
B.2.3 Site B Wind Analysis and Power Curve Performance ............................................... 40
B.2.4 Site B Directional Power and Turbulence Curves and Analysis ............................... 41
B.2.5 Site B Directional Energy and Obstacles .................................................................. 41
REFERENCES .......................................................................................................................... 46
BIBLIOGRAPHY ..................................................................................................................... 46

IEA Wind TCP RP19: Micro-Siting Small Wind Turbines for Highly Turbulent Sites xi
List of Figures
Figure 1. Zone of disturbed flow over a small building. Image courtesy of National Renewable
Energy Laboratory 4
Figure 2. Horizontal lines represent horizontal wind speed vectors 7
Figure 3. Sample wind rose. Image courtesy of National Renewable Energy Laboratory 8
Figure 4. Acceleration of wind over a ridge 10
Figure 5. The effects of ridge orientation and shape on site suitability for wind generators 10
Figure 6. Vertical profiles of air flowing over a cliff 11
Figure 7. Disturbed flow as a function of Le/De and degrees 13
Figure 8. Formation of a wind profile behind a tree line 14
Figure 9. Surface roughness impacts on wind profile 14
Figure 10. Very simplified view of turbulence around a building 15
Figure 11. SEAI field test sites in Ireland 23
Figure A.1. Location of two Skystream wind turbines at different sites 31
Figure A.2. Skystream wind turbine at Site A 32
Figure A.3. On-site views from turbine location 33
Figure A.4. Wind speed distribution and wind rose 34
Figure A.5. Power curve and turbulence intensity curve 34
Figure A.6. Directional power curves and turbulence intensity curves 35
Figure A.7. Electrical energy rose 35
Figure A.8. Electrical energy rose overlaid on Site A plan view with numbered obstacles 36
Figure A.9. Electrical energy rose overlaid on regional plan and labeled topographical features
37
Figure A.10. Skystream wind turbine at Site B 38
Figure A.11. Plan view of site 38
Figure A.12. On-site views from turbine location 39
Figure A.13. Wind speed distribution and wind rose 40
Figure A.14. Power curve and turbulence intensity curve 41
Figure A.15. Directional power curves and turbulence intensity curves 41
Figure A.16. Electrical Energy Rose 42
Figure A.17. Electrical energy rose overlaid on plan view with numbered obstacles 42
Figure A.18. Electrical energy rose overlaid on regional plan 43
Figure A.19. Site power curve comparison with accredited power curve 44
Figure A.20. Site power curve comparison with accredited power curve for different turbulence
ranges for Site A (left) and Site B (right) 45

IEA Wind TCP RP19: Micro-Siting Small Wind Turbines for Highly Turbulent Sites xii
List of Tables
Table 2. Wind shear by terrain features, surface roughness and obstacles 20
Table 3. Impact of wind shear on annual energy production 22
Table 3. SEAI field test site data 24
Table B.1. Summary of wind turbine system 32
Table B.2. Summary results 33
Table B.3. Site A local obstacle descriptions 36
Table B.4. System description 38
Table B.5. Summary results 40
Table B.6. Local obstacle descriptions 43

IEA Wind TCP RP19: Micro-Siting Small Wind Turbines for Highly Turbulent Sites 1
1. Introduction
There were two primary goals for the work performed under IEA Task 27: 1) conduct global,
shared research to better understand technical parameters within IEC 61400-2 that were
troubling, and 2) incorporate the research findings into a useful, practical guide on micro-siting
small wind turbines. The purpose of this recommended practice is to provide information for
small wind turbine stakeholders, including site assessors, installers, owners and end users.
Because small wind turbines are typically used for individual electricity needs, the areas in
which they are sited are near residences and often contain obstacles such as houses, barns, other
buildings and trees. These obstacles block the wind and create turbulent environments, making it
difficult for the turbine to reach good, “clean” unencumbered winds. This turbulence has two
dominant impacts on wind turbines: reduced production and the need for design modifications to
address fatigue stress.
To avoid these undesirable impacts, it is of primary importance that small wind turbines be sited
at the most open sites in the dominant wind direction and that rules of thumb and tools be created
to guide accurate production estimates. At this point in the product maturity of most commercial
small wind turbines, the typical decrease in production is dominantly from poor micro-siting of
the wind turbine versus inaccurate production estimates from independent test sites.
The two main points that will be addressed in this Recommended Practice are how to “qualify
the site” (select the best site for small wind turbines) and how to “quantify the site” (better
estimate the wind turbine production). Measuring the site wind resource will provide the most
accurate production estimates, but developers at most sites will not have the time and financial
ability to accomplish a robust measurement campaign (although new low-cost technologies are
in development). The practices used for micro-siting small wind turbines should encompass
detailed review of the site and understanding of wind blockages, wind and energy rose, and
likeliness of meeting production estimates. General siting guidelines will also be discussed in
this report.
1.1 Scope and Field of Application
One of the tasks of the IEA Wind TCP is to develop Recommended Practices related to different
aspects of wind energy. These documents summarize the best knowledge at the time of writing
and shall be treated as recommendations and not as binding standards. The IEA Wind TCP
endorses this work but will not be held liable for the application of the information in those
documents. These documents have served as important work for the development and refinement
of international standards such as IEC.

IEA Wind TCP RP19: Micro-Siting Small Wind Turbines for Highly Turbulent Sites 2
2. General Small Wind Turbine Sites
A small wind turbine project can satisfy multiple objectives such as a desire to harness the wind
resource and provide economic benefit, demonstrate a visual commitment to renewable energy,
reduce electricity purchase and costs, and many other motivations. The key factor in
understanding project economics is estimating the energy production of a specific turbine at a
specific site. The challenge is understanding wind characteristics at a specific site.
2.1 Small Wind Turbine Sites
Small wind turbines are found in a wide variety of sites across the globe. Some sites clearly offer
an opportunity to harvest the wind resource, but for the majority of sites, it is difficult to
determine whether they will be productive. The energy performance of any wind turbine is
sensitive to a number of atmospheric parameters such as wind speed, wind direction, wind shear,
wind veer, turbulence and air density. These factors are influenced by local and regional features
around the site such as terrain, obstacles, general surface roughness and thermal effects.
If people reside close to the wind turbine site, it is likely that buildings, trees, silos, etc., will also
be present and can be expected to disrupt the wind resource. This presents extra challenges in
siting small wind turbines because many sites may have complex wind flows that are heavily
influenced by local obstacles, resulting in lower average annual wind speeds, unique wind speed
distributions, high turbulence, high wind shear and highly directional wind flows (both
horizontally and vertically).
Understanding the impact of turbulence flow on wind turbine production is a non-trivial effort.
Depending on an individual’s knowledge and tools, various methods can be applied to
qualitatively assess the site, starting with basic wind observation (flagging, local knowledge,
etc.). More accurate production estimates can be achieved using quantitative evaluations (wind
resource modelling and/or conducting wind measurements) conducted by a competent party,
which will increase the cost and time to develop the project.
One can start by observing and understanding the local winds and the direction(s) that are most
dominant for both low and high speed winds. Ideally there will be open, unobstructed winds in
the dominant wind direction or “clean fetch”1 for as great a distance upwind as possible. The
strategy is to maximize the amount of time the wind turbine is spinning, and this typically
happens when the turbine has access to clean, open fetch.
These observational methods are vastly improved by having professional wind site assessors
identify the best site and estimate wind turbine production for that site. Site assessors will
typically use computer tools to help refine wind turbine production estimates. Currently there are
several tools available to estimate small wind turbine production; some are free and others are
commercial.
1 Fetch is the open, unobstructed area in the prevailing wind direction.
IEA Wind TCP RP19: Micro-Siting Small Wind Turbines for Highly Turbulent Sites 3
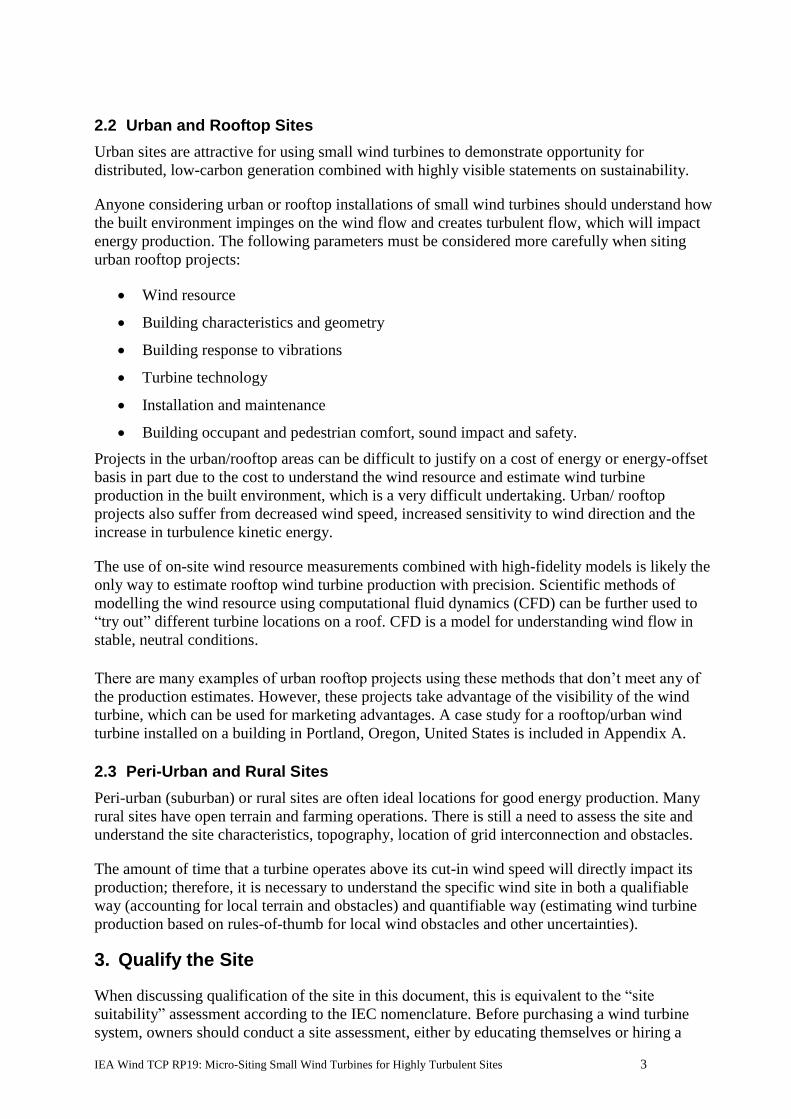
2.2 Urban and Rooftop Sites
Urban sites are attractive for using small wind turbines to demonstrate opportunity for
distributed, low-carbon generation combined with highly visible statements on sustainability.
Anyone considering urban or rooftop installations of small wind turbines should understand how
the built environment impinges on the wind flow and creates turbulent flow, which will impact
energy production. The following parameters must be considered more carefully when siting
urban rooftop projects:
• Wind resource
• Building characteristics and geometry
• Building response to vibrations
• Turbine technology
• Installation and maintenance
• Building occupant and pedestrian comfort, sound impact and safety.
Projects in the urban/rooftop areas can be difficult to justify on a cost of energy or energy-offset
basis in part due to the cost to understand the wind resource and estimate wind turbine
production in the built environment, which is a very difficult undertaking. Urban/ rooftop
projects also suffer from decreased wind speed, increased sensitivity to wind direction and the
increase in turbulence kinetic energy.
The use of on-site wind resource measurements combined with high-fidelity models is likely the
only way to estimate rooftop wind turbine production with precision. Scientific methods of
modelling the wind resource using computational fluid dynamics (CFD) can be further used to
“try out” different turbine locations on a roof. CFD is a model for understanding wind flow in
stable, neutral conditions.
There are many examples of urban rooftop projects using these methods that don’t meet any of
the production estimates. However, these projects take advantage of the visibility of the wind
turbine, which can be used for marketing advantages. A case study for a rooftop/urban wind
turbine installed on a building in Portland, Oregon, United States is included in Appendix A.
2.3 Peri-Urban and Rural Sites
Peri-urban (suburban) or rural sites are often ideal locations for good energy production. Many
rural sites have open terrain and farming operations. There is still a need to assess the site and
understand the site characteristics, topography, location of grid interconnection and obstacles.
The amount of time that a turbine operates above its cut-in wind speed will directly impact its
production; therefore, it is necessary to understand the specific wind site in both a qualifiable
way (accounting for local terrain and obstacles) and quantifiable way (estimating wind turbine
production based on rules-of-thumb for local wind obstacles and other uncertainties).
3. Qualify the Site
When discussing qualification of the site in this document, this is equivalent to the “site
suitability” assessment according to the IEC nomenclature. Before purchasing a wind turbine
system, owners should conduct a site assessment, either by educating themselves or hiring a

IEA Wind TCP RP19: Micro-Siting Small Wind Turbines for Highly Turbulent Sites 4
professional site assessor. It is important to understand not only the wind speed at a specific
height but also the prevailing wind direction(s). The best sites are those with few obstructions to
the wind, particularly in the prevailing wind directions. The worst sites are those that have many
blockages and obstacles to the wind, thereby increasing turbulent flow.
Turbulence is a stochastic, random, three-dimensional phenomenon that is shown graphically in
a simple two-dimensional view (Figure 1). This graphic depicts an ideal installation of a turbine
tower at least two times higher than the highest obstacle or 20 times the highest obstacle
horizontally in the dominant wind direction. If the small wind turbine rotor is installed inside the
“recommended turbine exclusion zone,” production and reliability may decrease; the project
developer should consult with a professional site assessor to understand the resultant impact.
This approach is the simplest method to assess obstacles in rural or peri-urban sites and gives the
basis for initial consideration of small wind turbines. A more in-depth discussion of obstacle
assessment methods is presented in Section 3.2.3.
Figure 1. Zone of disturbed flow over a small building [1]
3.1 Initial Approach
When beginning to assess a site, the most important thing is to look for vertical separation. The
idea is to maximize the amount of unobstructed vertical separation between the turbine rotor and
ground clutter. Initially look at the specific location, land cover and topography and gather
preliminary wind resource estimates from wind maps. (Be careful to understand the height of the
wind speed estimates, which may be very different from the hub heights for typical small wind
turbines.)
It is also important to understand the owner’s project goals and their current or desired electricity
kilowatt-hour consumption. Typically, owners want an initial cost estimate, the site assessor
wants to identify the best spot for the wind turbine and the installer wants a method to qualify a
potential customer. (Small wind turbine lifetimes are conservatively estimated to be 20 years,
and it is likely that an installer will need to work with that customer throughout the turbine
system lifetime.)
Figure 2 presents the initial approach for the owner, and Figure 3 shows the approach for the site
assessor.

IEA Wind TCP RP19: Micro-Siting Small Wind Turbines for Highly Turbulent Sites 5
Figure 2: Initial Approach for Owner. Graphic courtesy of Raymond Byrne and Trudy Forsyth.

IEA Wind TCP RP19: Micro-Siting Small Wind Turbines for Highly Turbulent Sites 6
Figure 3. Initial Approach for Site Assessor. Graphic courtesy of Raymond Byrne and Trudy Forsyth.
3.2 Site Assessment
Site assessment is the examination of a specific site’s orientation to the prevailing wind and an
assessment of the impact of obstacles surrounding it radially. This is a varying number because it
is a function of a turbine’s rotor diameter. Develop a list of obstacles that are a distance less than
20 times their height from the proposed turbine location.
A detailed site assessment will help prospective project owners understand the very local
viability of a small wind turbine on their land. Understanding the wind direction will be key to
identifying a site that allows for the wind turbine to maximize energy production. The wind
direction is one of the most important inputs for micro-siting a small wind turbine, but this
information is not always available.
Part of the challenge in harvesting the wind is that rough topography and ground cover increase
air flow friction, add turbulence to the air and can even displace the effective ground level
upward (called “displacement height”). Figure 4 shows a simplified graphical model of what
happens with the mean wind speed as a function of height; note that it is not linear.

IEA Wind TCP RP19: Micro-Siting Small Wind Turbines for Highly Turbulent Sites 7
Figure 4. Horizontal lines represent horizontal wind speed vectors [2]
The site and wind resource are interrelated; therefore, finding the annual average wind speed
from wind maps will be a good starting point. Be sure to check the height at which the wind
speed was measured. Knowing the wind speeds at the turbine hub height is necessary for
accurate production estimates. For a desk audit, a topographical map and other tools (such as
Google Earth) also help inform a site assessor prior to the site visit, and it is helpful if the owner
has a good sense of historic wind patterns.
Each site assessment includes a site visit followed by a site analysis and report that notes the
optimum wind turbine placement. The site visit allows for an accurate evaluation of potential
obstructions to the wind resource, including ground clutter or obstacles (e.g., surrounding
buildings and trees), as well as an overall grasp of location-specific characteristics, overhead
and/or underground utilities, the best location for electrical interconnection and site access. The
strongest factors that influence a good wind site include wind direction and wind speed,
obstacles present in the dominant wind direction, terrain, landform and displacement height. It is
always a good idea to place the wind turbine as high as possible to maximize its wind exposure,
wind speed and energy production.
Hills and many other topographic features may alter wind flow by increasing, decreasing, or
modifying the prevailing direction, or intensifying turbulence (see Section 3.2.3). As a result, if
the surrounding area of the potential site has these features within a 10-km radius, then a
description of the main topographic features is necessary, both nearby (macro-siting) and at the
proposed turbine site (micro-siting).
The topographical description should include shape, height, length, width, distance and direction
away from the proposed turbine site of any landforms. “Nearby” could include influences from
large objects such as groves of trees or high wind breaks up to a 2 km away, and smaller objects
could include single trees and buildings near the proposed turbine location. For detailed
information about relevant height of obstacles, see Table 1.
If wind data used for the site evaluation are from a close location, it is important to have
topographic maps of the area around both sites and between the sites. This information is
essential in evaluating if the reference wind data are likely to be well-correlated with the wind
resource on the site and if the wind data needs to be adjusted up or down.

IEA Wind TCP RP19: Micro-Siting Small Wind Turbines for Highly Turbulent Sites 8
3.2.1 Land-Use and Other Considerations
Land use type definitions and requirements are very different around the world, making it
impossible to fully capture all possible landforms. Planning permissions and zoning and
permitting processes seek to address safety, aesthetics and community interests and concerns.
Additionally, the site assessment must cover roads, obstacles and site accessibility for the
delivery of the wind turbine, tower and construction equipment, as well as for the actual
installation. GIS tools may also be of assistance (e.g., in urban areas).
Although the site assessment does not normally include a soils test, it is important to include at
least some information about obvious soil issues that could affect foundation design and
construction, such as intermittent water, sand, unstable slopes, rocks, expansive clay, depth to
bedrock and frost depth. Standards often govern the way to assess soil loads on structures for
specific locations.
3.2.2 Wind Roses
Knowing the prevailing wind direction(s) and speed is essential to determining the impact of
obstacles and landforms when seeking the best available site location and estimating the wind
resource at that location. To help with this process, a wind rose that shows the wind direction
distributions of a given area can be used. The wind rose divides a compass into sectors (usually
eight or 16) and indicates the average wind speed, average percentage of time that the wind
blows from each direction and/or the percentage of electrical or total energy per unit area (energy
rose) in the wind by sector. Wind roses can be generated based on annual average wind speeds or
by season, month or even time of day as needed. An example of a typical wind rose is shown in
Figure 5.
Figure 5. Sample wind rose [3]

IEA Wind TCP RP19: Micro-Siting Small Wind Turbines for Highly Turbulent Sites 9
In this wind rose, for any of the 16 sectors, blue conveys the total wind energy available (energy
rose) from that direction, whereas green indicates the total time the wind blows from that
direction. It is important to recognize that sectors where the wind blows frequently may not
provide the most energy if the winds from those sectors are relatively weak. For this reason, it is
important to examine the wind roses for both the wind time and energy production.
Both common types of wind roses (percent of time and average wind speed or percent of time
and percent of energy) help site assessors understand where to site a tower relative to landforms
and ground clutter. The information from a wind rose is especially useful in determining a
location for a tower that is upwind of any obstructions on a site and well exposed to the sectors
that can produce the most energy.
If there is no energy or wind rose for the site, information may exist for a nearby site. It is
difficult to tell how close a site must be for the information to be relevant because much depends
on landform and terrain features at a minimum. But a simpler way to evaluate the site is with its
trees. Imagine a stream with a boulder in it. Water flow slows in front of the boulder and
gradually increases in speed as it moves around the boulder. The same thing happens with the
wind―it either moves sideways or up. Flagging on trees (coniferous trees are preferred but
deciduous trees may help) may indicate a high-wind sites. Trees with flagging have a dominant
growth on one side and/or permanent growth distortion, which indicates a definite wind resource
from a specific direction. Note that not all trees that show flagging indicate that there is a wind
resource, only that the wind is prevailing from that direction.
As mentioned earlier in this document, another influencing factor in selecting the site is “good
fetch” or unobstructed winds in the dominant wind direction (the longer the fetch, the better the
wind resource).
To create a wind rose, time series data in bins less than one hour is required with wind speed and
wind direction information. These data should cover at a minimum one year to represent
seasonal variability. These data could be pulled from local weather stations (e.g., airports),
nearby windfarms or modelled wind resource datasets.
This site explains a step-by-step process for developing the wind direction frequency distribution
and creating a simple wind rose with Excel: https://windroseexcel.com/guides/using-excel-make-
wind-rose-step-step-guide/
A number of programs can create wind roses; e.g., Excel,2 Libre Office, Matlab3 and Python.4
3.2.3 Terrain Features
Landforms, or orography, can influence wind speed and as a result, the amount of electricity that
a wind turbine can generate. Elevated areas not only experience increased wind speeds because
of their increased height in the wind profile, but also, given the size and shape of the landform,
may cause local acceleration of the wind speed. Idealized cases have been shown to double the
2 https://www.enviroware.com/plot-a-wind-rose-in-excel/WR_Excel.xls
3 https://de.mathworks.com/matlabcentral/fileexchange/47248-wind-rose
4 https://pypi.org/project/windrose/

IEA Wind TCP RP19: Micro-Siting Small Wind Turbines for Highly Turbulent Sites 10
wind speeds over a ridge, but uncertainty is great without high-resolution CFD modelling or on-
site measurements. An example of how wind flow is accelerated over a ridge is illustrated in
Figure 6.
Figure 6. Acceleration of wind over a ridge [4]
Wind prospectors looking for sites for utility wind plant development are keenly aware of this
phenomenon and seek out elongated ridges perpendicular to dominant wind flow. The
orientation of the ridge relative to the prevailing wind direction is critical to optimizing the use
of accelerated wind flow over the ridge. Note from the diagrams in Figure 7 that ridges are better
than hills at accelerating wind flow.
Figure 7. The effects of ridge orientation and shape on site suitability for wind generators [4]
Unique to elevated landforms are bluffs and cliffs (Figure 8), which create turbulence (including
back eddies, reverse or secondary flow) as the wind passes up and over them. As a result, siting
the tower to avoid the zones of turbulence created by the landform is critical.

IEA Wind TCP RP19: Micro-Siting Small Wind Turbines for Highly Turbulent Sites 11
Figure 8. Vertical profiles of air flowing over a cliff. Graphic courtesy of Piotr Domalgaski, modified from Mick Sagrillo.
A practical approach to siting a wind turbine around bluffs is to take into account the surface
roughness upwind of the bluff. For a surface with a high α of 0.3 or greater or roughness, the
turbine should be installed at least horizontally (0.25 x cliff height) from the bluff edge. If the
upwind roughness is low or low α, the turbine should be installed horizontally (2.5 x cliff height)
from the edge.
3.2.4 Obstacles
An approach used by small wind test centers developing small wind turbine power curves is to
exclude directional sectors that are influenced by obstacles based on procedures of the Annex A
of IEC 61400-12-1; 2017 “Wind energy generation systems – Part 12-1: Power performance
measurements of electricity producing wind turbines” standard. An adapted conservative
approach to this methodology to assess obstacles is given in Figure 9. The obstacle height is
expressed as a fraction of the rotor plane’s lowest point ( i.e., Hhub – 0.5 D) where Hhub is the hub
height and D the rotor diameter.

IEA Wind TCP RP19: Micro-Siting Small Wind Turbines for Highly Turbulent Sites 12
Figure 9. Maximum obstacle height as a function of the obstacle’s distance from the turbine. Graphic courtesy of Mark Runacres based on IEC 61400-12-1 Annex A.
If there are obstacles that exceed these maximum obstacle heights, then further consideration is
needed to determine the sectoral (angle) width of disturbance as seen by the turbine.
An equivalent rotor diameter De for an obstacle is defined in Equation (1) as follows:
𝐷𝑒 =2∗𝐻∗𝑊
𝐻+𝑊 (1)
H = obstacle height
W =obstacle width (as seen from turbine)
The distance from the turbine location to an obstacle is defined as Le. The angle of disturbance
() for a given De and Le is defined in Equation (2) as follows:
𝜃 = 1.3 ∗ tan−1 (2.5𝐷𝑒
𝐿𝑒+ 0.15) + 10 (2)
Calculated example:
Giving the example of a small wind turbine installed 60 m away from a barn on an open field,
the angle of disturbance is calculated. In this example, the barn has a height of 18 m and a width
of 35 m as seen from the turbine. In a first step, we calculate the equivalent diameter De of the
barn:
𝐷𝑒 =2∗18𝑚∗35𝑚
18𝑚+35𝑚= 23.8𝑚 (3)
The angle of disturbance θ is calculated as follows:
𝜃 = 1.3 ∗ tan−1 (2.5 ∗23.8𝑚
60𝑚+ 0.15) + 10 = 73.4° (4)
Obstacles where Le/De are greater than 20 are considered to have no disturbances in the field of
view. Obstacles where Le/De is less than 2 are considered to disturb the full field of view. Le/De

IEA Wind TCP RP19: Micro-Siting Small Wind Turbines for Highly Turbulent Sites 13
is the ratio of the distance of an obstacle from a wind turbine to the obstacle dimensions
(expressed as an equivalent rotor diameter). When Le/De is known for a given obstacle, the graph
can be used to assess the following:
a) whether the given obstacle has influence on the wind flow as seen by the turbine (i.e., in the
disturbed or undisturbed region on the graph), and
b) if in the disturbed region, the directional (or sectoral) width of influence in degrees as seen by
the wind turbine can be read from the y-axis of the graph.
Obstacles with Le/De ratios that fall into the disturbed region shown in Figure 10 will have an
impact on the power and energy performance of a turbine. Such obstacles in the prevailing wind
direction(s) should be avoided.
Figure 10. Disturbed flow as a function of Le/De and degrees Graphic courtesy of Raymond Byrne based on IEC 61400-12-1 Annex A.
A more complex analysis requires information on the height, width, type, distance, direction and
porosity of individual obstacles for all obstacles in different directions.
3.2.4.1 Extended Obstacles (Including a Grouping of Trees or Forest)
Obstacles within a distance of less than 16D (from turbine location) that extend more than 50 m
in any horizontal direction are divided into partial obstacles. Each partial obstacle shall be
smaller than 50 m in width and length. Each partial obstacle is treated separately to determine if
it disturbs a sector.

IEA Wind TCP RP19: Micro-Siting Small Wind Turbines for Highly Turbulent Sites 14
3.2.4.2 Displacement Distance
Figure 11 shows how the mean wind profile is displaced upward from the ground level by the
grove of trees. This change in wind speed with height is depicted in a wind profile, shown in
Figure 4. The horizontal arrows represent the horizontal wind speed vectors at their respective
heights in the wind profile. Vectors indicate the direction and the magnitude and help “visualize”
fluid flow in a wind profile.
Trees complicate the flow pattern, extracting kinetic energy out of the wind as the tree moves.
This displacement height is called the “level of effective zero wind” since the wind below that
level is nearly zero. Displacement height (d) is defined as a percentage of canopy height
depending on vegetation or forest density and often is approximated at 67% of canopy height for
dense deciduous forests and 75% of canopy height for dense evergreen forests.
Figure 11. Formation of a wind profile behind a tree line [2]
This new height d above the canopy or above the edge of the roof is then used as the effective
“ground-line” to apply the shear exponent to reach the turbine hub height.
3.2.5 Surface Roughness
The effects of surface roughness from ground cover can extend as much as 500 m vertically
above the ground, and there is strong impact for the first 20 m―which can have a significant
effect on small wind turbines. Examples of the impact on the wind profile for two different
surfaces are shown in Figure 12. Note how rougher surfaces have more of an impact on the
horizontal wind vectors. In the case of low-roughness terrain, the wind profile recovers much
quicker.
Figure 12. Surface roughness impacts on wind profile [3]

IEA Wind TCP RP19: Micro-Siting Small Wind Turbines for Highly Turbulent Sites 15
The vast difference in the shape of the wind profile curve shows a wide range of variance that is
possible just due to surface texture. An ability to visualize flow has helped some site assessors
picture a 3-D flow with vectors.
Locations with rows of coniferous trees (e.g., sites in Scandinavian countries) will require taller
turbines to reach smoother winds. One example from the United States describes a site with 25m
trees and a wind turbine on a 40m tower. This lack of vertical separation caused the turbine to
have excessive yaw motion while it moved back and forth to align itself with the ever-changing
wind direction. But when a taller, 45m tower was installed, the yawing motion was reduced. In
addition to improved performance, the taller tower will extend the wind turbine life due to
reduced wear and tear on the equipment from turbulence and wind shear.
3.2.6 Adjustments for Turbulence
Turbulence is a stochastic variation of wind velocity in all three directions relative to the wind
turbine rotor axis. Longitudinal turbulence is associated with changes of wind speed in the
dominant wind direction. The two remaining components show lateral turbulence in cross flow
directions.
A good sense of understanding the potential impact of turbulent flow on surfaces generating lift
(such as wind turbine rotor blades) is given by an example of an airplane flying through a
turbulence zone. Passengers are asked to remain in their seats with seatbelts fastened while the
entire cabin undergoes shaking and sudden unexpected movements in all three directions. Figure
13 gives a very simplistic overview of how the longitudinal turbulence might manifest itself
around a house. The dashed line indicates the recirculation zone.
Figure 13. Very simplified view of turbulence around a building [2]
In the example, the wind velocity profile is distorted by the presence of a building. The wind
pattern over and past the building structure is more complicated and may include reverse flow.
Sudden changes in inflow are influenced by stochastic and unexpected wind speed variations.
Siting a wind turbine will likely generate dangerous impacts on the structure, as in the case of the
airplane. The above example is by no means exhaustive as turbulence is present in regular flow,
free from disturbance due to obstacles such as buildings.

IEA Wind TCP RP19: Micro-Siting Small Wind Turbines for Highly Turbulent Sites 16
Given the above, qualification of a site and understanding site-specific turbulence is difficult
without CFD modelling or gathering wind measurements. Even if the predominant wind
direction and average annual wind speed is known, one will not know the amount of energy
spent to turbulence nor the frequency with which the fluctuations of wind speed occur. The first
factor may negatively impact the turbine’s annual energy production. The second factor may be
critical to turbine lifetime.
Turbulence significantly increases the loads on wind turbines. Load increases as high as 60%
have been reported. It is certain that this shortens the fatigue life of small wind turbines on
turbulent sites, although it is difficult to predict quantitatively by how much the fatigue life is
reduced.
The effect of turbulence on power production can be both positive and negative, although the
latter case is most prevalent. Modest increases of power with increasing turbulence intensity
have been predicted as well as measured experimentally, but small wind turbines generally
perform worse in turbulent conditions. The changing wind direction in the absence of an active
yawing system is no doubt an exacerbating factor.
Published power curves are rarely representative for the performance of small wind turbines in
turbulent conditions because wind turbine power curves are typically developed based on
measurements taken at sites with relatively low turbulence intensity compared to typical small
wind project sites.
The Normal Turbulence Model of the IEC 61400-2 standard strongly underestimates the
turbulence for the highly turbulent conditions in which many small wind turbines operate. Short
of avoiding turbulent sites altogether, particular care should be taken in assessing the turbulence
on the site, for all relevant wind directions, when considering a small wind project.
The best approach for a site with unknown turbulence levels is to assume high turbulence
(turbulence intensity is greater than 30% at 5 m/s), especially for urban or peri-urban sites.
(Turbulence intensity is the ratio of the wind speed standard deviation to the mean wind speed,
taken over a specified period of time.) For such locations, a certified small wind turbine from an
accredited certification body is likely the safest option (although care should be taken in
assuming the performance estimates based on accredited field test results typically sited in wide,
open terrain).

IEA Wind TCP RP19: Micro-Siting Small Wind Turbines for Highly Turbulent Sites 17
4. Quantify the Site
The quantification of the wind resource, the speed and the direction becomes critical in
developing rough production estimates for small wind turbines. There are a variety of methods,
and they range from lower to higher costs. Exploring the details of the wind resource becomes
more important if a project has multiple decision makers or if the project is costly compared to
the alternatives.
The methods of assessing the wind resource come from using a general wind map and using that
wind speed information to form the basis of a production estimate. Another approach is to use a
commercial wind resource model to identify more “precisely” the annual wind speed range.
While these two approaches are very successful for siting windfarms, it does not take into
account the impact of local micro-siting and the dramatic effect that it has on a small wind
turbine.
A second approach is to access wind measurements from nearby projects, wind resource towers,
airports or other weather stations. These data may be relevant if the terrain is similar to the new
project and is located close by, but care must be taken to understand the location (e.g., tower
height, proximity to obstacles) and data quality of these measurement sources.
The only method where the wind resource is truly quantifiable and accounts for obstacle, terrain,
wind direction and blockages is to measure the wind at the exact location and exact hub height of
the proposed small wind installation. Historically the cost of wind measurement equipment and
analysis has been prohibitive for small wind turbines. It is estimated that up to 25% of an installed
small wind turbine costs and up to one year of time is required to get wind measurement results;
many customers may be too impatient to adhere to a schedule like this.
Recently new wind resource measurement approaches have been developed, including lower-
cost wind measurement equipment and towers, and new drone technology. Having equipment
and tools that give wind rose information is invaluable for estimating the wind turbine
production. Wind maps typically provide a basis for the wind speed, the other important factor in
understanding production.
Figure presents the process for quantifying the site. For more detail, refer to Sections 3.2.6, 4
and 5.

IEA Wind TCP RP19: Micro-Siting Small Wind Turbines for Highly Turbulent Sites 18
Figure 14. Flow of steps to quantify the site. Graphic courtesy of Luis Arribas and Charlie Dou
4.1 Wind Maps
Owners and installers use an annual average wind speed at a specific height as a starting point
for their energy production estimates. These estimates will need to be modified for the micro-
site, including terrain surface roughness as well as obstacles and their dimensions.
This information is generally provided by wind maps, which help wind developers and users
understand the areas of higher wind speeds, the dominant factor in the equation for the power in
the wind. Using a wind atlas to estimate power production for small wind turbines at lower
heights may have significant uncertainty due to the impact of local terrain and obstacles and
should not be used as the sole source of wind resource information. Some government and
academic institutions can help identify locations of wind maps, which will vary by country. As
mentioned previously, care should be taken to use map data at as close to actual turbine hub
height as possible. Examples of links for wind maps throughout the world include:
• World Bank: Global Wind Atlas, <https://globalwindatlas.info/> (heights of 50 m, 100
m, 200 m)
• Austria: Windatlas Österreich, <https://www.windatlas.at/disclaimer_windkarte.html>
(heights of 50 m and 100 m)
• Canada: Environment and Climate Change Canada's Wind Energy Atlas,
<http://www.windatlas.ca/index-en.php> (heights of 30 m, 50 m, 80 m )
• China: National Climate Center 4-D wind resource dataset, <www.qh323.com> (heights
in 10-m increments up to 200 m)
• Ireland: SEAI Wind Atlas, <http://maps.seai.ie/wind/> (heights of 20 m, 30 m, 40 m, 50
m, 75 m, 100 m, 125 m, 150 m)
• Japan: New Energy and Industrial Technology Development Organization wind maps
<http://app8.infoc.nedo.go.jp/nedo/> (heights of 30 m, 50 m, 70 m)

IEA Wind TCP RP19: Micro-Siting Small Wind Turbines for Highly Turbulent Sites 19
• Republic of Korea: Korea Institute of Energy Research renewable energy resource maps,
<http://www.kier-solar.org/> (heights of 40 m, 80 m, 120 m)
• Poland: Numerical weather Forecast Service by Interdisciplinary Centre for
Mathematical and Computational Modelling, University of Warsaw, Warsaw, Poland
<http://maps.meteo.pl> (height of 10 m)
• Portugal: National Laboratory of Energy and Geology Atlas Eolico,
<http://geoportal.lneg.pt/geoportal/mapas/index.html?mapa=AtlasEolico> (heights of 10
m, 60 m, 80 m)
• Spain: Institute for the Diversification and Saving of Energy wind atlas,
<http://atlaseolico.idae.es/> (heights of 30 m, 60 m, 80 m, 100 m) and National
Renewable Energy Center of Spain wind map,
<http://www.globalwindmap.com/> (height of 10 m)
• United States: National Renewable Energy Laboratory WINDExchange wind maps,
<http://apps2.eere.energy.gov/wind/windexchange/windmaps/> (heights of 30 m, 50 m,
80 m)
In the United States, state wind maps are used to conservatively estimate the wind resource at the
turbine hub height by extrapolation using a conservative wind shear. These maps can provide a
general indication of good or poor wind resources but may have very low site-specific accuracy
as they do not provide high enough resolution or include information on complex terrain, ground
cover and other local effects. Despite this, a site assessment methodology can be used to improve
data details and confidence in energy projection accuracy.
One tactic that site assessors have found useful is to use a map with a height that is lower than
the proposed tower height and extrapolate up to the proposed hub height using the appropriate
wind shear exponent to arrive at a hub-height wind speed. This technique is more conservative
than using a wind map with a higher height and extrapolating down to the hub height. When
estimating wind speed for the purpose of forecasting annual performance, a conservative
approach is always more pragmatic.
Typical small wind turbines are installed on towers ranging from 10 m to 50 m, so 30- to 40-m
wind maps are far more useful than 10-, 60-, 80-, or 100-m wind maps. The best way to account
for terrain features, surface roughness and obstacles is to use an appropriate wind shear exponent
(alpha) when calculating the power in the wind.
4.2 Wind Shear
One of the most distinct features of wind comes from the fact that moving air experiences
friction between adjacent elements or layers and the fact that the mean velocity at the ground
surface is zero. As a result, the mean wind velocities grow from zero to some constant velocity in
a vertical layer over the surface ranging typically from a few tens to a few hundred meters.
The friction causes wind shear, which is the difference in wind speeds at different heights above
the ground. This change in wind speed with height is depicted in a wind profile, shown in Figure
4.
Although wind velocities vary with time both in magnitude and the direction, if velocities are
averaged over long enough periods (typically 10 min), the flow vectors are parallel to the
surface. The horizontal arrows represent the mean horizontal wind speed vectors at their
IEA Wind TCP RP19: Micro-Siting Small Wind Turbines for Highly Turbulent Sites 20
respective heights in the wind profile. They indicate the wind direction and speed and help
“visualize” fluid flow in a wind profile.
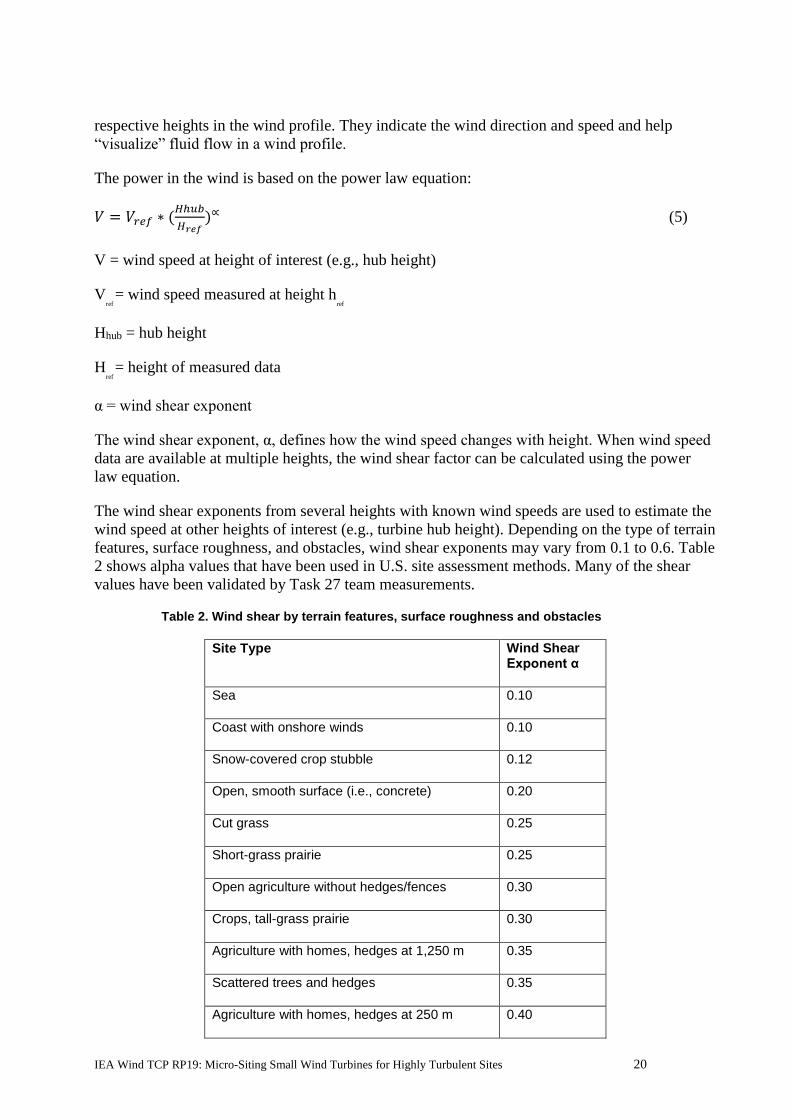
The power in the wind is based on the power law equation:
𝑉 = 𝑉𝑟𝑒𝑓 ∗ (𝐻ℎ𝑢𝑏
𝐻𝑟𝑒𝑓)∝ (5)
V = wind speed at height of interest (e.g., hub height)
Vref
= wind speed measured at height href
Hhub = hub height
Href
= height of measured data
α = wind shear exponent
The wind shear exponent, α, defines how the wind speed changes with height. When wind speed
data are available at multiple heights, the wind shear factor can be calculated using the power
law equation.
The wind shear exponents from several heights with known wind speeds are used to estimate the
wind speed at other heights of interest (e.g., turbine hub height). Depending on the type of terrain
features, surface roughness, and obstacles, wind shear exponents may vary from 0.1 to 0.6. Table
2 shows alpha values that have been used in U.S. site assessment methods. Many of the shear
values have been validated by Task 27 team measurements.
Table 2. Wind shear by terrain features, surface roughness and obstacles
Site Type Wind Shear Exponent α
Sea 0.10
Coast with onshore winds 0.10
Snow-covered crop stubble 0.12
Open, smooth surface (i.e., concrete) 0.20
Cut grass 0.25
Short-grass prairie 0.25
Open agriculture without hedges/fences 0.30
Crops, tall-grass prairie 0.30
Agriculture with homes, hedges at 1,250 m 0.35
Scattered trees and hedges 0.35
Agriculture with homes, hedges at 250 m 0.40

IEA Wind TCP RP19: Micro-Siting Small Wind Turbines for Highly Turbulent Sites 21
Site Type Wind Shear Exponent α
Trees, hedges, a few buildings 0.45
City suburbs, villages, scattered forests 0.31
Larger cities with tall buildings 0.60
Woodlands 0.50
Very large cities, skyscrapers Measure
The value of wind shear exponent (α) is very site specific and can change depending on many
variables (wind direction, atmospheric conditions, agricultural or forest activities, etc.). It is
important to evaluate how it can vary to not overestimate or underestimate the wind turbine
energy production when choosing the hub height.
Estimates of wind energy production can range significantly based on the shear value used;
many site assessors choose the worst conditions to ensure conservatism in the production
estimate. To refine these estimates, modelling or measurements can be used.
As an example of Equation 5, if there are data from two heights, Href1 = 20 m and Href2 = 40 m,
and the value of V = 6 m/s and Vref = 7 m/s, the value of α is
α = log (V/ Vref) / log (Href1/Href2) = log (7/6) / log (40/20) = 0.22 (6)
Table 3 shows annual energy production and the effect of considering two wind shear α values.
As an example with a 4-kW small wind turbine, the next table shows the calculation data from a
site where a met mast with wind speed data at different heights is installed. The values of α are
low because it is at a mountain site with several months of ice and snow. The second column is
the extrapolation up to 50 m, using a Vref at 20 m. The third column is an extrapolation down to
20 m using a Vref at 100 m. The last column is an educational example with a value of
completely different α to see how the estimation at low height may be significantly different.

IEA Wind TCP RP19: Micro-Siting Small Wind Turbines for Highly Turbulent Sites 22
Table 3. Impact of wind shear on annual energy production
Hhub Energy production using extrapolation up method
site specific α = 0.07 with 20-40m data (kWh)
Energy production using extrapolation down
site specific α =0.06 with 20-100m data (kWh)
Energy production using Constant α = 0.30 (kWh)
20 15117* 15381 9742
30 15519 16674 11921
40 15953 16920 13431
50 16138 17115 14562
*Data measured
4.3 Model-Based Approach for Energy Production Estimates
Models have been developed that estimate wind turbine production based on the turbine’s power
curve, estimation of the hub height annual average wind speed and adjustments for terrain,
surface roughness and obstacles. Some of these models are publically available, but most are
commercial products that require payment to use them.
Google Earth and other satellite imaging tools can help identify the locations of obstacles and are
a good initial way to evaluate whether a specific site is suitable for energy production. Typical
site assessments include a site visit to understand the topography of the local sites, the variety of
landforms, property orientation, etc.
One estimate of the cost to have a site modelled in the United States in 2016 was approximately
$500.The model utilizes static wind maps, a gross approximation using annual average site wind
speed and micro-site adjustments. Assumptions that are made include turbine availability,
capacity factor, a Rayleigh distribution, idealized losses, idealized turbine power curve, no inter-
annual variability, no uncertainty and no integrated directional sensitivity.
Another approach would be to measure the wind resource at the proposed turbine location, which
will give greater confidence in understanding potential wind turbine production and therefore
economics. One year of quality data is considered the recommended amount of time necessary to
capture seasonal variations.
4.4 Wind Resource Measurements
While collecting and analyzing wind resource measurements is a usual part of business for the
multi-megawatt turbines used on land and offshore, it is unusual for small wind turbine projects.
Both the cost of wind instruments and the time to collect a year of wind resource data are
deterrents to wind turbine purchases.
While common measurement strategies were used amongst the Task 27 team, the emphasis was
on three-dimensional data, something that would be more costly than data typically required for
customer wind resource assessment. There are many documents that specify the detail of a wind

IEA Wind TCP RP19: Micro-Siting Small Wind Turbines for Highly Turbulent Sites 23
measurement campaign; one of them is the National Renewable Energy Laboratory’s Wind
Resource Assessment Handbook, which is a helpful guide for setting up a monitoring tower and
conducting a meteorological tower wind study. These systems include anemometers, wind vanes
and temperature sensors that are mounted as close to hub height as possible. Calculating the
wind shear exponent requires taking data at two heights. Having wind shear or alpha data is
essential for predicting energy production if the measurements are not at hub height.
4.5 Validation of Site Influence
Based on a field trial of small wind turbines in Ireland under the auspices of the SEAI, sixteen
data sets of wind resource and energy production data were collected. Many of these sixteen sites
used similar or identical wind turbines, but there was quite a spread in the energy production,
which is dominantly accounted for due to site variation.
A study has been conducted that analyzes wind rose, energy rose and kilowatt-hour production
for the same commercial wind turbine model. The study includes two Proven 6, two Iskra, two
Evance R9000 and two Skystream 3.7 wind turbines, as shown in Figure 15 and Table 3.
Figure 15. SEAI field test sites in Ireland

IEA Wind TCP RP19: Micro-Siting Small Wind Turbines for Highly Turbulent Sites 24
Table 3. SEAI field test site data
Power Rating (kW)
Hub height
(m)
Uave @ hub
height
(m/s)
TI @ 15m/s
(%)
Time under test in normal
operation (hours)
Energy Production
(kWh)
Iskra Evance Site A 4.7 12 5.1 13.4 8732 8963
Iskra Evance Site B 4.7 15 4.2 15.9 9385 7908
Proven 6 Site A 5.2 15 6.1 11.7 8038 13703
Proven 6 Site B 5.2 15 4.5 18.1 6370 4181
Skystream Site A 2.1 10 4.7 19.1 9015 3927
Skystream Site B 2.1 10 3.3 19.8 9317 2041
Based on the case study work of evaluating the SEAI field test sites, several conclusions can be
drawn. One is that identical wind turbines' output vary greatly when they are installed in
different places. (A detailed comparison of the outputs of a pair of Skystream wind turbines can
be found in Appendix A. Other case studies are found in “Compendium of IEA Task 27 Country
Case Studies.”)
• Small wind turbine production varies widely compared to accredited test results based on
the complexity of the site. Production estimates are very sensitive to the micro-site details
and impacts.
• This variation in production based on site variance dramatically increases uncertainty in
estimating annual energy production. Production is strongly influenced by the:
o Terrain (turbulence)
o Turbine system used, its design, hub height, control (inverters) and size
o Installer, site selection and system setup.
Besides these conclusions, there are general rules of thumb or guidance that may help practical
small wind turbine micro-siting.

IEA Wind TCP RP19: Micro-Siting Small Wind Turbines for Highly Turbulent Sites 25
5. Rules of Thumb
These rules of thumb or guidelines have been created based on best practices of site assessors in
the United States, CFD rooftop models, wind resource measurements and commercial field test
data. These results may not be quantifiable, but their trends bear consideration, particularly if the
small wind turbine site is in an area of high turbulence or complex terrain, typical of most small
wind turbine installations.
5.1 General Siting
• The turbine should be installed on a high topological point on the property. Often this
location would be the highest within 10 km radially, although this is not always the case.
• Sites close to oceans or large bodies of water have greater, more consistent daily winds, a
steady diurnal resource.
• An owner’s observation of the wind flow at the site will lead to a more efficient site
assessment. Useful information can be found on regional and local wind and terrain
databases.
• Site the tower upwind of obstacles and ground clutter toward the prevailing wind
direction(s) in the area.
• For siting, understanding the prevailing wind direction(s) is as important as
understanding the wind speed.
• Tall, skinny building and obstacles have a lower impact on the wind resource compared
to low, short buildings that trip the boundary layer across a wider plane.
• The challenge of small wind turbines is that they are invariably placed in a complex
environment, but a thorough wind resource assessment would be too costly relative to the
total project cost. At a minimum, a site assessment should be completed.
• Turbulence can reduce the annual energy output estimate anywhere from 15% to 30%.
5.2 Displacement Height
• Displacement height affects wind profile and necessary tower height.
• For forests, use a displacement height of:
o 67% of canopy height for dense deciduous forests
o 75% of canopy height for dense evergreen forests.
• For a line of trees, assume 100% displacement height.
5.3 Wind Speed Estimates
A special note for hills:
• For every 100 m increase in elevation, get 0.5 m/s increase of wind speed for small hills.
• 16.7% slope = a 1 m rise for a 6 m run
o 180% increase in wind speed

IEA Wind TCP RP19: Micro-Siting Small Wind Turbines for Highly Turbulent Sites 26
• 25% slope = a 1 m rise for a 4 m run
o 200% increase in wind speed
• 50% slope = a 1 m rise for a 2 m run
o 125% increase in wind speed + turbulence!
• Round down for sites with higher turbulence intensity. (Turbulence affects output only; it
doesn’t affect mean wind speed.)
5.4 Tower Height
The recommended approach for ground-mounted towers is to make sure that the lowest point of
the rotor-swept area is higher than twice the height of the tallest obstacle within the distance
described in Section 3.2. (Note: Round up if the specific tower height is not commercially
available.) When assessing tree obstacles, consider the future height of mature trees (20 to 30
years old). Generally, taller towers access higher wind speeds, though there is a balance between
equipment costs and energy production.
5.5 Rooftop Rules
Rooftop and urban installations require more planning to gather consensus from stakeholders and
to understand the wind resource that is available. Rooftop installations that have been studied
show a significant reduction of energy production compared to peri-urban and rural sites. For a
comprehensive discussion on installations in the built environment, look for NREL’s
Deployment of Wind Turbines in the Built Environment: Risks, Lessons, and Recommended
Practices.
Rules of thumb include:
• Special care and engineering are needed in mounting a turbine on a rooftop.
• Never install a turbine or turbine tower on the wall of a building.
• Corners of the building have higher wind speed and lower turbulence but more safety
risk.
• A rail or lip around the edge of the building sets a new “zero” for displacement height.
• Areas around buildings are complex, high-turbulence sites that produce less electricity,
and the wind turbine lifetime will be reduced.
• Make sure the insurance carrier knows about the installation.
• Based on CFD simulations, a flat roof is the most conducive to the installation of a
rooftop wind turbine, and locations that are at the upstream edge of the roof are best.
Also, CFD simulations indicate that other roof shapes such as gabled, pyramid, vaulted
and triangular roofs may offer better wind speeds.
5.6 CFD Simulations
When the site is complex, CFD may have an added value for micrositing. CFD simulations can
help to visualize the flow field over the site. If a CAD model for the site is available, CFD
simulations can be inexpensive to conduct. Several companies offer CFD modelling services.
Two recommended practice documents for CFD simulation in urban environments are COST

IEA Wind TCP RP19: Micro-Siting Small Wind Turbines for Highly Turbulent Sites 27
Action 732 (Best Practice Guideline for the CFD Simulation of Flows in the Urban
Environment) and AIJ Guidebook (AIJ Benchmarks for Validation of CFD Simulations Applied
to Pedestrian Wind Environment around Buildings).

IEA Wind TCP RP19: Micro-Siting Small Wind Turbines for Highly Turbulent Sites 28
6. Conclusions
Understanding the turbulence in the airflow and its impact for all possible sites across the globe
poses a daunting challenge. Over time, this document will become obsolete as new business
models are developed, which may ease the need for self-education for project developers:
Packaged services might become available that improve understanding of the wind resource,
optimally siting the wind turbine, assessing economic benefits as well as handling the actual
installation and maintenance work. In the meantime, markets that are experiencing growth
should consider training and developing professional site assessors to ensure good small wind
installations.
Understanding the practical impact of turbulence is just beginning, and there are still technical
challenges and opportunities such as:
• Gaining a better understanding of the three-dimensional wind resource, particularly the
vertical velocity and the behaviour of turbines in complex terrain.
• Using smarter/intelligent turbine control systems that are adaptive to site conditions
• Generating accredited power curves for different levels of turbulence
• Developing training programmes in site assessment/selection and system setup for
installers.

IEA Wind TCP RP19: Micro-Siting Small Wind Turbines for Highly Turbulent Sites 29
Appendix A Case Study: Twelve West Location: Portland, Oregon, United States
Turbine type: Skystream 3.7
Number of turbines: Four
Installation date: 2009 Building integrated: Roof mounted (23-story building, mounted on 45-
foot poles, blades at an elevation of 82 meters)
Estimated production: ~9,000 kWh yearly, or ~1% of the building's electricity. Actual production:
~5,500 kWh per year
Cost: $20K per turbine; $240,000 for entire installation (mounting pads, engineering, etc.)
Incentives: 30% federal Investment Tax Credit in cash at project completion
Payback: ~40 years
Maintenance record: Have had issues with Turbine #3 (does not spin on occasion and must be
restarted). This is under control with building management.
What was the primary project objective? Raise awareness about renewable energy. Elevate the
visibility of the building. Underscore the building’s sustainability commitment. Did the installation
meet those goals? Rooftop wind in urban environments is challenging and has not evolved as much
as we had hoped; however, all other objectives were met, and we consider this installation a
success. Given your experience and the lessons you’ve learned, what suggestions would you give
to another organization determined to develop a similar project? Take advantage of and leverage
as many resources as you can. Make sure the turbine project is a good fit for your site; a token
array that never spins will be detrimental when it comes to public opinion. Pay careful attention to
turbine siting. A prominent wind specialist from the Netherlands advised us on turbine placement
based on the wind patterns in the area. Research the products well, and get comfortable with the
fact that the manufacturer may go out of business (many of these companies are start-ups), which
makes replacement/repair and warranty enforcement difficult.
Additional notes: Turbine choice: Due to the limited data regarding built environment wind
installations, project developers didn’t know what to anticipate in terms of turbine selection. None
of the turbines researched had long track records for this type of installation, so the group
conducted a significant investigation to identify what turbines would be best to use. Project
developers conducted in-depth research during their turbine selection process, visiting multiple
vendors and installations prior to selecting Southwest Windpower Inc. as the turbine supplier. One
factor that influenced the selection was the company’s compliance with European certification
standards (Greeson 2010).
Development process: The wind turbines were part of a larger project: the design and construction
of a 23-story LEED Platinum-certified mixed-use apartment and office building. Project
developers decided to utilize solar and wind energy to help reach their LEED goal. The turbines
were integrated into the building design early in the process, allowing the building’s developers
time to consult with experienced wind energy professionals to properly assess the site prior to
installation. During this period, the developers conducted a thorough site assessment that included
flow pattern simulations conducted at the Oregon State University’s Aero Engineering Lab. The

IEA Wind TCP RP19: Micro-Siting Small Wind Turbines for Highly Turbulent Sites 30
project developers also had to engage in discussions to address Federal Aviation Administration
concerns related to the combined height of the building and project.
Public interest: Project developers believe the installation’s visibility and the attention it has
created for renewable energy and sustainability have been phenomenal. The installation has helped
the building become a unique and recognizable feature in the city of Portland. Sound impacts:
Since the project is located directly above the building’s penthouse units, special consideration
had to be given to reducing the potential sound impacts of the installation. This increased costs but
was essential to overall project success.

IEA Wind TCP RP19: Micro-Siting Small Wind Turbines for Highly Turbulent Sites 31
Appendix B: Examples of Good and Bad Small Wind Turbine Sites
Appendix B focuses on one pair of small wind turbines (i.e., two of the same turbine product) at
two different owner sites and their results based on field measurements carried out over an
eighteen-month period from January 2011 to June 2012. (Studies on two other pairs of small
wind turbines (i.e., four turbines) can be found in the separate case studies companion
document.) For each owner site, location details, including photos and descriptions, are given.
Post quality checked data for each turbine pair are analyzed to obtain the site wind speed
distribution along with raw and binned turbulence intensity curves and power curves. The power
curves are also compared to the published accredited power curves.
The observed impacts on the electrical energy output performance or production of the wind
turbines are discussed below. Key observations and lessons learned from a owner’s point of view
are highlighted. The binned turbulence intensity values and standard deviations are also tabulated
to show the more frequent turbulence intensity values that the turbine experiences in each of the
measured wind speed bins. To gain insights into local obstacle impacts, the power and energy
output of the turbine are binned in eight sectors for directional power and turbulence intensity
curves. Since owners are most interested in the energy (kWh) their turbine will give them, a 72
sector (5o width) directional energy output rose or an electrical energy rose is plotted and
overlaid on a local plan view of the site. A summary of key findings and observations are
collated, and conclusions are listed in the end. All photos and graphs in this case study were
provided courtesy of Dundalk Institute of Technology in Ireland.
Figure B.1. Location of two Skystream wind turbines at different sites
B.1 Site A
This turbine is located in southeast Ireland about 2.5 km from the coast. The turbine is elevated
above its local surroundings on a small hill. Figure B.2 shows a photo of Site A. The location
coordinates are 52°11'35.02"N and 7°15'43.98"W and the site elevation is 70 m a.s.l.

IEA Wind TCP RP19: Micro-Siting Small Wind Turbines for Highly Turbulent Sites 32
Figure A.2. Skystream wind turbine at Site A
B.1.1 Wind Turbine System Description
Table B.1 summarizes the wind turbine system. Note that both of the Skystream turbines are
installed on a 10-m tower, a relatively short tower for most commercial sites.
Table B.1. Summary of wind turbine system
Wind turbine Skystream 3.7
Rated power* 2.1 kW @ 11 m/s
Tower height (type) 10 m (monopole)
Inverter Internal to system
Application Utility grid connected to a house
B.1.2 Site A Description
As shown in Figure B.3, the turbine is located on a small hill that is elevated above its
surroundings. There are houses located in directions from east clockwise to northwest. Some
short trees exist to the west of the site. The view to the northeast is relatively open with few
obstacles.

IEA Wind TCP RP19: Micro-Siting Small Wind Turbines for Highly Turbulent Sites 33
Looking West Looking North
Looking South Looking East
Figure B.3. On-site views from turbine location
B.1.3 Site A Performance
Table A.2 summarizes the mean wind speed, energy and turbulence indicators that were
measured during the test. Only summary results are given here. Refer to the ‘Compendium of
Case Studies’ for more technical details.
Table B.2. Summary results
Time under test (hrs) 9015
Mean wind speed (m/s) 4.7
Metered energy (kWh) 3927
TI (%) + 1 std dev (%) [15 m/s bin] 19.1 + 4.0
TI (%) + 1 std dev (%) [5 m/s bin] 19.7 + 5.4

IEA Wind TCP RP19: Micro-Siting Small Wind Turbines for Highly Turbulent Sites 34
B.1.4 Site A Wind Resource Analysis and Power Curve Performance
Site A has a mean wind speed of 4.7 m/s over the test period and corresponding wind speed
distribution (Figure B.4). The dominant wind direction is from the southwest. The westerly and
southerly sectors show distinct reductions in wind speed.
Figure B.4. Wind speed distribution and wind rose
Scatter and binned plots of the measured power curve and turbulence intensity are shown in
Figure B.5.
Figure B.5. Power curve and turbulence intensity curve
A high degree of scatter in the power curve data is observed. The mean turbulence intensity
value of 0.19 at 15 m/s exceeds 0.18 prescribed in the IEC 61400-2 edition 3 small wind
standard but has a high probability of reaching 0.23 (i.e., one standard deviation above the mean
turbulence intensity value).

IEA Wind TCP RP19: Micro-Siting Small Wind Turbines for Highly Turbulent Sites 35
B.1.5 Site A Directional Power and Turbulence Curves and Analysis
The turbulence intensity and power curves vary with direction. The power curve exceeds the
accredited power curve up to approximately 9 m/s and rapidly deviates below the accredited
power curve above this wind speed. All directional sectors have high turbulence with the
exception of the northeast (45 deg), which has an unobstructed fetch. The power curve in this
direction reaches the highest values at 10 m/s but is lower than the other directional power
curves below 8 m/s, which indicate that this turbine performs better in higher turbulence at lower
wind speed.
Figure B.6. Directional power curves and turbulence intensity curves
B.1.6 Directional Energy and Obstacles
An electrical or total energy rose shows the kilowatt-hour output with direction [x]. This is
plotted in Figure B.7. Like the wind rose, it has a distinct shape showing that the majority of
useful electrical energy generated by the turbine is generated from the south-southwest sectors
with some contributions from the north-southwest and northwest sectors.
Figure B.7. Electrical energy rose
An overlay of the output energy rose on a local plan view is shown in Figure B.8. Local
obstacles are numbered and described in Table B.3.
Energy Rose

IEA Wind TCP RP19: Micro-Siting Small Wind Turbines for Highly Turbulent Sites 36
Figure B.8. Electrical energy rose overlaid on Site A plan view with numbered obstacles
The energy rose appears to be shaped by a number of obstacles in the west and southwest
directions, with most of the energy coming between Obstacles 5 and 6. The influence of
Obstacles 1 and 5 influence the amount of energy coming between them. Obstacles 2, 3 and 8 to
the southeast have little impact on energy production combined with the fact that this direction is
not a prevailing wind direction. The northeast is not a prevailing wind direction so little or no
energy is produced despite being relatively obstacle free.
Table B.3. Site A local obstacle descriptions
Obstacle Distance (m) Height (m) Width (as seen from wind turbine)
Comments
1 120-345 9 125 houses
2 26-45 9 16 owner’s house
3 80-106 9 28 house
4 142-160 9 20 house
5 100-122 9 30 house
6 90-114 12 50 trees
7 184-302 9 40 (70) houses (trees)
8 126-136 9 15 house
9 250-260 9 (12) 20 (70) houses (trees)

IEA Wind TCP RP19: Micro-Siting Small Wind Turbines for Highly Turbulent Sites 37
Obstacle Distance (m) Height (m) Width (as seen from wind turbine)
Comments
10 305-417 9 (12) 30 (66) house/dense trees
11 135-170 bushes/scrub
12 150-270 9 (12) 70 (102) (134) houses (trees)
13 450 86 (elevation?)
130 small hill
Figure B.9. Electrical energy rose overlaid on regional plan and labeled topographical features
In the case of the broader regional topography, all hills are greater than 22 km (Oval A) away
with an elevation of 705 m. They don’t appear to have a significant impact on the shape of the
energy rose, implying that local obstacles are the dominating influence. In comparison, the coast
is 2.5 km away from Site A at an elevation of zero.
B.2 Site B
This Skystream wind turbine is located in a rural location in southeast Ireland. The location
coordinates are 52°19'23.69"N and 6°52'41.34"W and the site elevation is 51 m (a.s.l.). Figure
B.10 shows the wind turbine at the owner site.

IEA Wind TCP RP19: Micro-Siting Small Wind Turbines for Highly Turbulent Sites 38
Figure B.10. Skystream wind turbine at Site B
B.2.1 Site B System Description
The wind turbine system used is described in Table B.4, and the site plan view is shown in
Figure B.11 (the turbine location is identified with a red dot). Note that a 10-m tower is
considered short for most commercial installations.
Table B.4. System description
Wind turbine Skystream 3.7
Rated power* 2.1 kW @ 11 m/s
Tower height (type) 10 m (monopole)
Inverter Internal to system
Application Utility grid connected to a house
Figure B.11. Plan view of site
N

IEA Wind TCP RP19: Micro-Siting Small Wind Turbines for Highly Turbulent Sites 39
The site has a number of obstacles such as houses to the north and northeast with forest to the
south and east. Obstacles to the west are sparse. Figure B.12 shows the view and obstacles from
the turbine location.
Looking North Looking East
Looking South Looking West Southwest
Figure B.12. On-site views from turbine location
The forests as seen from the east will have an impact on displacement height.
B.2.2 Site B Performance Summary
Table B.5 summarizes measurement results for mean wind speed energy and turbulence
indicators during the test.

IEA Wind TCP RP19: Micro-Siting Small Wind Turbines for Highly Turbulent Sites 40
Table B.5. Summary results
B.2.3 Site B Wind Analysis and Power Curve Performance
The site has a mean hub height wind speed of 3.3 m/s over the 18-month test period with a speed
distribution shown in Figure B.13. The dominant wind directions are from the southwest with
contributions from the west and northwest, as shown by the wind rose.
Figure B.13. Wind speed distribution and wind rose
Scatter and binned plots of the measured power curve and turbulence intensity are shown in
Figure B.14. The high wind percentage value at 0 m/s is partially due to the lower limit of
anemometer defaulting to 0 m/s in very low winds, which is more common at this low wind site.
There is also a high degree of scatter in the power and turbulence intensity curves compared to
Site A. The integrated controller is programmed differently compared to the previous system that
contributes a different power curve. The mean turbulence intensity value at 15 m/s exceeds 0.18
prescribed in the IEC 61400-2 third edition small wind standard but has a high probability of
reaching 0.24 (i.e., 1 standard deviation above the mean turbulence intensity value of ~ 0.12 at
15 m/s).
Time under test (hrs) 9317
Mean wind speed (m/s) 3.3
Metered energy (kWh) 2041
TI (%) + 1 std dev (%) [15 m/s bin] 19.8 + 4.3
TI (%) + 1 std dev (%) [5 m/s bin] 22.4 + 5.8

IEA Wind TCP RP19: Micro-Siting Small Wind Turbines for Highly Turbulent Sites 41
Figure B.14. Power curve and turbulence intensity curve
B.2.4 Site B Directional Power and Turbulence Curves and Analysis
The turbulence intensity and power curves vary with direction, as shown in Figure B.15. The
power curves exceed the accredited power curve up to approximately 8 m/s and rapidly deviate
below the accredited power curve above this wind speed. All directional sectors have high
turbulence. The northwest (315 deg) has the lowest turbulence above 5 m/s and maintains the
highest output power at higher wind speeds. All power curves below 8 m/s have higher values
than the accredited power curve, which indicate that this turbine performs better in higher
turbulence at lower wind speed.
Figure B.15. Directional power curves and turbulence intensity curves
B.2.5 Site B Directional Energy and Obstacles
An electrical energy rose shows the kilowatt-hour output with a dominant energy producing
direction just shy of 240 degrees (plotted in Figure B.16). This is highly directional with the
majority of the energy from the southwest with some contribution from the northwest.

IEA Wind TCP RP19: Micro-Siting Small Wind Turbines for Highly Turbulent Sites 42
Figure B.16. Electrical Energy Rose
An overlay of the energy rose on a site plan (Figure B.17) shows a forest (4, 5 and 6) to the south
and hedge row (7) south of the turbine running east-west, which has a significant energy-
reducing impact. Most of the energy comes between Obstacles 7 and 1, where there is a narrow
opening where utility lines enter the site and create a long wind channel from the southwest.
There is some contribution from the northwest between Obstacles 1 and 9, where there are small
openings (i.e., a gap north of Obstacle 1 and a more porous hedgerow). Trees and houses to the
north and northeast combined with non-prevailing winds reduce energy output from these
directions to almost nothing.
Figure B.17. Electrical energy rose overlaid on plan view with numbered obstacles
Table B.6 shows local obstacles, their distance, their height and their width, as well as some
general classifications of the obstacle. These are all measured from the turbine location.
Energy Rose

IEA Wind TCP RP19: Micro-Siting Small Wind Turbines for Highly Turbulent Sites 43
Table B.6. Local obstacle descriptions
Obstacle Distance (m) Height (m) Width (as seen from wind turbine)
Comments
1 260-330 12 112 farm sheds
2 24-60 24 50 trees
3 64-180 9 30 houses
4 210 312 across forest forest corner east
5 260 130 (4 to 5) forest corner middle
6 212 200 (5 to 6) forest corner southeast
7 160-260 10 40 hedge
8 485-680 12 110 farm sheds
9 355-396 9 40 house
The directional electric energy rose shown in Figure B.18 highlights the influence of wind
direction on energy production. When compared with the site plan, it seems to suggest the
impact of blockages to the wind where there is sufficient wind to produce energy.
Figure B.18. Electrical energy rose overlaid on regional plan

IEA Wind TCP RP19: Micro-Siting Small Wind Turbines for Highly Turbulent Sites 44
From a macroscopic perspective, Site B is influenced by the ocean that is east 30 km away and
south 17 km away. In the case of the broader regional topography, there are no significant hills to
impact the shape of the energy rose, implying that local obstacles are the dominating influence.
Comparisons of the power curves of Sites A and B with the accredited power curve are shown in
Figure B.19. They demonstrate that power curves are very site specific and can vary widely from
their published accredited power curves.
Figure B.19. Site power curve comparison with accredited power curve
Figure B.20 compares the power curves generated with different turbulence intensity values. Site
A (9,015 hours of operation producing 3,927 kWh for a 4.7 m/s site) was a far more productive
site and shows the degradation of the power curve with increasing turbulence intensity. In the
earlier analysis, Site A has an I15 of 19.1 +4 % and Site B has an I15 of 19.8 + 4.3%.
The right side of Figure B.20 shows Site B (9,317 hours of operation producing 2,041 kWh for a
3.3 m/s site), the poor-performing site with a lower annual wind speed and increased blockage by
obstacles.

IEA Wind TCP RP19: Micro-Siting Small Wind Turbines for Highly Turbulent Sites 45
Figure B.20. Site power curve comparison with accredited power curve for different turbulence ranges for Site A (left) and Site B (right)

IEA Wind TCP RP19: Micro-Siting Small Wind Turbines for Highly Turbulent Sites 46
References
1. U.S. Department of Energy. 2018. Distributed Wind Resource Assessment Framework:
Functional Requirements and Metrics for Performance and Reliability Monitoring.
NREL/TP-5000-72523. National Renewable Energy Laboratory (NREL), Golden, CO.
2. Chiras, Dan. 2009. Power From the Wind: Achieving Energy Independence, ISBN
086571620X (ISBN13: 9780865716209). New Society Publishers.
3. U.S. Department of Energy. 2016. Small Wind Site Assessor Guidelines. NREL/TP-5000-
63696. National Renewable Energy Laboratory (NREL), Golden, CO.
4. Wegley, H.; Ramsdell, J.; Orgill, M.; Drake, R. A Siting Handbook for Small Wind Energy
Conversion Systems, Pacific Northwest Laboratory/Battelle Memorial Institute, Contract DC-
AE06-76 RLO 1830, 1980.
Bibliography
AWS Scientific Inc. 1997. “Wind Resource Assessment Handbook—Fundamentals for
Conducting a Successful Monitoring Program”. Prepared for the National Renewable Energy
Laboratory (NREL), Golden, CO, USA. https://www.nrel.gov/docs/legosti/fy97/22223.pdf.
Chiras, Dan. 2009. “Power from the Wind.” New Society Publishers.
Encraft. 2009. “Warwick Wind Trials,”
http://www.microwindturbine.be/Rapportering_files/Warwick+Wind+Trials+Final+Report+%28
1%29.pdf.
Fields J., Oteri F., Preus R., and Baring-Gould I. 2016.”Deployment of Wind Turbines in the
Built Environment: Risks, Lessons, and Recommended Practices” National Renewable Energy
Laboratory (NREL), Golden, CO NREL/TP-5000-65622.
Fields J., Tinnesand H., and Baring-Gould, I. 2016. “Distributed Wind Resource Assessment:
State of the Industry”. National Renewable Energy Laboratory (NREL), Golden, CO. NREL/TP-
5000-66419.
IEC. 2017. Annex A of IEC 61400-12-1: “Wind energy generation systems – Part 12-1: Power
performance measurements of electricity producing wind turbines.”
https://webstore.iec.ch/publication/26603.
Manwell, J.F., J.G. McGowan, and A. L. Rogers. 2008. “Wind Energy Explained: Theory,
Design and Application”. John Wiley. West Sussex, United Kingdom. ISBN 978-0-470-01500-
1.
NREL, “U.S. Small Wind Consumers Guide”. https://windexchange.energy.gov/small-wind-
guidebook#enough.
Olsen, Tim, and Robert Preus. 2016. Small Wind Site Assessment Guidelines. NREL/TP-5000-
63696. National Renewable Energy Laboratory (NREL), Golden, CO, USA.
https://www.nrel.gov/docs/fy15osti/63696.pdf.

IEA Wind TCP RP19: Micro-Siting Small Wind Turbines for Highly Turbulent Sites 47
Pena Diaz, Alfredo; Bechmann, Andreas; Conti, Davide; Angelou, Nikolas; Mann, Jakob. 2016.
“The fence experiment - a first evaluation of shelter models” Journal of Physics: Conference
Series (Online) DOI:10.1088/1742-6596/753/7/072009.
Sagrillo Wind and Sun. 2018. “Small Wind (up to 100 kW) Issues and Small Wind Site
Assessors.” Task 27 meeting April 11-14, 2018 Minneapolis, Minnesota, USA.
Taivalkoski, A.; Sagrillo, M.; Hasselman, R. 2010. “Revised Wind Shear Values.” Accessed
August 11, 2018. www.smallwindtraining.org/wp-content/uploads/2011/12/16-Revised-Shear-
Values.pdf.
Toja-Silva, Francisco, Takaaki Kono, Carlos Peralta, Oscar Lopez-Gar, and Jia Chen. “A review
of computational fluid dynamics (CFD) simulations of the windflow around buildings for urban
wind energy exploitation.” Journal of Wind Engineering & Industrial Aerodynamics 180 (2018)
66–87. https://authors.elsevier.com/a/1XS1jc73TPsv5.
Wegley, H. J. Ramsdell, M. Orgill, and R. Drake. 1980. A Siting Handbook for Small Wind
Energy Conversion Systems. Pacific Northwest Laboratory/Battelle Memorial Institute, PNL-
2521. https://www.osti.gov/servlets/ NREL/TP-5000-65622 June 2016 purl/5490541.
Saif ur Rehman,, Muhammad Shoaib, Imran Siddiqui, Firoz Ahmed, Muhammad Rashid
Tanveer1 and Saif Uddin Jilani. “Effect of Wind Shear Coefficient for the Vertical Extrapolation
of Wind Speed Data and its Impact on the Viability of Wind Energy Project”. Journal of Basic &
Applied Sciences 11 (2015) 90-100.
http://www.lifescienceglobal.com/pms/index.php/jbas/article/view/2723/1595.
IEC. 2013. Annex M of IEC 61400-2: Wind turbines Part 2: Small Wind Turbines
https://webstore.iec.ch/publication/5433