experiments on the metering of large volumes of air ·...
TRANSCRIPT

RP335
EXPERIMENTS ON THE METERING OF LARGEVOLUMES OF AIR
By Howard S. Bean, M. E. Benesh, 1 and Edgar Buckingham
ABSTRACT
The investigation comprised the following three kinds of experiment:(a) Experiments on the flow of air from a large gas holder through a rotary
displacement gas meter of 200,000 cubic feet per hour rated capacity, a 24 by12 inch Venturi meter, and various thin-plate orifices installed in a smooth24-inch pipe. The rate of flow was determined from observations on the holder,which was flooded by a stream of water, to control the temperature. The aver-age precision of a determination was better tnan ±0.5 per cent.
(6) Series comparisons of the orifices with the Venturi, without using theholder.
(c) Observations on the distribution of static pressure along the wall of thepipe near the orifices, at various rates of flow.
The apparatus, experimental procedure, and methods of computation aredescribed, and tables of results are given.The rate of flow shown by the rotary displacement meter agreed with the rate
computed from observations on the holder to within about 0.5 per cent; and thedischarge coefficient found for the Venturi was in good agreement with earlier
published values for similar Venturis, tested with water.When the values obtained for the discharge coefficients of the orifices were so
reduced as to be comparable with the most complete and accurate publishedvalues for water, the agreement was very satisfactory.
CONTENTSPage
I . Preface 94II. Introduction : 95
III . General arrangement of the apparatus 96IV. Holder 96
1. Measurement of the dimensions 962. Height measurements 983. Control and measurement of temperature 994. Leakage test 100
V. Orifice meter installation 1001. Orifices 1002. Pipe 1013. Honeycombs 101
K4.Pressure taps 101
5. Water manometers 1026. Wet and dry bulb psychrometer 102
VI. Rotary displacement meter 102VII. Venturi meter 103
VIII. Auxiliary instruments and operations 1031. Regulation of the rate of flow 1032. Barometer 1033. Clock 1034. Photographic recording 104
1 Chief gas research engineer, The People's Gas Light & Coke Co., Chicago, III.
93

94 Bureau of Standards Journal oj Research [vol 7
PageIX. Variation of pressure along the pipe near an orifice ', 104
1. Experiments 1042. Mode of representing the results 1043. Tables of results 1054. Variation of pressure distribution with speed of flow 1115. Variation with diameter ratio
, 113X Experiments with the holder 113
1. Procedure *_ 1132. Saturation in the holder 1153. Computation of the rate of flow of dry air along the line 1164. Computation of the density and rate of flow of moist air at
any section of the line 1175. Reduction of the observations on the orifices 1196. Reduction of the observations on the Venturi 1197. Reduction of the observations on the rotary displacement
meter 120XI. Results of the experiments with the holder 121
1. General characteristics of the runs 1212. Results of the tests of the rotary displacement meter 1223. Results of the tests of the Venturi meter 1244. Discussion of the results obtained with the Venturi 1255. Discharge coefficients of the orifices 126
XII. Comparison of the orifices with the Venturi 1271. Experimental procedure 1282. Computations 1283. Results of the comparisons 129
XIII. Discussion of the results of the experiments on orifices 1301. Reduction for change of tap location 1302. Allowance for varying density; the expansion factor 1323. Witte's values of K for smooth pipes 1354. Comparison of the Chicago results for air with Witte's results
for water 1365. Conclusions from the foregoing comparison 1386. Remarks 1397. Graphical representation of Tables 16, 17, and 18 140
XIV. Summary 142Note A—The adiabatic discharge coefficient 143Note B—The Reynolds number 144
I. PREFACE
The investigation discussed in the following paper was initiated bythe American Gas Association and was carried out, with the coopera-tion of the National Bureau of Standards, under the general oversight
of a committee appointed by the association, on which the bureauwas represented.The work was done during the summer and autumn of 1924 at the
Pitney Court Station of the People's Gas Light & Coke Co., of Chicagowhere a large gas holder and other important facilities were placed
at the disposal of the committee. The company also furnished assist-
ance of various kinds, and bore a large share of the cost of the opera-
tions.
The committee was indebted to the Builders Iron Foundry, of
Providence, R. I., for the loan of a Venturi meter; to the Connersville
Blower Co., of Connersville, Ind., for the loan of a rotary displace-
ment meter; and to the Republic Flow Meters Co., of Chicago, 111.,
for the loan, or the special construction, of numerous small butessential parts of the apparatus.The National Bureau of Standards contributed in the matter of
standardizing measuring instruments, and by advice or suggestions
regarding experimental methods and the reduction of observations.

iSniXf'] Experiments on Large Gas Meters 95
One of the present authors (Benesh), acting as chairman of thecommittee, made the detailed plans for the experiments and the workwas carried out under his immediate supervision. Another of theauthors (Bean) represented the bureau during the experiments, andparticipated in them as an observer. The remaining author (Bucking-ham) served as a member of the committee and as an adviser in
theoretical matters. He is responsible for the form in which theresults are presented, but in preparing the paper he has receivedmuch indispensable assistance from his two colleagues.
II. INTRODUCTION
The main object of the undertaking was to test the accuracy of
several types of meter which are in common use for measuring large
quantities of gas at pressures near atmospheric. The meters in ques-tion were: (a) A series of round, square-edged orifices installed con-centrically, one at a time, in a straight, smooth pipe of 24 inchesnominal diameter; (6) a rotary displacement meter of a rated capacityof 200,000 cubic feet per hour; and (c) a 24 by 12 inch Venturi meter.A few tests were made on a large, wet drum, station meter, but they
did not reveal anything of general interest. Observations were also
made on a Thomas electric meter, but the method of operation wasmodified from standard commercial practice, and while the results
were of interest to the makers of the meter, they might be misleadingto others and will not be reported here.
The tests were made with air, and the large gas holder served as
the absolute standard to which the other meters were referred; butin addition to the laborious and time-consuming experiments with theholder, a number of intercomparisons were made, without using theholder.
A third section of the investigation consisted in observations onthe longitudinal distribution of pressure along the wall of the 24-inchpipe near the orifices. These were needed in order that the results
obtained when using the orifices as meters might be compared withthe published results of other observers.
The general scheme of the holder experiments was as follows : Theinner lift of the holder, the only one used, was first filled with air bya centrifugal booster, warm water being sprayed into the intake to
insure saturation. The connections were then changed and air waswithdrawn from the holder by the booster and forced along the test
line in which the meters were installed in series. From the dimensionsof the holder and its rate of fall, together with observations of pressureand temperature, the mean rate of outflow of air was computed.This was then compared with the mean indications of the metersduring the run and their correction factors or coefficients were thusdetermined with reference to the holder as the standard.
In the intercomparison tests and in the experiments on the longi-
tudinal distribution of pressure near the orifices, the booster wasdisconnected from the holder and drew its air from outside.
60869—31 7

96 Bureau of Standards Journal of Research [VoU7
III. GENERAL ARRANGEMENT OF THE APPARATUS
The arrangement of the line in which the meters were installed is
shown schematically in Figure 1, the notation being as follows:
^L = pipe leading from the holder to the booster.
B = the booster.= the pair of flanges for holding the orifice plates.
R. D. = the rotary displacement meter.W. D. = the connections to the wet drum meter.
V=the Venturi meter.T=a 20-inch Thomas electric meter.
Hi . . . Hi = honeycombs.Pi . . . P4 = wet and dry bulb psychrometers.
tij £2= dry bulb thermometers.
M=the bank of water manometers.Starting at the holder (off the sheet to the left), the pipe A ran
underground for about half its length and then up to the secondfloor of the meter house, where the centrifugal booster was situated.
From the booster, the piping led down to the ground floor, to theentrance of the first straight section of the test line proper, containingthe orifice station, the lower line in Figure 1.
By means of details not shown in the figure, provision was madefor changing the connections of the booster so as to permit of : (a) Fill-
ing the holder with air from outside, (6) withdrawing air from theholder and sending it along the test line through the meters, and(c) drawing air from outside and sending it directly into the test line.
The general appearance of the 41 by 90 foot first floor room may begathered from the view in Figure 2, taken from a point near the middleof the lower edge of Figure 1. In the foreground are the watermanometers and the cathetometers for reading them, and behind themanometers is the 24-inch pipe containing the orifice station. Theline containing the Venturi meter was parallel to the orifice line,
about 10 feet to the left and behind. The rotary displacement meteris shown in the right background. This meter could be either in-
cluded in the line or by-passed, by shifting a blank plate from oneflange joint to another.The wet drum meter, which came next after the rotary displace-
ment meter, was by-passed in all the experiments to be reported, andit is not necessary to describe the somewhat circuitous route by whichthe air reached the entrance to the straight pipe leading to theVenturi meter.
IV. HOLDER1. MEASUREMENT OF THE DIMENSIONS
The mean radius of the inner lift of the holder was found by the
following process: The distance from a mark at the center of the
crown to a punch mark on each of the 21 columns of the surroundingframework was measured with a steel tape. By means of a plumbline, a second mark was located on each column, directly below the
first at a convenient1- height for measuring the distance from the
column back to the shell, and this distance was measured. Depart-ures of the plating from verticality were determined along each

Bean, Benesk,~\
Buckingham JExperiments on Large Gas Meiers 97

98 Bureau of Standards Journal of Research [Vol. 7
column by means of a surveyor's transit sighted^on a rider whichcould be raised or lowered while bearing against the shell plates.
This work was done on calm days, and precautions were taken to see
that the holder did not move while the measurements were in progress.
The mean external radius thus determined was based on 42 meas-urements of the distances from the center of the crown to the columns
;
63 of the distances from the columns to the shell; and 1,008 of thedepartures from the vertical. After allowing for the thickness of theplates and the volume of the internal bracing, the effective meaninternal radius was computed to be 83.872 feet, giving an averagehorizontal cross section of 23,098 square feet.
The profile of the crown was determined along two nearly perpen-dicular diameters by means of a surveyor's level, and the volume wascomputed from the average of the two profiles. The fixed timberinginside the holder and above the water was measured and gave a smallcorrection to be subtracted from the crown volume, which was thusfound to be 106,294 cubic feet.
2. HEIGHT MEASUREMENTS
The fall of the holder during a run was measured at four pointsspaced nearly equally around the circumference. At each end of onediameter a bronze tape, suspended from the guide arm projectingfrom the edge of the crown, hung down into the water of the tank andcould be read against an index mounted on a float. At each end of
the diameter perpendicular to the first, a square copper wire, notchedon one side to form a rack, was similarly suspended and was guided byrollers to engage a small pinion on a 4-dial gear train mounted on a
float, so that any vertical motion of the holder was registered as achange of the dial readings. A preliminary calibration of the dial
train was effected by running it along the wire, stretched horizontallyunder the same tension as when suspended, with a tape beside it onwhich the distance moved could be read directly.
The reason for adopting the dial mechanisms was to permit of
photographic recording, for it was found impracticable to get clear
pictures of the divisions on the tapes; but all the measurements wereultimately referred to the tapes as standard, the tapes being read bytwo observers at a time signal given by the snapping of the cameraswhich photographed the dials.
If the holder tips to one side during the run, the measurements of
the fall at opposite ends of a diameter may differ, but aside fromaccidental errors, their mean should agree with the mean of the valuesfound at the ends of a diameter perpendicular to the first. Examina-tion of the whole series of measurements, assuming the preliminarycalibrations to be valid, showed that there were systematic differences
between the mean of the dials and the mean of the tapes, and also
between the dials. And since there was no reason to suspect anysystematic error in the mean of the values obtained from the tapes,
the preliminary calibrations of the dials were ignored in the final
reduction of the observations, and the dial values were corrected so as,
on the average, to agree with the tape values.
The remaining differences, for the separate runs, between the twomean values of the fall, one from the tapes and one from the dials,
were then to be attributed to accidental errors. They ranged from

555
C3
^
«
oM

B. S. Journal of Research, RP335
Figure 3.
—
Honeycomb

BuclinghTm'] Experiments on Large Gas Meters 99
nothing up to 1.7 per cent of the fall, with an average of ±0.43 percent, and may have been due partly to bending of the tapes or wiresby wind.The wires were, of course, held taut by weights on their lower ends,
but there was no evidence of a progressive stretching during the courseof the experiments.During a few of the earlier runs, dial mechanisms were used at all
four stations. The readings from the dials that were thereafter re-
placed by tapes were corrected by comparison with the correctedreadings from the other pair of dial trains, which was used throughout.
In addition to the fall of the holder during a run, it is also necessaryto know the absolute value of the initial or final height of the edge of
the crown above the water in the tank. The zero correction to beapplied to the tape readings for this purpose was found by running a
level line out from the edge of the crown and taking a reading on the
tape.
3. CONTROL AND MEASUREMENT OF TEMPERATURE
The temperature of the air in the holder was measured by four, or
later only three, resistance thermometers. Two of these were hungfrom the crown near the NW. side, about 8 and 18 feet down, respec-
tively; one was about halfway from the center to the SE. side, a fewfeet below the crown ; and one was a few feet below the crown at thecenter. This last thermometer became defective during the courseof the experiments and was not used during the later runs.
The first attempt to control the temperature was by means of some20 garden spray nozzles distributed under the crown so as to give afairly uniform shower; and when this proved unsatisfactory, thesprays were placed on top of the crown. Ultimately, the holder wasvirtually water jacketed by flooding it with water, pumped up fromthe tank and allowed to run down again over the crown and sides in
as uniform a film as possible. It was found that with a flow of 700 to
1,000 gallons per minute, the temperature of the water flowing overthe crown did not change more than 1 or 2 degrees F. from center to
edge, even in a strong wind.Uniformity of temperature was tested by means of a movable
thermocouple. After the resistance thermometers had come to
indicate uniformity within 0.5 degree, one junction of the couple washeld near one of the resistance thermometers while the other wasshifted about to a number of positions within the holder, and thedifference in temperature of the junctions was found from the observedE. M. F. This was first tried on a cool, rainy, windy night without theflood in operation, and it was repeated on a rather cool calm nightwith a small flood stream. The greatest difference observed wasabout 1 degree F.The experiments with the holder were made at night, most of them
between midnight and 4 a. m., a time when the temperature of theoutside air is usually falling slowly. If the temperature in the holdercan not be held perfectly constant during the whole of a run, it is
evidently desirable that it should fall rather than rise. For if the air
is saturated at the start, it tends to remain saturated as it cools, where-as if the temperature rises, there is some doubt on this point unlessthe rise is very slow.

100 Bureau of Standards Journal of Research [Vol. 7
In preparing for a run, the holder was filled by the booster, whilewater, about 5 degrees warmer than the water in the tank, was sprayedinto the intake. Thus the air entered the holder saturated (this wastested by a psychrometer) at a temperature somewhat above thatalready existing in the holder, and remained saturated as it cooleddown. To assist mixing by convection currents and to prevent theformation of fog, the internal sprays were usually turned on for a timeafter the holder was filled and before the run was started.
4. LEAKAGE TEST
Before starting to use the holder for experiments with air, it waspurged of gas and the inlet from the gas mains sealed. It was thenthoroughly cleaned and the water in the tank was renewed. It wasnext examined for leaks and those found were calked, after which it
was filled with air, sealed off, and left for five days, during which obser-vations of height, temperature, and barometric pressure were madefrom time to time, so that the amount of air in the holder could becomputed. This test showed that, to the degree of accuracy of theobservations, the holder was tight and that no leakage correction wouldbe needed, even in the longest runs made with it.
V. ORIFICE METER INSTALLATION
1. ORIFICES
The orifice plates were made of one-eight inch Monel metal, and theorifices were cylindrical holes with square, sharp corners at bothfaces of the plate. The edges were examined under the microscopeand in a few cases, where the upstream corner appeared not to bequite perfect, it was retouched with an oilstone or a dead smooth file
laid flat on the face of the plate.
Centering in the pipe was adjusted by measurement from the cylin-
drical outer edge of the plate to three flats, 120° apart on the upstreamorifice flange, where the distances from the axis of the pipe were known.The diameter of each orifice was measured in several azimuths by an
inside micrometer, the range of the separate values obtained beingof the order of ± 0.002 inch for the larger orifices and somewhat less
for the smaller ones. Values of the mean diameter d are shown in
column 2 of Table 1.
The mean of 11 measurements of the diameter of the pipe within6 inches upstream from the orifice plate was D = 23.311 inches, the
diameter on the downstream side being about 0.01 inch larger.
Values of the diameter ratio of the orifices, d/D = @, are shown in
column 3 of the table. For convenient reference, the orifice plates
were designated by the approximate values of the area ratio expressedin per cent, which are given in the first column. The values of /3
4
given in the last column were frequently needed during the analysis
of the experimental results.

Bean, BeneshABuckingham J
Experiments on Large Gas Meters
Table 1.
—
Dimensions of orifices
101
Area Diameter Diameterfl*
Area Diameter Diameter 0<ratio d ratio /3 ratio d ratio /3
Per cent 7ns. Per cent Ins.
5 5.213 0. 2236 0. 0025 50 16. 489 0. 7073 0. 2503
10 7.374 . 3163 .0100 55 17. 299 .7421 .3033
20 10. 429 .4474 .0401 60 18. 061 .7748 . 3603
30 12. 776 .5481 .0902 65 18. 800 .8065 .4230
35 13.798 .5919 .1227 70 19. 509 .8369 .490640 14. 748 .6327 . 1602 75 20. 187 .8660 .5624
45 15. 628 .6704 .2020 SO 20. 858 .8946 . 6404
2. PIPE
The straight run of smooth steel pipe ahead of the orifice, to thenearest fitting other than a simple flange joint, was 47 feet 2 inches;
and on the downstream side it was 25 feet 6 inches. The first 10 feet
on each side of the orifice consisted of two 5-foot lengths which hadbeen machined smooth inside, the joints being dowelled so that theylined up within one thirty-second inch. The whole pipe, out to thedistances mentioned above, was painted inside with graphite and oil
and rubbed down, which gave it a very smooth surface.
3. HONEYCOMBS
To eliminate whirl or large eddies in the stream approaching the
orifice, two honeycombs were mounted in the pipe. The first wasnear the entrance from the booster to the straight run of pipe, about45 feet from the orifice, and the second was set with its downstreamface 32 feet 2 inches or 16.5 D from the orifice.
The honeycombs were 12 inches long in the direction of flow andeach contained about 160 parallel passages or cells. They were built
up of alternate rings of flat and of doubly-corrugated, 30-gage gal-
vanized iron. The appearance of one of the honeycombs is shownin Figure 3, and those placed in the line ahead of the Venturi andThomas meters were of similar construction.
4. PRESSURE TAPS
The side holes drilled through the pipe for taking off the pressures
were one-eighth inch in diameter and were rounded off on the inside
of the pipe to a radius of one thirty-second inch. Nipples for rub-ber tubing were soldered over the holes on the outside and could bejoined by short rubber connectors to lengths of copper tubing, of
about %-inch bore, leading to the manometers.In all the observations for determining the discharge coefficients
of the orifices, the same pair of holes was used. They were, respec-tively, 12 inches upstream and 6 inches downstream from the face of
the nearer of the two flanges holding the orifice plate.
In the investigation of longitudinal distribution of pressure,measurements were made simultaneously at 46 holes, 14 upstreamand 32 downstream. The first 10 of the upstream holes were in aline along the top of the pipe. The eleventh, distant 2 inches fromthe plate, was offset 1 inch to one side; the twelfth, distant 1 inchfrom the plate, was similarly offset to the other side; and the thir-

102 Bureau of Standards Journal of Research [Vol. 7
teenth and fourteenth, also 1 inch from the plate, were at the ends ofa horizontal diameter. The first 3 of the downstream holes corre-
sponded in location to the last 3 of the upstream. The others wereon 3 parallel lines, on top and 2 inches on either side, and were soarranged that no 2 holes on the same line were less than 4 inchesapart. The longitudinal spacing of the holes used is shown in Tables2 to 11.
5. WATER MANOMETERS
All the pressures to be observed were low enough to be measuredon open-water manometers 36 inches high. The manometers weremade up in units of 4 each, the vertical glass tubes being 1 inch in
diameter but drawn down at the ends to facilitate making con-nections. The lower ends of the 4 tubes were connected throughcocks to a short header and thence to a common reservoir or tanknear the top of the tubes. This tank had a free-water surface 8inches in diameter and was provided with a 1-inch gage tube for
observing the level of the water in the tank. It had a tight cover,with a nipple which could either be left open to the atmosphere orconnected to one of the pressure taps. The upper ends of the man-ometer tubes could be connected to any desired pressure taps.
For the experiments on pressure distribution, 12 such units wereprovided. They were set up in line, as shown in Figure 2, and the48 cocks were connected by links to a long, horizontal bar, so thatthey could all be closed simultaneously by moving a single lever.
The water columns were thereby locked in position and the levels
could then be determined at leisure by means of the cathetometersprovided for making the readings. When the manometers werebeing used in this way, the separate tanks were connected to acommon header.
Thermometers hung near the manometers gave the temperaturesof the water columns with sufficient accuracy for making the smallreduction to standard temperature.
6. WET AND DRY BULB PSYCHROMETER
Two mercurial thermometers were inserted through a rubber stopperin a hole in the wall of the pipe, and a wick around one of them wasfed with water from outside, by a device which prevented any escapeof air. This consisted of a small electrically heated boiler followed bya condenser, from which the condensate was led to the wick througha small copper tube extending for some distance along the inside of
the pipe, so as to equalize the temperature. By adjusting the heatingcurrent, the water suppty could be made just sufficient to keep thewick properly moistened.
Similar psychrometers were used at the other points in the line
indicated in Figure 1.b'
VI. ROTARY DISPLACEMENT METER
The location of the rotary displacement meter is shown in Figures1 and 2. To give the temperature of the air entering it, a dry ther-
mometer was inserted a few feet ahead of the meter at the point £1 in
Figure 1. The pressure was measured by one of the manometersconnected to a tap some distance downstream from the orifice flanges,

BudmhTm'] Experiments on Large Gas Meters 103
the drop from this point to the rotary meter being negligible at thecomparatively low rates of flow to which this meter was limited.
The humidity of the air was determined by the psychrometer aheadof the orifice station.
VII. VENTURI METER
The Venturi tube used was the "Herschel standard Venturi tube"made by the Builders Iron Foundry. The holes into the piezometerrings were three-eighths inch in diameter and there were 12 at theentrance and 8 at the throat. The diameter at the entrance ring was24.86 inches, and the throat diameter was 11.992 inches.
Ahead of the Venturi, there was a 19-foot straight run of 24-inchpipe to the flange of the next elbow, and a honeycomb was set withits downstream face 15.5 feet, or about 7.7 D from the upstream flange
of the Venturi.At the downstream end of the Venturi, a short nipple and a reducer,
3 feet 8 inches long together, led to a 10-foot length of 20-inch pipeand so to the Thomas meter.The entrance and throat pressures were measured by a pair of the
water manometers already described.
VIII. AUXILIARY INSTRUMENTS AND OPERATIONS
1. REGULATION OF THE RATE OF FLOW
The steam pressure at the turbine which drove the booster was notconstant and the governor was rather sluggish; and since accuracy in
the experiments required that the rate of flow along the test line
should be constant during any one run, hand regulation was resorted
to. An inclined draft gauge was set up near the turbine and con-nected to two taps near the orifice flange. An attendant, watchingthis gauge and with his hand on a lever attached to the throttle valveof the turbine, kept the gauge reading and therefore the rate of flow
as constant as practicable during the course of any experiment.
2. BAROMETER
The barometer, of the Fortin type, was kept in a vault where thetemperature was nearly constant. Its internal corrections had beendetermined by comparison with the standard barometer of the U. S.
Weather Bureau Station in Chicago. Since the cistern of the barom-eter was 23 feet below the water level in the holder tank, a smallaltitude correction was applied in making computations that involvedthe absolute pressure in the holder.
The excess pressure inside the holder was read on a small, U-tube,water manometer at the center of the crown.
3. CLOCK
The time measurements needed in the experiments with the holderwere made by means of. a high-grade pendulum clock with sweepseconds hand, which ran within a few seconds a day and was amplyaccurate, in comparison with the unavoidable errors in other parts of
the work.

104 Bureau oj Standards Journal of Research [vci.7
4. PHOTOGRAPHIC RECORDING
Some of the more important readings were recorded photographi-cally by cameras fitted with electromagnetically controlled shutters sothat they could all be snapped at once by closing a single switch.By this means simultaneous pictures could be taken of the clock face,
the dials on the mechanisms for measuring the fall of the holder, andthe dials of the rotary displacement meter.
IX. VARIATION OF PRESSURE ALONG THE PIPE NEAR ANORIFICE
1. EXPERIMENTS
The experimental procedure in this part of the investigation wasvery simple. With an orifice plate in position and the manometersconnected to a series of taps along the pipe, the booster was startedand brought up to a constant speed, drawing air from outside andforcing it along the line through the orifice. After waiting till thewater columns had become as nearly steady as was to be expected,they were fixed by closing all the cocks simultaneously, and the read-ings were then made with the cathetometers. Zero readings weremade on the open gauge tubes on the common header, and the gaugepressure at each tap could then be found by subtraction.
Barometer readings were taken, to permit of reducing the results
to absolute pressures, if desired, and the temperature of the air in thepipe was also recorded. The water columns were all at nearly the
same temperature and since only comparative values of the pressureswere needed, reduction to standard temperature was superfluous.
At least two such sets of observations, or runs, at different rates of
flow, were made with each of the orifices listed in Table 1.
2. MODE OF REPRESENTING THE RESULTS
If the pressures, observed in the foregoing manner near an orifice
installed in a straight pipe, are plotted against distance from the
orifice, the resulting points lie along a curve of the familiar shape illus-
trated qualitatively in Figure 4, which also shows the notationadopted here for representing the results.
Starting with a tap several pipe diameters ahead of the orifice andgoing on to taps successively farther dowmstream, the static pressureobserved at the wall of the pipe at first decreases slowly, as it does in
steady flow along any straight pipe, but near the orifice the pressurebegins to rise as the stream piles up against the plate. This up-stream part of the curve is represented by ABC in figure 4.
At the rates of flow attained in these experiments, the preliminaryfall was inappreciable except for the largest orifices, and the curvewas sensibly a horizontal straight line for a considerable distanceahead of the point B where the obstruction offered by the orifice
plate began to make itself felt. Still farther upstream, the observa-tions at the first two taps, which were 56 and 44 inches from the
orifice, gave abnormally low values as is indicated by the dotted piece
of curve starting at A' in Figure 4. This was doubtless due to the
proximity of a flange joint a little over 3 inches ahead of the first tap.
There was probably a slight discontinuity in the line of the pipe

Bean, Benesh,!Buckingham J
Experiments on Large Gas Meters 105
wall here, for although the two sections of pipe had been machinedsmooth they were not perfectly round, and there was also a smallchange of mean diameter, the upstream section being about 0.04 inchlarger than the section next the orifice in which the tap holes werelocated.
On the downstream side of the orifice plate, after the sharp dropfrom C to D, the pressure falls to a minimum at E, rises to a maximumat F, and thereafter falls off slowly.
In order to compare the results obtained with sliij one orifice at
different rates of flow with one another or with observations on otherorifices, it is first necessary to reduce them ail to some common basis,
and this was done as follows
:
The most probable value of the pressure p2 at the downstreamminimum, E, was found graphically by plotting and drawing a
Figure 4.
—
Pressure distribution curve (qualitative)
smooth curve, which gave an estimate based on several neighboringpoints. This minimum pressure was then subtracted from thepressure observed at each of the downstream taps and the difference
was denoted by 52 , as illustrated in Figure 4.
For the upstream points, in the few instances in which there was a
recognizable minimum at B, the minimum pressure p x was foundgraphically, as for p2 ; but usually the readings were so uniform thatthis was unnecessary and p x was taken to be this uniform pressure.
The value of pi was then subtracted from each of the observed up-stream pressures and the difference denoted by 8 X .
When the values of 5 X and 82 had been found, they were expressedas percentages of the difference of pressure, pi—p2 = A, between the
upstream and downstream minima, and the various sets of observa-tions were thus made comparable.
3. TABLES OF RESULTS
The results of the observations, expressed in the manner just de-
scribed, are exhibited in Tables 2 to 11, which are all arranged in thesame way.

106 Bureau of Standards Journal of Research [Vol. 7
The first column gives the distance in inches from the nearer face
of the orifice plate to each of the taps at which the pressures weremeasured, starting with the tap farthest upstream. The decreasingnumbers in the first part of the column refer to the upstream taps,
and the increasing numbers in the second part to the downstreamtaps.
Each of the following columns, except the last, refers to a single
run and gives the values found for 100 8JA or 100 52/A, at the distances
from the orifice shown in the first column. At the head of each of
these columns certain data characteristic of the run are given, namely:(1) The differential pi—^^A in inches of water; (2) the differential,
expressed in per cent of the minimum upstream pressure, or 100
A/£>i = 100 x; and (3) the Reynolds number Rd defined in note B,divided by 100,000.The last column is a composite of the preceding columns for the
separate runs, obtained by taking 100 times the sum of all the 5's
for each tap and dividing it by the sum of the A ?
s. This amountsto the same thing as giving each run a weight proportional to its Aand taking the weighted mean. Apparent discrepancies between thelast column and the preceding ones are due to the fact that thecomputations were all carried out one place farther than is given,
and the mean was taken before dropping the last figures.
With the larger orifices, the capacity of the booster limited thedifferential obtainable to such low values that the accidental errors
of observation were large; and the results obtained with the orifices
of more than 60 per cent area ratio were too irregular to be of anyinterest except as a rough continuation of the observations on the
smaller orifices. They are therefore not reported here. After a fewof the early runs it was found that the cathetometers were in need of
adjustment, and the results of these early runs were discarded.
Table 2.
—
5 per cent orifice, fi= 0.224
Ain.H 20-=
100 x =2.33
.58
1.6
2.71
.68
1.7
15.48
3.74
4.2
18.06
4.44
4.4
31.747.40
5.8
Inches56 .
443628
-0.8-.7-.3
.0
-0.3.4
-.1-.1
-0.4.2.1.1
-0.3-.1.0.0
-0.2-.1.0.0
-0.3.1.0.0
2420
1612
.0
.0-.2-.2
-.1-.1.3.3
.1
.0
.0
.0
.0
.0
.0
.0
.0
.0
.0
.0
.0
.0
.0
.0
84
.2
.2-.2
2
.3
.3
.1
.1
.0
.3
.3
.0
.0
.0
.0
.1
.0
.0
.0
.1
.0
.1
.1
.1
2
1 .3.5.5.3.0
-.1.0
-.3-.1-.4
.4
.3
.2
.1
.0
.5
.4
.3
.2
.1
.5
.5
.4
.4
.3
.5
.4
.3
.3
.2
2
46
8
10 .0.0.0.0.0
-.4—
. 7
-.3-.1
. 1
.0
.0
.0
.0
.0
.1-.1-.1.0.0
.3
.2
.2
.2
.2
.1
.0
.0
.1
.1
1214
1618
A ins. H 2 = 2.33 2.71 15.48 18.06 31.74
100 x= .58 .68 3.74 4.44 7.4010-5/?,* = 1.6 1.7 4.2 4.4 5.8
Inches20 .0 i .0 .0 .1
22 .0 .1 .0 .0 .1
24 .0 .1 .0 .0 .1
26. .0 .0 -.1 -.2 .028 .0 .0 .1 .0 .0
30 .0 .0 .0 .0 .032 .0 .0 .0 .0 .034 .0 .0 .0 .0 .036 .0 .3 .3 .1 .240... .0 .4 .4 .3 .3
44 1.4 .6 1.0 .9 . 7
48 1.4 1.7 1.3 1.5 1.1
52 2.4 2.3 2.3 2.3 1.956. 3.4 2.9 3.1 3.0 2.664 4.1
4.9
4.8
5.8
4.3
5.4
4.4
5.1
4.0
5.17280 5.6 6.0 5.6 5.7 5.696 5.9 6.0 6.0 5.9 6.0112 5.9
5.96.06.0
6.06.1
6.06.1
6.16.2130
.1
.1
.0
.0
.0
.0
.0
.0
.81.32.1
2.84.2
6.16.1

Bean, Benesh,~\Buckingham J
Experiments on Large Gas Meters
Table 3.
—
10 per cent orifice, {3= 0.816
107
Ains.H2 = 3.85 4.48 18.70 19.03 32. 21|32. 31 Ains.H2 = 3.85 4.48 18.70 19.03 32.24 32. 31100 3?= .96 1.11 4.51 4.59 7.55 7.56 ICO T= .96 1.11 4.51 4.59 7.55 7.56
10-5 i?d= 3.0 3.2 6.6 6.6 8.6 8.6 10-s Rd= 3.0 3.2 6.8 6.6 8.6 8.6
Inches Inches56 -0.3 -0.1 -0.3 -0.4 -0.2 -0.3 -0.3 20 .8 .2 .1 .1 .0 .0 . 1
44 .0 -. 1 .0 -.3 .0 .0 .0 22.... 1.1 .4 .1 .1 .0 .0 .136 .0 .0 .0 .0 .0 .0 .0 24 .1 .4 .1 .1 .0 .0 .028 .0 .0 .0 .0 .0 .0 .0 26 -. 1 -.4 .0 .0 .0 .0 .0
28 . .0 .0 .0 .0 .0 .0 .024 .0 .0 .0 .1 .0 .0 .020 .1 .0 .0 .0 .0 .0 .0 30 .5 .1 .1 .0 .0 .0 .016 .1 .0 .0 .0 .0 .0 .0 32 .5 .4 .1 . 1 .0 .0 . 1
12 .3 .0 .0 .0 .0 .0 .0 34 .5 .8 .3 .1 .1 .0 .236 1.0 .4 .6 .4 .7 .3 . 5
8 .2 . 2 .0 .0 .0 .0 .0 40 1.6 1.6 1.3 1.1 1.2 1.0 1.24 .2 .3 .0 .1 .1 .0 . 1
2 .2 .1 .0 .1 .1 .0 .1 44 2.7 3.3 2.1 2.1 2.0 1.9 2.11 .2 .1 .0 .1 .1 .1 .1 48 3.6 4.4 3.0 2.9 2.9 3.1 3.1
52 5.8 5.8 4.2 3.9 4.1 4.4 4.31 1.6 1.0 .9 .9 .8 .6 .8 56 7.1 6.7 5.4 5.1 5.4 5.5 5.52 1.6 .9 .7 .8 .7 .4 .7 64 8.6 8.5 7.8 7.7 7.8 7.6 7.84 1.5 .9 .6 .7 .4 .3 .56.. 1.4 .8 .5 .6 .3 .3 .5 72 10.4 9.3 9.7 9.0 9.7 8.1 9.18 1.1 .5 .5 .5 .0 .2 .3 80 10.9 11.5 10.6 10.2 10.3 9.3 10.1
96 11.7 11.5 11.5 11.0 11.4 11.2 11.310 1.0 .4 .5 .4 .2 .0 .2 112 12.1 11.7 11.8 11.5 11.5 11.3 11. 512... .7 .1 .4 .3 .1 .2 .2 130 12.1 11.7 11.8 11.0 11.7 11.3 11.614 .5 .1 .3 .2 .1 .2 .216 .. .5
.6.1
.2.2.0
.2
.1
.1
.0.0.0
.1
.118
Table 4.
—
20 per cent orifice, (3= 0.447
Ains.H2 =100 x=
10-5^=
3.76.94
4.2
4.111.024.4
18.084.399.3
18.264.439.3
29.206.9211.8
29.446.9811.9
Ains.H 2 =100 x
=
10-5#i=
3.76.94
4.2
4.111.024.4
18. 08
4.399.3
18.26
4.439.3
29.206.9211.8
29.446.98
11.9
Inches56443628
-0.5-.2
.1
.0
.0-. 1
-.2-. 1
-. 1' .2
.2
.0
1.11.0.6.4
.0
.3-.3-.1.0.3
-0.2.0.0.0
.1
.0
.0
.1
.1
.3
.4
.4
.6
.6
.5
.7
.7
.6
.3
.3
.0
.0
-0.4.0.0.0
.0
.0
.0
.0
.2
.4
.5
.4
1.2.9.6.5.4
.5
.3
.3
.2
.1
-0.2.0
.0
.0
.0
.0
.0
.0
.0
.1
.3
.4
.7
.7
.6
.5
.5
.4
.4
.4
.2
.0
-0.3.0.0.0
.0
.0
.0
.0
.1
.3
.4
.5
.9
.8
.6
.4
.3
.2
.1
.1
.1
.0
-0.2.0.0.0
.0
.0
.0
.0
.1
.4
'a
1.1
.9
.8
.7
.5
.4
.3
.3
.2
.1
-0.3.0.0.0
.0
.0
.0
.0
.1
.3
.4
.4
1.0.8.6.5.4
.4
.3
.2
.2
.1
Inches20222426
-0.1.1
.2
.7
.7
.82.42.83.86.3
9.211.313.216.417.5
20.621.322.022.121.9
0.0.0.0.6
1.0
1.5
2.33.44.36.1
8.510.212.115.217.9
19.821.021.521.621.6
-0.2-.2.0.1
.3
.61.22.22.84.9
7.08.911.012.916.3
18.520.421.421.821.7
0.1.0
.0
.0
.3
.91.3
2.13.44.7
6.79.010.913.016.5
18.920.121.822.222.3
0.0.0.0.0.3
.71.1
1.94.04.4
6.38.310.412.415.6
18.519.721.421.721.9
0.0.0
.0
.0
.3
.91.1
1.82.94.4
6.48.310.012.215.6
18.419.821.522.022.0
0.0.0.0. 1
28 . 324
30323436
201612
.81.22.13.4
84
40
44
485256
4.7
2
1
6.78.710.612.8
2 64 16.04
6 72 18.78
10
1214
1618
80 „__96112130
20.021.521.922.0

108 Bureau of Standards Journal of Research
Table 5.
—
30 per cent orifice, (3= 0.548
[Vol. 7
A ins. H2 = 3.63 15.36 15.58 19.19 19.91 A ins. H 2 = 3.63 15.36 15.58 19.19 19.91100 x= 9.1 3.65 3.78 4.63 4.83 100 z= .91 3.65 3.78 4.63 41.83
10-«i?d= 5.2 10.8 10.9 12.1 12.3 10-5i?d = 5.2 10.8 10.9 12.1 12.3
Inches Inches
56 -0.7 -0.3 -0.4 -0.3 -0.3 -0.3 20 1.0 .3 .0 .1 .1 . ^
44 -.2.0
.0
.0
-.1.0
.0
.1
-.1.0
-.1.0
22 1.02.6
.3
.8
.2
.7
.3
.8
4'.9
.3
36 2* .9
28 .0
.1-.1
.0
.0
.0
.0
.0
.0
.0
.0
.0
.0
.0
.0
.0
.0
.0
26 4.15.4
6.5
1.52.7
4.0
1.92.6
4.0
1.42.6
4.0
1.7
2.7
4.1
1.728 2.3
243020 4.2
16 -.1 .0 .0 .0 .0 .0 32 7.5 5.6 5.5 5.1 5.3 5.512 -.3 .1 .1 .0 .1 .0 34 ~ 10. 5 7.3 7.1 6.6 6.8 7.1
.0 .4 .2 .3 .4 .3
36 11.513.3
9.011.4
8.711.2
8.211.5
8.711.3
8.88 40 11.44 .0
.0
.0
.81.1
1.2
.71.01.0
.81.01.0
.91.01.1
.8
.9
1.044 18.0
19.921.2
14.216.719.1
13.816.819.4
13.816.619.1
13.816.819.4
2 14 1
1 48 16.95/ 19.3
1 .9.0
1.4.9
1.2.7
1.31.1
1.2.9
1.2.9
56 23.125.5
21.625.1
21.525.3
21.1*4.6
21.325.4
21.42 64 25.14 1.0
.7
.7
.5.7.6
.9
.61.0.7
.8
.6 72 *7.7 28.3 27.9 28.0 27.96 28.08 .2 .4 .5 .4 .6 .5 80 28.6 29.5 29.4 29.4 29.7 29.4
96 29.4 31.2 31.2 31.1 31.2 31.110 .1 .3 .3 .3 .4 .3 112 29.6 31.8 31.6 31.6 31.7 31.512 .0 _ 2 .3 .1 .3 .2 130 29.6 31.8 31.6 31.6 31.8 31.614 -.1 .0 .2 .1 .1 .1
16 .1 .0 .2 .0 .1 .1
18 .0 -.2 .0 .0 -.1 -.1
Table 6.—35 per cent orifice, 13^0.592
A ins. H2 =100 x=
3.340.845.6
3.350.845.6
12.353.03
10.7
15.413.7411.9
A ns. H 2 =1001=
10-5i?d=
3.340.845.6
3.350.845.6
12. 353.0310.7
15.413.7411.9
Inches
56 -0.4.0.0.0
.0
.0
.2
.2
.5
.6
.61.3
2.31.71.71.2
.9
.4
.2
.1
.1
.2
-0.6-.6.0.0
-.2.0.0.0
.01.11.61.3
1.71.71.01.0.2
.2
.0
.0
.0
.2
-0.4.0.0.1
.0
.0
.0
.0
.41.21.51.5
1.4.9.7.4
.3
.4
.2-.1.2.1
-0.3-.1.1.1
.0
.0
.0
.0
.41.21.3
1.4
1.41.1
.8
.7
.5
.2
.3
.2
.1
.0
-0.3-.1.0.1
.0
.0
.0
.0
.41.1
1.31.4
1.51.1
.8
.6
.4
.3
m 2'.0
.1
. 1
20..
22..
24..
26..
28..
Inches
2.13.24.76.38.1
9.711.213.415.018.9
22.424.426.227.931.0
33.734.835.335.635.5
1.73.54.56.58.1
9.511.513.816.718.7
22.024.226.928.630.6
33.035.035.735.936.1
.41.12.1
3.85.7
7.58.710.913.016.4
19.922.925.427.931.4
34.736.638.239.039.0
.91.32.74.05.6
7.59.011.312.915.8
18.820.224.626.330.3
32.933.736.030.436.4
.9
44. 1.636 2.728 4.3
5.924
30..
32..
34..
36—
20.. 7.7
16 9.112 11.3
13.1S 40.. 16.24
442 19.31 48 - 22.3
52 24.61 56... 26.52 ..- 64. 30.04
726 32.78 80 34.4
96 35.710 - 112.
130.
36.212 36.21416.-.18

Bean, Benesh,!Buckingham J Experiments on Large Gas Meters
Table 7.
—
40 per cent orifice, = 0.633
109
A ins. H20=1001=
2.89.73
5.7
3.95.99
6.6
9.742.4210.4
10.642.61
10.9
A ins. H 2 =1001=
10-5i?d=
2.89.735.7
3.95.99
6.6
9.742.4210.4
10.642.6110.9
Inches56 -1.2
-.5.0.0
.0-.1-.1-.1
.11.41.41.9
2.72.41.61.2.8
.5
.3
.1
.0
.3
-0.2-.1.0.0
.0
.1
.1
.1
.31.21.31.6
1.81.2.8.7.1
.1
.1
.1
.3. .8
-0.2-.1.1.1
.0
.0
.0
.0
.3
1.51.71.9
1.61.2.6.5.5
.3
.2
.0-.1.0
-0.2-.1.0.0
.0
.0
.0
.0
.41.62.02.1
1.41.0.6.4.3
.2
.1
.1
.0
.2
-0.3-.1.0.0
.0
.0
.0
.0
.31.51.71.9
1.71.2.7.6.4
.3
.2
.1
.0
.2
2022242628
3032343640
4448525664
728096112130
Inches1.83.75.07.19.7
11.312.114.817.618.5
25.027.129.131.834.0
36.338.
1
39.239.939.9
1.94.26.07. 7
9.5
11.914.016.517.522.5
25.427.630.432.635.8
38.039.240.641.141.0
1.22.84.76.68.5
11.013.115.116.820.5
23.626.829.632.035.0
37.339.140.641.041.0
1.3
2.84.56.48.5
10.512.814.616.820.4
23.927.029.531.234.5
37.538.940.240.840.8
1 444 3 1
3628
4.86 78 8
2420 10.916 13.012 15.1
17.08 20.54
2 24.11 27.0
29.61 31.82 34.84
6 37.48 38.9
1040.340.8
12 40.814 ,
1618
Table 8.
—
1+5 per cent orifice, 0=0.670
A ins. H2 =100 x=
10-sRd=
2.81.72
5.9
2.99.76
6.3
6.851.699.5
8.042.0010.2
A ins. H2 =100 x=
\QriRd=
2.81.72
5.9
2.99.76
6.3
6.851.699.5
8.042.00
10.2
Inches56 -0.4
.0
.0-.1
.0
.0
.3
.1
.1
2.11.82.5
1.71.41.41.0.0
.0
.0
.32.1
3.5
-0.7.0
-.1.0
.0
.0-.1.0
.1
1.72.12.2
1.7.9.7.4.1
.0
.0
.31.63.8
-0.5-.3.0.0
.0
.0-.1-.1
.31.42.32.5
1.6.5.3.2.1
.0
.0
.01.01.9
-0.5-.4.0.0
.0-.1.0.0
.42.02.62.6
1.4.9.5.0.0
.0
.1
.0
.41.6
-0.5-.2.0.0
.0
.0
.0
.0
.3
1.82.32.5
1.5.8.6.3.0
.0
.0
.11.02.2
Inches20 5.3
8.310.813.015.9
18.519.023.124.327.3
31.736.538.538.941.8
44.145.546.046.046.0
5.98.210.311.616.1
17.920.422.624.327.4
30.833.435.337.141.4
42.543.944.645.645.4
3.96.08.310.913.5
15.318.220.922.926.4
29.232.234.637.340.2
42.944.645.445.845.7
3.86.08.710.613.5
16.118.320.022.426.2
29.632.635.337.740.3
42.944.746.146.646.4
4.344 22 6.536 24 9.028 26 11.1
28 14.124
3020 16.316
123234
18.520.9
36 22.98 40 26.34
442 29.71 48 32.8
52 34.91 56
6437.3
2 40.34
726 . 42.68 80 44.2
96 45.210 112 45.712 130 45.514
16
18

110 Bureau of Standards Journal oj Research
Table 9.
—
50 per cent orifice, (3= 0.707
[Vol. 7
A ins. H2 = 2.21 2.33 5.56 5.94 5.99 A ins. H 2 = 2.21 2.33 5.56 5.94 5.991001= .56 .59 1.39 1.48 1.48 100 x= .56 .59 1.39 1.4S 1.48
10-5 Ed= 5.8 6.0 9.2 9.6 9.6 10-s Rd= 5.8 6.0 9.2 9.6 9.6
Inches Inches56 -0.4 0.3 -0.6 -0.3 -0.3 -0.3 20 7.1 6.6 6.9 7.1 6.8 6.744 .0 .2 -.4 -.1 -.1 -.1 22 9.4 9.0 9.6 9.2 8.9 9.236-.. -- .0 .5 . 1 -.1 -.2 .0 24 12.1 11.8 12.5 12.0 12.1 12.128 .2 .2 -.1 .0 .1 .1 26 15.3 14.5 15.7 15.1 15.0 15. 1
28 18.4 18.8 18.7 18.2 17.9 18.524 .0
.0.2.0
.1-.1
.0-.1
.0
.1.0.0 30 20.7 20.6 21.1 20.7 20.320 20.6
16 .0 .0 -.1 -.1 .1 .0 32 23.5 24.2 23.4 23.1 23.0 23.312 .0 -.2 .1 -.1 .9 .2 34
3627.328.7
26.728.1
25.627.9
26.227.9
25.527.8
26.027.9
8 .0 -.2 .S .3 .9 .5 40 .. 32.4 32.5 31.7 31.5 30.9 31.54 2.1
2.7.5
2.72.53.0
2.62.9
2.73.4
2.43.0 44.. 35.1 35.4 35.1 34.7 35.02 34.9
1_. 2.7 2.4 3.6 3.4 3.8 3.4 48. 36.1 37.5 38.2 37.9 37.8 37.752. 39.9 39.4 40.4 40.0 40.2 40.0
1 1.2 1.5 2.1 1.6 1.4 1.7 56 43.7 41.1 42.1 41.3 42.5 42.02 1.4 1.2 1.2 .8 1.1 1.1 64 43.8 44.0 44.6 44.4 45.0 44.54. 1.2 .3 .4 .4 .1 .5
6 .4 .0 .0 -.1 .1 .1 72.. 45.4 46.5 46.3 46.5 45.9 46.48 .4 .2 .1 .0 .0 .2 80.._ 46.7 48.1 47.9 48.0 48.2 47.9
96 47.6 48.2 49.2 49.3 49.7 49.110 .2 .2 .4 .0 .0 .2 112- 48.3 48.2 50.1 49.4 50.1 49.412 .2 .0 .2 .0 .0 .1 130 47.8 48.4 49.3 49.4 50.1 49.214 -.2 .0 .0 .0 .2 .016 .5 1.5 1.4 1.6 1.8 1.5
18 3.7 2.0 3.5 3.4 3.4 3.3
Table 10.
—
55 per cent orifice, p= 0.742
A ins. 1120 =100 x=
3.22.81
7.6
3.31.84
7.7
5.261.329.7
5.841.45
10.2
A ins. H 2 =100 x=
10-si?d=
3.22.81
7.6
3.31.84
7.7
5.261.329.7
5.841.45
10.2
Inches56 -0.7
-.4.0.0
.0
.0-.2.0
1.02.84.04.8
2.11.0.5.0.0
.2
.41.1
4.87.1
-0.8-.2.2.2
.2
.1
.0
.0
.62.24.15.1
2.41.0.4.4.2
-.1.1.8
4.57.3
-0.5.0.3.3
.2
.0
.0
.2
.63.04.04.7
1.6.8.0
-.1.1
.1
.41.74.97.6
-0.3-.3-.1.0
.0
.0
.1-.1
.52.93.94.6
2.1.5.5.3.1
-.5.51.3
4.46.5
-0.7-.2.1
.1
.1
.0
.0
.0
.62.84.04.8
2.0.8.3.1
.1
-.1.4
1.34.67.1
Inches20 11.5
14.518.322.525.9
27.830.232.435.238.3
41.644.046.047.549.3
50.952.153.254.052.9
12.114.918.821.924.3
27.631.032.434.738.6
41.143.845.447.449.7
51.452.653.354.153.3
12.215.118.721.824.9
28.130.632.434.838.0
41.343.845. 6
47.249.7
51.852.754.054.553.8
10.814.818.622.425.0
29.530.532.734.938.3
41.543.945.547.749.7
51.452.453.454.353.7
11.644 22.-. 14.836-.. 24 18.628 26 22.1
28 25.024
3032
20 28.016 . 30.612 34 32.5
36 34.98 40 38.34
442 41.41 48. 43.9
52 45.61 56 47.52 64 49.74
726 51.48 80 52.5
96.- 53.510 112... 54. 3
12 130. . 53.514
16
18..

Bean, BeneshJBuckingham J
Experiments on Large Gas Meters
Table 11.
—
60 per cent orifice, fi=0.775
111
A ins. H 2 =1001=
10-5i?d=
1.250.315.1
1.640.415.9
4.241.049.4
4.461.109.7
A ins. H2 =1002;=
10-'i?d=
1.250.315.1
1.640.415.9
4.241.049.4
4.461.109.7
Inches56 -0.6
.3
.6
.0
.0
.0-.3.3
.63.85.76.9
2.81.9.9
.6
.0
.0
.93.57.212.0
-1.4-.5
.0
.0
.0
.0
.2
.0
.23.84.86.5
1.71.0.0.0.2
.52.25.5
10.114.6
-0.7.1
.2
.2
.1
.0
.1
.1
.1
3.65.76.1
3.0.4.0.1
.2
.41.63.69.613.2
-1.0.0.6.4
.4
.0
.0
.0
.83.56.06.4
2.61.2.0.0.0
.0
.93.38.711.1
-0.9.0. 4
.2
.2
.0
.0
.1
, 43! 6
5.76.4
2.5.9.0.0.0
.11.23.69.012.4
Inches20 18.6
22.024.229.931.8
34.337.739.941.543.7
47.849.450.050.952.2
52.258.256.958.258.2
20.124.228.131.934.8
37.239.141.242.945.8
48.950.651.153.554.4
55.656.655.856.856.6
18.321.525.929.132.8
36.037.140.041.944.6
47.549.151.352.854.1
55.956.758.258.457.5
16.620.323.626.929.6
33.735.638.039.842.4
45.246.349.050.352.3
53.654.855.556.155.1
17.8
44 22 21.4
36 24 25.028 26 28.7
28 31.624
3020 34.916 32 36.712 34 39.3
36 41.18 40 43.74
442 . 46.71. 48 48.6
52 50.1
1 5664
7280
51.62 52.1
4
6. 54.58 .. 56.0
96 56.710 112 57.212 130 56.414
16
18
4. VARIATION OF PRESSURE DISTRIBUTION WITH SPEED OF FLOW
If the data obtained in the different runs with any one orifice are
plotted in the form
where 1 = distance from the orifice plate, it is found that the upstreamparts of the resulting curves do not show any certain variation withA. If there is any systematic variation within the range of differ-
entials and speeds covered in these experiments, it is masked by theaccidental errors of measurement which are evident in the irregulari-
ties of each series of points.
On the downstream side, however, the systematic change of thecurve with increasing A is quite clear. It is illustrated by the twocurves of Figure 5, each of which represents the mean of two runs at
nearly the same A, with the 45 per cent orifice.
As the differential and the speed through the orifice are increased,the minimum corresponding to the point E of Figure 4 is blownfarther downstream and the subsequent rapid rise occurs a little later.
At points between the orifice plate and the downstream minimum,increasing A lowers the value of 10052/A, although the change is notgreat within the range of these experiments.Both these effects are more pronounced for large than for small
diameter ratios, and a given change of A has more effect when A is
still small than when it is larger. One gets the impression that as
A increases, the curves for any one orifice tend to approach a final
form asymptotically.
60869—31 8

112 Bureau of Standards Journal of Research [Vol. 7
With a given gas flowing through any one orifice, the curve of pres-sure distribution along the wall of the pipe is fixed by the values of
the Reynolds number and the fractional differential, A/pi=x. In thepresent experiments, the Reynolds number was always so high as to
oo
v/^ ooi
make the effects of viscosity insignificant; and the change of the down-stream part of the curve with A—or with x, since p l was nearly con-stant—is probably to be attributed to the same cause as the simul-
taneous change of the adiabatic discharge coefficient, namely, the
lateral expansion of the gas in the jet after passing the orifice, due to
the excess of static pressure at the axis of the jet over that at the

BuMngham'] Experiments on Large Gas Meters 113
boundary. 2 This view of the matter is consistent with the fact thatthe upstream part of the pressure curve is much less affected by changesin A than the downstream part.
5. VARIATION WITH DIAMETER RATIO
If points are plotted from the composite data in the final columnsof Tables 2 to 11, smooth mean cuves drawn through the points areof the same general shape as found by other observers. Sampleplots are given in Figure 6 for the 20 and 40 per cent orifices (/3 = 0.447and 0.633) from Zi = 20 inches to Z2 = 28 or 52 inches. Since 8 X is
measured from the upstream and 52 from the downstream minimum,and since the difference between these minimum pressures is A = 100on the given scale, a consistent picture of the distribution of pressureover the whole length of the figure would require that the ordinatesof the upstream points be increased by 100.
As the diameter ratio, /3, is increased, the downstream minimumbecomes more pronounced and moves up toward the orifice, in thewell-known manner; and the following maximum moves in the samedirection, though it is so flat as to be difficult to locate at all closely.
For area ratios up to /?2 = 0.6, the rise of pressure from the down-
stream minimum to the maximum, expressed as a fraction of the dropfrom the upstream to the downstream minimum (p r/A in fig. 4), is
roughly equal to 2 or "the restoration of pressure is equal to the arearatio," a convenient practical rule which we have not seen stated in
just this form.
X. EXPERIMENTS WITH THE HOLDER1. PROCEDURE
After the holder had been filled with air, in preparation for a run,and the connections of the booster rearranged, the resistance ther-
mometers were read continuously, in rotation, until they showed thatthe temperature had become nearly uniform and constant. Thebooster was then started and brought up to the speed necessary to
give the desired rate of flow along the line, and the attendant at theturbine throttle kept this rate as nearly constant as practicablethroughout the ensuing run.
Since the mean rate of outflow of air was to be computed from theinitial and final states of the holder, no intermediate observationson the holder were needed if all went well. But to avoid having to
waste a whole run of which only a part was for any reason unsatis-
factory, each run was divided into five periods with records of theheight taken at six known instants, so that those periods for which theobservations on the holder and on the meters under test were satis-
factory could be utilized and the others discarded.
The resistance thermometers w»ere read at about the times whenthe height was measured. The readings of each thermometer wereplotted against the times when they were made, a mean curve wasdrawn, and the mean temperature in the holder at the instant of takingeach height record was found from this curve.
1 E. Buckingham, Note on Contraction Coefficients of Jets of Gas, B. S. Jour. Research, 6; May, 1931
;
or Techn. Mech. u. Thermodyn., May, 1931.

114 Bureau of Standards Journal of Research [Vol. 7
Barometer readings were made occasionally, and if they changed
enough during the run to make it worth while, the corrected values of
the pressure were plotted against the times, and the pressures at the
times of taking the height records were found graphically. The excess
!
s>"*3
^«ge5°
oo
83o
s 13
*> 13
e
gc
1 ^<9 J-
^1,
.%
a
O*&
^
pressure inside the holder, shown by the gauge on the crown, was
sensibly constant throughout the experiments.
When an orifice or the Venturi was under test, it was desirable to
have as many readings as possible of the differential, so as to average

Budcinghae
mh'] Experiments on Large Gas Meters 115
out the accidental fluctuations due to the unavoidable slight unsteadi-
ness of the rate of flow. Measurements were therefore made continu-ously, as often as an observer, or sometimes two observers, could sight
and read the cathetometers. The temperatures of the wet and drybulb thermometers changed slowly and regularly and did not need to
be read so often—the average interval between readings was about 11
minutes. The computations relating to the Venturi and the orifices
were based on the averages of the observed values of the differential,
the static pressure, and the wet and dry bulb temperatures.
Since the rotary displacement meter registers the total volumepassed and not the instantaneous rate, all that was needed for com-parison with the observations on the holder was the mean density of
the air entering the meter and the photographs of its dials, taken simul-
taneously with the measurements of the height of the holder. Themean density was computed from the average values of the static
pressure and the wet and dry bulb temperatures.
2. SATURATION IN THE HOLDER
In computing the mass of air in the holder, it has to be assumed thatthe air is saturated with water vapor, and it is important that the
assumption be as nearly true as possible. Initial saturation wasensured by spraying warm water into the intake of the booster whilelilling the holder, but if the temperature of the air had risen muchduring a run, the evaporation from the tank might not have been rapidenough to maintain saturation. In most of the runs to be reportedon, the mean temperature in the holder either fell or remained con-stant, and in the remainder, the most rapid rate of rise was 1.0 degreeper hour.
In the first reduction of the observations, immediately after theexperiments, the values found for the discharge coefficient of the Ven-turi varied irregularly by much more than could possibly be attributed
to the accidental errors of observation at the Venturi, and the indica-
tions seemed to be that there must have been errors of 5 degrees or
more in the measurements of the mean temperature of the holder.
After the care that had been taken, such errors seemed not merelyvery disappointing, but quite incredible, and an indirect check on theholder temperatures was therefore carried out.
In passing through the booster, the air from the holder was heatedmuch more than enough to offset the simultaneous compression, andwhen it entered the line it was considerably less than saturated. Atthe beginning of a run, the inside of the booster was still wet fromthe water sprayed in while filling the holder, but it dried off as therun proceeded, and the pyschrometers along the line showed that thevapor content of the air, after first decreasing, reached a constantvalue, indicating that the drying was complete.
It seemed safe to assume that when this steady state of partial
saturation had been attained, the air was neither depositing nortaking up any appreciable amount of water since leaving the holder,and that the percentage composition of the air-vapor mixture wasthe same in the line as it had been in the holder. On this assumption,it was very easy to calculate from the wet and dry bulb tempera-tures and the pressure at any point in the line, together with theknown pressure in the holder, what the vapor pressure in the holder

116 Bureau of Standards Journal of Research [Vol.?
must have been, and thence, by means of the vapor pressure curve,to find what the temperature must have been if the air was satu-rated. This could then be compared with the temperature indicatedby the resistance thermometers, and the agreement was found to bequite as good as could be expected.
In a few cases, the wet bulb readings were very irregular and in-
dicated that the water supply to the wick had been deficient; butomitting these exceptional cases, the remaining 29 computationsgave a maximum difference of 2.3 degrees between observed andcalculated holder temperatures, and an average difference of only0.63 degree.
The success of this check restored our confidence in the measure-ments of the temperature in the holder, and it was soon thereafter
discovered that the discrepancies that had led to the check werespurious and due to a systematic mistake in one part of the compu-tations.
3. COMPUTATION OF THE RATE OF FLOW OF DRY AIR ALONG THELINE
In general, the mass of moist air that leaves the holder during anyinterval of time is not equal to the decrease of the mass containedin the holder. For if the temperature falls, vapor is precipitatedand vanishes into the tank without having gone out through thebooster; and if the temperature rises, vapor which did not exist at
the start appears, from nowhere, as it were, by evaporation from thewater in the tank. Furthermore, some vapor is added after the air
leaves the holder by the drying out of the booster during the initial
stages of a run, as mentioned above. But the mass of dry air thatleaves the holder is equal to the difference of the masses present at
the beginning and end of the run, and this same mass is dischargedthrough each of the meters installed in series in the line. It is there-
fore most convenient to base all the computations on masses of dryair, and we have first to find the mass of dry air contained in the
holder at any instant for which the temperature, pressure, andvolume are known from observation.
Lett (°F.) = the temperature of the air in the holder;
p (inch Hg, 32°)= its absolute pressure;
e s (inch Hg, 32°) — the saturation pressure of water vapor at /°;
p a (lbs. /ft.3) =the density of dry air at p, t;
V (ft.3) = the volume of the holder at the observed height; and
Wa (lbs.) = the mass of dry air contained in it.
On the assumption that the air is saturated, the partial pressure of
the dry air is (p~e s ), and if the vapor were all removed by absorption,
without changing the temperature or the volume, the pressure of the
remaining dry air would be (p-e s ). If the volume were then reduced,isothermally, in the ratio (p-e s)/p, the pressure would increase to pand the resulting density would be p a . Hence the mass of dry air
(which has not been changed by these operations) is
w.,J&*yP. (i)

B'SingZfn'] Experiments on Large Gas Meters 117
Now let subscripts 1 and 2 refer to conditions at the beginning andend of a run.
Letz (minutes) = the duration of the run; andMa (lbs. /sec.) — the mean rate of outflow of dry air.
Then evidently
M JWa\-{Wa ) 2
or by (1)
where
M.mmm (3)
X~ Wp ^Values of Zmay be tabulated in terms of p and t as arguments and,
after the table has been constructed, the values of Xx and X2 may befound by interpolation.
The required values of es were taken from the Warmetabellen issuedby the Reichsanstalt in 1919, and the values of pa were found as fol-
lows. The density of dry air containing the normal amount of C02 ,
at 32° F. and under a pressure of 29.921 inches of mercury, at 32°
and with gr = 32.161 ft./sec.2
, as at Chicago, was taken to be 0.08070lb. /ft.
3 This value was deduced from the results of Ph. A. Guye'sdiscussion of the best available data, as summarized in Landolt andBornstein's Tables, 5th ed., 1923, vol. 1, p. 43. The mean coefficient
of expansion of dry air at atmospheric pressure between 32° and122° F., in terms of the volume at 32° is very close to 1/490 (not 1/492).Hence we have, for the density of dry air at t° F. and an absolutepressure of p inches of mercury at 32°, at Chicago,
_ 0.08070X490ff =r 1.3216ffpa
29.921 (458 + 458 + *(5)
And upon combining this with (4) we have the equation
..
X= 0.022026|^ (6)
y means of which the table to be used with equation (3) was com-puted.
4. COMPUTATION OF THE DENSITY AND RATE OF FLOW OF MOISTAIR AT ANY SECTION OF THE LINE
Lett (°F.) =the temperature of the air at the given section;
p (inch Hg) = the static pressure there
;
e (inch Hg) =the partial pressure of the water vapor;
p (lbs. /ft.3) =the density of the moist air; and
M (lbs./sec.) = the rate of flow of moist air past the section.
The value of / is given by the dry bulb thermometer, and e is foundfrom p, t, and the wet bulb depression, by means of Table 75 in Smith-sonian Meteorological Tables (4th ed.), 1918.

118 Bureau of Standards Journal of Research [Vol. 7
Taking the ratio of the molecular weights of water vapor and air
to be 18.02/28.95 = 0.622, and using the same fundamental data as
for equation (5), we have
1.3216 (p-0.S78e) ,_p~
458+7 (7)
The rate of mass flow of the mixture of dry air and vapor is greaterthan that of the dry air alone by the amount of vapor carried alongwith the air. The pressure of the mixture being p, the partial pressureof the dry air in it is (p — e) and the ratio of the mass of vapor to themass of air in any quantity of the mixture is 0.622e/(p — e). Hencethe mass of the mixture is greater than the mass of the dry air con-tained in it, in the ratio
p-e-\-0.622e ^p-0.S78ep — e p— e
and the rate of mass flow of the mixture past the point in question is
M £^0378*p — e
v J
where Ma is the mass flow of dry air computed from the observationson the holder by means of equations (3) and (6).
In addition to the rate of flow in pounds per second, it is convenientto have the rate also expressed in the more roundabout, but morefamiliar way as cubic feet per hour under standard conditions, andthis may be accomplished as follows.
Let Q (ft.3/hour) be the volume rate of flow past a section of the
line where the temperature is t, the static pressure p, and the vaporpressure e, measured at the density p corresponding to these conditions.
Then evidently
Q=M00M(9)
r
and upon substitution of the values of Mfrom (8) and p from (7) this
takes the form
3,600(458 +H 1.3216 (p-«) a UU;
Now let the standard conditions be tf = 60 (°F.), £> = 30 (inches Hg),and e = 0.26 (inches Hg), which corresponds to 50 per cent relative
humidity at 60°. Then if Qs is the value Q would have if standardconditions prevailed at the section in question, and if we substitute
the standard values in equation (10), the result is
&(ft3/hour) =47,450Ma (lbs./sec.) (11)
and Qs is the volume flow of moist air under the standard conditions
that would carry the actual mass flow of dry air computed from the
observations on the holder.

Buckingham'] Experiments on Large Gas Meters 119
In the gas industry, " standard conditions" are usually understoodto be 30 inches, 60°, and complete saturation. For these conditions,
the figure 47,450 should be increased by about 0.9 per cent.
5. REDUCTION OF THE OBSERVATIONS ON THE ORIFICES
The results of the tests of the orifices will be given as values of
"the hydraulic discharge coefficient, based on the upstream densityand with the approach factor included. " This coefficient, which wasdenoted by C'linB. S. Research Paper No. 49 3
, will be denoted hereby C. It may be defined, in terms of British absolute units, by theequation
M=C~d2^2p^ (12)
in which, M=the rate of flow, in lbs./sec; d= the diameter of theorifice, in feet; pi = the density of the moist air, in lbs. /ft.
3 at theupstream pressure, temperature, and humidity; and A = the differential
in poundals per square foot.
In practice, the diameter d was measured in inches, and the cathetom-eter scales were graduated in centimeters, so that the differential
was read in centimeters of water at the prevailing temperature.Upon introducing these units and supposing the differential to havebeen reduced to cm. of water at 32° F., equation (12) may be put into
the form
And after introducing the values of M from equation (8), and of pi
from equation (7), we have
in which:
r_ 13.896ilfg /(p- 0.378c) (458 + Hasd2 (p-e)V A U4J
Ma (lbs./sec.) = the mass flow of dry air computed from theobservations on the holder, as described above under 3
;
d (inches) = the diameter of the orifice;
t (° F.) = the temperature shown by the dry bulb thermometerahead of the orifice;
p (inches Hg, 32°) = the absolute pressure at the upstream tap;
e (inches Hg, 32°) = the partial pressure of the water vapor as
found from p, t, and the wet bulb depression; andA (cm H20, 32°) = the observed differential, after reduction to
32° F.
6. REDUCTION OF THE OBSERVATIONS ON THE VENTURI
The observations on the Venturi may be reduced in the same wayas those on the orifices, and the results will first be given as values of
C computed by means of equation (14), with d representing thediameter of the Venturi throat.
They will also be given as values of the "adiabatic" dischargecoefficient because this permits of more direct comparison with
> B. S. Jour. Research, 2, p. 561; March, 1929.

a
120 Bureau of Standards Journal of Research [Voi.7
values for water; and since the adiabatic coefficient is usually under-stood not to include the factor which allows for the speed of approach,it will be given in that form. It is then to be computed from thevalues of C already found from equation (14) by means of the equa-tion (see note A)
in which r= fylpi and P = d/D, D being the diameter of the Venturiat the entrance section, where the upstream pressure p x is observed.
7. REDUCTION OF THE OBSERVATIONS ON THE ROTARY DISPLACE-MENT METER
The results of the tests of the rotary displacement meter may bestated most conveniently by giving the values found for the quantity
oUg (16)
in which M is the mean rate of mass flow through the meter, com-puted from the observations on the holder, and Md is the mean rate
indicated by the displacement meter. It may be called the coef-
ficient of the meter, and it is evidently the factor by which the rate
shown by the meter must be multiplied to make it agree with therate computed from the observations on the holder, which is treatedas the absolute standard.The "dial factor" of the meter, or the volume of gas taken in per
revolution, was given by the makers as 9.6789 cubic feet per revolu-
tion. Hence if the photographs of the dials taken at the beginningand end of a run of z minutes duration showed a difference of nrevolutions, the mean rate of volume flow indicated by the meter was
^^^(ft.Vsec.) (17)
measured at the upstream density at which the gas was taken in.
The expression for this upstream density is given by equation (7)
and we therefore have
fc> 9.6789n 1.3216 (p-0.378e) /1CAMd = -$0z~ X
458+1 (18)
The mass flow computed from the observations on the holder is
given by equation (8) and upon combining equations (8), (16), and(18) we have
Ci =4.6907^-^^ (19)n{p — e)
in whichMa Qbs./sec) = the mass flow of dry air;
2 (minutes) = the duration of the run;
n = the difference of the initial and final dial readings;
t (°F.) = the mean temperature of the air entering the meter;
p (inches Hg 32° F.)=its mean absolute static pressure; ande (inches Hg 32° F.) = the mean partial pressure of the vapor in it
Bean, BeneshJBuckingham J
Experiments on Large Gas Meiers 121
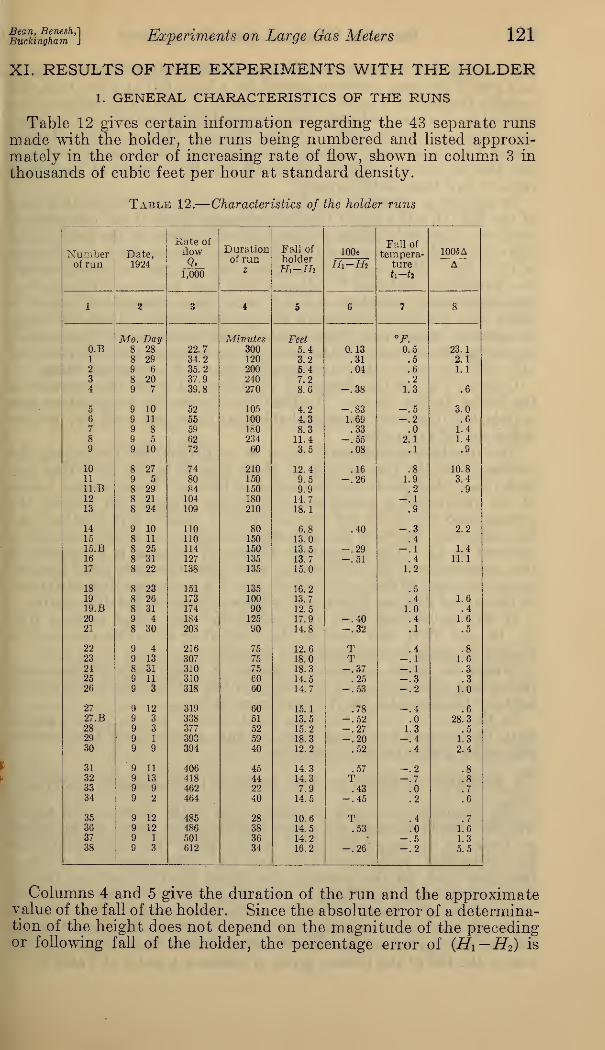
XI. RESULTS OF THE EXPERIMENTS WITH THE HOLDER1. GENERAL CHARACTERISTICS OF THE RUNS
Table 12 gives certain information regarding the 43 separate runsmade with the holder, the runs being numbered and listed approxi-mately in the order of increasing rate of flow, shown in column 3 in
thousands of cubic feet per hour at standard density.
Table 12.
—
Characteristics of the holder runs
Numberof run
Date,1924
Rate offlowQ.
1,000
Durationof run
z
Fall of
holderHi-H»
lOOe
Hi-Ha
Fall of
tempera-tureti-ta
1005A
A"
i ? 3 4 5 6 7 8
Mo. Bay Minutes Feet °F.O.B 8 28 22.7 300 5.4 0.13 0^5 23.11 8 29 34.2 120 3.2 .31 .5 2.12 9 6 35.2 200 5.4 .04 .6 1.13 8 20 37.9 240 7.2 .24 9 7 39.8 270 8.6 -.38 1.3 .6
5 9 10 52 105 4.2 -.83 -.5 3.06 9 11 55 100 4.3 1.69 -.2 .67 9 8 59 180 8.3 .33 .0 1.48 9 5 62 234 11.4 -.55 2.1 1.49 9 10 72 60 3.5 .08 .1 .9
10 8 27 74 210 12.4 .16 .8 10.811 9 5 80 150 9.5 -.26 1.9 3.4ll.B 8 29 84 150 9.9 .2 .912 8 21 104 180 14.7 -.113 8 24 109 210 18.1 .9
14 9 10 110 80 6.8 .40 -.3 2.215 8 11 110 150 13.0 .415.B 8 25 114 150 13.5 -.29 -.1 1.416 8 31 127 135 13.7 -.51 .4 11.117 8 22 138 135 15.0 1.2
18 8 23 151 135 16.2 .519 8 26 173 100 13.7 .4 1.619.B 8 31 174 90 12.5 1.0 .420 9 4 184 125 17.9 -.40 .4 1.621 8 30 208 90 14.8 -.32 .1 .5
22 9 4 216 75 12.6 T .4 .823 9 13 307 75 18.0 T -.1 1.624 8 31 3J0 75 18.3 -.37 -.1 .325 9 11 310 60 14.5 .25 -.3 .326 9 3 318 60 14.7 -.53 -.2 1.0
27 9 12 319 60 15.1 .78 -.4 .627.B 9 3 338 51 13.5 -.52 .0 28.328 9 3 377 52 15.2 -.27 1.3 .529 9 1 393 59 18.3 -.20 -.4 1.330 9 9 394 40 12.2 .52 .4 2.4
31 9 11 406 45 14.3 .57 -.2 .832 9 13 418 44 14.3 T -.7 .833 9 9 462 22 7.9 .43 .0 .734 9 2 464 40 14.5 -.45 .2 .6
35 9 12 485 28 10.6 T .4 .736 9 12 486 38 14.5 .53 .0 1.637 9 1 501 36 14.2 s -.5 1.338 9 3 612 34 16.2 -.26' -.2 5.5
Columns 4 and 5 give the duration of the run and the approximatevalue of the fall of the holder. Since the absolute error of a determina-tion of the height does not depend on the magnitude of the precedingor following fall of the holder, the percentage error of (Hi —H2 ) is

122 Bureau of Standards Journal oj Research [Vol?
likely to be less for large than for small falls; but on the other hand,in a run of the long duration needed for a large fall at a low rate, theoutside temperature may change enough to make the temperaturecontrol inadequate and the mean temperature uncertain, so that verylong runs are undesirable. It thus appears that a smaller holderwould have been more suitable for measuring the lower rates of flowand that higher accuracy in the results is to be expected at the higherrates of flow than at the lower.
In column 6, e denotes the difference between the two mean valuesof the fall (Hi —
H
2 ) found from the measurements at the two pairs of
stations at the ends of two perpendicular diameters of the holder; and100 e l(Hi—H2 ) is the percentage difference between the two estimatesof (Hi —H2 ). Where no value is given, only one pair of measurementswas available; the letter T indicates that they were made by observa-tion of the tapes at stations 1 and 3, and a blank means that they weremade with the dial mechanisms at stations 2 and 4. If all the meas-urements were accurate, these accidental differences would vanish and,on the whole, the smaller the discrepancy between the two values of
(Hi — Ho) the nearer their average is likely to be to the true value.
Column 7 gives the change of the observed mean temperature in
the holder during the run. In 15 of the 43 cases the temperature rose
a little, but it does not seem probable that there was ever any serious
deficiency of saturation.
The numbers in column 8 serve as a criterion for estimating theconstancy of the rate of flow in those runs in which an orifice wasunder test; they are to be interpreted as follows: The observed valuesof the differential A across the orifice were averaged for each of theperiods into which the run was subdivided, usually 5 in number, andthe difference between the highest and lowest of these averages is
denoted by 5A. The percentage difference, 1005A/A, is a measure of
the inconstancy of the differential, aside from the more rapid fluctua-
tions occurring within each period, and the accompanying variations
of the rate of flow are about half as large as those of the differential.
It will be noticed that the variations were large in runs 0.B,
10, 16, and 27.B, and data on the Venturi or an orifice obtained in
these runs must be regarded as of no value.
Where no figure is given in column 8, the rotary displacementmeter was under test, and constancy of the rate of flow is less impor-tant for this than for the Venturi or an orifice.
In the case of run 7, the data on the holder are somewhat uncer-tain, the records not being clear, so that results from this run are
also to be looked on with suspicion.
2. RESULTS OF TESTS OF THE ROTARY DISPLACEMENT METER
The results of the eight experiments in which air from the holderwas discharged through the rotary displacement meter are exhibitedin Table 13, in which the third column gives the values found for
the correction factor or coefficient Cd . The mean value 0.994indicates that, on the average, the meter ran 0.6 per cent fast in
comparison with the holder. The departures of the individual
values from the mean are shown in the last column; they average± 0.4 per cent and do not appear to be systematically related to the
rate of flow, given in the second column, or to the duration of the
run or the fall of the holder, given in columns 4 and 5 of Table 12.

Bean, BeneskJBuckingham J
Experiments on Large Gas Meters
Table 13.
—
Rotary displacement meter
123
RateNumberof run
1,000
cd d -0.994
3 38 0.990 -0. 00412 104 .995 .00213 109 1.001 .00715 110 .985 -.009
15.B 114 .995 .00117 138 .997 .00318 158 .999 .00519 173 .992 -.002
.994 ±.004
Table 14 contains the same results arranged chronologically,
together with the temperature, #°F, of the air entering the meter(column 4); its absolute static pressure, p, in inches of mercury(column 5) ; and the approximate value of the pressure drop Ap across
the meter, in inches of water (column 6).
Table 14
Numberof run
Date,Septem-ber, 1924
d tP
(in Hg)Ap
(in Hg)
1 2 3 4 5 6
OJ?
15 11 0.985 69.3 29.46 0.453 20 .990 66.7 29.30 .212 21 .996 66.5 29.34 .417 22 .997 74.8 29.26
18 23 .999 71.4 29.50 1.013 24 1.001 71.4 29.32 .5515. B 25 .996 70.1 29. 39 .7219 26 .992 70.7 29.35 1.23
1
There is no systematic relation between the variations of Cd andthose of t
} p, and Ap, but there seems to be a distinct run withthe date, as given in column 2, the values of Cd increasing from theeleventh to the twenty-fourth of August, and decreasing on the twofollowing days.
If this apparent connection between the value of Cd and the timewhen it was measured were real, it would indicate either a systematicchange in the operation of the meter or a contrary change in theoperations of measuring the outflow from the holder. If the changeof Cd were simply progressive and always in the same direction,
some interpretation might suggest itself, but we are inclined to regardthe apparent connection as purely fortuitous.
If the measurements of rate of flow by the holder could be regardedas exact, the departures given in column 4 of Table 13 would haveto be regarded as accidental errors of the rotary meter due to irregu-lar running. But it seems much more likely that the apparent de-partures of Cd from its mean value represent, at least in the main,accidental errors in determining the rate of flow by means of theholder.

124 Bureau of Standards Journal oj Research
3. RESULTS OF THE TESTS OF THE VENTURI METER
The results of the tests of the Venturi meter are summarized in
Table 15. Column 3 gives the approximate average value of the dif-
ferential throughout the run, expressed in inches of water; column4 gives it as a percentage of the absolute static pressure at the entranceto the Venturi; column 5 gives the value of the Reynolds number re-
ferred to the diameter and speed at the throat, as defined in noteB*; column 6 gives the values of C, the hydraulic discharge co-
efficient based on the upstream density and with the approach factor
included; column 7 gives the corresponding values of the adiabaticcoefficient Ca found from those of C by means of equation (15); andcolumn 8 gives the departures of the separate values of Ca from themean value of 0.990.
Table 15.
—
Tests of the Venturi meter
Numberof run
Rate
1,000
A(in. H20)
100 XR d
100,000C Ca Ca -0.990
i 2 3 4 5 6 7 8
19 173 0.83 1.051
19. B 174 0.91 0.99620 184 0.95 1.01821 208 1.07 1.08922 216 1.28 1.024
23 307 2.76 0.69 6.6 1.016 0.992 0.00224 310 2.88 0.73 6.6 1.012 .988 -225 310 2.82 0.70 6.6 1.012 .988 -226 318 2.96 0.74 6.8 1.010 .987 -3
27 319 2.98 0.75 6.8 1.021 .997 7
28 377 4.24 1.04 8.0 1.011 .987 -329 393 4.66 1.16 8.3 1.009 .988 -230 394 4.56 1.13 8.4 1.012 .991 1
31 406 4.95 1.23 8.6 1.010 .989 -132 418 5.10 1.27 9.2 1.015 .994 4
33 462 6.25 1.54 9.9 1.006 .988 -234 464 6.44 1.59 9.9 1.005 .986 -4
35 485 7.05 1.75 10.6 1.004 .987 -336 486 7.04 1.75 10.4 1.011 .993 3
37 501 7.58 1.87 10.3 1.004 .987 -338
Means.
611 11.25 2.76 12.9 1.005 .993 3
8.7 0.990 ±0.003
In runs 19 to 22 the differential was too low to be measured at all
accurately, as is evident from the large irregular variations of C; and13 further values from tests at rates of flow below 130,000 cubic feet
per hour varied still more. The Venturi was, in fact, too large to beused satisfactorily at rates below about 300,000 cubic feet per hour,under working conditions which did not permit of keeping the flowabsolutely steady, and we shall therefore ignore all these runs up to
No. 22 and confine our attention to those from No. 23 onward.Run 27.B is also omitted from the tabulation because the rate of
flow was very far from constant, as shown in column 8 of Table 12:
it gave C= 0.665.
The mean of the remaining 16 values of C& is 0.9897. The depar-tures of the separate values from 0.990 are given in column 8: they

BudmhTm'] Experiments on Large Gas Meters 125
average a little less than ±0.003 and do not show any systematicvariation with the rate of flow.
It will be noticed that 9 of the 16 values he within the limits 0.987to 0.989 and this makes it appear probable that if there had been a
much larger number of experiments the mean would have been a
little lower than 0.990. There are also other indications pointing in
this direction.
In run 27, which gives the greatest departure from the mean, there
was also the greatest discrepancy between the mean values of (Hi —H2 ) for the two pairs of measuring stations at the holder. (See
Table 12.) Furthermore, the discharge coefficient of the 20 per centorifice, which was measured during this run, also came out higherthan would be expected from comparison with neighboring values,
so that it seems probable that the error of the holder measurement in
this run was rather larger than usual. The value for run 38 is also
under suspicion because the rate of flow was much more variable thanin the other runs listed in Table 15. (See Table 12 column 8.)
There is no obviously valid principle for assigning weights to the
various values, but if we omit runs 27 and 38 altogether, the remain-ing 14 values give a mean of 0.9889 with a mean departure from the
mean of ±0.002.If we further confine our attention to those runs in which there
were height measurements at all four stations and the agreement of
the two means was as good as or better than the average, we haveNos. 24, 25, 28, and 29, for which the values of C& are 6.988, 0.988,
0.987, and 0.988.
Thus everything points to the conclusion that the mean value0.990, obtained by treating all the 16 values as of equal weight, is
a little high, and we shall adopt the value Ca = 0.989 as being prob-ably as close to the truth as can be got from these experiments.The accidental variations of Ca shown in column 8 of Table 15
are the joint results of errors in the measurements at the holder anderrors in the observations at the Venturi, especially in the measure-ment of the differential. It is impossible to separate the two kindsof error so as to estimate their relative importance, but it seems safe
to conclude that neither kind of error was often greater than ±0.3per cent.
4. DISCUSSION OF THE RESULTS OBTAINED WITH THE VENTURI
A discharge coefficient is, by definition, the ratio of an observedrate of flow to a " theoretical " rate. In computing the theoretical
rate of flow of a liquid through a Venturi, the density is treated as
constant. In computing the theoretical rate of flow of a gas, by thethermodynamic method which leads to the definition of the adia-
batic discharge coefficient Ca , the variation of density accompany-ing the change of pressure from entrance to throat is taken accountof in the equations, by the aid of certain assumptions which areknown to be very nearly true and need not detain us here. In bothcases, the dissipation of energy by turbulence and skin friction is
ignored, and the unavoidable presence of dissipation in any real
experiment is the main reason for the failure of the theory, in eithercase, to represent the observed facts exactly.

126 Bureau of Standards Journal of Research [Vol. 7
Now the dissipation is due almost exclusively to the existence ofviscosity; and the effect of viscosity on the nature of the motion of
a fluid through a Venturi is fixed by the value of the Reynolds num-ber. Hence we conclude that if a Venturi is tested with both air
and water at the same value of the Reynolds number, the value ofCa found in the experiment on air should be very nearly identical
with the coefficient CW = C/^1 — jS4
, or the discharge coefficient withthe approach factor not included, found in the experiment on water.The particular Venturi now in question was tested only with air,
but it is of some interest to compare the results with those of previoustests of similar Venturis with water; and for this purpose we mayuse a curve constructed by one of the present authors 4 in 1921,from the rather scanty published data then available regarding thedischarge coefficients of Venturis for water. The curve, whichrepresents Cw as a function of log Rd , is reproduced on a small scale
in the Report of the A. S. M. E. Special Research Committee onFluid Meters, 3d ed., p. 67, 1931; and the statement is there madethat: "The curve represents the general run of the values of G(denoted here by Cw ), and it seems likely that values read from it
will always be accurate within 1 per cent."In the present instance, the mean value of Rd was 870,000 (Table 15,
column 5) and at this point the reading from the curve is (7^ = 0.9874as compared with our mean value Ca = 0.990 or the more probablevalue 0.989.
At the limiting values Rd = 660,000 and 1,290,000, the curve gives
(7^ = 0.9864 and 0.9887; and in view of the accidental errors shown bycolumn 8 of Table 15, it is not surprising that our values of Ca shouldfail to show any evidence of systematic variation with the rate of flow.
5. DISCHARGE COEFFICIENTS OF THE ORIFICES
Only the four smallest orifices were tested against the holder, andthe results obtained are collected in Tables 16 and 17. They are givenas values of "the hydraulic discharge coefficient based on the up-stream density with the approach factor included"; that is, values of
C computed by means of equation (14) of Section X, 5.
The differential, in per cent of the upstream absolute static pressure,
is given as 100 x. Since one atmosphere is equivalent to about 1,030
cm. of water and the static pressure was never far from atmospheric,the differentials, as actually measured in centimeters of water, wereabout ten times the values given for 100 x. If expressed in inches of
water, they would be about four times the values of 100 x.
Values of C from, runs 0.B, 10, 16, and 27.B are omitted as worth-less because the rate of flow was very inconstant. (See Table 12,
column 8.) A value from run 7 is also omitted because the records
of the measurements on the holder are not clear.
The three values in parentheses are also to be disregarded—in
run 1, because there was evidently some mistake of recording, thoughit could not be found and corrected; and in runs 11 and 15.B, be-
cause the differential (about 0.8 inch) was too small for accurate
measurement.
1 E. Buckingham.

Bean, Benesh,]Buckingham J
Experiments on Large Gas Meters 127
In order to compare the remaining values of C with the results ofother observers, further computations are necessary but they will notbe given till a later section.
Table 16.
—
Discharge coefficients of 5 and 10 per cent orifices
Rate5 per cent 10 per cent
Run 1,000 eu. ft.
hour C 100 x C 100 a;
1 34 (0. 366) 1.852 35 .582 .764 40 .589 .935 52 0.597 0.38
6 55 .600 1.658 62 .601 2.039 72 .602 2.69
11 B 84 .591 3.9514 110 .597 1.59
Table 17.
—
Discharge coefficients of 20 and 30 per cent orifices
Rate20 per cent 30 per cent
Run 1,000 cu. ft.
hour C 100 X C 100 x
11 81 (0. 632) 0.2115 B 114 (0. 628) 0.1919 174 .605 1.0719 B 175 .610 1.00
20 184 .614 1.0721 209 .610 1.3822 216 .617 1.4223 307 .633 1.34
24 311 .608 3.2725 311 .609 3.2226 319 .608 3.3527 320 .612 3.43
28 378 .604 4.6829 395 .603 5.1730 396 .606 5.0731 407 .605 5.47
32 418 .633 2.4333 463 .630 2.9134 466 .629 2.9935 485 .628 3.29
36 488 .630 3.3237 503 .618 3.4938 614 .627 5.05
XII. COMPARISON OF THE ORIFICES WITH THE VENTURIThe time during which the holder was available for experimental
: work was not long enough for making absolute tests of all the orifices,
so a more expeditious method had to be adopted. It consisted in
running air though an orifice and the Venturi in series and treating
I
the Venturi as a secondary standard, its discharge coefficient having
j
been determined in the tests against the holder.
60869—31 9

128 Bureau of Standards Journal of Research [Voii
1. EXPERIMENTAL PROCEDURE
The intake of the booster was disconnected from the holder andleft open so that air from outside could be forced into the line, andthe rotary displacement and wet drum meters were by-passed, to
avoid pulsations in the flow. The orifice to be tested was put in
position; a pair of the water manometers was connected to the pres-
sure taps 12 inches upstream and 6 inches downstream; and a secondpair was connected to the entrance and throat piezometer rings of the
Venturi.After these preliminaries, the booster was started and brought up
to a constant speed; and as soon as a steady state had been established,
with the water columns as nearly at rest as could be hoped for, the
manometers were shut off simultaneously^ The wet and dry bulbtemperatures and the pressures were then read and recorded, to-
gether with the barometric pressure.
These operations were repeated once or twice before changing the
speed of the booster or going on to a different orifice, and the averageof the results was treated as a single test or run.
2. COMPUTATIONS
Similar observations are made at the orifice and at the Venturi, andsymbols that refer to the Venturi may be distinguished by subscript
v. At the orifice, let:
2? = the absolute static pressure at the upstream tap;
/ = the dry bulb temperature;
p = the density of the air at p, t;
A = the differential;
d=the diameter of the orifice; and(7= the hydraulic discharge coefficient, based on the upstream
density and with the approach factor included.
Let the corresponding quantities for the Venturi be denoted by
p v , t v, etc., d v being the diameter of the throat. The value of C v is
assumed to be known from the holder experiments, and C is the
quantity sought.When the flow is steady, it is the same at both places and we have
C\d2^2p^C v\d^2PAor
°-*(!f)V* (20)
The diameters, d and d v , have been measured, once for all. Theobserved differentials, A and A p , appear only in a ratio so that withthe manometers all at nearly the same temperature, no reduction to
standard temperature is needed.The ratio of the densities is found by means of the equation
vJ-™= constant (21)pi
This would not be permissible if the vapor content of the air varied
between the orifice and the Venturi; but the psychrometers showed

Bean, Benesh,!Buckingham J
Experiments on Large Gas Meters 129
that the air was always less than saturated, so that condensation wasimpossible; and, on the other hand, no water could be taken up becausethe linewas dry; the composition of the mixture was therefore constant.
Upon setting T= (458 + in equation (21) (see Section X, 3) wenow have
p, p,(458 + Q ,99 .
p ^(458 + *,){ }
and it remains only to consider the value of C9 .
Assuming the constant mean value Ca — 0.989 obtained from the
tests of the Venturi against the holder (Section XI, 3), we have byequation (15) (Section X, 6)
(l-r)(l-/34r^)J
K>
(23)
in which jS = 0.4823 is the diameter ratio of the Venturi and, in ourpresent notation,
Vv(24)
with pv and Av expressed in the same units.
Upon making these various substitutions in equation (20), weobtain the required value of C.
3. RESULTS OF THE COMPARISONS
In testing the smaller orifices, the differential was lower at theVenturi than at the orifice and with the large orifices this relation wasinverted. In either case, the precision of the result was limited by the
accuracy with which the smaller of the two differentials could bemeasured. There were, in all, 42 of these comparison tests, comprising124 separate sets of readings, but those in which the smaller differen-
tial was less than 1.56 cm or 0.6 inch have been discarded as too unre-liable to be worth reporting. The results of the remaining 26 runs are
shown in Table 18.
Table 18.
—
Orifices v. Venturi
1 2 S 4 5 1 2 3 4 5
Area ratio X 100Num-ber of
runc 100 x
A or A,cmH 2 Area ratio X 100
Num-ber of
runC 100 x
A or A,cmH 2
10
11
121314
f22
\ 23
I 24
( 25
\ 26
I 27
f 28
1 29
0.595.592.589.596.591
.609
.608
.601
.632
.629
.627
(. 464).640
2.985.145.746.917.35
1.523.036.47
.902.433.51
(2. 03)2.87
1.562.773.133.914.11
3.256.6514.90
4.6412.9119.03
(7. 74)
22.02
40 / 30
I 31
/ 32
\ 33
f 34
1 35
f 36
I 37
3839404142
0.681.657
.681
.679
.706
.702
.728
.729
.760
.801
.827
.9091.005
0.621.76
.671.73
.381.34
.371.00
.79
.66
.51
.39
.28
6.42
10
45
18.09
6.94
20 50.
18.46
4.0114.22
3.8555
30
60....
10.63
8.3365 7.01
35 70 5.3475 4.1380 2.95

130 Bureau oj Standards Journal of Research [Vol. 7
The first two columns give the area ratio of the orifice, in per cent,
and the serial number of the run. The third and fourth columns showthe values found for C and the percentage differentials at which theywere found. The last column gives the lower of the two differentials,
expressed in centimeters of water, as measured.In run 28 there was evidently a mistake in reading or recording the
differential across the orifice, and the value of Cmay be disregarded.
XIII. DISCUSSION OF THE RESULTS OF THE EXPERI-MENTS ON ORIFICES
Accurate standardization tests of a set of orifices are valuable to
anyone who is to use these particular orifices for metering purposes.But however carefully the work may have been done, the results of acomparatively small number of tests, such as have been reported here,
are of little general interest except as they confirm, correct, or extendthe body of information about the discharge coefficients of orifices
which is already publicly available. We have therefore to compare thedischarge coefficients obtained in the present investigation with someof those already published by others.
In the present instance, the pipe was smooth and the orifices werecarefully finished. . Furthermore, the orifices were large, their diame-ters ranging from 5.2 inches upward, so that the remaining imperfec-tions of the edges were very small relatively to the absolute sizes of theorifices. In the vital matter of geometrical shape, our apparatus wasthus very closely comparable with the apparatus used by Witte 6 in
some of his admirable experiments with water, and our results will
therefore be compared with his.
Before this comparison can be instituted, some preliminary reduc-tions are needed; for although the similarity of shape of the apparatusappears satisfactory, the experimental conditions differed in tworespects.
In the first place, the points where the pressures were measured werenot similarly situated. In Witte's experiments, the pressure connec-tions were made in the corners between the wall of the pipe and thefaces of the orifice plate, whereas in the present experiments, the pres-
sures were taken off at points 12 inches upstream and 6 inches down-stream. To make the results comparable, this difference must beallowed for by utilizing the observations on the longitudinal distribu-
tion of pressure, described above in Section IX.In the second place, the discharge coefficient of an orifice for a gas
varies with the pressure ratio. Hence it is necessary to allow for this
effect of changing density by extrapolating from values measured at
various finite values of the fractional differential, A/pi = Xj to find thelimiting value at x = Q, which represents what would have beenobtained if the density had remained constant during the flowthrough the orifice, as it does with water.
1. REDUCTION FOR CHANGE OF TAP LOCATION
In a given test, let A 7 be the observed differential, p be the densityat the observed upstream pressure, and C be the discharge coefficient,
8 R. Witte, Durchflusszahlen von Dusen und Staur&ndern, Techn. Mech. u. Thermodynamik, 1 Nos.1,2,3; 1930.

Bucli^Zm11
'] Experiments on Large Gas Meters 131
computed from A' and p', together with the observed mass flow, M,and the known diameter, d. Let A", p", and C" be the values thatwould have been obtained in the same test if a different pair of tapshad been employed. Then we have, by definition,
M=C | ^VVA7^ C" |dVV7^77(25)
or
C"- P'A '
(9M~G
7 ~^~PnrKn (26)
Now the longitudinal variations of the upstream static pressure,
within a few pipe diameters of the orifice, are, at most, only a fewper cent of the drop through the orifice (see Tables 2 to 11); and in
the present experiments, that drop was never as much as 8 per centof the absolute static pressure. Hence the percentage difference of
the two upstream static pressures was insignificant and for ourpresent purposes equation (26) may be simplified to the form
c" I A'
If the curve of pressure distribution, qualitatively illustrated in
Figure 4, has been determined by experiment, the difference of pres-
sure, A', between two taps at any distances from the orifice plate
within the range of the experiments may evidently be found, in termsof the difference between the upstream and downstream minima, byreadings from the curve. The same is true of the differential A"between any second pair of taps, and we can thus find the ratio
A'/A" for any two pairs of taps. This may then be substituted in
equation (27) and if one of the two discharge coefficients has beendetermined, the other may be computed from it.
The observations did not cover a sufficient length of pipe to give anyinformation about the arrangement commonly known as "pipe taps,"
in which the pressure connections are made at points 2.5 D upstreamand 8 D downstream, D being the pipe diameter; and our further con-siderations relate only to the region from 1 D upstream to 0.5 Ddownstream.For this region, the composite data given in the final columns of
Tables 2 to 11 were plotted against distances, as in Figures 5 and 6,
and smooth curves were drawn through the two sets of points, for eachorifice. Values of A'/A were read from the curves at several pairs of
distances, the values for each pair were plotted against the area ratios
of the orifices, and a second set of smooth curves was drawn. The twosets of curves were then readjusted until they appeared to give arepresentation of the observed facts which was as free as practicable
from the influence of accidental errors of measurement.
Values of the reduction factor V^'/A", required for use with equa-tion (27), were obtained from these adjusted curves and the results
are exhibited in Table 19, in which the notation is as follows:
C (12, 6) represents the value of the hydraulic discharge coefficient,
based on the upstream density and with the approach factor included,as observed with the pressure taps 12 inches upstream and 6 inchesdownstream from the orifice.

132 Bureau of Standards Journal oj Research {Vol.7
C (24, 12) is the value that would have been found if the distanceshad been 24 inches and 12 inches, or approximately 1 D and 0.5 D;this combination has been called " throat taps."
C (3, 3) is the value that would have been found with the taps 3
inches or 22/8 on each side of the orifice plate ; this corresponds to the"flange taps" in B. S. Research Paper No. 49. 6
C (1,1) is the value that would have been obtained if the taps hadbeen 1 inch from the orifice plate; since we had no taps that were less
than 1 inch, or 22/24, from the orifice plate, this arrangement wasthe nearest we had to taking off the pressures right in the corner.
It may be noted that the values in Table 19 were obtained from thecomposite values in Tables 2 to 11, and that each one should not, in
reality, be quite constant, because the pressure distribution curvesvaried with the rate of flow, as was illustrated-by Figure 5. But overthe length of pipe now in question, and over the range of differentials
for which the reduction factors in Table 19 have been deduced, these
variations are small and probably altogether insignificant in compari-son with other unavoidable errors.
2. ALLOWANCE FOR VARYING DENSITY; THE EXPANSION FACTOR
Let us suppose that an orifice is tested with a liquid, and let Kdenote the discharge coefficient with the approach factor included,
defined in terms of normal units by the equation
M=K~d2^2pA (28)
in which M, d, p, and A have their usual meanings, but p does notrequire any identifying subscript because it is sensibly constant for
any one liquid.
At low values of the Reynolds Number (small orifice, low speed,high viscosity) K varies with the rate of flow; but at high values,
where the effects of viscosity are negligible, the value of K is constantand no longer dependent on the rate of flow.
If the same orifice is tested with a gas, such as air, we have (see
equation 12, Section X, 5)
M=C\d2^2^k (29)
but even though the Reynolds Number be so high as to make viscosity
of no importance, C is not constant but decreases as the differential
and the rate of flow are increased.
Table 19.
—
Reduction factors for change of tap location
Area C(24.12) C(3, 3) C{\, 1)
ratio 0* C(12, 6) C(12, 6) C(12, 6)
0.05 0.999 1.000 1.001
.10 .999 1.000 1.001
.20 .999 .999 1.000
.30 .998 .997 .999
.35 .998 .996 .998
.40 .998 .994 .997
.45 .999 .992 .995
.50 1.000 .989 .991
.55 1.002 .986 .987
.60 1.005 .982 .981
.65 1.012 .976 .975
• See footnote 3, p. 119.

BuIkingTam'] Experiments on Large Gas Meters 133
If tests are carried out over a sufficient range of values of the frac-
tional differential, A/p l= x (but all at high values of the Reynolds
Number, where the effects of viscosity are insensible, as was true of all
the tests recorded here), the results show that as x decreases, the valuesof C tend toward the fixed value K as a limit. It is therefore con-venient to represent C in the form
C=KY (30)
in which K is the constant discharge coefficient found by testing theorifice with water, and Y is the variable " expansion factor," intro-
duced into the literature by E. S. Smith 7 to take account of the effect
of the variations of density during flow through an orifice, which occurwith a gas but are absent in the simpler case of a liquid.
The experiments described in this paper did not cover a sufficient
range of values of x to permit of determining the form of Y, but wemay utilize later information obtained from experiments on naturalgas, conducted at Los Angeles in 1929 by one of us,8 as part of aninvestigation being carried out by a committee of the natural gasdepartment of the American Gas Association, in cooperation with theNational Bureau of Standards.
Similar information is contained in B. S. Research Paper No. 49 9
but the Los Angeles results are to be preferred, because the workingconditions were more favorable as regards steadiness of flow andpermitted of higher precision in the measurements.
In the Los Angeles experiments, the orifices were tested in newcommerical steel pipes of 16, 8, and 4 inch nominal diameter, withhoneycombs of smaller pipes placed from 10 D to 15 D ahead of theorifices; and pressure measurements were made at taps distant 1
inch from the orifice plates.
So far as concerns the expansion factor, the results of the tests in
the 16 and 8 inch pipes were consistent, and the change of relative
tap distance from D/16 to D/S made no appreciable difference: butthe further change to J9/4 did appear to have a slight effect, and weshall confine our attention to the tests in the two larger pipes. Thesewere carried out on 17 orifices with diameter ratios from 0.124 to
0.869, or area ratios between 1.5 and 76 per cent.
When the values of Cfor each orifice were plotted against the valuesof x at which they were measured, the result was a diagram, such as
is illustrated, qualitatively, by Figure 7.
For the two orifices with diameter ratios below /3 = 0.2 the curveswere sligltly convex upward, but for the remaining 15, for which 0.3
</3<0.87, the series of plotted points showed no evidence of system-atic departure from straight lines. The expansion factor was there-
fore of the form
Y=l-Bx
with B a constant for each orifice but increasing with /3.
Table 20 gives the diameter ratios, the number of tests on eachorifice, and the range of values of x over which the tests were distributed.
7 Ed S. Smith, jr., "Quantitv-Rate Fluid Meters," paper presented at the annual meeting of theA S. M. E., New York, December, 1923. Trans. A. S. M. E. paper No. HYD-52-7D, 52, No. 30.
'H. S. Bean.• See footnote 3, p. 119.

134 BureoM of Standards Journal of Research
Table 20.
—
Los Angeles tests
{Vol. 7
Pipediameter
Diameterratio
NumberX
D of tests Mini- Maxi-(inches) mum mum
f0. 390 26 0.009 0.46.553 27 .010 .40.650 21 .007 .26.693 21 .006 .20
15.38 <
.748 14 .009 .13
.796 11 .014 .11
.829 18 .02 .08
{ .861 11 .02 .06
f .310 21 .03 .47.497 21 .02 .48.621 21 .02 .44
8.05 { .683 28 .02 .51.745 29 .02 .53.807 31 .02 .57
1 .869 29 .02 .65
Figure 7.
—
Qualitative relation between the discharge
coefficient C and the differential-static pressure ratio x
The slopes of all the 15 straight lines obtained from these tests
may be represented, within the precision of the measurements, bysetting
F=l-(0.31 + 0.35/34)z (31)
but this equation is not directly applicable to experiments on air;
for the expansion factor depends on the specific heat ratio, Cp/Cv = y,as well as on x, according to some equation
Y=f(x,y) (32)
and the specific heat ratio of the Los Angeles gas was computed fromthe average chemical analysis to be 1.283, whereas for air it is 1.40.
It may be shown, 10 however, that when x is small, equation (32)
is, very nearly, of the more definite form
y-it) (33)
w See note 7, p. 133.

Bean, BeneshABuckingham J
Experiments on Large Gas Meters 135
and this means that equation (31) may be regarded as a special caseof the more general equation
1.283(0. 31 + 0.35/34)-Y=l
or
xr=l-(0.40 + 0.46/3
4)-7
(34)
applicable to all nearly ideal gases.
In the case of air, with 7 = 1.40, the general equation reduces to
F=l-(0.29-f0.33/34):r (35)
and this equation will be used for finding values of K from ourobserved values of C.
3. WITTE'S VALUES OF K FOR SMOOTH PIPES
The experiments now in question, which are only a small part of
Witte's extensive researches on nozzles and orifices, were carried outin smooth pipes, and the orifice plates were finished with great care to
have the upstream corner of the hole perfectly square and sharp.
The results are so important that it is advisable to quote them hereand they are given in Table 21, the figures in colums 1, 2, 4, and 5
being copied directly from Table 7 of the original paper. 11
The four pipes used were of approximately 2, 4, 8, and 12 inchesin diameter, and the 24 orifices tested had the area ratios shown in
column 2 of Table 21. Each orifice was tested at various rates of
flow, the numbers of separate tests being given in column 4, and theresulting average values of Kin column 5.
Table 21.
—
Witte's values of K for perfect orifices in smooth pipes
Diame- 0.5994-
ter of Area Diame- Number K 0.39 * isT(obs.)
pipe ratio ter ratio of tests (obs.) =K -iir(calc)[mm] (calc.)
1 2
Per cent
3 I 5 6 7
9.2 0.303 7 0.602 0.602 0.000310 23.4 .484 12 .621 .620 .001
33.7 .580 12 .642 .643 -.001(12".2) 46.8 .684 9 .685 .684 .001
55. .742 6 .717 .717 .000
f5.1 .226 22 .599 .600 -.0019.9 .315 25 .602 .603 -.00120.2 .450 17 .615 .615 .000
200 30.3 .550 15 .6365 .635 .00139.7 .630 7 .661 .660 .001
(7".9) 49.0 .700 17 .693 .693 .00049.5 .703 6 .693 .694 -.00164.2 .801 30 .770 .760 .010
, 70.1 . 837 21 .808 .791 .017
100f 36.5 .604 10 .651 .651 .000
56.9 . 754 5 .726 .725 .001
(3".94) ] 61.0 .781 12 .749 .745 .004
I 70.5 .840 12 .812 .793 .019
f 17.6 .420 22 .613 .611 .002
5041.0 .640 13 .663 .665 -.00251.9 .720 29 .704 .704 .000
(1".97)60.9 .780 29 .749 .744 .00570.7 .841 26 .812 .794 .01881.0 .900 14 .907 .855 .052
ii See note 5, p. 130.

136 Bureau of Standards Journal of Research \voi.7
If all the measurements were exact, the points obtained by plottingthe values of K against any power of the area ratio should evidentlylie on some smooth curve; and when the observed values of K areplotted against /3
4, or the square of the area ratio, the points for all
diameter ratios up to /3 = 0.75 do lie extremely close to the straightline represented by the equation
iT(calc) = 0.599 + 0.39/34
(36)
Values computed from equation (36) are shown in column 6 of thetable and the differences, i£(obs.) — i£(calc), in column 7. Up to
£ = 0.75, the greatest departure of the observed values from the linear
equation (36) is one-third per cent, and the average departure is onlyabout 0.1 per cent.
The equation
K= 0.598 4-0.40y34(37)
is about as good as equation (36) for medium values of /3, but thestraight line is a little too steep and the coefficient of 4
is slightly butdistinctly too high.
Since the diameter ratios of Witte's orifices did not correspondexactly to those of the orifices used in our experiments, a comparisonbetween the two sets of results requires the use of some sort of inter-
polation formula, and for this purpose equation (36) will be taken as
representing the aggregate of Witte's results, for £^0.75, within their
experimental accuracy.
4. COMPARISON OF THE CHICAGO RESULTS FOR AIR WITH WITTE'SRESULTS FOR WATER
To make one of our values of C comparable with the correspond-ing value of K obtained by Witte, it has first to be multiplied by(7(1, 1)/(7(12, 6) to take account of the difference of tap location; this
product has then to be divided by the expansion factor Y, so as togive the value of
K=C(12,6)x^-^pF (38)
The mean values of C from the holder tests, reduced in this manner,are exhibited in Table 22. Columns 3 and 4 give the mean values of
C and 100 x, found by averaging the separate values in Tables 16 and17; column 5 gives the factor for change of tap location, from Table19; column 6 gives the value of the expansion factor for the givenvalues of (3 and x, computed from equation (35); column 7 gives theresulting value of K for taps distant Z7/24 from the orifice plate; andcolumn 8 gives the value of K from equation (36), which representsWitte's results for taps hi the corner.

Bean ^Benesh,!Buckingham J
Experiments on Large Gas Meters 137
Table 22.
—
Orifice coefficients measured by the holder, compared with Witte}
s
results for water
Arearatio
Numberof tests
averagedC(12, 6) 100 X
CO., 1)
C(12, 6)Y K
(obs.)
KWitte
equ. (36)
1 2 3 c 5 6 7 8
Per cent
5
102030
6
213
8
0.594.597.6085.6285
2.000.993.053.10
1.0011.0011.0000.999
0.9942.9971.9908.9901
0.598.599.614.634
0.600.603.615.634
Our values of C, and therefore of K, are much less reliable for the
two smaller than for the two larger orifices; for the holder was better
adapted to testing the 20 and 30 per cent orifices and there were moretests. The values of K, computed in accordance with equation (38)
from the mean values of C, are thus intrinsically more probable thanfor the two smaller orifices, and they are in very good agreementwith Witte's values as represented by equation (36).
The values of C obtained from the comparison runs in which theVenturi was used as the standard have also been reduced in themanner described above, and the resulting values of Kfor the 10 to 65per cent orifices are exhibited in Table 23.
Table 23.
—
Orifice coefficients measured by the Venturi meter compared withWitte's results for water
Arearatio
Number K (calc.) K (calc.) K (calc.)
of tests C (12, 6) 100 X K (obs.) by equa- by equa- by equa-averaged tion (36) tion (39) tion (40)
1 o 3 i E 6 7 8
Per cent .
10 5 0. 5926 5.62 0.603 0.603 0.601 0.60220 3 .6060 3.67 .613 .615 .613 .61430 3 .6293 2.28 .633 .634 .634 .63435 1 .640 2.87 .645 .647 .647 .64740 2 .669 1.10 .670 .661 .663 .662
45 2 .6S0 1.20 .680 .678 .680 .67950 2 .704 .86 .700 .697 .700 .69955 2 .7285 .68 .721 .717 .721 .71960 1 .760 .79 .748 .737 .745 .74265 1 .S01 .66 .783 .764 .770 .767
Columns 3 and 4 contain the means of the separate values of Candof 100 x in columns 3 and 4 of Table 18; and the values of K deducedfrom these means are given in column 5. Column 6 gives the valuesof K computed from equation (36) or
K= 0.599 + 0.39 jS4
(36)
which represents Witte's results up to /3 = 0.75; and columns 7 and 8
give the corresponding values from the slightly modified equations
K= 0.597 + 0.41 /34
(39)
andK= 0.598 + 0.40 /3
4(40)

138 Bureau of Standards Journal of Research [Vol. 7
Our mean values of K from both Table 22 and Table 23 are plottedagainst values of /3
4 in Figure 8, in which the two straight lines repre-sent equations (36) and (39).
Table 23 and Figure 8 do not include values of K for the 70, 75, and80 per cent orifices, although observed values of C are given in Table18. Our failure to get satisfactory observations of the longitudinal
OM
M
.74:
7Z
.7®
66
.66
M\
jtssm*S523E *
v£
mn
Mi:ail:
W
01 & 0.2
iYilVl
sW»:
EE
V:
nm n
imiBitt
mm
0.3
m
(Iffl i
!!?SS:M:
if
Mz
i\
O.f
m
Figure 8.
—
Results of orifice coefficient determinations by Chicago tests com-pared with the line W
}representing the results of Witte's tests
distribution of pressure with these large orifices made it impossible"toextend Table 19 beyond the 65 per cent orifice.
5. CONCLUSIONS FROM THE FOREGOING COMPARISON
Examination of Tables 21, 22, and 23 and Figure 8 leads to thefollowing conclusions:
(a) The values of K, deduced from our experiments with the holderby utilizing the observations on the longitudinal distribution of
iS*KA'] Experiments on Large Gas Meters 139
pressure and the information regarding the expansion factor furnishedby the Los Angeles experiments with natural gas, agree with the valuesof K from Witte's experiments with water, within the accidentalerrors of experiment. The agreement is closest for our 20 and 30 percent orifices, and these are the ones on which our tests were mostnumerous and most reliable. This comparison does not go beyondan area ratio of 30 per cent, for which = 0.548.
(6) When the tests on the larger orifices, with the Venturi as thestandard, are also taken into account, it appears that, up to andincluding the 55 per cent orifice, equation (39) reproduces our resultssomewhat better than equation (36); or, graphically, the best straightline through our points is a little steeper than the best line throughWitte's points.
(c) The value of K for our 40 per cent orifice is based on themean of two rather discordant values of G (see Table 18), of whichat least one must have been affected by some unusually large error.
Omitting this value, we have for the remaining 8 orifices, up to andincluding the 55 per cent orifice, 4 values of K from experiments withthe holder and 7 values from comparisons with the Venturi. Thereare also the 17 values given in Table 21 from Witte's experimentswith area ratios up to 56.9 per cent. The mean equation (40) repro-duces all these 28 values of K with an extreme departure of 0.5 percent, for one of Witte's orifices and one of ours, and an averagedeparture of somewhat less than 0.2 per cent.
(d) As the area ratio increases beyond about 57 per cent (V0.57 =0.75 + ), the value of K increases faster than before and the simplelinear relations (36) and (39) no longer hold. This is evident from thedata in Tables 21 and 23.
6. REMARKS
The difference between the lines W and C of Figure 8 appears to besignificant and not merely accidental, but we are not, at present,
able to interpret this difference with certainty.
Increasing the roughness of the wall of the pipe increases the slope
of the line, and it is possible that our 24-inch pipe was rougher thanthe pipes used by Witte, to a sufficient degree to account for thedifference mentioned; but this interpretation does not seem satis-
factory. For aside from the fact that our pipe was actually verysmooth, increasing the roughness of the pipe not only makes the line
K=j{fr) steeper, but shifts it bodily upward, whereas the lines W andC of Figure 8 cross at the point where our observations are mosttrustworthy.We are more inclined to attribute the difference of slopes to the
different locations of the pressure connections, for the following
reasons
:
In an earlier paper, 12 Witte gives the results of measurements of
the rise of pressure from the upstream minimum to the plate, and oi
the fall from the plate to the downstream minimum. The values are
given only in the form of small-scale curves, but we can get from themapproximate values which correspond to a continuation, right up to
the faces of the plate, of our observations on the longitudinal distribu-
tion of^pressure which stopped 1 inch away.
» Z. V. D. I., 72, No. 42, p. 1493, 1928.

140 Bureau of Standards Journal oj Research [Voi.7
On the downstream side, the points thus obtained lie on entirely
natural extrapolations from our series of observed points; but on theupstream side there is a systematic difference. For the small diameterratios, Witte's points are lower than would be expected from atentative extrapolation of our curves, whereas at the large diameterratios they are much higher. The indications are that shifting thepressure taps from our last position, 1 inch from the plate, to Witte'sposition, in the corner, will decrease the observed differential, slightly
for small area ratios but increase it considerably for large ratios.
The values of C or K computed from the observed differentials will,
of course, be affected in the opposite sense; and this is the sense in
which Witte's values of K, represented by line W in Figure 8, differ
from ours, which are represented by line C.
It is not possible to pursue this analysis quantitatively, withoutfurther detailed investigation of the variations of pressure close to theplate, but it is evident that such investigations are highly desirable.
7. GRAPHICAL REPRESENTATION OF TABLES 16, 17, AND 18
Tables 22 and 23 and Figure 8 deal only with mean values, and to
give an idea of the consistency of our separate determinations of thedischarge coefficients with one another and with the results of theLos Angeles experiments, embodied in equation (35), Figure 9 hasbeen prepared.The ordinates are values of C=C (12, 6), observed with the pres-
sure taps 12 inches upstream and 6 inches downstream; and theabscissas are the values of 100 x at which the observations weremade.Each point represents a single value of C; the points surrounded by
triangles are values obtained in the tests with the holder, and their
coordinates are taken from Tables 16 and 17; and the points in thecircles are values from the comparison runs against the Venturi,their coordinates being taken from Table 18. The points for eachorifice are grouped, more or less closely, about a straight line; and thenumber at the right-hand end of the line is the area ratio of the orifice,
in per cent.
The intercept and slope of the line for each orifice were determinedas follows : It was first assumed that if the taps had been 1 inch fromthe plate, the value of
K=K (1, l)=limit of C (1, 1) as x=
would have satisfied equation (39), represented by line Cin Figure 8;and the value of K (1, I) was computed for the given value of /5,
from equation (39).
The corresponding value of
i£(12, 6) = limit of (7(12, 6) as x=
was then found from the relation

Bean, BeneshJBuckingham J
Experiments on Large Gas Meters 141
by taking the value of (7(1, 1)/(7(12, 6) from the last column of Table(19). This gave the required intercept of the straight line on theC axis.
The expansion factor at a; = 0.1 was next computed from (35), andwhen multiplied by the value of K(12, 6) already found, this gave theordinate of the line at 2 = 0.1. The two points thus determined, for
x = and a; = 0.1, were then plotted and the straight line was drawmthrough them.
)ooA/pt* toox
Figure 9.
—
Actual test results plotted from Tables 16, 17, and 18
The numbers at the right of the slanting lines are values of 100/32.
For the 5 per cent orifice (d = 5.2 inches), the rate of flow attainable
was limited by the maximum pressure the booster could give, andthe greatest differential that could be reached at the Venturi was less
than 0.3 inch. Since this was too low for accurate measurement, theVenturi tests were worthless and are not shown. The rates of flow
were also too low to be measured satisfactorily with so large a holder,
and the points from the holder runs are considerably scattered.
For the 10, 20, and 30 per cent orifices, there are points representingthe results of both kinds of test. The higher rates of flow were morefavorable to accuracy, and the points are less scattered than for

142 Bureau of Standards Journal of Research [Voi.r
the 5 per cent orifice. Two of the Venturi points for the 10 per centorifice are rather far out of line with the others; but the greatest
differential at the Venturi was less than 1.7 inches, and the greatest
departure of any of the points from the straight line corresponds to
an error of only about 0.04 inch in reading this differential.
Aside from these two points, the Venturi and holder points are mixedindiscriminately, for all three orifices, and the use of the Venturi as a
secondary standard, after calibration by the holder, is justified.
For the larger area ratios, there are no tests with the holder and, at
most, only two Venturi tests for each orifice. One of the values for the
40 per cent orifice is evidently considerably in error ; but with the excep-tion of this point, none of the Venturi points for the 20 to 60 per" centorifices, inclusive, is more than 0.6 per cent awayfrom the correspondingstraight line, and the average departure is only about 0.2 per cent.
It thus appears, from Figure 9, not only that the Venturi was a
satisfactory substitute for the holder, but that the general expression
for the expansion factor, deduced from the results of the Los Angelesexperiments on natural gas, did fit our observations on air withintheir experimental accuracy.
XIV. SUMMARY
1. The experiments on the metering of air were of three kinds:
(a) Observations of the variation of static pressure along thewall of a smooth, 24-inch pipe near a thin-plate orifice installed con-centrically in the pipe. The experiments were performed with 14
orifices of diameters from 5.2 to 20.6 inches, and with several different
rates of flow for each orifice.
(6) Tests of a rotary displacement meter, a 24 by 12 inch Venturimeter, and four of the orifices, the air being drawn from a large gasholder which served as a primary standard meter.
(c) Tests of all the 14 orifices by comparison with the Venturimeter, previously standardized in the tests with the holder.
2. The mean of 8 tests of the rotary displacement meter indicatedthat the meter ran about 0.6 per cent fast. The average departureof a single result from the mean of all was ±0.4 per cent, but there is
no reason to attribute the departures to irregular functioning of themeter. They were more probably due to errors in the observations onthe holder; for the rated maximum capacity of the meter was only200,000 cubic feet per hour, and the holder was undesirably large for
measuring rates of flow lower than this.
3. The results of the comparisons of the Venturi with the holder, at
rates of flow between 300,000 and 600,000 cubic feet per hour, indi-
cated that within this range, a determination of rate of flow fromobservations on the rate of fall of the holder which appeared intrin-
sically satisfactory, was usually accurate to about ±0.3 per cent.
This corresponded to an accuracy of somewhat better than ±2degrees F. in the temperature, but in reality the limit of accuracy wasset by errors in measuring the height rather than the temperature.
4. The results of the comparisons of the orifices with both the holderand the Venturi have been expressed as values of the dischargecoefficient C, defined by the equation
M= CA-yl2(p l-p2) Pl

BurtingZ'm'] Experiments on Large Gas Meters 143
in which M lbs./sec. is the rate of flow as measured by the fall of theholder or by the standardized Venturi; A square feet is the area of theorifice; p\ and p2 poundals per square foot are the pressures observedat the upstream and downstream pressure taps; and pi lbs. /ft. 3
is thedensity of the air at the pressure p\ and at the upstream temperature.By utilizing the results of the experiments of group A and of later
experiments on natural gas, the values of C have been so reduced as
to be comparable with the values for water obtained by R. Witte withapparatus that was very nearly, though not exactly, geometricallysimilar to ours. The agreement of the two sets of values is veryclose in the region where our own values are most reliable.
There appear to be small systematic differences, which increase to
about 0.7 per cent when the ratio of orifice to pipe diameter is as large
as 0.75, but they can not be interpreted or explained with any confi-
dence until the variations of pressure in the immediate vicinity of theorifice plate have been further investigated.
If we let (3=d/D denote the ratio of the diameter of the orifice to
that of the pipe, and x^(p l—p2)lpi denote the differential expressed
as a fraction of the upstream absolute pressure; and if the pressuretaps are 1 inch from the orifice plate, our results for diameter ratios
between /3 = 0.3 and /3 = 0.77 may all be represented, within their
experimental accuracy, by the empirical equation
C= (0.597 + 0.41/34) [1 - (0.29 + 0.33/3
4) x]
The experiments did not go beyond x = 0.08, but the equation is
probably valid for considerable higher values of x. For higher valuesof /3, the equation gives too low values.
Note A.—THE ADIABATIC DISCHARGE COEFFICIENT
The "adiabatic discharge coefficient" Ca results from computingthe theoretical mass flow on the assumptions that the fluid is an ideal
gas and that the expansion from p x to p2 is isentropic. It is definedby the equation
M=Ca ~d2
in which
7+1
2TPiPi©T-©"-
-«•©7-1
7
M=the mass flow;
d = the diameter of the Venturi throat;' Vu #2 = the observed upstream and downstream pressures;
Pi = the upstream density;jS = d/D = the diameter ratio ; and7 = Cp/Cv = the specific heat ratio.
The hydraulic discharge coefficient C, based on the upstream densityand with the approach factor included, is defined by the equation
M^C-d'^p^-p,)
60869—31 10

144 Bureau of Standards Journal of Research [Vol. 7
By equating these two expressions for M we get the relation
Ca
a^('-g)['-KS)'l7 2 7+1
V2\ 7
'1/ Ni'L
Or if we let P2/P1 = i and set 7 = 1 .4 as for air, we have
10 >
Ca
a2(l-r)(l-j8Vf)
7( 10 12\_ 'Krj— rjJ _
or equation (15) of Section X, 6.
Note B.—THE REYNOLDS NUMBER
In the case of a stream of fluid along a round pipe, the Reynoldsnumber is usually defined as the value of the expression
RDDSipi
(1)
in which D = the diameter of the pipe; Si = the mean linear speed alongthe pipe; pi = the density of the fluid; and /* = its viscosity. All thequantities are understood to be measured by some system of normalunits, such as the British absolute or the cgs., and since the expressionis of zero dimensions, its numerical value is the same in all suchsystems.The mean speed has to be determined indirectly from the rate of
discharge M, by means of the equation
7T
M=lD*SlPl
and equation (1) might be written in the form
4MRd
irDfx
(2)
(3)
but the traditional form equation (1) is retained here as more familiar.
As is well known, the effects of viscosity on the nature of the fluid
motion depend on the value of RD , which serves as a criterion, or anindependent variable, in discussing these effects on skin friction, etc.
If a Venturi of throat diameter d= j3D is included in the pipe line,
its discharge coefficient depends on the motion in the approachingstream and therefore on the value of RD ; but it is more natural to
adopt as the independent variable or Reynolds number, the analogousexpression
^$2P2 /4NR(>
M
in which p2 and #2 are the density and mean speed at the throat;
and this second form of Reynolds number is physically more signifi-

BuckmZmh'] Experiments on Large Gas Meters 145
cant than the first, because the nature of the motion through thethroat is more influenced by the size of the throat than by the size of
the pipe.
Equation (4) may also be written in the form
4M
corresponding with equation (3); and since M is the same in bothequations, and the viscosity is nearly the same at the throat as in theapproach pipe, comparison of equation (3) with equation (5) gives
the approximate relation
RD=pRa (6)
and either form of the Reynolds number may be found from the other.
Similarly, for an orifice of diameter d installed in a pipe of diameterD, the nature of the motion and the value of the discharge coefficient,
in so far as they are influenced by the viscosity of the fluid, may beregarded as dependent on either RD or Rd = Rd/P-
In any event, and whether it is an orifice, a Venturi, or a straight
pipe that is under consideration, the effects of viscosity on the motionof the fluid become negligible when the viscosity itself is sufficiently
low; and since these effects are not determined merely by the valueof ju, but by the value of the Reynolds number as a whole, theybecome insignificant when either RD or Rd is made very large.
For further information on the experimental side of this subject thereader may be referred to papers by J. L. Hodgson, 13 R. Witte, 14 andF. C. Johansen. 15
Washington, May 13, 1931.
13 Inst. Civ. Eng., Selected Engineering Papers, No. 31, 1925.» See footnote 5, p. 130 and 12, p. 139.» Proc. Roy, Soc. London, A 126, p. 231, 1929.