experimental testing of controllable damping devices toward extending · pdf...
TRANSCRIPT
Experimental Testing of Controllable Damping Devices toward Extending the Lifespan of
Existing Highway Bridges
September 2015
R.E. Christenson Z. Jiang S.J. Kim S. Plude
JHR 15-326 Project 08-06
This research was sponsored by the Joint Highway Research Advisory Council (JHRAC) of the University of Connecticut and the Connecticut Department of Transportation and was performed through the Connecticut Transportation Institute of the University of Connecticut. The contents of this report reflect the views of the authors who are responsible for the facts and accuracy of the data presented herein. The contents do not necessarily reflect the official views or policies of the University of Connecticut or the Connecticut Department of Transportation. This report does not constitute a standard, specification, or regulation.
ii
1. Report No. 2. Government Accession No. 3. Recipient’s Catalog No.
JHR 15-326 N/A 4. Title and Subtitle 5. Report Date
Experimental Testing of Controllable Damping Devices toward Extending the Lifespan of Existing Highway Bridges
September 2015
6. Performing Organization Code
JH 08-06
7. Author(s) 8. Performing Organization Report No.
R.E. Christenson, Z. Jiang, S.J. Kim, S. Plude JHR 15-326 9. Performing Organization Name and Address 10. Work Unit No. (TRAIS)
University of Connecticut Connecticut Transportation Institute Storrs, CT 06269-5202
N/A
11. Contract or Grant No. N/A
12. Sponsoring Agency Name and Address 13. Type of Report and Period Covered
Connecticut Department of Transportation 2800 Berlin Turnpike Newington, CT 06111
Final
14. Sponsoring Agency Code
N/A
15. Supplementary Notes
This study was conducted under the Connecticut Cooperative Transportation Research Program (CCTRP, http://www.cti.uconn.edu/cctrp/). 16. Abstract
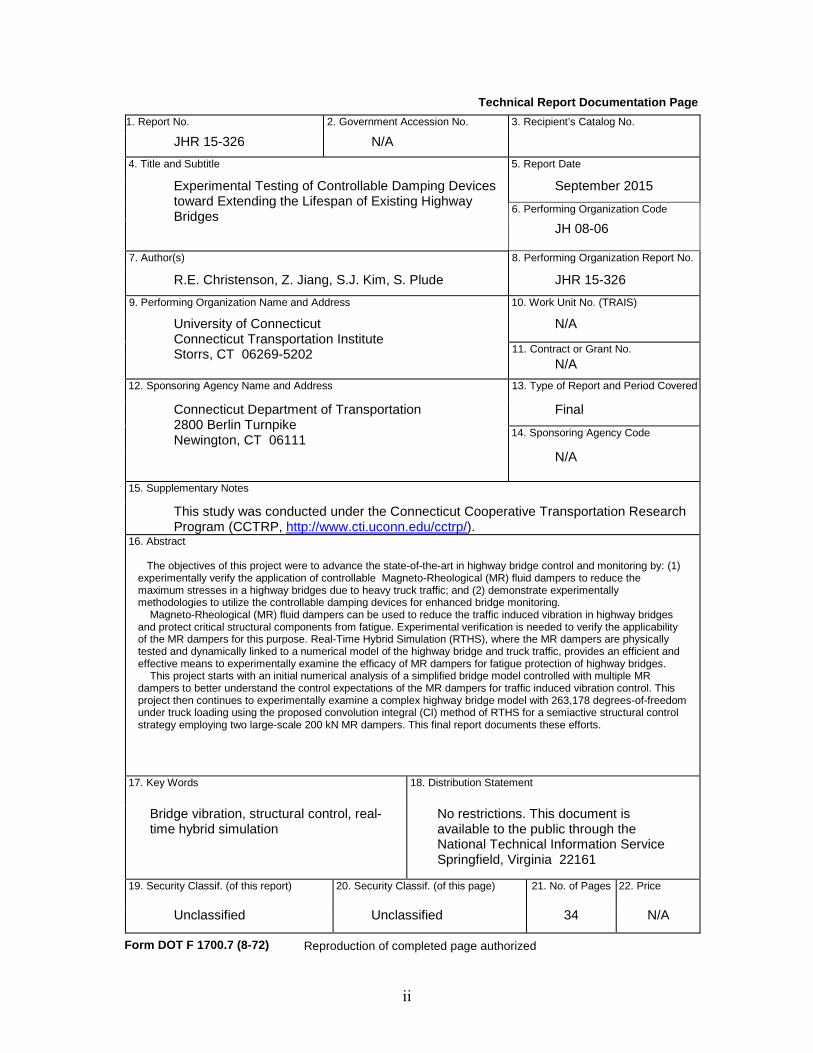
The objectives of this project were to advance the state-of-the-art in highway bridge control and monitoring by: (1) experimentally verify the application of controllable Magneto-Rheological (MR) fluid dampers to reduce the maximum stresses in a highway bridges due to heavy truck traffic; and (2) demonstrate experimentally methodologies to utilize the controllable damping devices for enhanced bridge monitoring. Magneto-Rheological (MR) fluid dampers can be used to reduce the traffic induced vibration in highway bridges and protect critical structural components from fatigue. Experimental verification is needed to verify the applicability of the MR dampers for this purpose. Real-Time Hybrid Simulation (RTHS), where the MR dampers are physically tested and dynamically linked to a numerical model of the highway bridge and truck traffic, provides an efficient and effective means to experimentally examine the efficacy of MR dampers for fatigue protection of highway bridges. This project starts with an initial numerical analysis of a simplified bridge model controlled with multiple MR dampers to better understand the control expectations of the MR dampers for traffic induced vibration control. This project then continues to experimentally examine a complex highway bridge model with 263,178 degrees-of-freedom under truck loading using the proposed convolution integral (CI) method of RTHS for a semiactive structural control strategy employing two large-scale 200 kN MR dampers. This final report documents these efforts.
17. Key Words 18. Distribution Statement
Bridge vibration, structural control, real- time hybrid simulation
No restrictions. This document is available to the public through the National Technical Information Service Springfield, Virginia 22161
19. Security Classif. (of this report) 20. Security Classif. (of this page) 21. No. of Pages 22. Price
Unclassified Unclassified 34 N/A
Technical Report Documentation Page
Form DOT F 1700.7 (8-72) Reproduction of completed page authorized

iii
ACKNOWLEDGEMENTS This research was sponsored by the Joint Highway Research Advisory Council of the University of Connecticut and the Connecticut Department of Transportation through Project 08-6. The authors gratefully acknowledge the support of this research by the National Science Foundation under grant OISE-0612663, CMS-0612661, and CMS-0830173. The authors would like to thank the Lord Corporation for their generous support of this research; J. Ricles, T. Marullo and G. Novak at the Lehigh University Network for Earthquake Engineering Simulation facility for their efforts conducting the real-time hybrid simulation tests; and E.A. Johnson and S. Wojtkiewicz for collaboration in developing the Convolution Integral method of RTHS.
iv
v
TABLE OF CONTENTS Technical Report Documentation Page ........................................................................................ ii
Acknowledgments ........................................................................................................................ iii
Modern Metric Conversion Factors ............................................................................................. iv
Table of Contents ............................................................................................................................v
List of Figures ............................................................................................................................... vi
List of Tables ................................................................................................................................ vi
1. Introduction ............................................................................................................................. 1 2. Numerical Studies ................................................................................................................... 2
2.1 Bridge Model.................................................................................................................... 2 2.2 Magneto-Rheological Fluid Damper Model .................................................................... 5 2.3 Simulation Results............................................................................................................ 8
3. Experimental Verification ..................................................................................................... 11 3.1 Formulation for RTHS using the CI Method ................................................................. 13 3.2 Prototype Structure and Components of RTHS ............................................................. 15 3.3 Truck Loading and Validation of the Numerical Model ................................................ 18 3.4 Experimental Testing and Results .................................................................................. 20
4. Conclusion ............................................................................................................................ 24 5. References ............................................................................................................................. 25

vi
LIST OF FIGURES Figure 1: Elevation View of Cromwell Bridge (Span 1 is considered in this study)...................... 2 Figure 2: Truck of Known Weight Truck Considered for Simulation Studies. .............................. 5 Figure 3. Comparison of Strain Data between Actual Testing and Model. .................................... 5 Figure 4. Large-scale Semiactive Damper Schematic. ................................................................... 6 Figure 5. Measured 200 kN MR Damper Force to 0.5 Hz Sinusoidal Displacement: (a) Low Amplitude and Peak Velocity Representative of Truck Loading on Highway Bridge; and (b) Moderate Amplitude and Peak Velocity Representative of Seismic Loading. ............................... 7 Figure 6. MR Damper Controlled Highway Bridge Configuration ................................................ 8 Figure 7. Midspan Strain due to Crossing Truck – Pure Simulation. ............................................. 9 Figure 8. MR Damper Force and Corresponding Current due to Crossing Truck ....................... 10 Figure 9. Force Output and Current Input for Semiactive Control ............................................... 10 Figure 10. Strain Range over the Length of the Bridge ................................................................ 11 Figure 11: Schematic Block Diagram for RTHS using the CI Method (Kim et al 2011). ........... 15 Figure 12. Elevation View of the Cromwell Bridge (same as Figure 1, shown again for convenience) ................................................................................................................................. 16 Figure 13. Cross Section of the Cromwell Bridge ........................................................................ 16 Figure 14. Finite Element Model of Composite Steel Girder Bridge, Span 1. ............................. 17 Figure 15. Schematic of MR Damper Locations on Girder 3 (G3), Span 1 of the Highway Bridge. ........................................................................................................................................... 18 Figure 16. Configuration of the Truck Used to Load Bridge in RTHS test.................................. 19 Figure 17. Comparison of Measured and Modeled Strain Response due to Truck Crossing. ...... 19 Figure 18. Process of RTHS using CI method. ............................................................................. 20 Figure 19. Bridge Response at Locations of North and South MR Damper under Truck Loading ......................................................................................................................................... 21 Figure 20. Bridge Response under Unit Impulse Loading - 𝐻𝑑(𝑡); (a) and (b) are due to impulse load at North; (c) and (d) are due to impulse load at South. ......................................................... 21 Figure 21. MR Damper Setup at Lehigh NEES Facility. ............................................................. 22 Figure 22. Measured Damper Forces at the Damper Coordinate ................................................. 22 Figure 23. Response Comparison at the Damper Coordinate. ...................................................... 23 Figure 24. Strain Comparison at North Damper Location. ........................................................... 24
LIST OF TABLES Table 1: Parameters of the Hyperbolic Tangent Model .................................................................. 8 Table 2: Comparison of peak displacement between RTHS-CIM and FEA - ABAQUS. ........... 23
1
1. Introduction Highway bridges are a significant and critical component of the civil infrastructure. There are
over 600,000 public highway bridges in the United States (2009 ASCE report card for America’s Infrastructure). In December 2008, ov er 72,868 (12.1%) of the total bridges in the U.S. were categorized as structurally deficient and 89,024 (14.8%) were categorized as functionally obsolete (2009 ASCE report card for America’s Infrastructure); indicating an eminent need for repair, rehabilitation, or reconstruction (Kirk and Mallet, 2007, Friedland and Small, 2003).
Repairing or replacing deficient bridges is extremely time and cost consuming and, in general, is not a r ealistic option. As such, addressing structural deficiencies of bridges safely, economically, and time efficiently so as to increase safe-life and prolong replacement is of great importance to bridge owners and the public as a whole. Reducing the dynamic response of truck traffic is a particularly promising means by which to increase the safe life of an existing highway bridge, as the fatigue life is inversely proportional to the number of cycles and the magnitude of the stress range cubed as stated in AASHTO LRFR as
𝑌 = 𝑅𝑅𝐴365𝑛(𝐴𝐷𝐷𝑇𝑆𝐿)(∆𝑓𝑒𝑓𝑓3)
(1)
where 𝑌 is the total finite fatigue life (in years), 𝑅𝑅 is the resistance factor specified for evaluation, minimum, or mean fatigue life, 𝐴 is the detail category constant, 𝐴𝐷𝐷𝑇𝑆𝐿 is the estimated number of stress range cycles per truck passage, 𝑛 is the average number of trucks per day in a single lane averaged over the fatigue life, and ∆𝑓𝑒𝑓𝑓 is the effective stress range.
Among the various ways to reduce the dynamic response and resulting stress range is structural control. Structural control shows great potential for reducing vibrations in various civil structures. Structural control devices can be classified as passive, active, or semiactive (Spencer and Sain, 1997). Semiactive devices may be more appropriate for field applications (Spencer and Nagarajaiah, 2003) since these devices offer the reliability associated with passive control devices, maintain the versatility associated with active control devices and require a low power supply.
Numerous semiactive control devices have been proposed for structural control of civil engineering structures. The Magneto-Rheological (MR) fluid damper appears to be a particularly promising type of semiactive control device (Dyke et al., 1998, Johnson et al 1998). In addition to the controllability, stability (in a bounded-input bounded-output sense), and low power requirements inherent to semiactive devices, MR fluid dampers with their large temperature operating range and relatively small device size have the added benefits of: producing large control forces at low velocities and with very little stiction; possessing a high dynamic range (the ratio between maximum force and minimum force at any given time); and having no m oving parts, thus reducing maintenance concerns and increasing the response time (compared to conventional variable-orifice dampers).
Experimental testing is critical in structural dynamics in particular to validate structural control strategies (Housner et al 1994). Full-scale experimental verification of structural control is a challenging proposition. The concept of hybrid simulation was proposed and further refined over the past four decades to provide the capability to isolate and only physically test critical components of a structure, while the rest of the structure is simulated numerically in the computer (Hakuno et al 1969, Takanashi et al 1975, Takanashi and Nakashima 1987, Mahin et al 1989, Shing et al 1996). With the continued advancement of computational technology and

2
hydraulic actuation, a real-time realization of hybrid simulation, called real-time hybrid simulation (RTHS), is now possible to capture the rate dependent characteristic of physical components (Nakashima 2001). The added benefit of RTHS is that it allows for various damper control strategies and a wide range of system parameters (e.g. length of bridge, weight and speed of truck, etc.) to be examined through the numerical model without modifying the experimental (physical) setup. The Network for Earthquake Engineering Simulation (NEES) real-time multi-directional (RTMD) earthquake simulation facility at Lehigh University (http://www.nees.lehigh.edu/) has real-time hybrid testing capabilities that was used to experimental validate the simulation results in this research. The simulated component in these hybrid tests is a highway bridge subjected to truck loading.
In this project the effectiveness of using MR damper to reduce truck induced vibration thus extending the service life of highway bridges is examined. Simulation results are conducted to identify the performance and operating conditions for the MR damper control of truck induced bridge vibration. Real-time hybrid simulations are then conducted on two large-scale 200kN MR dampers at the Lehigh NEES facility to validate the simulation results and demonstrate the ability for this class of semiactive damper to extend the lifespan of existing highway bridges by reducing the stress range resulting from truck traffic.
2. Numerical Studies
In order to examine the performance of the MR dampers in reducing the truck induce vibrations, models of the bridge and MR dampers are needed. In this section, the models used in this research are described in details.
2.1 Bridge Model
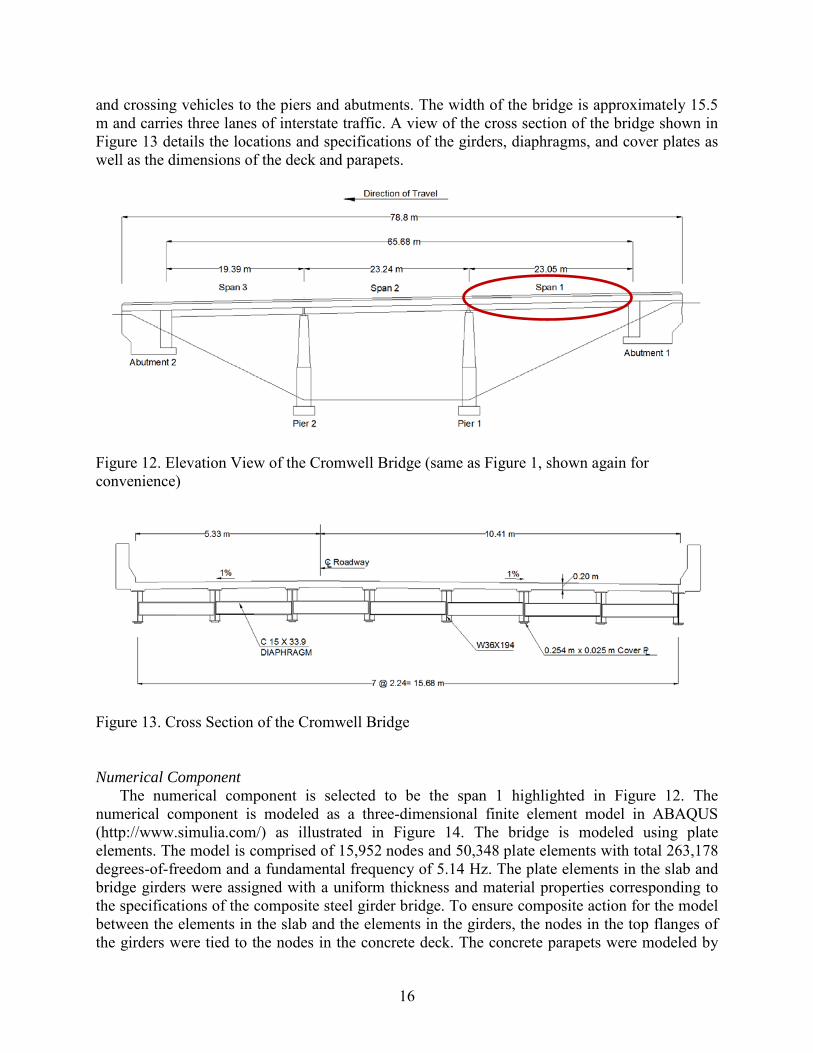
The bridge model represents a t ypical highway bridge and is based on an actual in service highway bridge in Connecticut – Cromwell Bridge (National Bridge Inventory, NBI, number: 03078). The bridge is located in the southbound direction of Interstate 91 in Connecticut near the town of the Cromwell. It is a simply supported composite, steel girder and concrete slab, bridge, 65.68 m in length with three simply supported spans of lengths 23.05 m, 23.24 m, and 19.39 m. The width of the bridge is approximately 15.5 m and it carries three lanes of traffic. Figure 1 shows an elevation view of the Cromwell Bridge identifying the span selected for control in this study.
Figure 1: Elevation View of Cromwell Bridge (Span 1 is considered in this study).
3
A low order model of the bridge capturing the salient features of the vertical bridge dynamics is developed to facilitate the control design and real-time hybrid implementation of the system. Span 1 of the Cromwell Bridge is modeled, as this span of the bridge has been the subject of a long term monitoring project since 2004 and data is available to validate the bridge model. The first span of the bridge can be assumed as its own entity because of the structural constituents, essentially pinned-roller end conditions. The span of the bridge is modeled as a simply supported Euler-Bernoulli beam (Clough and Penzien, 1993). The simplified beam model is assumed to have a constant cross-section and material properties (e.g. modulus of elasticity, mass per unit length and moment of inertia) along its length as determined from the structural plans. The inputs of the system are vertical point loads representing a v ehicle traveling across the bridge. The vehicle loading representing a Federal Highway Administration (FHWA) Class 9 five axle truck traveling at a constant speed is modeled as a time and spatially varying load, 𝐹𝑡(𝑥, 𝑡). The vehicle dynamics are neglected for simplicity. The equation of motion governing the dynamic behavior of the undamped bridge model with applied truck and control device forces is presented as the partial differential equation
𝑚 𝜕2𝑦(𝑥,𝑡)𝜕𝑡2
+ 𝐸𝐼 𝜕4𝑦(𝑥,𝑡)𝜕𝑥4
= 𝐹𝑡(𝑥, 𝑡) + ∑ 𝐹𝑐𝑗(𝑡)𝑁
𝑗=1 𝛿(𝑥 − 𝑗) (2)
where 𝑦(𝑥, 𝑡) is the vertical displacement of the bridge; cF term is the control force provided by the MR damper which is a function of the length of the bridge, 𝑥, the location of the damper, 𝑗, and time, 𝑡; 𝛿(∙) is the Dirac delta function; 𝑁 is the number of forces associated with the dampers; 𝑚 is the mass per unit length of the bridge; 𝐸 is the modulus of elasticity; and 𝐼 is the moment of inertia for the composite cross section of the bridge; The mass per unit length, 𝑚 , calculated as the product of the cross section area and the appropriate material mass density, is determined to be 11.7 × 10³ kg/m. The modulus of elasticity, 𝐸, is selected as the modulus of elasticity of steel 2 × 10⁸ kPa. The moment of inertia, 𝐼, is calculated using effective areas for the concrete components of the cross section (Beer et al., 2006) to be 0.156074 m4.
The partial differential equation of motion for the bridge model system in Equation (2) can be written as an ordinary differential equation using a Galerkin method. The equation of motion can be rewritten as
𝑚Φ(𝑥)(𝑡) + 𝐸𝐼Φ""(𝑥)Q(𝑡) = 𝐹𝑡(𝑥, 𝑡) + ∑ 𝐹𝑐𝑗(𝑡)𝑁
𝑗=1 𝛿(𝑥 − 𝑗) (3)
where [∙] indicates a derivative with respect to time, 𝑡, and [′] indicates a derivative with respect to length, 𝑥. The modal equation of motion governing the dynamic behavior of the bridge model with applied truck and damper forces is determine by pre-multiplying Equation (3) by Φ𝑇(𝑥) and integrating over the length of the bridge such that
𝑀(𝑡) + 𝐾Q(𝑡) = 𝐹𝑡(𝑡) + 𝐹𝑐(𝑡) (4)
where 𝑀 = 𝑚 ∫ Φ𝑇(𝑥)Φ(𝑥)𝜕𝑥𝐿0 ,𝐾 = 𝐸𝐼 ∫ (Φ"𝑇(𝑥))(Φ"(𝑥))𝜕𝑥𝐿
0 , 𝐹𝑡(𝑡) = ∫ Φ𝑇(𝑥)𝐹𝑡(𝑥, 𝑡)𝜕𝑥𝐿0
and 𝐹𝑐(𝑡) = ∑ Φ𝑇𝑗𝐹𝑐𝑗(𝑡)𝑁
𝑗=1 . Inherent damping is added to the bridge model as modal damping where the damping coefficient matrix, 𝐶, is
𝐶 = Φ(𝑥)𝐶Φ(𝑥)−1 (5)
4
and Φ(𝑥) is the matrix of mode shapes obtained by solving the eigenvalue problem with 𝑀 and 𝐾, 𝐶 is the diagonal modal damping matrix with the jth diagonal term 𝐶 = 2𝑀𝑗𝜔𝑗𝜁𝑗, where 𝑀 = Φ(𝑥)−1𝑀Φ(𝑥) (and 𝑀𝑗 is the jth diagonal term), 𝜔𝑗 is the natural frequency of the jth mode, and 𝜁𝑗 is the damping ratio of the jth mode which is set equal to 5% in each mode based on recent field observations of the bridge. The resulting damped equation of motion governing the dynamic behavior of the bridge is
𝑀(𝑡) + 𝐶(𝑡) + 𝐾Q(𝑡) = 𝐹𝑡(𝑡) + 𝐹𝑐(𝑡) (6)
The truck force vector, 𝐹𝑡(𝑥, 𝑡), simulates a F HWA Class 9 five axle truck crossing the bridge at a constant speed. The force of each axle is assumed to be of constant magnitude, thus neglecting the vehicle dynamics, but its location varies with respect to time. The truck load is represented in the model as five transverse point loads moving along the length of the bridge at a constant speed of 29 m/sec (65mph). The truck force vector is comprised of two components; a loading vector and a magnitude coefficient such that
𝐹𝑡(𝑥, 𝑡) = 𝑊𝑡Γ𝑡(𝑥, 𝑡) (7)
where the loading vector, Γ𝑡, designates the location along the length of the bridge of each of the 5 point loads at each time step, as well as the relative weight of each axle and 𝑊𝑡 is the total weight of the truck. The loading vector varies according to the selected truck speed, 𝑡, the relative weight of each axial, 𝜆𝑘, as a percent of the gross vehicle weight of the truck, 𝑊𝑡, and the distance between the first axle and subsequent axles, 𝑑𝑘. The loading vector takes the form
Γ𝑡(𝑥, 𝑡) = ∑ 𝜆𝑘5𝑘=1 𝛿(𝑥 + 𝑑𝑘 − 𝑡𝑡) (8)
The corresponding modal truck force, written in terms of Equation (7), Equation (8), and 𝐹𝑡(𝑡) = ∫ Φ𝑇(𝑥)𝐹𝑡(𝑥, 𝑡)𝑑𝑥𝐿
0 , to be used in Equation (6) is
𝐹𝑡(𝑡) = 𝑊𝑡 ∑ 𝜆𝑘5𝑘=1 Φ𝑇(𝑡𝑡 − 𝑑𝑘) 𝑓𝑜𝑟 𝑑𝑘/𝑡 ≤ 𝑡 ≤ (𝐿 + 𝑑𝑘)/𝑡
0 𝑜𝑡ℎ𝑒𝑟𝑤𝑖𝑠𝑒 (9)
The numerical model of the bridge with truck loading is validated using experimental strain data from the Cromwell Bridge monitoring efforts. A known weight truck was driven across the Cromwell Bridge and corresponding strain data was collected. This actual data is compared to data from the bridge model with no control force. Figure 2 shows the specifications of the known weight truck. The total weight of the truck is 𝑊𝑡 = 275 kN. The relative weight of each axial is 𝜆1 = 0.17, 𝜆2 = 0.22, 𝜆3 = 0.21, 𝜆4 = 0.20, and 𝜆5 = 0.19. The distance between the first axel and subsequent axels, 𝑑1 = 0, 𝑑1 = 5.31 m, 𝑑3 = 6.63 m, 𝑑4 = 15.70 m, and 𝑑5 = 17.02 m. The truck is assumed to travel over the bridge at a constant velocity of 29 m/sec (65 mph).
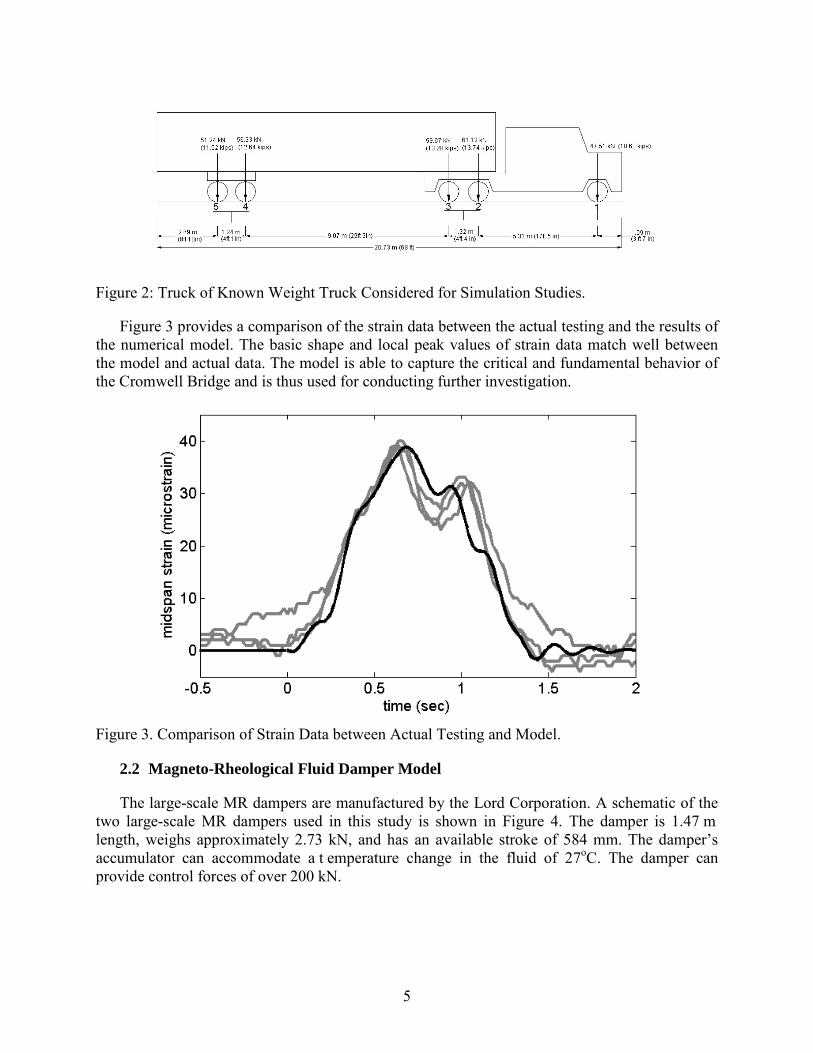
5
Figure 2: Truck of Known Weight Truck Considered for Simulation Studies.
Figure 3 provides a comparison of the strain data between the actual testing and the results of the numerical model. The basic shape and local peak values of strain data match well between the model and actual data. The model is able to capture the critical and fundamental behavior of the Cromwell Bridge and is thus used for conducting further investigation.
Figure 3. Comparison of Strain Data between Actual Testing and Model.
2.2 Magneto-Rheological Fluid Damper Model
The large-scale MR dampers are manufactured by the Lord Corporation. A schematic of the two large-scale MR dampers used in this study is shown in Figure 4. The damper is 1.47 m length, weighs approximately 2.73 kN, and has an available stroke of 584 mm. The damper’s accumulator can accommodate a t emperature change in the fluid of 27oC. The damper can provide control forces of over 200 kN.
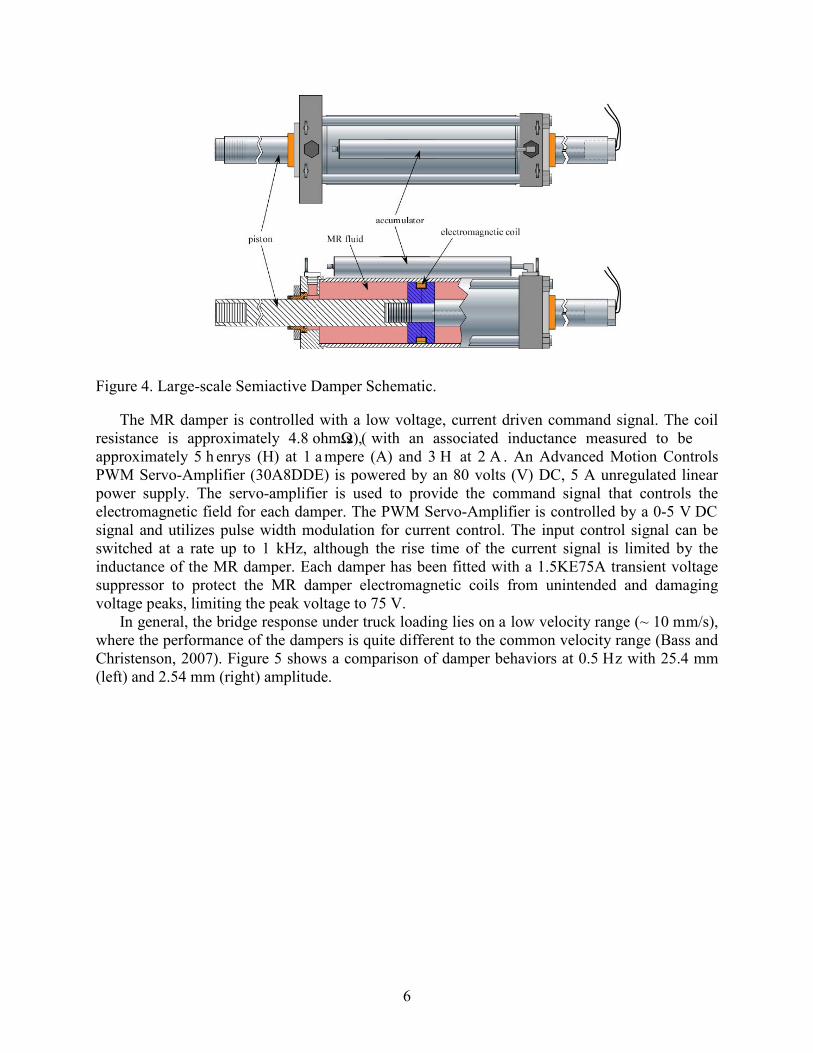
6
Figure 4. Large-scale Semiactive Damper Schematic.
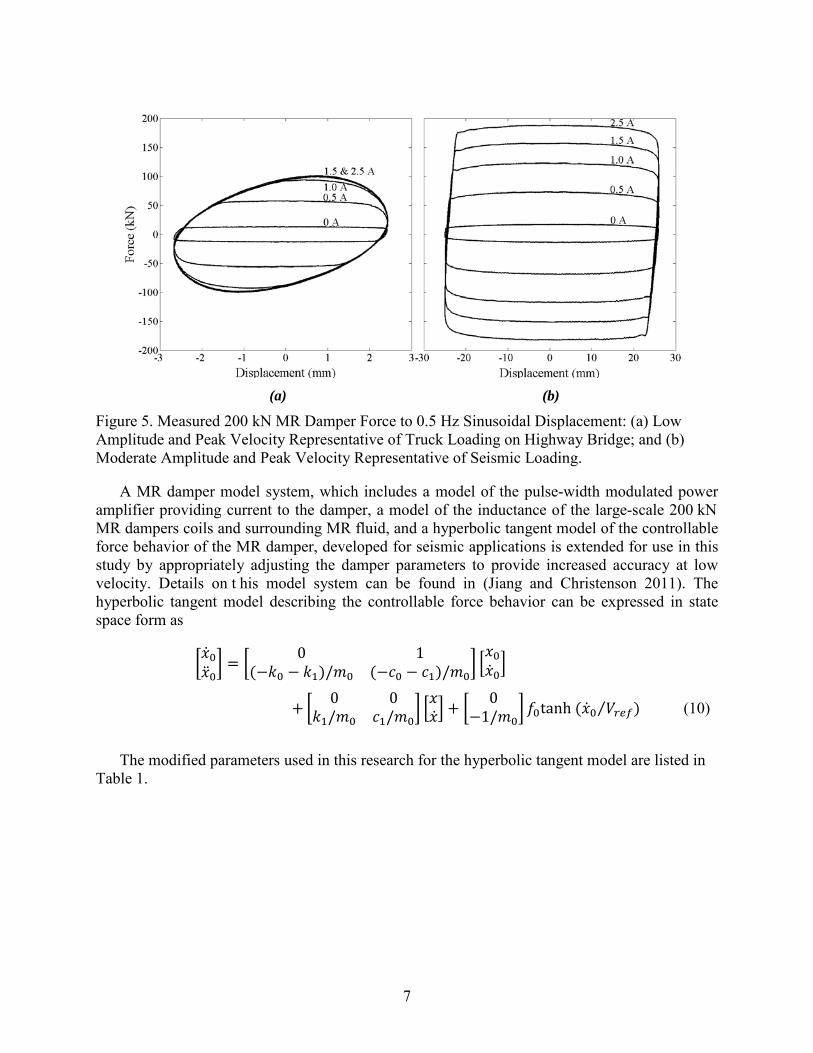
The MR damper is controlled with a low voltage, current driven command signal. The coil resistance is approximately 4.8 ohm s (Ω), with an associated inductance measured to be approximately 5 h enrys (H) at 1 a mpere (A) and 3 H at 2 A . An Advanced Motion Controls PWM Servo-Amplifier (30A8DDE) is powered by an 80 volts (V) DC, 5 A unregulated linear power supply. The servo-amplifier is used to provide the command signal that controls the electromagnetic field for each damper. The PWM Servo-Amplifier is controlled by a 0-5 V DC signal and utilizes pulse width modulation for current control. The input control signal can be switched at a rate up to 1 kHz, although the rise time of the current signal is limited by the inductance of the MR damper. Each damper has been fitted with a 1.5KE75A transient voltage suppressor to protect the MR damper electromagnetic coils from unintended and damaging voltage peaks, limiting the peak voltage to 75 V.
In general, the bridge response under truck loading lies on a low velocity range (~ 10 mm/s), where the performance of the dampers is quite different to the common velocity range (Bass and Christenson, 2007). Figure 5 shows a comparison of damper behaviors at 0.5 Hz with 25.4 mm (left) and 2.54 mm (right) amplitude.
7
(a) (b)
Figure 5. Measured 200 kN MR Damper Force to 0.5 Hz Sinusoidal Displacement: (a) Low Amplitude and Peak Velocity Representative of Truck Loading on Highway Bridge; and (b) Moderate Amplitude and Peak Velocity Representative of Seismic Loading.
A MR damper model system, which includes a model of the pulse-width modulated power amplifier providing current to the damper, a model of the inductance of the large-scale 200 kN MR dampers coils and surrounding MR fluid, and a hyperbolic tangent model of the controllable force behavior of the MR damper, developed for seismic applications is extended for use in this study by appropriately adjusting the damper parameters to provide increased accuracy at low velocity. Details on t his model system can be found in (Jiang and Christenson 2011). The hyperbolic tangent model describing the controllable force behavior can be expressed in state space form as
00 = 0 1
(−𝑘0 − 𝑘1)/𝑚0 (−𝑐0 − 𝑐1)/𝑚0 𝑥00
+ 0 0𝑘1/𝑚0 𝑐1/𝑚0
𝑥 + 0−1/𝑚0
𝑓0tanh (0 𝑉𝑟𝑒𝑓⁄ ) (10)
The modified parameters used in this research for the hyperbolic tangent model are listed in Table 1.
8
Table 1. Parameters of the Hyperbolic Tangent Model
Parameters as a function of damper current, 𝑖 (A) Units 𝑘0 = (0.10𝑖4 − 1.00𝑖3 + 1.30𝑖2 + 2.30𝑖 + 6.20) × 10−4 𝑘𝑁/𝑚𝑚 𝑘1 = −0.24𝑖4 + 2.38𝑖3 − 8.07𝑖2 + 11.06𝑖 + 60 𝑘𝑁/𝑚𝑚 𝑐0 = (−0.98𝑖4 + 9.33𝑖3 − 29.96𝑖2 + 35.80𝑖 + 12.64) × 10−2 𝑘𝑁 ∙ 𝑠/𝑚𝑚 𝑐1 = (0.62𝑖4 − 6.73𝑖3 + 26.69𝑖2 − 46.06𝑖 + 35.67) × 10−2 𝑘𝑁 ∙ 𝑠/𝑚𝑚 𝑚0 = (0.16𝑖4 − 1.62𝑖3 + 5.48𝑖2 − 7.05𝑖 + 4.85) × 10−3 𝑘𝑔 𝑓0 = 2.24𝑖4 − 15.12𝑖3 + 4.12𝑖2 + 139.34𝑖 + 7.5 𝑘𝑁 𝑉𝑟𝑒𝑓 = −0.11𝑖4 + 1.23𝑖3 − 5.57𝑖2 + 11.79𝑖 + 0.76 𝑚𝑚/𝑠
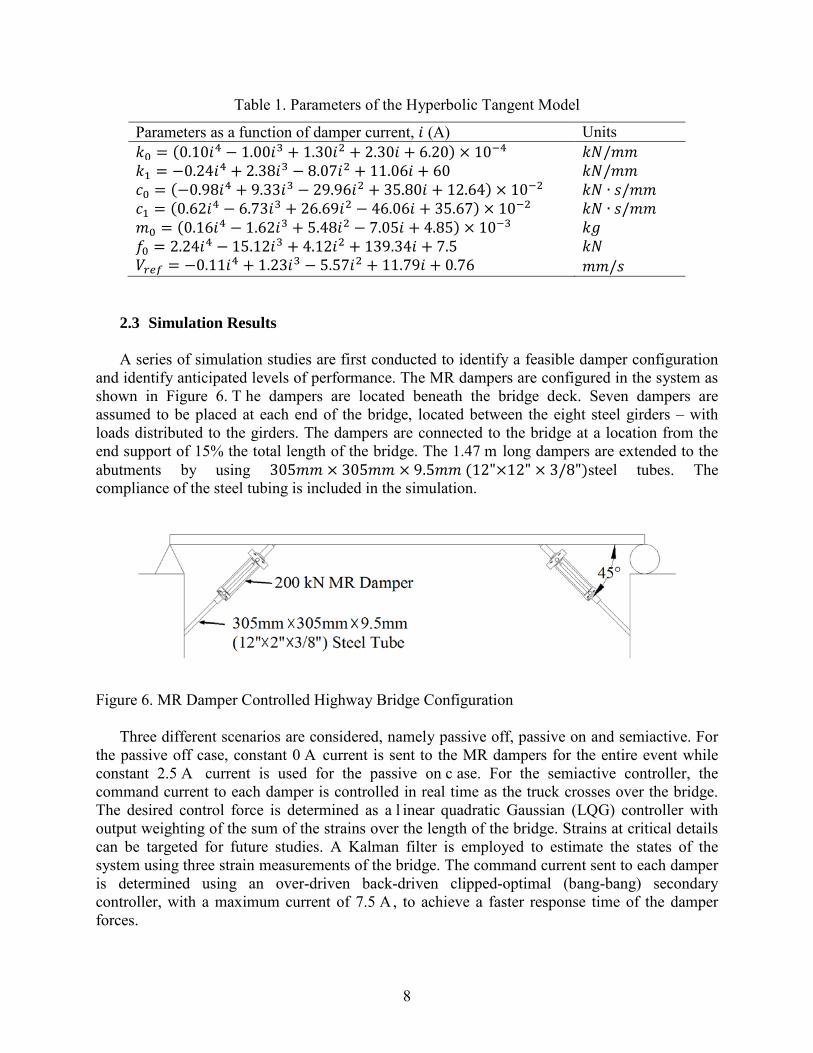
2.3 Simulation Results A series of simulation studies are first conducted to identify a feasible damper configuration
and identify anticipated levels of performance. The MR dampers are configured in the system as shown in Figure 6. T he dampers are located beneath the bridge deck. Seven dampers are assumed to be placed at each end of the bridge, located between the eight steel girders – with loads distributed to the girders. The dampers are connected to the bridge at a location from the end support of 15% the total length of the bridge. The 1.47 m long dampers are extended to the abutments by using 305𝑚𝑚 × 305𝑚𝑚 × 9.5𝑚𝑚 (12"×12" × 3/8")steel tubes. The compliance of the steel tubing is included in the simulation.
Figure 6. MR Damper Controlled Highway Bridge Configuration
Three different scenarios are considered, namely passive off, passive on and semiactive. For
the passive off case, constant 0 A current is sent to the MR dampers for the entire event while constant 2.5 A current is used for the passive on c ase. For the semiactive controller, the command current to each damper is controlled in real time as the truck crosses over the bridge. The desired control force is determined as a l inear quadratic Gaussian (LQG) controller with output weighting of the sum of the strains over the length of the bridge. Strains at critical details can be targeted for future studies. A Kalman filter is employed to estimate the states of the system using three strain measurements of the bridge. The command current sent to each damper is determined using an over-driven back-driven clipped-optimal (bang-bang) secondary controller, with a maximum current of 7.5 A , to achieve a faster response time of the damper forces.
9
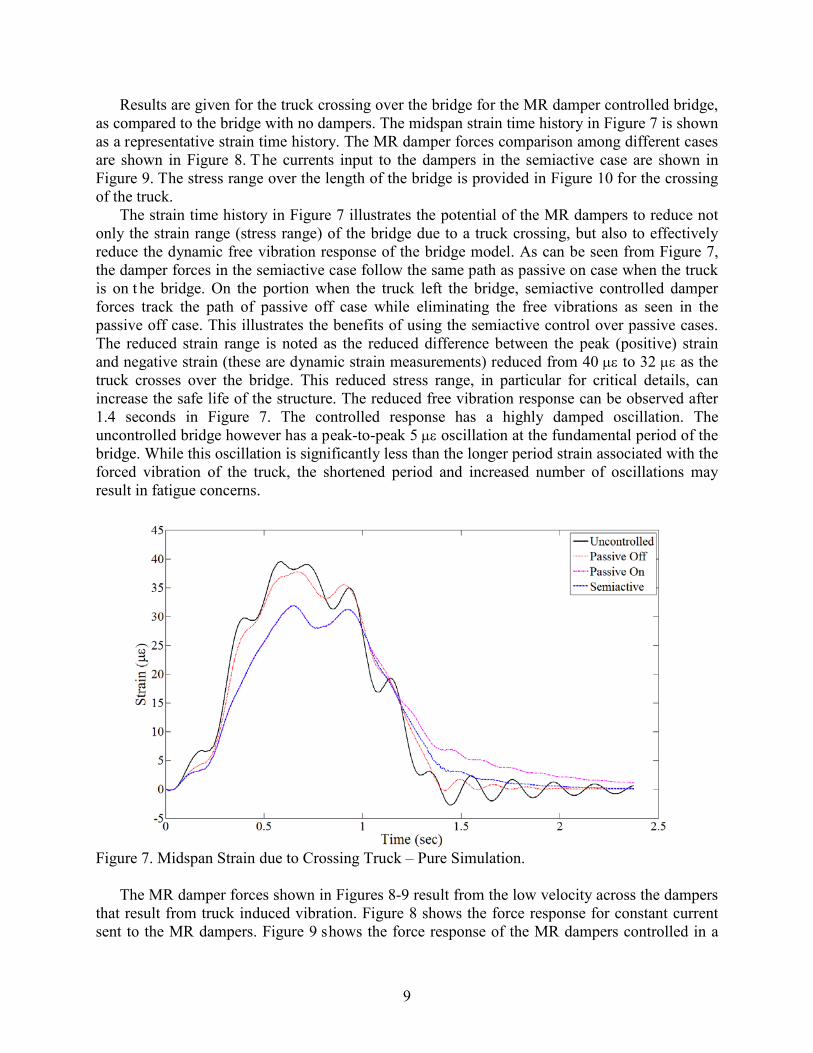
Results are given for the truck crossing over the bridge for the MR damper controlled bridge, as compared to the bridge with no dampers. The midspan strain time history in Figure 7 is shown as a representative strain time history. The MR damper forces comparison among different cases are shown in Figure 8. The currents input to the dampers in the semiactive case are shown in Figure 9. The stress range over the length of the bridge is provided in Figure 10 for the crossing of the truck.
The strain time history in Figure 7 illustrates the potential of the MR dampers to reduce not only the strain range (stress range) of the bridge due to a truck crossing, but also to effectively reduce the dynamic free vibration response of the bridge model. As can be seen from Figure 7, the damper forces in the semiactive case follow the same path as passive on case when the truck is on t he bridge. On the portion when the truck left the bridge, semiactive controlled damper forces track the path of passive off case while eliminating the free vibrations as seen in the passive off case. This illustrates the benefits of using the semiactive control over passive cases. The reduced strain range is noted as the reduced difference between the peak (positive) strain and negative strain (these are dynamic strain measurements) reduced from 40 µε to 32 µε as the truck crosses over the bridge. This reduced stress range, in particular for critical details, can increase the safe life of the structure. The reduced free vibration response can be observed after 1.4 seconds in Figure 7. The controlled response has a highly damped oscillation. The uncontrolled bridge however has a peak-to-peak 5 µε oscillation at the fundamental period of the bridge. While this oscillation is significantly less than the longer period strain associated with the forced vibration of the truck, the shortened period and increased number of oscillations may result in fatigue concerns.
Figure 7. Midspan Strain due to Crossing Truck – Pure Simulation.
The MR damper forces shown in Figures 8-9 result from the low velocity across the dampers
that result from truck induced vibration. Figure 8 shows the force response for constant current sent to the MR dampers. Figure 9 shows the force response of the MR dampers controlled in a

10
semiactive control strategy. Also shown in this figure are the command currents sent to each damper. These resulting MR damper forces, while significantly less than the 200 kN capacity of the MR dampers, provide adequate performance for the bridge system. The command currents for the dampers are observed to be turned off at approximately 1 sec, which is the approximate time that the truck begins to unload from the bridge. In this manner the MR dampers that were restricting the downward deflection of the bridge are allowing the bridge to return to the undeflected shape without restraint.
Figure 8. MR Damper Force and Corresponding Current due to Crossing Truck
Figure 9. Force Output and Current Input for Semiactive Control

11
The strain range from the crossing truck plotted over the length of the bridge is shown in
Figure 10. The maximum strain range (over the length of the bridge) can be reduced using the MR damper control strategy from 45 µε to 33 µε, a 27% reduction in strain. This level of response reduction is very promising for fatigue purposes. The simplified bridge model employed is this section of the report is sufficient to allow for simulations to observe and verify the applicability of the performance of the large-scale MR dampers. From these simulation studies it is determined that the MR dampers will provide sufficient control for the truck induced bridge vibration. Further experimental verification is warranted. These further experimental tests will consider a more detailed bridge model.
Figure 10. Strain Range over the Length of the Bridge
3. Experimental Verification
Experimental verification is critical in structural dynamics and control (Housner et al 1994). Full-scale experimental testing of structural dynamics and control can be a ch allenging proposition due to the size-scale and cost of the experiment. The concept of hybrid simulation has been proposed and further refined over the past several decades to provide a means to isolate the critical components of a structure and test them physically, while the rest of the structure is simulated numerically (Hakuno et al 1969, Takanashi 1975, T akanashi and Nakashima 1987, Mahin et al 1989, Shing et al 1996). In hybrid simulation, the system to be tested is partitioned into numerical and physical components (Takanashi et al 1975). The numerical component typically provides the displacement needed to be enforced on the physical specimen. The resulting measured force response of the physical component is fed back into the numerical component. In such a manner, the complex behaviors of interest can be isolated and physically tested while the dynamic behavior of and interaction with the entire structural system are fully captured. Real-time hybrid simulation (RTHS) is a relatively new method of testing which is

12
made more feasible by the recent advances in computing power, digital signal processing, and hydraulic control. In RTHS, the physical component is tested in hard real time such that any rate dependencies of the physical component are fully captured. In RTHS, it is necessary to perform all of the calculations, apply the displacements, and measure and feedback the forces within a single time step (typically less than 10 ms). A relatively small time step is required for RHTS to ensure convergence in the simulation and maintain accurate velocity tracking in the experiment. Typical numerical integration time steps for RTHS are often selected to be a multiple of the sampling time of the digital servo-controller, e.g. 1/1024 seconds, based on s tability and accuracy (Chen and Ricles 2009). The time required to integrate the equations of motion across an individual time step must be less than the time step itself. This computing time can become large, especially for complex models with numerous degrees-of-freedoms. Therefore, the size and complexity of the numerical component in traditional RTHS is limited.
Magneto-Rheological (MR) fluid dampers are a promising type of structural control device that have been studied extensively using RTHS. Various RTHS tests have been conducted with MR dampers. Emmons and Christenson (2006) and Christenson et al (2008) examined the seismic performance of a numerical 3-story steel frame structure with three physical 200 kN MR dampers located between each of the stories in RTHS tests at the University of Colorado at Boulder Network for Earthquake Engineering Simulation (NEES) facility. These tests used a 33 degree-of-freedom (DOF) model of the building. The 200 kN MR dampers were manufactured by the Lord Corporation and have been used in subsequent RTHS tests at the University of Illinois at Urbana-Champaign and the Lehigh University NEES facility. Wu et al (2006) conducted RTHS of a numerical model of an offshore platform with MR dampers for protection from both earthquake and ice loading. The model of the offshore platform was an 8-DOF system. Fujitani et al (2008) examine the use of 10 kN MR dampers for smart base isolation, comparing results to actual shake table tests. Lin and Christenson (2011) compared shake table tests of a 2 kN MR damper in a 2-story building frame to RTHS tests with the physical MR damper and numerical simplified building model. The RTHS facility at the University of Illinois at Urbana-Champaign, Smart Structures Technology Laboratory (SSTL) has been used to test MR dampers. Carrion and Spencer (2007) conducted an extensive study of various issues associated with RTHS by using a 3 kN MR damper and single-degree-of-freedom (SDOF) structure. Zapateiro et al (2010) examined a 3-story building with a 3kN MR damper at the first story, and proposed and tested in RTHS the quantitative feedback theory (QTF) control technique for the MR dampers. These tests utilized a 3-DOF building model at the SSTL at the University of Illinois at Urbana-Champaign, SSTL. More recent RTHS tests at the SSTL (Phillips and Spencer, 2010; Phillips et al 2010) have used a 200 kN MR damper for RTHS. The 200 kN MR dampers have been used in RTHS tests at the Lehigh NEES facility as well (Chen et al 2010). In a recent NEES project (PI S.J. Dyke), numerous RTHS studies were conducted using the 200 kN MR dampers (Jiang and Christenson 2011; Friedman 2012; Phillips and Spencer 2013; Cha et al 2013; and Chae et al 2013). These RTHS tests have been restricted, at some level, by the size and complexity of the numerical model of the structure.
In a previous study (Kim et al 2011), a new approach to RTHS was proposed employing the convolution integral (CI) method to specifically address the challenges of the size and convergence of high frequency behavior of the numerical model. The CI method for RTHS of a simple two-story building model with a small-scale 2 kN MR damper was validated in the previous study comparing the CI results to a traditional numerical time stepping approach. In this project, RTHS using a finite element model of a highway bridge with 263,178 de grees-of-
13
freedom as numerical component and two MR dampers as physical component is conducted by utilizing the CI method. The RTHS tests are conducted at the Lehigh University NEES facility to explore the use of semiactive control devices to reduce fatigue of highway bridges due to truck traffic. The results demonstrate the applicability of the CI method to RTHS with large and complex numerical components and provide an efficient and effective means to experimentally examine the efficacy of MR dampers for fatigue protection of highway bridges.
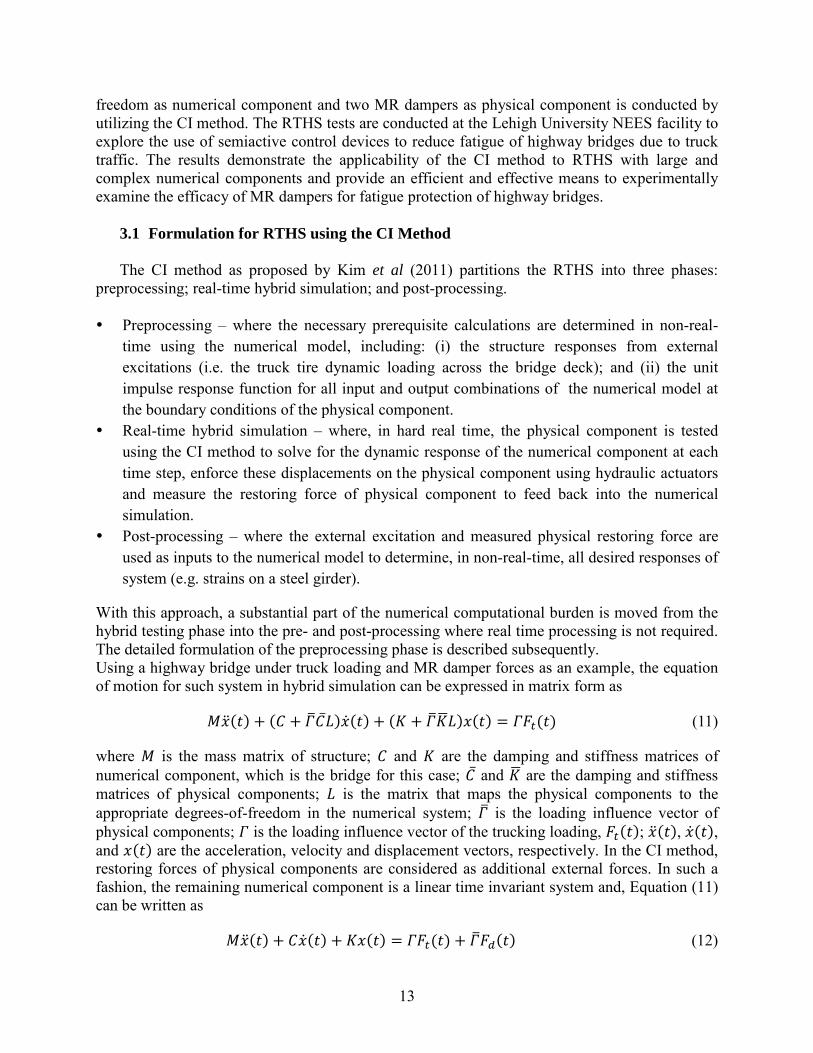
3.1 Formulation for RTHS using the CI Method
The CI method as proposed by Kim et al (2011) partitions the RTHS into three phases:
preprocessing; real-time hybrid simulation; and post-processing.
Preprocessing – where the necessary prerequisite calculations are determined in non-real-time using the numerical model, including: (i) the structure responses from external excitations (i.e. the truck tire dynamic loading across the bridge deck); and (ii) the unit impulse response function for all input and output combinations of the numerical model at the boundary conditions of the physical component.
Real-time hybrid simulation – where, in hard real time, the physical component is tested using the CI method to solve for the dynamic response of the numerical component at each time step, enforce these displacements on the physical component using hydraulic actuators and measure the restoring force of physical component to feed back into the numerical simulation.
Post-processing – where the external excitation and measured physical restoring force are used as inputs to the numerical model to determine, in non-real-time, all desired responses of system (e.g. strains on a steel girder).
With this approach, a substantial part of the numerical computational burden is moved from the hybrid testing phase into the pre- and post-processing where real time processing is not required. The detailed formulation of the preprocessing phase is described subsequently. Using a highway bridge under truck loading and MR damper forces as an example, the equation of motion for such system in hybrid simulation can be expressed in matrix form as
𝑀(𝑡) + (𝐶 + 𝛤𝐶𝐿)(𝑡) + (𝐾 + 𝛤𝐾𝐿)𝑥(𝑡) = 𝛤𝐹𝑡(𝑡) (11)
where 𝑀 is the mass matrix of structure; 𝐶 and 𝐾 are the damping and stiffness matrices of numerical component, which is the bridge for this case; 𝐶 and 𝐾 are the damping and stiffness matrices of physical components; 𝐿 is the matrix that maps the physical components to the appropriate degrees-of-freedom in the numerical system; 𝛤 is the loading influence vector of physical components; 𝛤 is the loading influence vector of the trucking loading, 𝐹𝑡(𝑡); (𝑡), (𝑡), and 𝑥(𝑡) are the acceleration, velocity and displacement vectors, respectively. In the CI method, restoring forces of physical components are considered as additional external forces. In such a fashion, the remaining numerical component is a linear time invariant system and, Equation (11) can be written as
𝑀(𝑡) + 𝐶(𝑡) + 𝐾𝑥(𝑡) = 𝛤𝐹𝑡(𝑡) + 𝛤𝐹𝑑(𝑡) (12)
14
where the physical components of the hybrid simulation are represented completely in 𝐹𝑑(𝑡), such that 𝐹𝑑(𝑡) = −𝐶𝐿(𝑡) − 𝐾𝐿𝑥(𝑡) in Equation (12). Note that if there is physical mass, it can be treated in a similar fashion to the stiffness and damping. For this specific formulation, the MR damper force vector 𝐹𝑑(𝑡) is not a linear function of 𝐶 and 𝐾 but is a highly nonlinear function of (𝑡), and 𝑥(𝑡) as well as other time varying parameters such as command current and coil inductance. At this time, the MR damper force vector 𝐹𝑑(𝑡) is simply denoted at time varying and necessary inputs will be provided in the RTHS.
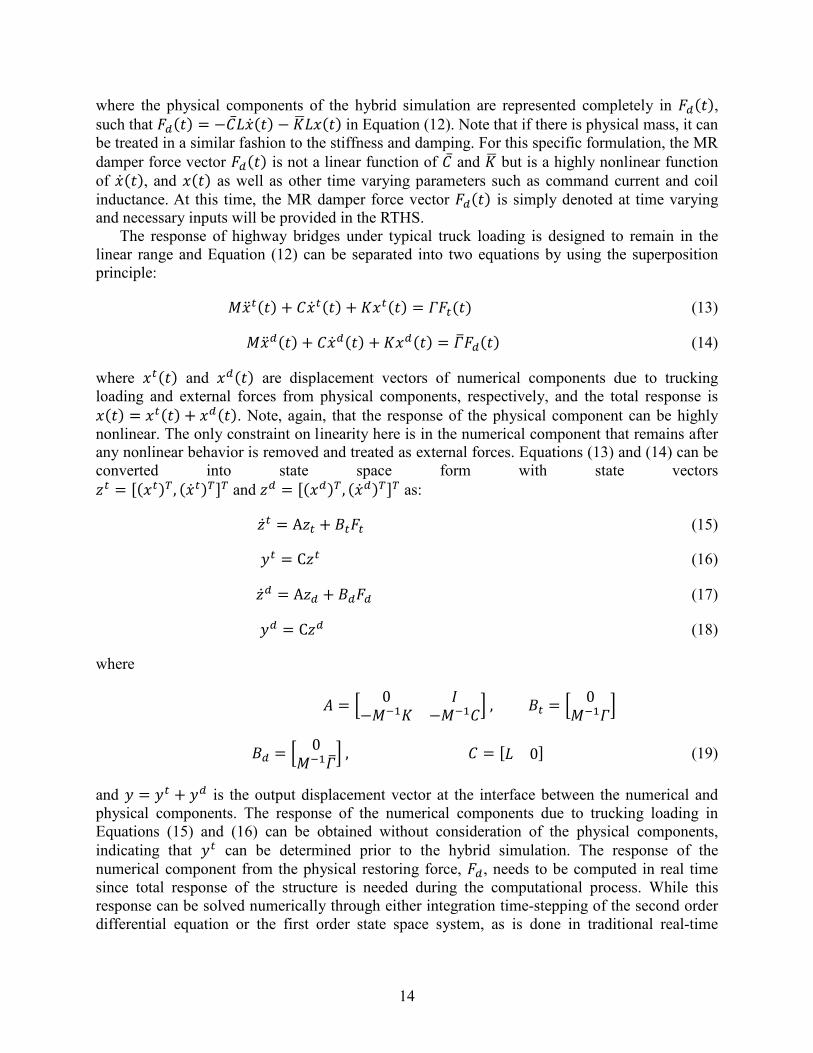
The response of highway bridges under typical truck loading is designed to remain in the linear range and Equation (12) can be separated into two equations by using the superposition principle:
𝑀𝑡(𝑡) + 𝐶𝑡(𝑡) + 𝐾𝑥𝑡(𝑡) = 𝛤𝐹𝑡(𝑡) (13)
𝑀𝑑(𝑡) + 𝐶𝑑(𝑡) + 𝐾𝑥𝑑(𝑡) = 𝛤𝐹𝑑(𝑡) (14)
where 𝑥𝑡(𝑡) and 𝑥𝑑(𝑡) are displacement vectors of numerical components due to trucking loading and external forces from physical components, respectively, and the total response is 𝑥(𝑡) = 𝑥𝑡(𝑡) + 𝑥𝑑(𝑡). Note, again, that the response of the physical component can be highly nonlinear. The only constraint on linearity here is in the numerical component that remains after any nonlinear behavior is removed and treated as external forces. Equations (13) and (14) can be converted into state space form with state vectors 𝑧𝑡 = [(𝑥𝑡)𝑇 , (𝑡)𝑇]𝑇 and 𝑧𝑑 = [(𝑥𝑑)𝑇 , (𝑑)𝑇]𝑇 as:
𝑡 = A𝑧𝑡 + 𝐵𝑡𝐹𝑡 (15)
𝑦𝑡 = C𝑧𝑡 (16)
𝑑 = A𝑧𝑑 + 𝐵𝑑𝐹𝑑 (17)
𝑦𝑑 = C𝑧𝑑 (18)
where
𝐴 = 0 𝐼−𝑀−1𝐾 −𝑀−1𝐶 , 𝐵𝑡 = 0
𝑀−1𝛤
𝐵𝑑 = 0𝑀−1𝛤 , 𝐶 = [𝐿 0] (19)
and 𝑦 = 𝑦𝑡 + 𝑦𝑑 is the output displacement vector at the interface between the numerical and physical components. The response of the numerical components due to trucking loading in Equations (15) and (16) can be obtained without consideration of the physical components, indicating that 𝑦𝑡 can be determined prior to the hybrid simulation. The response of the numerical component from the physical restoring force, 𝐹𝑑, needs to be computed in real time since total response of the structure is needed during the computational process. While this response can be solved numerically through either integration time-stepping of the second order differential equation or the first order state space system, as is done in traditional real-time
15
hybrid simulation, there is an advantage to obtain the response by using the convolution integral such that
𝑦𝑑(𝑡) = ∫ 𝐻𝑑(𝑡 − 𝜏)𝐹𝑑(𝜏)𝑑𝜏𝑡0 (20)
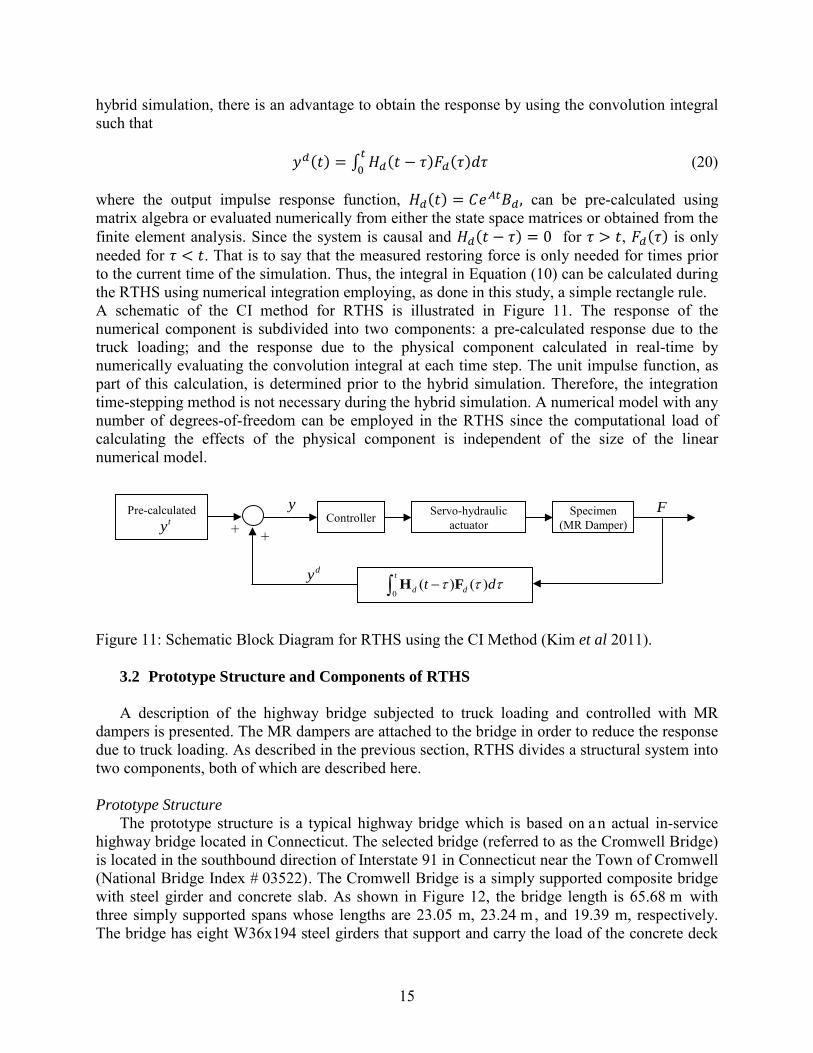
where the output impulse response function, 𝐻𝑑(𝑡) = 𝐶𝑒𝐴𝑡𝐵𝑑, can be pre-calculated using matrix algebra or evaluated numerically from either the state space matrices or obtained from the finite element analysis. Since the system is causal and 𝐻𝑑(𝑡 − 𝜏) = 0 for 𝜏 > 𝑡, 𝐹𝑑(𝜏) is only needed for 𝜏 < 𝑡. That is to say that the measured restoring force is only needed for times prior to the current time of the simulation. Thus, the integral in Equation (10) can be calculated during the RTHS using numerical integration employing, as done in this study, a simple rectangle rule. A schematic of the CI method for RTHS is illustrated in Figure 11. The response of the numerical component is subdivided into two components: a pre-calculated response due to the truck loading; and the response due to the physical component calculated in real-time by numerically evaluating the convolution integral at each time step. The unit impulse function, as part of this calculation, is determined prior to the hybrid simulation. Therefore, the integration time-stepping method is not necessary during the hybrid simulation. A numerical model with any number of degrees-of-freedom can be employed in the RTHS since the computational load of calculating the effects of the physical component is independent of the size of the linear numerical model.
Figure 11: Schematic Block Diagram for RTHS using the CI Method (Kim et al 2011).
3.2 Prototype Structure and Components of RTHS
A description of the highway bridge subjected to truck loading and controlled with MR dampers is presented. The MR dampers are attached to the bridge in order to reduce the response due to truck loading. As described in the previous section, RTHS divides a structural system into two components, both of which are described here. Prototype Structure
The prototype structure is a typical highway bridge which is based on a n actual in-service highway bridge located in Connecticut. The selected bridge (referred to as the Cromwell Bridge) is located in the southbound direction of Interstate 91 in Connecticut near the Town of Cromwell (National Bridge Index # 03522). The Cromwell Bridge is a simply supported composite bridge with steel girder and concrete slab. As shown in Figure 12, the bridge length is 65.68 m with three simply supported spans whose lengths are 23.05 m, 23.24 m, and 19.39 m, respectively. The bridge has eight W36x194 steel girders that support and carry the load of the concrete deck
ControllerFServo-hydraulic
actuatorSpecimen
(MR Damper)
yPre-calculated
++ty
dy0
( ) (t
d dt dτ τ τ− )∫ H F
16
and crossing vehicles to the piers and abutments. The width of the bridge is approximately 15.5 m and carries three lanes of interstate traffic. A view of the cross section of the bridge shown in Figure 13 details the locations and specifications of the girders, diaphragms, and cover plates as well as the dimensions of the deck and parapets.
Figure 12. Elevation View of the Cromwell Bridge (same as Figure 1, shown again for convenience)
Figure 13. Cross Section of the Cromwell Bridge
Numerical Component The numerical component is selected to be the span 1 highlighted in Figure 12. The
numerical component is modeled as a three-dimensional finite element model in ABAQUS (http://www.simulia.com/) as illustrated in Figure 14. The bridge is modeled using plate elements. The model is comprised of 15,952 nodes and 50,348 plate elements with total 263,178 degrees-of-freedom and a fundamental frequency of 5.14 Hz. The plate elements in the slab and bridge girders were assigned with a uniform thickness and material properties corresponding to the specifications of the composite steel girder bridge. To ensure composite action for the model between the elements in the slab and the elements in the girders, the nodes in the top flanges of the girders were tied to the nodes in the concrete deck. The concrete parapets were modeled by

17
plate elements with a uniform thickness that approximates the weight and dimensions of the actual parapets.
Figure 14. Finite Element Model of Composite Steel Girder Bridge, Span 1.
Physical Component The physical components are selected to be large-scale 200 kN MR dampers, manufactured
by the Lord Corporation. A schematic of the two large-scale MR dampers used in this study is shown previously in Figure 4. The damper is 1.47 m in length, having a mass of approximately 280 kg and an available stroke of 584 m m. T he damper’s accumulator can accommodate a temperature change in the fluid of 27oC. The damper can provide maximum control forces of over 200 kN. The MR damper is controlled with a low voltage, current driven command signal. The coil resistance is approximately 4.8 ohms (Ω), with an associated inductance measured to be approximately 5 h enrys (H) at 1 a mpere (A) and 3 H at 2 A . An Advanced Motion Controls Pulse Width Modulated (PWM) Servo-Amplifier is powered by an 80 vol ts (V) DC, 5 A unregulated linear power supply. The PWM servo-amplifier is used to provide the command signal that controls the electromagnetic field for each damper. The PWM Servo-Amplifier is controlled by a 0-5 V DC signal and utilizes pulse width modulation for current control. The input control signal can be switched at a rate up to 1 kHz, although the rise time of the current signal is limited by the inductance of the MR damper. Each damper has been fitted with a transient voltage suppressor to protect the MR damper electromagnetic coils from unintended and damaging voltage peaks, limiting the peak voltage to 75 V.
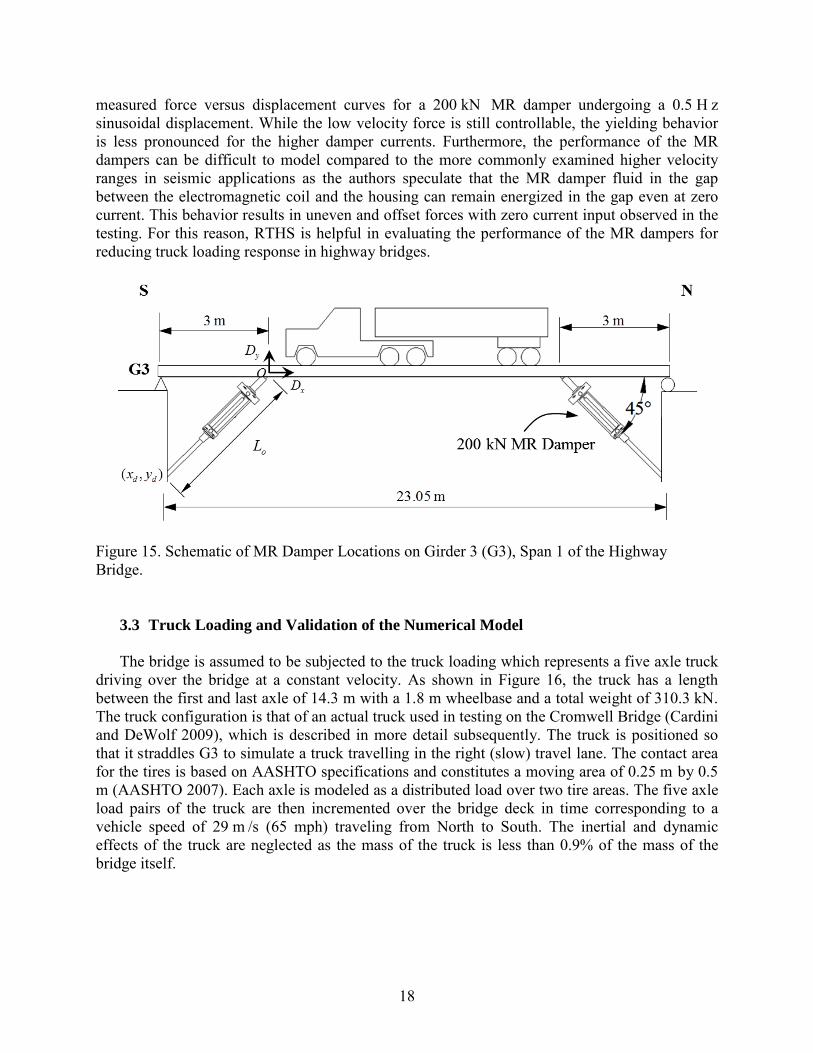
As depicted in Figure 15, the MR dampers are assumed to be placed under Girder 3 (G3) shown in Figure 14 at 3 m from both sides of the abutments with a 45 degree angle. It is found that the angle between the MR damper and the bridge vary from 44.989 degrees to 45.001 degrees from the preliminary analysis without the damper and it is expected that the variation of the angle can be smaller once the dampers are placed on the bridge. Therefore, such small variation of the angle is neglected and it is assumed that the angle remains a 45 degree during the experiment.
The response of this type and size of bridge under truck loading lies in the low amplitude, low velocity (~10mm/s) range (Christenson et al 2011). Figure 5 shows experimentally
18
measured force versus displacement curves for a 200 kN MR damper undergoing a 0.5 H z sinusoidal displacement. While the low velocity force is still controllable, the yielding behavior is less pronounced for the higher damper currents. Furthermore, the performance of the MR dampers can be difficult to model compared to the more commonly examined higher velocity ranges in seismic applications as the authors speculate that the MR damper fluid in the gap between the electromagnetic coil and the housing can remain energized in the gap even at zero current. This behavior results in uneven and offset forces with zero current input observed in the testing. For this reason, RTHS is helpful in evaluating the performance of the MR dampers for reducing truck loading response in highway bridges.
Figure 15. Schematic of MR Damper Locations on Girder 3 (G3), Span 1 of the Highway Bridge.
3.3 Truck Loading and Validation of the Numerical Model
The bridge is assumed to be subjected to the truck loading which represents a five axle truck
driving over the bridge at a constant velocity. As shown in Figure 16, the truck has a length between the first and last axle of 14.3 m with a 1.8 m wheelbase and a total weight of 310.3 kN. The truck configuration is that of an actual truck used in testing on the Cromwell Bridge (Cardini and DeWolf 2009), which is described in more detail subsequently. The truck is positioned so that it straddles G3 to simulate a truck travelling in the right (slow) travel lane. The contact area for the tires is based on AASHTO specifications and constitutes a moving area of 0.25 m by 0.5 m (AASHTO 2007). Each axle is modeled as a distributed load over two tire areas. The five axle load pairs of the truck are then incremented over the bridge deck in time corresponding to a vehicle speed of 29 m /s (65 mph) traveling from North to South. The inertial and dynamic effects of the truck are neglected as the mass of the truck is less than 0.9% of the mass of the bridge itself.
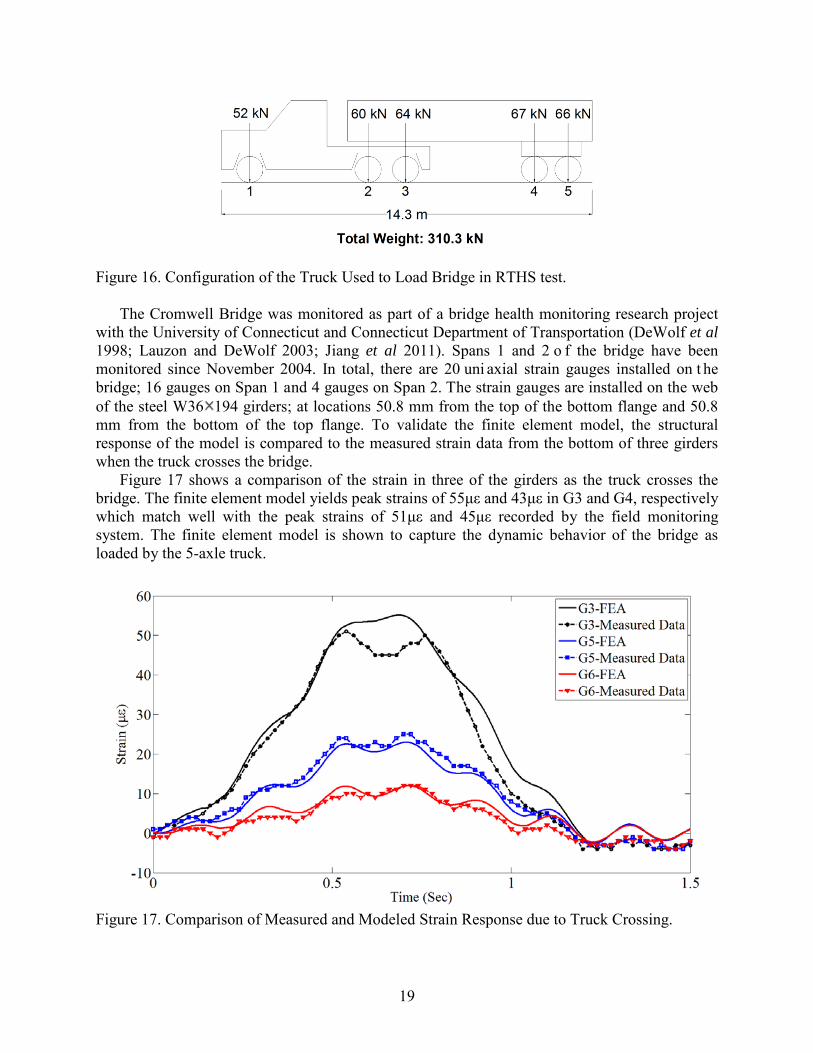
19
Figure 16. Configuration of the Truck Used to Load Bridge in RTHS test.
The Cromwell Bridge was monitored as part of a bridge health monitoring research project with the University of Connecticut and Connecticut Department of Transportation (DeWolf et al 1998; Lauzon and DeWolf 2003; Jiang et al 2011). Spans 1 and 2 o f the bridge have been monitored since November 2004. In total, there are 20 uni axial strain gauges installed on t he bridge; 16 gauges on Span 1 and 4 gauges on Span 2. The strain gauges are installed on the web of the steel W36 194 girders; at locations 50.8 mm from the top of the bottom flange and 50.8 mm from the bottom of the top flange. To validate the finite element model, the structural response of the model is compared to the measured strain data from the bottom of three girders when the truck crosses the bridge.
Figure 17 shows a comparison of the strain in three of the girders as the truck crosses the bridge. The finite element model yields peak strains of 55με and 43με in G3 and G4, respectively which match well with the peak strains of 51με and 45με recorded by the field monitoring system. The finite element model is shown to capture the dynamic behavior of the bridge as loaded by the 5-axle truck.
Figure 17. Comparison of Measured and Modeled Strain Response due to Truck Crossing.

20
3.4 Experimental Testing and Results
RTHS of the abovementioned highway bridge attached with two large-scale MR dampers and subjected to the identified truck loading is conducted at the Lehigh NEES facility. The process of the experiment is depicted Figure 18. Note that the pre-calculated responses of the bridge due to truck loading and unit impulse loading are converted from Cartesian coordinates to the Damper coordinate (Damper direction). For example, the response of the bridge due to truck loading in Cartesian coordinates, 𝑦𝑡 can be converted as 𝑦𝑑𝑡 = (𝑥𝑑 − 𝐷𝑥)2 + (𝑦𝑑 − 𝐷𝑦)2 − 𝐿𝑂, where 𝑦𝑑𝑡 is the displacement in a Damper direction, 𝑥𝑑 and 𝑦𝑑 are the coordinates of the brace points connecting to the bridge piers shown in Figure 15, 𝐷𝑥 and 𝐷𝑦 are the horizontal and the vertical displacements of the bridge due to truck loading, respectively, 𝐿𝑂 is the original length of the brace including the damper shown Figure 15. The components in Cartesian coordinates for the response due to unit impulse loading, 𝐻𝑑(𝑡), can be calculated using the same way. This is intended to further reduce the computational load during hybrid simulation.
In the preprocessing phase, 𝑦𝑡 and 𝐻𝑑(𝑡), are calculated by utilizing the bridge model in ABAQUS. The truck loading is applied as described in section 3.4. The calculated 𝑦𝑡 and 𝐻𝑑(𝑡) from the preprocessing phase are shown in Figure 11 and 12 in Cartesian coordinates.
Figure 18. Process of RTHS using CI method.
Response in Cartesian Coordinates of the bridge due to truck loading from FE Model, ty
ControllerdFServo-hydraulic
actuatorSpecimen
(MR Damper)
y
++
dy0
( ) (t
d dt dτ τ τ− )∫ H F
Response in Cartesian Coordinates of the bridge due to unit impulse loadingfrom FE Model, dH
Convert and to responses in the Damper Coordinate
tdy H
Pre-calculatedResponse
Calculate the response of the bridge by using known truck loading and the obtained force history of physical component dF
(a) Preprocessing
(b) Real-time hybrid simulation
(c) Post-processing
21
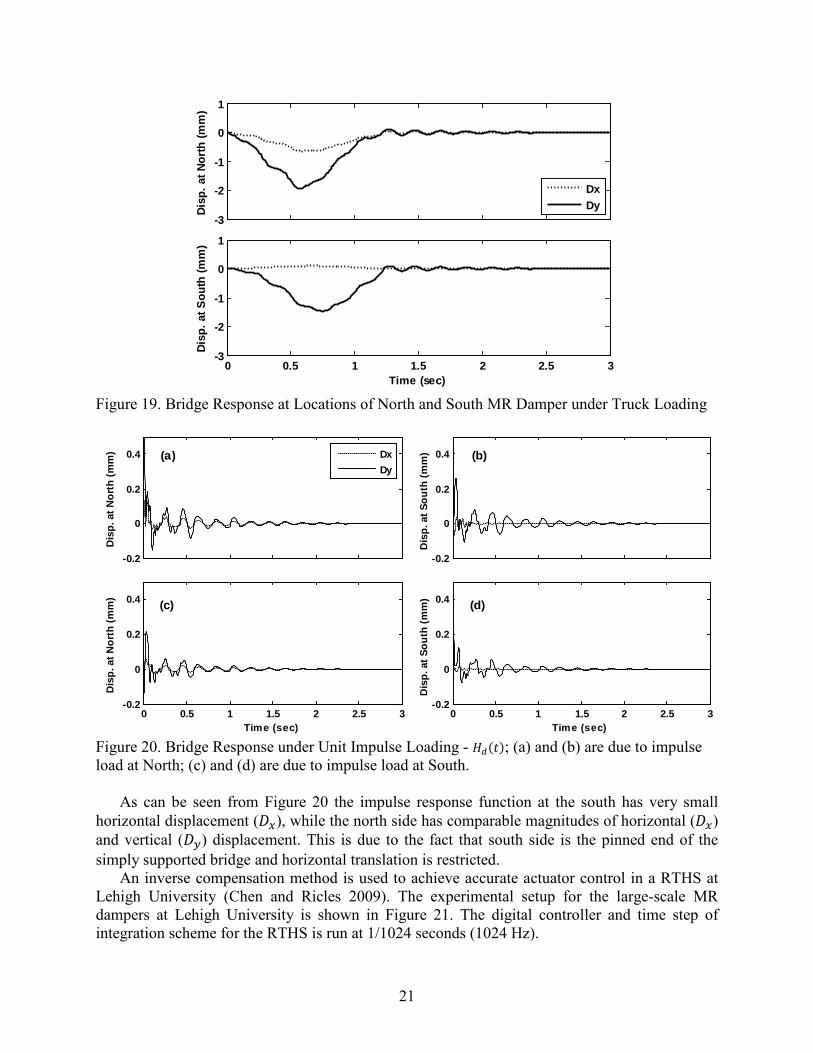
Figure 19. Bridge Response at Locations of North and South MR Damper under Truck Loading
Figure 20. Bridge Response under Unit Impulse Loading - 𝐻𝑑(𝑡); (a) and (b) are due to impulse load at North; (c) and (d) are due to impulse load at South.
As can be seen from Figure 20 the impulse response function at the south has very small horizontal displacement (𝐷𝑥), while the north side has comparable magnitudes of horizontal (𝐷𝑥) and vertical (𝐷𝑦) displacement. This is due to the fact that south side is the pinned end of the simply supported bridge and horizontal translation is restricted.
An inverse compensation method is used to achieve accurate actuator control in a RTHS at Lehigh University (Chen and Ricles 2009). The experimental setup for the large-scale MR dampers at Lehigh University is shown in Figure 21. The digital controller and time step of integration scheme for the RTHS is run at 1/1024 seconds (1024 Hz).
-3
-2
-1
0
1
Disp
. at N
orth
(mm
)
DxDy
0 0.5 1 1.5 2 2.5 3-3
-2
-1
0
1
Time (sec)
Disp
. at S
outh
(mm
)
-0.2
0
0.2
0.4
Dis
p. a
t Nor
th (m
m)
DxDy
-0.2
0
0.2
0.4
Dis
p. a
t Sou
th (m
m)
0 0.5 1 1.5 2 2.5 3-0.2
0
0.2
0.4
Time (sec)
Dis
p. a
t Nor
th (m
m)
0 0.5 1 1.5 2 2.5 3-0.2
0
0.2
0.4
Time (sec)
Dis
p. a
t Sou
th (m
m)
(a) (b)
(c) (d)

22
Due to the unique characteristics of the MR damper, many researchers, beginning with Dyke et al, 1997, have devoted their efforts on v arious controllers to provide proper currents to the damper. A primary Linear Quadratic Gaussian (LQG) controller together with a secondary over-driven back-driven clipped-optimal controller has been adopted in this study. The primary controller seeks to minimize the strain of the bridge summed up over the length of the bridge. The feedback measurements available for the controller are measured strains on the bottom of the girder below the slow lane (G3) at ¼, ½ and ¾ span of the girder. The weighting matrices are selected accordingly and optimized through a series of pure simulations to provide maximum response reduction for the semiactive system. Details about the secondary controller used to track the prescribed control forces can be found in Phillips et al (2010). Figure 22 shows the measured damper forces during RTHS. It should be noted that the force levels, well below the maximum achievable forces of 200 kN, are a result of the low velocities of the MR dampers. This issue could be resolved by amplifying the motion mechanically, however, in a multi-hazard application this current configuration might be desirable for seismic protection.
Figure 21. MR Damper Setup at Lehigh NEES Facility.
Figure 22. Measured Damper Forces at the Damper Coordinate
0 0.5 1 1.5 2 2.5 3-60
-40
-20
0
20
40
Time (sec)
Forc
e (k
N)
NorthSouth

23
With the damper forces measured in the RTHS, desired responses of the bridge can be found by inputting the damper forces into the finite element model together with the truck loading and choosing the appropriate output. To confirm the performance of the CI method, the displacement response of the bridge at the two damper locations is calculated from finite element analysis and then compared to the total displacement at the dampers obtained from the RTHS. Results are shown in Figure 23 and detailed in Table 2, which indicate both results match well. The differences of peak displacements between both results are small with a maximum error of 3.18%. Note that the response of finite element analysis is calculated by applying damper forces measured from the experiment. Thus, such a small difference could be due to measurement error of displacement and force. In addition, compared to the uncontrolled case, the response is reduced by up t o about 9% due to MR damper. It is demonstrated that real-time hybrid simulation using the CI method can be successfully conducted with the complex numerical finite element bridge model with 263,178 degrees-of-freedom.
Figure 23. Response Comparison at the Damper Coordinate. Table 2. Comparison of peak displacement between RTHS-CIM and FEA - ABAQUS
Location Uncontrolled (mm)
Controlled
FEA (mm)
RTHS - CIM
Peak (mm) Damper Effect (%)
**Error Compared to FEA
(%) North 1.831 1.616 1.668 -8.91 3.18 South 1.118 1.087 1.094 -2.07 0.66
* Damper effect: comparison between uncontrolled and controlled cases ** Error compared to FEA: comparison between RTHS-CIM and FEA - ABAQUS
-2
-1.5
-1
-0.5
0
0.5
Disp
l. at
nor
th (m
m)
UncontrolledRTHS - CIMFEA - ABAQUS
0 0.5 1 1.5 2 2.5 3-2
-1.5
-1
-0.5
0
0.5
Time (sec)
Disp
l. at
sou
th (m
m)
24
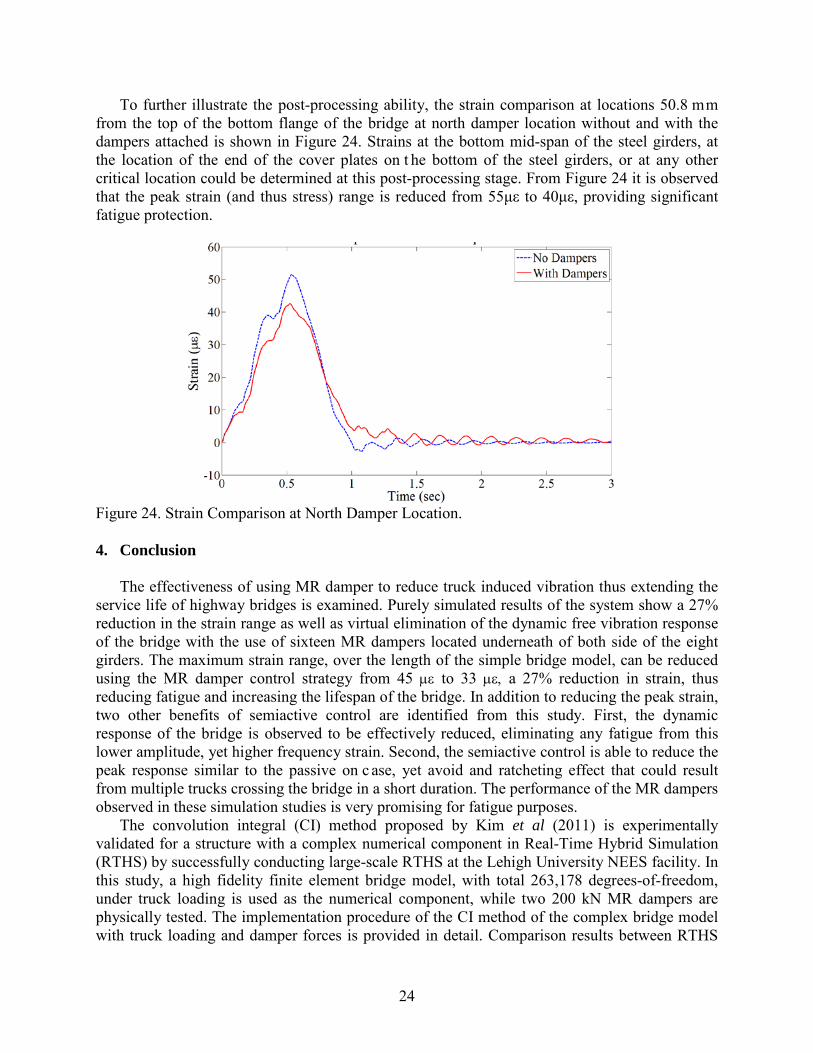
To further illustrate the post-processing ability, the strain comparison at locations 50.8 mm from the top of the bottom flange of the bridge at north damper location without and with the dampers attached is shown in Figure 24. Strains at the bottom mid-span of the steel girders, at the location of the end of the cover plates on t he bottom of the steel girders, or at any other critical location could be determined at this post-processing stage. From Figure 24 it is observed that the peak strain (and thus stress) range is reduced from 55με to 40με, providing significant fatigue protection.
Figure 24. Strain Comparison at North Damper Location.
4. Conclusion
The effectiveness of using MR damper to reduce truck induced vibration thus extending the
service life of highway bridges is examined. Purely simulated results of the system show a 27% reduction in the strain range as well as virtual elimination of the dynamic free vibration response of the bridge with the use of sixteen MR dampers located underneath of both side of the eight girders. The maximum strain range, over the length of the simple bridge model, can be reduced using the MR damper control strategy from 45 µε to 33 µε, a 27% reduction in strain, thus reducing fatigue and increasing the lifespan of the bridge. In addition to reducing the peak strain, two other benefits of semiactive control are identified from this study. First, the dynamic response of the bridge is observed to be effectively reduced, eliminating any fatigue from this lower amplitude, yet higher frequency strain. Second, the semiactive control is able to reduce the peak response similar to the passive on c ase, yet avoid and ratcheting effect that could result from multiple trucks crossing the bridge in a short duration. The performance of the MR dampers observed in these simulation studies is very promising for fatigue purposes.
The convolution integral (CI) method proposed by Kim et al (2011) is experimentally validated for a structure with a complex numerical component in Real-Time Hybrid Simulation (RTHS) by successfully conducting large-scale RTHS at the Lehigh University NEES facility. In this study, a high fidelity finite element bridge model, with total 263,178 degrees-of-freedom, under truck loading is used as the numerical component, while two 200 kN MR dampers are physically tested. The implementation procedure of the CI method of the complex bridge model with truck loading and damper forces is provided in detail. Comparison results between RTHS
25
using CI method and the finite element analysis using the measured damper forces from the RTHS as inputs show good agreement with a maximum error of about 3%. This confirms the feasibility of involving complex numerical models in RTHS by utilizing the CI method. Displacements and strains at damper locations of the bridge model are calculated to demonstrate the ability to obtain the desired responses of the numerical component in post-processing. The peak strain at the location of the MR damper is observed to be reduced from 51 µε to 41 µε, a 20% reduction in strain when using only the two MR dampers. 5. References 2009 ASCE report card for America’s Infrastructure: http://www.infrastructurereportcard.org/
fact-sheet/bridges.
AASHTO LRFD Bridge Design Specifications 2007: Customary U.S. Units, 4th Ed. American Association of State Highway and Transportation Officials.
Bass B J and Christenson R E 2007 S ystem Identification of a 200 k N Magneto-Rheological Fluid Damper for structural Control in Large-Scale Smart Structures Proc. of the American Control Conference New York City NY p 2690-2695.
Beer F P, Johnston E R, and DeWolf J T 2006 Mechanics of Materials, 4th Edition. MCGraw Hill Inc., New York.
Cardini A J, and DeWolf J T 2009 Long-term structural health monitoring of a multi-girder steel composite bridge using strain data Structural Health Monitoring Vol 8 Issue 1 pp 47-58.
Carrion J, Spencer B. Model-based strategies for real-time hybrid testing. Technical Report, University of Illinois at Urbana-Champaign, 2007.
Cha Y, Zhang J, Agrawal A, Dong B, Friedman A, Dyke S, and Ricles J 2013 Comparative Studies of Semi-Active Control Strategies for MR Dampers: Pure Simulation and Real-Time Hybrid Tests Journal of Structural Engineering 139, SPECIAL ISSUE: NEES 1: Advances in Earthquake Engineering, 1237–1248.
Chae Y, Ricles J, and Sause R 2013 Large-Scale Experimental Studies of Structural Control Algorithms for Structures with Magneto-Rheological Dampers Using Real-Time Hybrid Simulation Journal of Structural Engineering 10.1061/(ASCE)ST.1943-541X.0000691.
Chen C and Ricles J M 2009 A nalysis of actuator delay compensation methods for real-time testing Eng. Struct. 31 2643–55.
Chen C, Ricles J, Sause R and Christenson R 2010 Experimental Evaluation of an Adaptive Inverse Compensation Technique for Real-Time Simulation of a Large-Scale Magneto-Rheological Fluid Damper Journal of Smart Materials and Structures 19 025017.
Cheng C, James M R, Thomas M M, and Oya M 2009 Real-time hybrid testing using the unconditionally stable explicit CR integration algorithm Earthquake Engineering & Structural Dynamics, Vol. 38, Issue 1, pp. 23-44.
Christenson R E, Lin Y Z, Emmons A T and Bass B 2008 Large-Scale Experimental Verification of Semiactive Control through Real-Time Hybrid Simulation ASCE Journal of Structural Engineering, 134(4) pp522-535.
26
Christenson R E, Bakulski S K and McDonnell A M 2011 Establishment of a Dual-Purpose Bridge Health Monitoring and Weigh-In-Motion System for a Steel Girder Bridge Proceedings of the Transportation Research Board Annual Meeting, Washington DC, January 2011.
Clough R W and Penzien J 1993 Dynamics of Structures. McGraw Hill, New York.
Colgate J E, Stanley M C, and Brown J M 1995 Issues in the haptic display of tool use IROS.
DeWolf J T, Culmo M P, and Lauzon R G 1998 Connecticut’s Bridge Infrastructure Monitoring Program for Assessment ASCE Journal of Infrastructure Systems 4(2) pp 86-90.
Dyke S J, Spencer B F Jr, Sain M K, and Carlson J D 1997 An experimental study of MR dampers for seismic protection Smart Mater. Struct. 7 693–703.
Emmons A, Christenson R. Proposed full-scale experimental verification of semiactive control applied to a nonlinear structure Proceedings of the 17th Analysis and Computation Conference (ASCE), St Louis, MO, U.S.A., 2006.
Friedland I M and Small E P 2003 FHWA Bridge Research and Technology Deployment Initiatives Proc. 2003 Mid-Continental Trans. Research Symposium, Ames, IA, August 2003.
Friedman A J 2012 Development and Experimental Validation of a New Control Strategy Considering Device Dynamics for Large-Scale MR Dampers Using Real-Time Hybrid Simulation Doctoral Dissertation, Purdue University.
Fujitani H, Sakae H, Kawasaki R, Fujii H, Hiwatashi T, and Saito T 2008 Verification of real-time hybrid tests of response control of base isolation system by MR damper comparing shaking table tests Proceeding of SPIE Sensors and Smart Structures Technologies for Civil Mechanics, and Aerospace Systems 6932 69320Z-1.
Hakuno M, Shidawara M, and Hara T 1969 D ynamic destructive test of a cantilever beam, controlled by an analog-computer Transactions of the Japan Society of Civil Engineers vol 171: p 1-9. (in Japanese)
Horiuchi T, Inoue M, Konno T, and Yamagishi W 1999 Development of a r eal-time hybrid experimental system using a shaking table (proposal of experimental concept and feasibility study with rigid secondary system JSME International Journal, Vol. 42, No. 2, pp. 255-264.
Housner G W, Soong T T, and Masri S F 1994 Second generation of active structural control in civil engineering Proc. 1st World Conf. on Structural Control Pasadena California Panel p 3-18.
Johnson, E. A., Ramallo, J. C., Spencer, B.F., Jr., and Sain, M. K. (1998). "Intelligent Base Isolation Systems," Proc. 2nd W orld Conf. on S tructural Control (2WCSC), Kyoto, Japan, Vol. 1, pp. 367- 376.
Jiang Z and Christenson R E 2011 A comparison of 200 kN magneto-rheological damper models for use in real-time hybrid simulation pretesting Smart Materials and Structures 20 065011.
Jiang Z, Scianna A, Plude S, Christenson R and DeWolf J T 2011 Online Long-Term Bridge Monitoring System for the Connecticut Bridge Monitoring Program with Application to a Multi-Girder Composite Steel Girder Bridge Journal of Structural Health Monitoring (under review).
27
Kim S J, Christenson R E, Wojtkiewicz, S F and Johnson E A 2011 Real-time hybrid simulation using the convolution integral method Smart Materials and Structures 20 025024.
Kirk R S and Mallet W J 2007 CRS Report for Congress: Highway Bridges: Conditions and the Federal/State Role. Order Code RL34127.
Kyrychko Y N, Blyuss K B, Gonzalez-Buelga A, Hogan S J, and Wagg D J 2006 Real-time dynamic substructuring in a coupled oscillator-pendulum system Proc. Royal Society, Vol. 462, pp.1271-1294.
Laruzon R G and DeWolf J T 2003 Connecticut’s Bridge Monitoring Program – Making Important Connections Last TR News, January/February No 24 pp46-47.
Lin Y and Christenson R E 2011 Real-Time Hybrid Test Validation of a MR Damper Controlled Building with Shake Table Tests Advances in Structural Engineering, Vol. 14, No. 1 p79.
Mahin S A, Shing P B, Thewalt C R, and Hanson R D 1989 Pseudodynamic test method – current status and future directions Journal of Structural Engineering vol 115(8) p 2113-2128.
Nakashima, M. (2001) “Development, potential, and limitations of real-time online (pseudo-dynamic) testing” Philosophical Transactions of the Royal Society of London, A. 359, pp . 1851-1867.
Phillips B, Chae Y, Jiang Z, Spencer B F Jr, Ricles J, Christenson R, Dyke S J, and Agrawal A 2010 Real-Time Hybrid Simulation Benchmark Study with a Large-Scale MR Damper Proceedings of the 5th World Conference on Structural Control and Monitoring Tokyo, Japan.
Phillips B M and Spencer B F Jr 2010 Model-based real-time hybrid simulation strategies for large-scale testing 5th World Conference on Structural Control and Monitoring Tokyo, Japan.
Phillips B M and Spencer B F Jr 2013 Model-based Multi-Actuator Control for Real-time hybrid simulation Journal of Engineering Mechanics 139(2), 219–228.
Shing P B, Nakashima M and Bursi O S 1996 Application of pseudodynamic test method to structural research Earthquake Spectra vol 12(1) p 29-56.
Spencer B F and Sain M K 1997 Controlling Buildings: A New Frontier in Feedback IEEE Control Systems Magazine, Vol. 17.6 pp. 19-35.
Spencer B F and Nagarajaiah S 2003 State of the Art of Structural Control Journal of Structural Engineering, Vol. July 2003 pp. 845-856.
Takanashi K 1975 Non-linear earthquake response analysis of structures by a computer actuator on-line system (part 1 details of the system Transactions of the Architectural Institute of Japan vol 229 p 77-83. (in Japanese)
Takanashi K and Nakashima M 1987 J apanese activities on on -line testing Journal of Engineering Mechanics vol 113(7) p 1014-1032.
Takanashi K, Udagawa K, Seki M, Okada T and Tanaka H 1975 Nonlinear earthquake response analysis of structures by a computer-actuator on-line system Bulletin of Earthquake Resistant Structure Research Centre No.8 Institute of Industrial Science, University of Tokyo, Japan

28
Wu B, Wang QY, Shi PF, Ou JP, and Guan XC. 2006 Real-time substructure test of jz20-2nw offshore platform with semiactive M dampers Journal of Intelligent Material Systems and Structures 14:35–42.
Zapateiro M, Karimi H R, Luo N and Spencer B F 2010 Real-time testing of semiactive control strategies for vibration reduction in a structure with MR damper Structural Control and Health Monitoring 17:427-451
Zhao J, French C, Shield C, and Posbergh T 2003 Considerations for the development of real-time dynamic testing using servo-hydraulic actuation Earthquake Engineering and Structural Dynamics, Vol. 32, pp. 1773-1794.