experimental study and modelling of the thermal ...usir.salford.ac.uk/41269/2/jin_applied...
TRANSCRIPT
Experimental study and modelling of the thermal conductivity of sandy soils of different porosities and water contents
Jin, H, Wang, Y, Zheng, Q, Liu, H and Chadwick, EA
http://dx.doi.org/10.3390/app7020119
Title Experimental study and modelling of the thermal conductivity of sandy soils of different porosities and water contents
Authors Jin, H, Wang, Y, Zheng, Q, Liu, H and Chadwick, EA
Type Article
URL This version is available at: http://usir.salford.ac.uk/41269/
Published Date 2017
USIR is a digital collection of the research output of the University of Salford. Where copyright permits, full text material held in the repository is made freely available online and can be read, downloaded and copied for noncommercial private study or research purposes. Please check the manuscript for any further copyright restrictions.
For more information, including our policy and submission procedure, pleasecontact the Repository Team at: [email protected].
applied sciences
Article
Experimental Study and Modelling of the ThermalConductivity of Sandy Soils of Different Porositiesand Water ContentsHua Jin 1, Yu Wang 2,*, Qiang Zheng 1, Hu Liu 3 and Edmund Chadwick 2
1 College of Water Resource Science and Engineering, Taiyuan University of Technology, Taiyuan 030024,China; [email protected] (H.J.); [email protected] (Q.Z.)
2 School of Computing, Science & Engineering, University of Salford, Manchester M5 4WT, UK;[email protected]
3 Taiyuan Bilan Hydraulic Engineering Design Co. Ltd., Taiyuan 030024, China; [email protected]* Correspondence: [email protected]; Tel.: +44-161-295-6822
Academic Editor: Stefano InvernizziReceived: 25 October 2016; Accepted: 17 January 2017; Published: 25 January 2017
Abstract: This paper at first reports an experimental work to test the thermal conductivity offormulated sandy soil specimens of different porosities and water contents. Both needle probeand hot-plate methods were conducted and compared. It has been confirmed that the needle probemethod has a better accuracy for the measurement of unsaturated soil thermal conductivity, and thatthe pore size distribution plays an important role on unsaturated soil thermal conductivity. Secondly,it gives out an extensive review on the modelling work, and investigates two major types of empiricalmodels in detail. Two generalized formulas have been suggested to mathematically characterise thetwo types of models and tested using the experimental data. Finally, in terms of the intrinsic relationto the pore size distribution and the similarity between the thermal conductivity and water retentioncharacteristics of unsaturated soils, a soil water retention model has been suggested and tested todescribe unsaturated soil thermal conductivity.
Keywords: soil thermal conductivity; needle probe method; hot-plate method; porosity; saturation;soil water retention model
1. Introduction
Soil thermal conductivity has a wide interest in underground infrastructure engineering,such as sub-ground building [1], subsurface pipeline [2,3] and cable networks [4,5], undergroundtransportation [6], and ground source heat pump systems [7–9]. Soil thermal conductivity dependson many factors, which may be primarily classified into three groups: the nature of soils, includingthe texture, mineral composition, shape and size of soil particles; the structural condition, includingporosity and particle arrangement; and the physical condition, including water content, temperature,and pressure. In reality, all these influences work together making the evaluation of soil thermalconductivity a big challenge [10–14].
In order to understand the influences of structural and physical conditions, the study on thethermal conductivity of unsaturated sandy soils has raised particular interest [15–19]. Chen [18]reported an experimental work using four different quartz sands, which had the same over 99% quartzcontent, but different particle size distribution. Using the transient thermal probe method, the thermalconductivity was measured at four different porosities and five water contents from dry to fullysaturated. Based on the experimental result, he proposed an empirical thermal conductivity model forsandy soil, which took a logarithmic form containing the porosity and saturation. Tarnawski et al. [16]conducted a similar test on three standard sands, called Ottawa C-109, Ottawa C-190, and Toyoura,
Appl. Sci. 2017, 7, 119; doi:10.3390/app7020119 www.mdpi.com/journal/applsci
Appl. Sci. 2017, 7, 119 2 of 17
respectively. The Ottawa sands have 99.8% quartz content and a density of 2.65, while the Toyourasand, which is mainly composed of quartz and some siliceous rocks and black shale, has a densityof 2.63. Using the thermal probe method, they measured the thermal conductivity at two porositiesand six degrees of water saturation from dryness to full saturation. For modelling, they used the deVries model [20] to fit the measurements. Both of the two reported works took a similar procedure insample preparation, in which, at first, a certain amount of sands of a specific water content were filledin a container. Thereafter the sands in the container were compacted to a certain volume to achievea specific porosity. The two separately conducted works had obtained quite similar measurementresults for the thermal conductivity of sandy soils at different porosity and water content conditions.The two models adopted had produced a good fitting result for the experimental measurements.
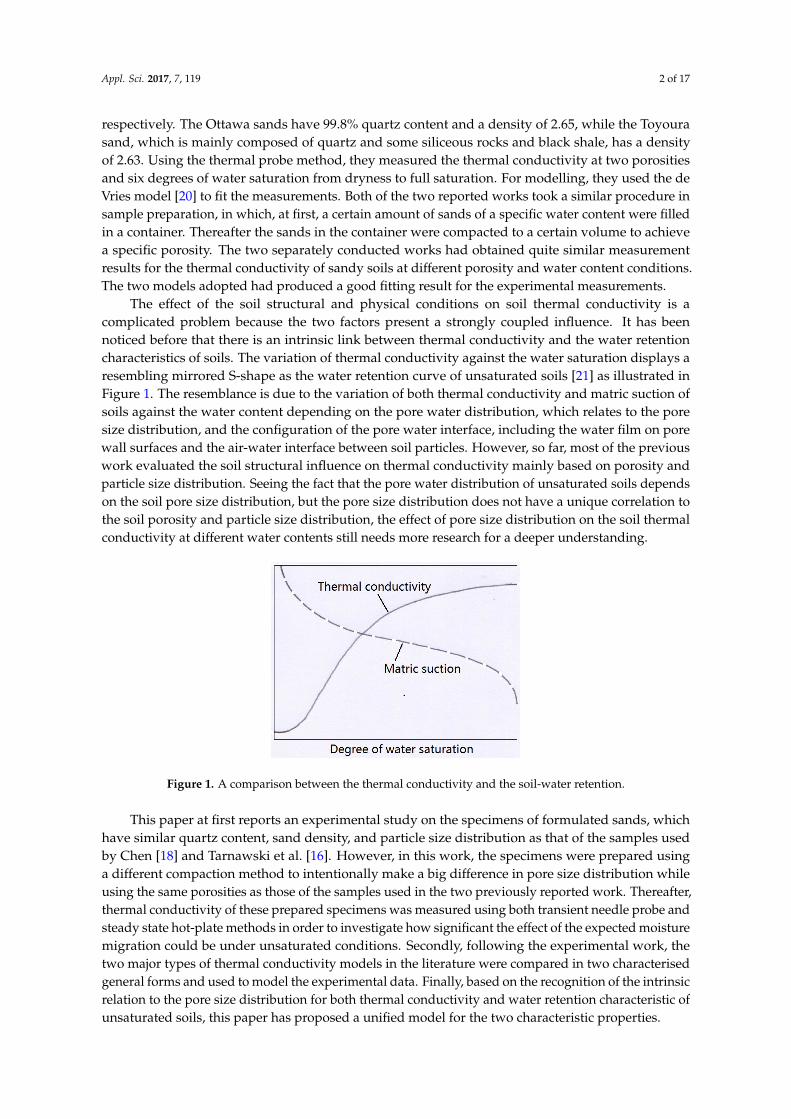
The effect of the soil structural and physical conditions on soil thermal conductivity is acomplicated problem because the two factors present a strongly coupled influence. It has beennoticed before that there is an intrinsic link between thermal conductivity and the water retentioncharacteristics of soils. The variation of thermal conductivity against the water saturation displays aresembling mirrored S-shape as the water retention curve of unsaturated soils [21] as illustrated inFigure 1. The resemblance is due to the variation of both thermal conductivity and matric suction ofsoils against the water content depending on the pore water distribution, which relates to the poresize distribution, and the configuration of the pore water interface, including the water film on porewall surfaces and the air-water interface between soil particles. However, so far, most of the previouswork evaluated the soil structural influence on thermal conductivity mainly based on porosity andparticle size distribution. Seeing the fact that the pore water distribution of unsaturated soils dependson the soil pore size distribution, but the pore size distribution does not have a unique correlation tothe soil porosity and particle size distribution, the effect of pore size distribution on the soil thermalconductivity at different water contents still needs more research for a deeper understanding.
Appl. Sci. 2017, 7, 119 2 of 17
C-190, and Toyoura, respectively. The Ottawa sands have 99.8% quartz content and a density of 2.65,
while the Toyoura sand, which is mainly composed of quartz and some siliceous rocks and black
shale, has a density of 2.63. Using the thermal probe method, they measured the thermal conductivity
at two porosities and six degrees of water saturation from dryness to full saturation. For modelling,
they used the de Vries model [20] to fit the measurements. Both of the two reported works took a
similar procedure in sample preparation, in which, at first, a certain amount of sands of a specific
water content were filled in a container. Thereafter the sands in the container were compacted to a
certain volume to achieve a specific porosity. The two separately conducted works had obtained quite
similar measurement results for the thermal conductivity of sandy soils at different porosity and
water content conditions. The two models adopted had produced a good fitting result for the
experimental measurements.
The effect of the soil structural and physical conditions on soil thermal conductivity is a
complicated problem because the two factors present a strongly coupled influence. It has been
noticed before that there is an intrinsic link between thermal conductivity and the water retention
characteristics of soils. The variation of thermal conductivity against the water saturation displays a
resembling mirrored S-shape as the water retention curve of unsaturated soils [21] as illustrated in
Figure 1. The resemblance is due to the variation of both thermal conductivity and matric suction of
soils against the water content depending on the pore water distribution, which relates to the pore
size distribution, and the configuration of the pore water interface, including the water film on pore
wall surfaces and the air-water interface between soil particles. However, so far, most of the previous
work evaluated the soil structural influence on thermal conductivity mainly based on porosity and
particle size distribution. Seeing the fact that the pore water distribution of unsaturated soils depends
on the soil pore size distribution, but the pore size distribution does not have a unique correlation to
the soil porosity and particle size distribution, the effect of pore size distribution on the soil thermal
conductivity at different water contents still needs more research for a deeper understanding.
Figure 1. A comparison between the thermal conductivity and the soil-water retention.
This paper at first reports an experimental study on the specimens of formulated sands, which
have similar quartz content, sand density, and particle size distribution as that of the samples used
by Chen [18] and Tarnawski et al. [16]. However, in this work, the specimens were prepared using a
different compaction method to intentionally make a big difference in pore size distribution while
using the same porosities as those of the samples used in the two previously reported work.
Thereafter, thermal conductivity of these prepared specimens was measured using both transient
needle probe and steady state hot-plate methods in order to investigate how significant the effect of
the expected moisture migration could be under unsaturated conditions. Secondly, following the
experimental work, the two major types of thermal conductivity models in the literature were
compared in two characterised general forms and used to model the experimental data. Finally, based
on the recognition of the intrinsic relation to the pore size distribution for both thermal conductivity
Figure 1. A comparison between the thermal conductivity and the soil-water retention.
This paper at first reports an experimental study on the specimens of formulated sands, whichhave similar quartz content, sand density, and particle size distribution as that of the samples usedby Chen [18] and Tarnawski et al. [16]. However, in this work, the specimens were prepared usinga different compaction method to intentionally make a big difference in pore size distribution whileusing the same porosities as those of the samples used in the two previously reported work. Thereafter,thermal conductivity of these prepared specimens was measured using both transient needle probe andsteady state hot-plate methods in order to investigate how significant the effect of the expected moisturemigration could be under unsaturated conditions. Secondly, following the experimental work, thetwo major types of thermal conductivity models in the literature were compared in two characterisedgeneral forms and used to model the experimental data. Finally, based on the recognition of the intrinsicrelation to the pore size distribution for both thermal conductivity and water retention characteristic ofunsaturated soils, this paper has proposed a unified model for the two characteristic properties.

Appl. Sci. 2017, 7, 119 3 of 17
2. Experimental Study
2.1. Methodology
There are two conventional methods to measure soil thermal conductivity [22,23], the steadystate method and transient method. The steady state method is based on Fourier’s Law by applyinga one-directional heat flow through a specimen. When a steady state is reached, there will be aconstant temperature gradient inside the specimen along the direction of the heat flow, and the thermalconductivity can be calculated directly in terms of its definition in Fourier’s law. The steady statemethod is slow and time consuming. Its accuracy is particularly influenced by the potential heatloss of the experimental cell to the surrounding environment [23,24]. In addition, the temperaturegradient in specimens may induce the migration of moisture and result in water redistribution inpores. Consequently, the steady heat-flow method, in a rigorous sense, should not be suitable forunsaturated soils [18]. The transient method, on the other hand, is based on the heat diffusion equationby applying a constant heat source into a specimen, such as a needle probe [23], and recording the localtemperature change in the specimen over a period of time. The thermal conductivity can be calculatedin terms of the power of the heat source, the temperature increase, and the heating time. The needleprobe transient method is rapid and has a small influence on the original water distribution state inunsaturated soils [18].
2.2. Materials and Setup
The soil specimens were prepared using the sands from a construction site in the Taiyuan city,Shanxi province in China. The sands had over 99% quartz content and a density of 2.66 g/cm3.The sands were at first heated for 24 h under 105 C and then sieved in laboratory. Thereafter, the sandsused for the test were formulated, using different particular particle sizes following the standard [25],to have a medium size. The particle size distribution of the formulated sands is showed in Figure 2,which is similar to that of the sample D in the work of Chen [18] and the Ottawa C-190 in the work ofTarnawski et al. [16]. Afterwards, the oven dry sand was spread out and had water added to reach fourdifferent water contents, 5%, 10%, 15%, and 20% in terms of the gravimetric weight of the dry sands.The sands and water were mixed extensively to maximize an even water distribution. Later, the sandsof four different water contents were transferred respectively into four individual airtight containerswhere they stayed for 24 h without any disturbance to reach a stable water distribution situation.It was found, after the 24 h static stay, that the sand with 20% water content had a water film on thetop surface. This was taken as a sign of a fully saturated state. Finally, each of the sands was evenlydivided into seven parts (about 1 kg per part), which were thereafter put into stainless containers of thesize of 150 mm (width) × 150 mm (depth) × 200 mm (height) one by one forming layers. After addingone layer, the sands in the container were impacted, using a 1 kg hammer falling from 0.05 m heightabove the top surface of the sands and the applied forces were 70, 210, 350, and 490 N, respectively,at four evenly distributed positions ensuring coverage of the total top surface of the sands in eachcontainer. Before adding a new layer, the compacted surface was ploughed to ensure a full integrationbetween layers. A total of seven layers were added into one container. At the end, a specimen of watercontent and porosity was taken for each container, and the bulk dry density of the prepared specimenswas measured. It was found that the bulk dry densities of all the specimens compacted under a certainforce but having different water contents were very close. The relative variation against their averagevalue is less than 3.6%. So, in this paper, it is assumed that the specimens of different water contentshad the same porosity after been compacted using the same force. The porosity was calculated usingthe equation below:
n = 1− ρdρs
(1)
where n is the porosity, ρd is the bulk dry density of formulated sand specimens, and ρs is the densityof sand particles (ρs = 2.66 g/cm3).

Appl. Sci. 2017, 7, 119 4 of 17
Appl. Sci. 2017, 7, 119 4 of 17
where n is the porosity, ρd is the bulk dry density of formulated sand specimens, and ρs is the density
of sand particles (ρs = 2.66 g/cm3).
Figure 2. The particle size distribution of the formulated sand samples.
The thermal conductivity was measured using both needle probe and hot-plate methods. In the
test using the needle probe method (Figure 3), five measurements were taken at five different
locations evenly distributing along the top surface of each specimen using five probes at the same
time. The final result took the average of the five measurements. Before the test, the needle probe was
calibrated in glycerol (C3H8O3) of 99% purity. The technical parameters of the needle probe are listed
in Table 1. Table 2 shows the calibration result of the five needle probes used, with a maximum
absolute error of 0.005 which is negligible compared to the measured value.
(a) (b)
Figure 3. The needle probe used in the test, (a) illustration; (b) product.
Table 1. The technical parameters of the needle probes used.
Structure Heating Wire Thermocouple Data Collector
Length (l): 167 mm
Diameter (d): 2 mm
l/d = 83.5
Electrical resistance
22.46 Ω/m
T-type
Accuracy: ±0.1 °C
UT325
Without the compensation at the cool end
Figure 2. The particle size distribution of the formulated sand samples.
The thermal conductivity was measured using both needle probe and hot-plate methods. In thetest using the needle probe method (Figure 3), five measurements were taken at five different locationsevenly distributing along the top surface of each specimen using five probes at the same time. The finalresult took the average of the five measurements. Before the test, the needle probe was calibrated inglycerol (C3H8O3) of 99% purity. The technical parameters of the needle probe are listed in Table 1.Table 2 shows the calibration result of the five needle probes used, with a maximum absolute error of0.005 which is negligible compared to the measured value.
Appl. Sci. 2017, 7, 119 4 of 17
where n is the porosity, ρd is the bulk dry density of formulated sand specimens, and ρs is the density
of sand particles (ρs = 2.66 g/cm3).
Figure 2. The particle size distribution of the formulated sand samples.
The thermal conductivity was measured using both needle probe and hot-plate methods. In the
test using the needle probe method (Figure 3), five measurements were taken at five different
locations evenly distributing along the top surface of each specimen using five probes at the same
time. The final result took the average of the five measurements. Before the test, the needle probe was
calibrated in glycerol (C3H8O3) of 99% purity. The technical parameters of the needle probe are listed
in Table 1. Table 2 shows the calibration result of the five needle probes used, with a maximum
absolute error of 0.005 which is negligible compared to the measured value.
(a) (b)
Figure 3. The needle probe used in the test, (a) illustration; (b) product.
Table 1. The technical parameters of the needle probes used.
Structure Heating Wire Thermocouple Data Collector
Length (l): 167 mm
Diameter (d): 2 mm
l/d = 83.5
Electrical resistance
22.46 Ω/m
T-type
Accuracy: ±0.1 °C
UT325
Without the compensation at the cool end
Figure 3. The needle probe used in the test, (a) illustration; (b) product.
Table 1. The technical parameters of the needle probes used.
Structure Heating Wire Thermocouple Data Collector
Length (l): 167 mmDiameter (d): 2 mm
l/d = 83.5
Electrical resistance22.46 Ω/m
T-typeAccuracy: ±0.1 C
UT325Without the compensation at the cool end
Appl. Sci. 2017, 7, 119 5 of 17
Table 2. The comparison of the measurement of the thermal conductivity of glycerol.
The Order No. ofthe Needle Probe
The Standard ValueMeasurement Absolute Error * Relative Error **
20 C 40 C
1
0.2872 0.2897
0.292 0.003 0.87%2 0.291 0.002 0.55%3 0.290 0.001 0.17%4 0.284 −0.005 −1.76%5 0.291 0.002 0.76%
* The measurement—the average of the two standard values at 20 and 40 C; ** the absolute error/the average ofthe two standard values at 20 and 40 C.
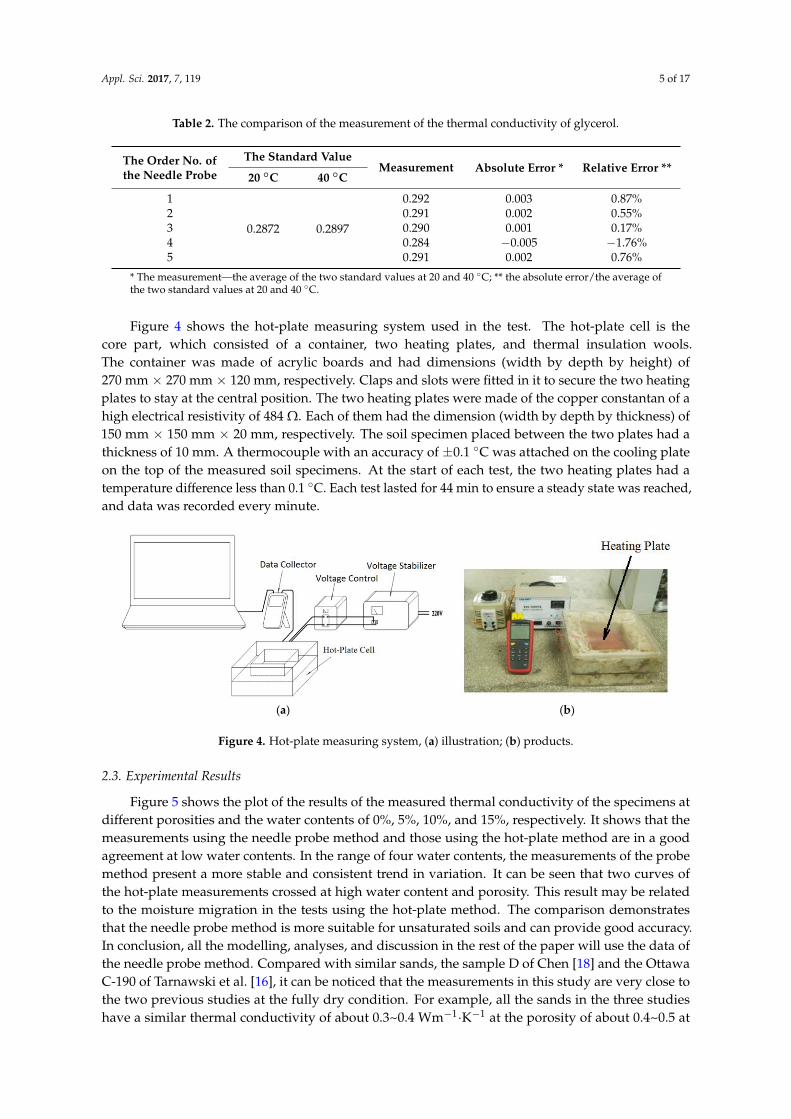
Figure 4 shows the hot-plate measuring system used in the test. The hot-plate cell is thecore part, which consisted of a container, two heating plates, and thermal insulation wools.The container was made of acrylic boards and had dimensions (width by depth by height) of270 mm × 270 mm × 120 mm, respectively. Claps and slots were fitted in it to secure the two heatingplates to stay at the central position. The two heating plates were made of the copper constantan of ahigh electrical resistivity of 484 Ω. Each of them had the dimension (width by depth by thickness) of150 mm × 150 mm × 20 mm, respectively. The soil specimen placed between the two plates had athickness of 10 mm. A thermocouple with an accuracy of ±0.1 C was attached on the cooling plateon the top of the measured soil specimens. At the start of each test, the two heating plates had atemperature difference less than 0.1 C. Each test lasted for 44 min to ensure a steady state was reached,and data was recorded every minute.
Appl. Sci. 2017, 7, 119 5 of 17
Table 2. The comparison of the measurement of the thermal conductivity of glycerol.
The Order No. of the
Needle Probe
The Standard Value Measurement Absolute Error * Relative Error **
20 °C 40 °C
1
0.2872 0.2897
0.292 0.003 0.87%
2 0.291 0.002 0.55%
3 0.290 0.001 0.17%
4 0.284 −0.005 −1.76%
5 0.291 0.002 0.76%
* The measurement—the average of the two standard values at 20 and 40 °C; ** the absolute error/the
average of the two standard values at 20 and 40 °C.
Figure 4 shows the hot-plate measuring system used in the test. The hot-plate cell is the core
part, which consisted of a container, two heating plates, and thermal insulation wools. The container
was made of acrylic boards and had dimensions (width by depth by height) of 270 mm × 270 mm ×
120 mm, respectively. Claps and slots were fitted in it to secure the two heating plates to stay at the
central position. The two heating plates were made of the copper constantan of a high electrical
resistivity of 484 Ω. Each of them had the dimension (width by depth by thickness) of 150 mm × 150
mm × 20 mm, respectively. The soil specimen placed between the two plates had a thickness of 10
mm. A thermocouple with an accuracy of ±0.1 °C was attached on the cooling plate on the top of the
measured soil specimens. At the start of each test, the two heating plates had a temperature difference
less than 0.1 °C. Each test lasted for 44 min to ensure a steady state was reached, and data was
recorded every minute.
(a) (b)
Figure 4. Hot-plate measuring system, (a) illustration; (b) products.
2.3. Experimental Results
Figure 5 shows the plot of the results of the measured thermal conductivity of the specimens at
different porosities and the water contents of 0%, 5%, 10%, and 15%, respectively. It shows that the
measurements using the needle probe method and those using the hot-plate method are in a good
agreement at low water contents. In the range of four water contents, the measurements of the probe
method present a more stable and consistent trend in variation. It can be seen that two curves of the
hot-plate measurements crossed at high water content and porosity. This result may be related to the
moisture migration in the tests using the hot-plate method. The comparison demonstrates that the
needle probe method is more suitable for unsaturated soils and can provide good accuracy. In
conclusion, all the modelling, analyses, and discussion in the rest of the paper will use the data of the
needle probe method. Compared with similar sands, the sample D of Chen [18] and the Ottawa C-
190 of Tarnawski et al. [16], it can be noticed that the measurements in this study are very close to the
two previous studies at the fully dry condition. For example, all the sands in the three studies have a
similar thermal conductivity of about 0.3~0.4 Wm−1·K−1 at the porosity of about 0.4~0.5 at the dry
condition. This demonstrates in another way that the three compared sands are quite close in
composition and particle distribution. However, it is also noticed that at other unsaturated and fully
saturated states, the thermal conductivity of the specimens in this study is much smaller than that of
Figure 4. Hot-plate measuring system, (a) illustration; (b) products.
2.3. Experimental Results
Figure 5 shows the plot of the results of the measured thermal conductivity of the specimens atdifferent porosities and the water contents of 0%, 5%, 10%, and 15%, respectively. It shows that themeasurements using the needle probe method and those using the hot-plate method are in a goodagreement at low water contents. In the range of four water contents, the measurements of the probemethod present a more stable and consistent trend in variation. It can be seen that two curves ofthe hot-plate measurements crossed at high water content and porosity. This result may be relatedto the moisture migration in the tests using the hot-plate method. The comparison demonstratesthat the needle probe method is more suitable for unsaturated soils and can provide good accuracy.In conclusion, all the modelling, analyses, and discussion in the rest of the paper will use the data ofthe needle probe method. Compared with similar sands, the sample D of Chen [18] and the OttawaC-190 of Tarnawski et al. [16], it can be noticed that the measurements in this study are very close tothe two previous studies at the fully dry condition. For example, all the sands in the three studieshave a similar thermal conductivity of about 0.3~0.4 Wm−1·K−1 at the porosity of about 0.4~0.5 at

Appl. Sci. 2017, 7, 119 6 of 17
the dry condition. This demonstrates in another way that the three compared sands are quite close incomposition and particle distribution. However, it is also noticed that at other unsaturated and fullysaturated states, the thermal conductivity of the specimens in this study is much smaller than that of thetwo similar samples of Chen [18] and Tarnawski et al. [16]. For example, at porosity of 0.466, the fullysaturated specimen of this work has a thermal conductivity of 1.6 Wm−1·K−1, however, the fullysaturated thermal conductivity of the sample D of Chen [18] is about 2.46 Wm−1·K−1 at porosityof 0.43, while the fully saturated thermal conductivity of the Ottawa C-190 of Tarnawski et al. [16]is about 3.4 Wm−1·K−1 at porosity of 0.4. The big difference is attributed to the difference in poresize distribution of the used specimens because this study took a significantly different preparationprocedure from that of the two previous studies.
Appl. Sci. 2017, 7, 119 6 of 17
the two similar samples of Chen [18] and Tarnawski et al. [16]. For example, at porosity of 0.466, the
fully saturated specimen of this work has a thermal conductivity of 1.6 Wm−1·K−1, however, the fully
saturated thermal conductivity of the sample D of Chen [18] is about 2.46 Wm−1·K−1 at porosity of
0.43, while the fully saturated thermal conductivity of the Ottawa C-190 of Tarnawski et al. [16] is
about 3.4 Wm−1·K−1 at porosity of 0.4. The big difference is attributed to the difference in pore size
distribution of the used specimens because this study took a significantly different preparation
procedure from that of the two previous studies.
Figure 5. The thermal conductivity vs. porosity at different water contents.
Figure 5 also shows that at 0% water content the variation of porosity presents the smallest
influence on the thermal conductivity. This can be explained in that the air content in soils has no
significant effect on the thermal conductivity due to its own low thermal transfer capacity. It is
noticed that water thermal conductivity is about 0.6 (W/(m·°C)) and air thermal conductivity one
order of magnitude less and near 0.024 (W/(m·°C)) at 25 °C. Therefore, the higher the water content
level, the more the conductive phase in the pore space and consequently the greater the thermal
conductivity. For that of the 5% and 10% water contents, the thermal conductivity decreases relatively
quickly with increasing porosity at the low porosity region. This may be related to the water
condensation, the phase change from vapour to liquid, and the capillary effect in the small pores at
low porosity. The condensed water bridges the void spaces between soil particles. With increasing
porosity, the pore size will increase correspondingly, and, as a result, the capillary condensation effect
will decrease. When many of the pores have reached a critical value in size, the capillary effect will
become too small to be easily noticed. This observation is supported by the 15% water content result,
which shows that the thermal conductivity decreases with the increase of porosity in an approximate
straight line (needle probe method), when there is little variation in the capillary condensed water,
and increase in the air content with the increasing porosity.
Figure 6 shows the variation of the thermal conductivity, measured using the needle probe
method, against the water contents and degrees of water saturation at different porosities. It can be
seen that initially with water increases from 0% to a relatively low content (10%), the thermal
conductivity increases in an approximately linear trend. Thereafter the linear increasing trend starts
to decrease until the content of 15%. The initial linear increase of thermal conductivity with the
increase of water content from 0% to 10% can be explained by the fact that the initial water forms an
evenly distributed water film coating on all pore surfaces of a constant surface area. The initial water
content increase corresponds to the water film thickness increase which gives a linear relation to
Figure 5. The thermal conductivity vs. porosity at different water contents.
Figure 5 also shows that at 0% water content the variation of porosity presents the smallestinfluence on the thermal conductivity. This can be explained in that the air content in soils has nosignificant effect on the thermal conductivity due to its own low thermal transfer capacity. It is noticedthat water thermal conductivity is about 0.6 (W/(m·C)) and air thermal conductivity one order ofmagnitude less and near 0.024 (W/(m·C)) at 25 C. Therefore, the higher the water content level,the more the conductive phase in the pore space and consequently the greater the thermal conductivity.For that of the 5% and 10% water contents, the thermal conductivity decreases relatively quicklywith increasing porosity at the low porosity region. This may be related to the water condensation,the phase change from vapour to liquid, and the capillary effect in the small pores at low porosity.The condensed water bridges the void spaces between soil particles. With increasing porosity, the poresize will increase correspondingly, and, as a result, the capillary condensation effect will decrease.When many of the pores have reached a critical value in size, the capillary effect will become too smallto be easily noticed. This observation is supported by the 15% water content result, which showsthat the thermal conductivity decreases with the increase of porosity in an approximate straight line(needle probe method), when there is little variation in the capillary condensed water, and increase inthe air content with the increasing porosity.
Appl. Sci. 2017, 7, 119 7 of 17
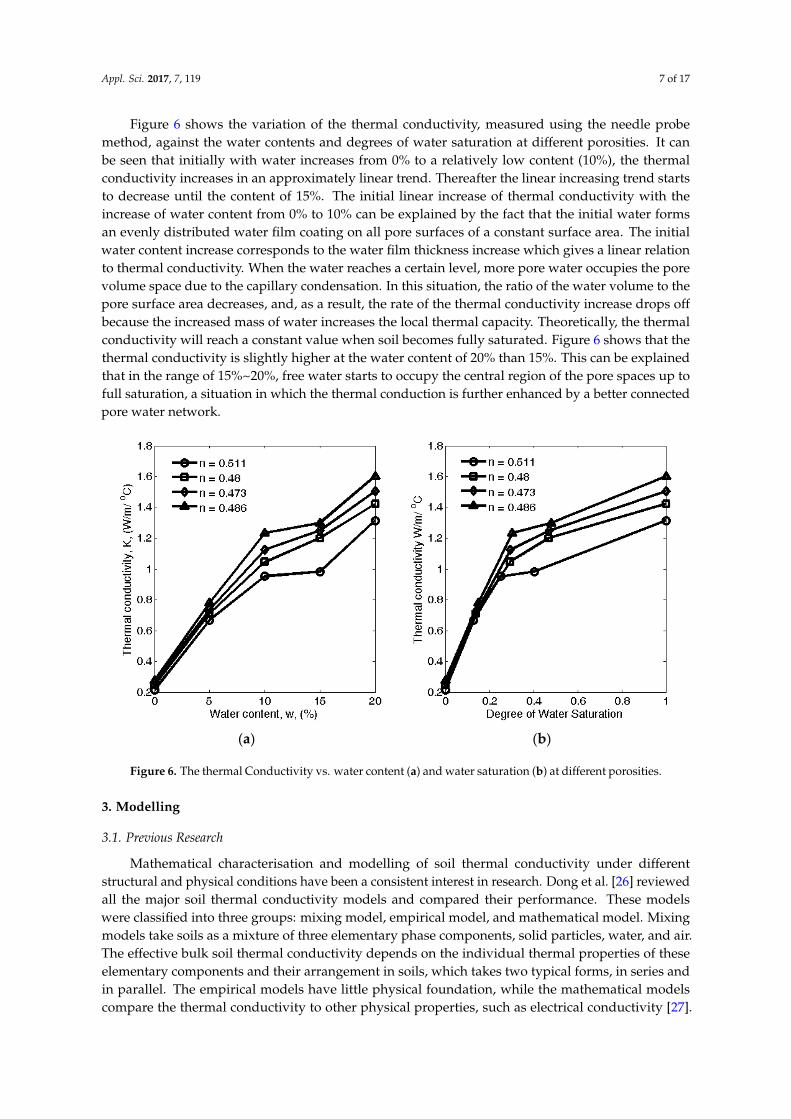
Figure 6 shows the variation of the thermal conductivity, measured using the needle probemethod, against the water contents and degrees of water saturation at different porosities. It canbe seen that initially with water increases from 0% to a relatively low content (10%), the thermalconductivity increases in an approximately linear trend. Thereafter the linear increasing trend startsto decrease until the content of 15%. The initial linear increase of thermal conductivity with theincrease of water content from 0% to 10% can be explained by the fact that the initial water formsan evenly distributed water film coating on all pore surfaces of a constant surface area. The initialwater content increase corresponds to the water film thickness increase which gives a linear relationto thermal conductivity. When the water reaches a certain level, more pore water occupies the porevolume space due to the capillary condensation. In this situation, the ratio of the water volume to thepore surface area decreases, and, as a result, the rate of the thermal conductivity increase drops offbecause the increased mass of water increases the local thermal capacity. Theoretically, the thermalconductivity will reach a constant value when soil becomes fully saturated. Figure 6 shows that thethermal conductivity is slightly higher at the water content of 20% than 15%. This can be explainedthat in the range of 15%~20%, free water starts to occupy the central region of the pore spaces up tofull saturation, a situation in which the thermal conduction is further enhanced by a better connectedpore water network.
Appl. Sci. 2017, 7, 119 7 of 17
thermal conductivity. When the water reaches a certain level, more pore water occupies the pore
volume space due to the capillary condensation. In this situation, the ratio of the water volume to the
pore surface area decreases, and, as a result, the rate of the thermal conductivity increase drops off
because the increased mass of water increases the local thermal capacity. Theoretically, the thermal
conductivity will reach a constant value when soil becomes fully saturated. Figure 6 shows that the
thermal conductivity is slightly higher at the water content of 20% than 15%. This can be explained
that in the range of 15%~20%, free water starts to occupy the central region of the pore spaces up to
full saturation, a situation in which the thermal conduction is further enhanced by a better connected
pore water network.
(a) (b)
Figure 6. The thermal Conductivity vs. water content (a) and water saturation (b) at different
porosities.
3. Modelling
3.1. Previous Research
Mathematical characterisation and modelling of soil thermal conductivity under different
structural and physical conditions have been a consistent interest in research. Dong et al. [26]
reviewed all the major soil thermal conductivity models and compared their performance. These
models were classified into three groups: mixing model, empirical model, and mathematical model.
Mixing models take soils as a mixture of three elementary phase components, solid particles, water,
and air. The effective bulk soil thermal conductivity depends on the individual thermal properties of
these elementary components and their arrangement in soils, which takes two typical forms, in series
and in parallel. The empirical models have little physical foundation, while the mathematical models
compare the thermal conductivity to other physical properties, such as electrical conductivity [27]. In
terms of the tests on varied soils, including sands, silts, and clay, it has been found that both the
mixing and mathematical models demonstrated an underperformance in general, because it is
difficult to adequately represent all the material characteristics related to the thermal conductivity of
soils, such as the particle geometry, pore size distribution, and the configuration of the water bridges
between particles or at the pore necks/throats. Recently, other new methods considering the involved
underlying physics have also been investigated. Tarnawski and Leong [28] put forward an
improvement for the geometrical mean model proposed by Woodside and Messmer [19] by
introducing an inter-particle thermal contact resistance factor to reflect the interaction between the
involved three phases (i.e., soil solids, water, and air). Ghanbarian and Daigle [29] presented a
percolation-based effective-medium approximation (P-EMA) model, in terms of the properties of the
elementary phases, a scaling exponent, and a percolation threshold. It has been concluded that the
Figure 6. The thermal Conductivity vs. water content (a) and water saturation (b) at different porosities.
3. Modelling
3.1. Previous Research
Mathematical characterisation and modelling of soil thermal conductivity under differentstructural and physical conditions have been a consistent interest in research. Dong et al. [26] reviewedall the major soil thermal conductivity models and compared their performance. These modelswere classified into three groups: mixing model, empirical model, and mathematical model. Mixingmodels take soils as a mixture of three elementary phase components, solid particles, water, and air.The effective bulk soil thermal conductivity depends on the individual thermal properties of theseelementary components and their arrangement in soils, which takes two typical forms, in series andin parallel. The empirical models have little physical foundation, while the mathematical modelscompare the thermal conductivity to other physical properties, such as electrical conductivity [27].

Appl. Sci. 2017, 7, 119 8 of 17
In terms of the tests on varied soils, including sands, silts, and clay, it has been found that boththe mixing and mathematical models demonstrated an underperformance in general, because it isdifficult to adequately represent all the material characteristics related to the thermal conductivityof soils, such as the particle geometry, pore size distribution, and the configuration of the waterbridges between particles or at the pore necks/throats. Recently, other new methods considering theinvolved underlying physics have also been investigated. Tarnawski and Leong [28] put forward animprovement for the geometrical mean model proposed by Woodside and Messmer [19] by introducingan inter-particle thermal contact resistance factor to reflect the interaction between the involved threephases (i.e., soil solids, water, and air). Ghanbarian and Daigle [29] presented a percolation-basedeffective-medium approximation (P-EMA) model, in terms of the properties of the elementary phases,a scaling exponent, and a percolation threshold. It has been concluded that the thermal conductivityunder fully and partially saturated conditions conforms to non-universal behaviour. Likos [15]predicted and compared the thermal conductivity and water retention curve of unsaturated soils basedon the water configuration retained in an idealized unit representative pore formed in a simple cubicpack of same sized spheres. Taking soils as a fractal structure to estimate the thermal conductivity hasalso been an effective approach [30]. Xiao et al. [31] made new progress in this direction.
So far, there has not been a comprehensive model able to effectively describe and generallydefine all the major underlying mechanisms involved in soil thermal conductivity. In practice, fittingempirical models to experimental data is still the most effective and popularly way employed for realworld applications [32,33]. Farouki [34] has given a comprehensive review on soil thermal conductivityempirical models. Later, Misra et al. [35] and Tang et al. [14] updated the list covering other newdevelopments. All of these models, however, were reported and tested on specific soils. Each of themhad a limit of application. So far there has not been an accepted model generally applicable on a widerange of soil types, porosities, and water contents. The recent review by Dong et al. [26] has comparedthe empirical models proposed by Kersten [36], Johansen [37], Cote and Konrad [38], Lu et al. [39],and Chen [18]. It showed that although these models had demonstrated better performance than themixing and mathematical models, they generally largely underestimated the thermal conductivity ofsands. In the next section of this paper, two of the principal types of empirical models for sands arecompared against the experimental data of this work. One type has a power function form and theother type an exponential function form. To investigate their range of application on different soils, thetwo types of model families are at first characterized into two general forms without specified constantvalues. The two characterized forms are then compared to model the experimental data of this paper.Finally, based on the recognition that an intrinsic relation between the water retention and thermalconductivity characteristics of unsaturated soils is established on the soil pore size distribution, thispaper investigates the use of a water retention characteristic model to describe the thermal conductivity.The performance of this so-called unified model is tested on the experimental data and compared withthe preceding two characterized empirical model forms.
3.2. Comparison of Two Major Types of Empirical Model
Ould-Lahoucine et al. [40] used the following Equation (2) to model the thermal conductivityof bentonites,
K = Kdry1 + [(9.75n− 0.706)Sw]0.285n+0.731 (2)
where Kdry is the dry soil thermal conductivity, and n and Sw are the porosity and the degree of watersaturation, respectively. Later, Chen [18] proposed a similar model in the form of Equation (3) forsandy soils.
K = KnwK1−n
s [(1− b)Sw + b]cn (3)
Appl. Sci. 2017, 7, 119 9 of 17
where Ks is the solid thermal conductivity, and Kw is the water thermal conductivity. Mathematically,these two forms may be characterised into a general expression as Equation (4).
K = K0
[1 + (aSw)
b]
(4a)
K0 = k0kn1 (4b)
a = a1n + a0 (4c)
b = b1n + b0 (4d)
where K0 and a and b are three parameters related to porosity, n, and k0, k1, a0, a1, b0, and b1 aresix constants, which can be regarded to depend all together upon the soil nature, elementary materialproperties, pore structure, and pore water configuration.
Donazzi et al. [41] proposed the following exponential formula for the thermal conductivity ofdifferent soils:
K = KnwK1−n
s exp[−3.08n(1− Sw)
2]
(5)
Later, Lu et al. [39] proposed a similar model, given by Equation (6) below, and tested it on a widerange of soils,
K =[Kn
wK1−ns − (b− an)
]exp
[c(1− Sc−1.33
w )]+ (b− an) (6)
These two models may also be characterised into a general mathematical formula as:
K = K0 exp[
a(1− Sw)b]+ c (7a)
K0 = kn + c (7b)
a = a1n + a0 (7c)
b = b1n + b0 (7d)
c = c1n + c0 (7e)
where K0 and a, b, and c are four parameters related to porosity, n, and k, a1, a0, b1, b0, c1, and c0
are seven constants, which depend together on the soil nature, elementary material properties, porestructure, and pore water configuration.
Figure 7 compares the modelling results using the two characterized general forms to fit themeasured thermal conductivity of the sands in this work at varied degrees of pore water saturationand porosities. The degrees of water saturation are calculated in terms of the results in Figure 6 andthe intrinsic relationship:
Sw =wρdry
nρw(8)
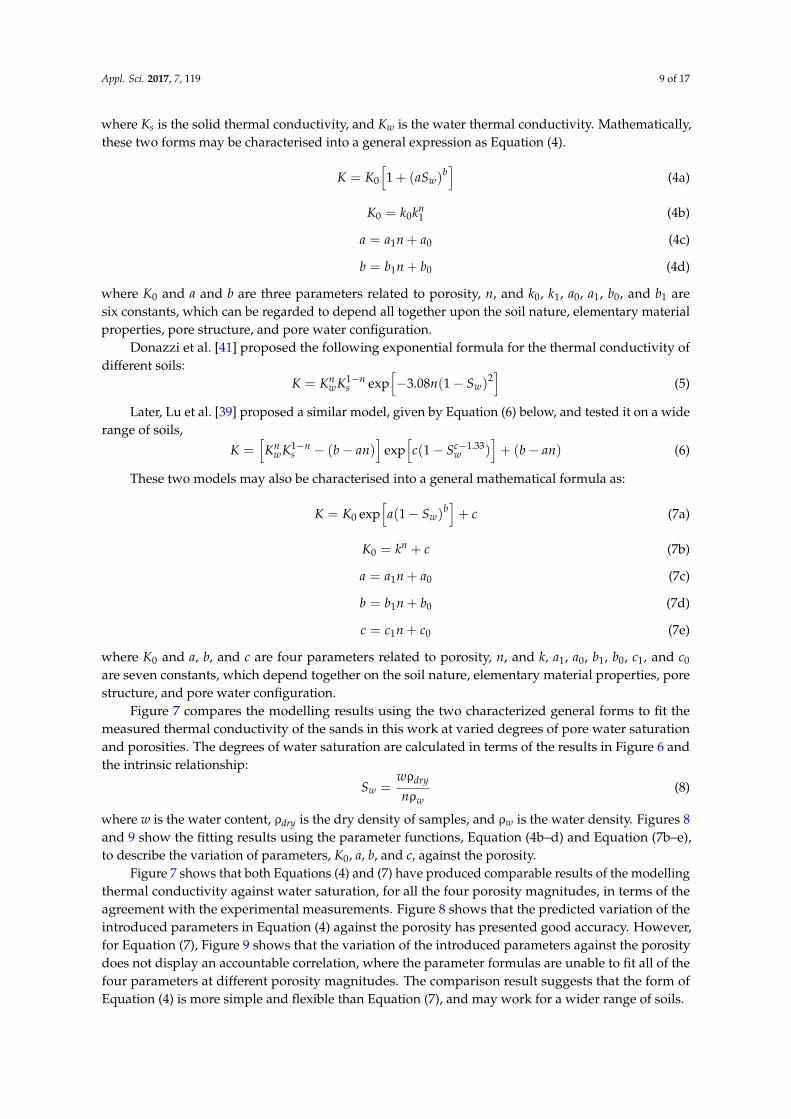
where w is the water content, ρdry is the dry density of samples, and ρw is the water density. Figures 8and 9 show the fitting results using the parameter functions, Equation (4b–d) and Equation (7b–e),to describe the variation of parameters, K0, a, b, and c, against the porosity.
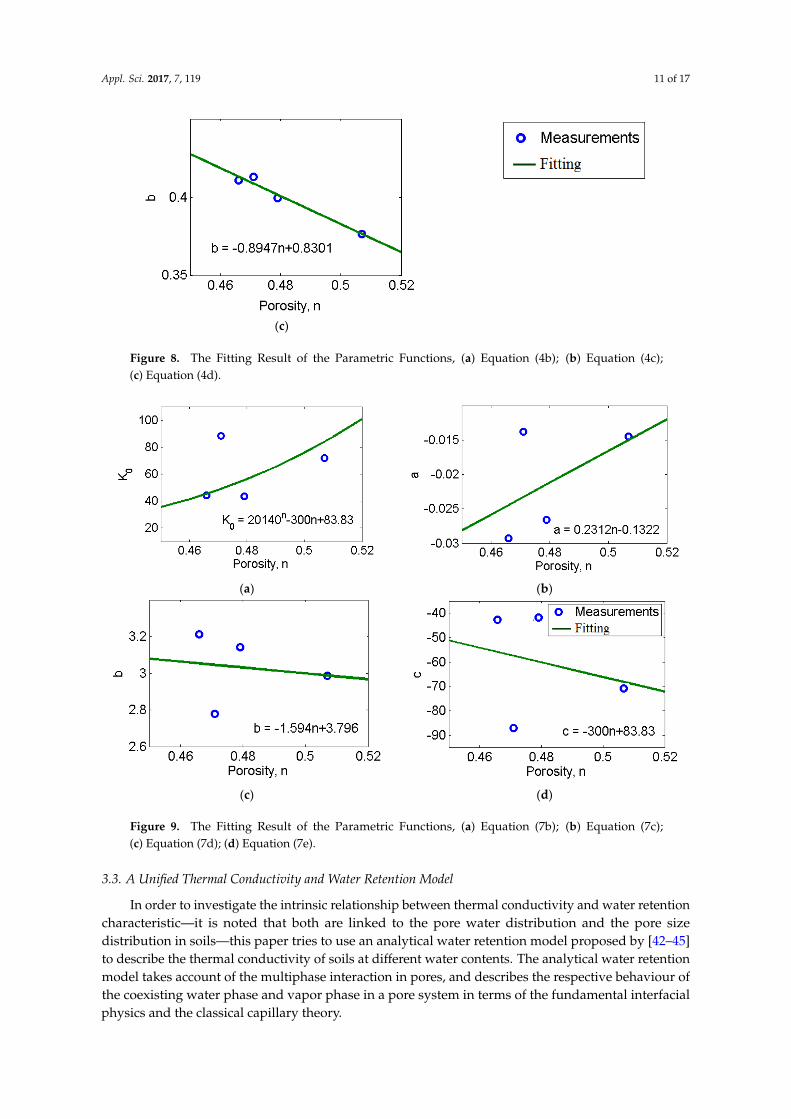
Figure 7 shows that both Equations (4) and (7) have produced comparable results of the modellingthermal conductivity against water saturation, for all the four porosity magnitudes, in terms of theagreement with the experimental measurements. Figure 8 shows that the predicted variation of theintroduced parameters in Equation (4) against the porosity has presented good accuracy. However,for Equation (7), Figure 9 shows that the variation of the introduced parameters against the porositydoes not display an accountable correlation, where the parameter formulas are unable to fit all of thefour parameters at different porosity magnitudes. The comparison result suggests that the form ofEquation (4) is more simple and flexible than Equation (7), and may work for a wider range of soils.

Appl. Sci. 2017, 7, 119 10 of 17Appl. Sci. 2017, 7, 119 10 of 17
(a) (b)
(c) (d)
Figure 7. The Modelling Results using Equations (4a) and (7a), (a) porosity n = 0.507; (b) porosity n =
0.479; (c) porosity n = 0.471; (d) porosity n = 0.466.
(a) (b)
Figure 7. The Modelling Results using Equations (4a) and (7a), (a) porosity n = 0.507; (b) porosityn = 0.479; (c) porosity n = 0.471; (d) porosity n = 0.466.
Appl. Sci. 2017, 7, 119 10 of 17
(a) (b)
(c) (d)
Figure 7. The Modelling Results using Equations (4a) and (7a), (a) porosity n = 0.507; (b) porosity n =
0.479; (c) porosity n = 0.471; (d) porosity n = 0.466.
(a) (b)
Figure 8. Cont.
Appl. Sci. 2017, 7, 119 11 of 17Appl. Sci. 2017, 7, 119 11 of 17
(c)
Figure 8. The Fitting Result of the Parametric Functions, (a) Equation (4b); (b) Equation (4c);
(c) Equation (4d).
(a) (b)
(c) (d)
Figure 9. The Fitting Result of the Parametric Functions, (a) Equation (7b); (b) Equation (7c);
(c) Equation (7d); (d) Equation (7e).
3.3. A Unified Thermal Conductivity and Water Retention Model
In order to investigate the intrinsic relationship between thermal conductivity and water
retention characteristic—it is noted that both are linked to the pore water distribution and the pore
size distribution in soils—this paper tries to use an analytical water retention model proposed by [42–
45] to describe the thermal conductivity of soils at different water contents. The analytical water
retention model takes account of the multiphase interaction in pores, and describes the respective
behaviour of the coexisting water phase and vapor phase in a pore system in terms of the
fundamental interfacial physics and the classical capillary theory.
Figure 8. The Fitting Result of the Parametric Functions, (a) Equation (4b); (b) Equation (4c);(c) Equation (4d).
Appl. Sci. 2017, 7, 119 11 of 17
(c)
Figure 8. The Fitting Result of the Parametric Functions, (a) Equation (4b); (b) Equation (4c);
(c) Equation (4d).
(a) (b)
(c) (d)
Figure 9. The Fitting Result of the Parametric Functions, (a) Equation (7b); (b) Equation (7c);
(c) Equation (7d); (d) Equation (7e).
3.3. A Unified Thermal Conductivity and Water Retention Model
In order to investigate the intrinsic relationship between thermal conductivity and water
retention characteristic—it is noted that both are linked to the pore water distribution and the pore
size distribution in soils—this paper tries to use an analytical water retention model proposed by [42–
45] to describe the thermal conductivity of soils at different water contents. The analytical water
retention model takes account of the multiphase interaction in pores, and describes the respective
behaviour of the coexisting water phase and vapor phase in a pore system in terms of the
fundamental interfacial physics and the classical capillary theory.
Figure 9. The Fitting Result of the Parametric Functions, (a) Equation (7b); (b) Equation (7c);(c) Equation (7d); (d) Equation (7e).
3.3. A Unified Thermal Conductivity and Water Retention Model
In order to investigate the intrinsic relationship between thermal conductivity and water retentioncharacteristic—it is noted that both are linked to the pore water distribution and the pore sizedistribution in soils—this paper tries to use an analytical water retention model proposed by [42–45]to describe the thermal conductivity of soils at different water contents. The analytical water retentionmodel takes account of the multiphase interaction in pores, and describes the respective behaviour ofthe coexisting water phase and vapor phase in a pore system in terms of the fundamental interfacialphysics and the classical capillary theory.
Appl. Sci. 2017, 7, 119 12 of 17
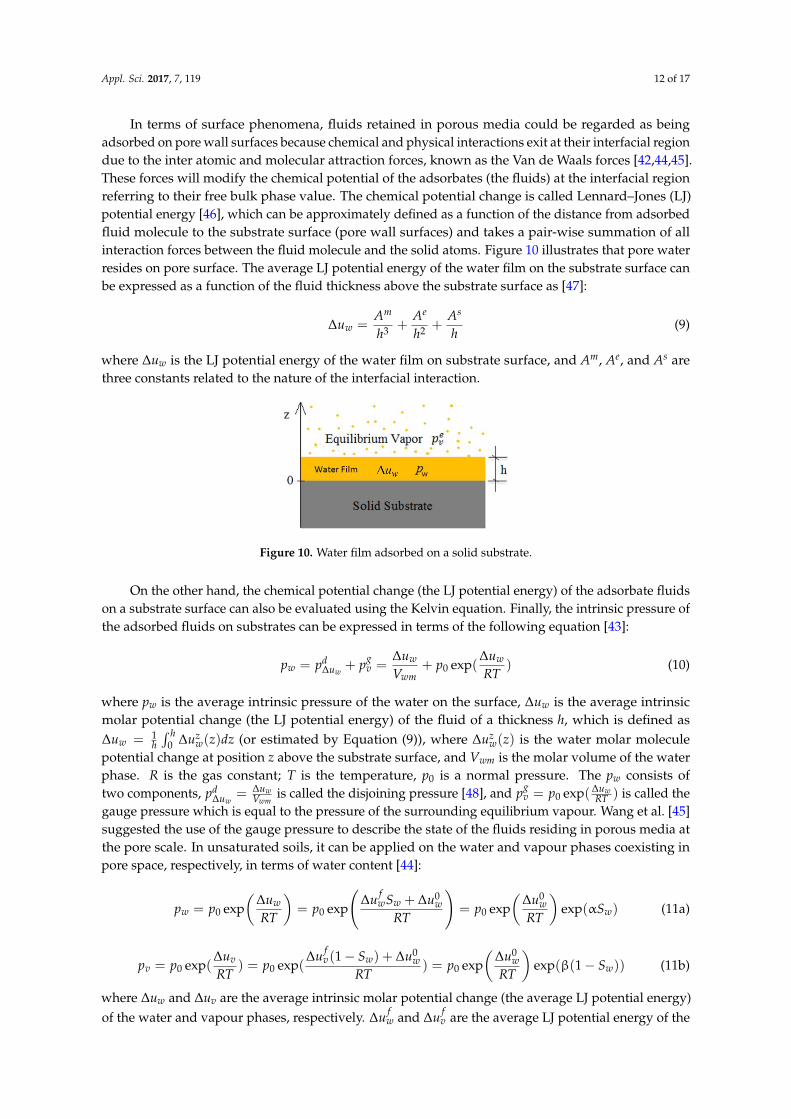
In terms of surface phenomena, fluids retained in porous media could be regarded as beingadsorbed on pore wall surfaces because chemical and physical interactions exit at their interfacial regiondue to the inter atomic and molecular attraction forces, known as the Van de Waals forces [42,44,45].These forces will modify the chemical potential of the adsorbates (the fluids) at the interfacial regionreferring to their free bulk phase value. The chemical potential change is called Lennard–Jones (LJ)potential energy [46], which can be approximately defined as a function of the distance from adsorbedfluid molecule to the substrate surface (pore wall surfaces) and takes a pair-wise summation of allinteraction forces between the fluid molecule and the solid atoms. Figure 10 illustrates that pore waterresides on pore surface. The average LJ potential energy of the water film on the substrate surface canbe expressed as a function of the fluid thickness above the substrate surface as [47]:
∆uw =Am
h3 +Ae
h2 +As
h(9)
where ∆uw is the LJ potential energy of the water film on substrate surface, and Am, Ae, and As arethree constants related to the nature of the interfacial interaction.
Appl. Sci. 2017, 7, 119 12 of 17
In terms of surface phenomena, fluids retained in porous media could be regarded as being
adsorbed on pore wall surfaces because chemical and physical interactions exit at their interfacial
region due to the inter atomic and molecular attraction forces, known as the Van de Waals forces
[42,44,45]. These forces will modify the chemical potential of the adsorbates (the fluids) at the
interfacial region referring to their free bulk phase value. The chemical potential change is called
Lennard–Jones (LJ) potential energy [46], which can be approximately defined as a function of the
distance from adsorbed fluid molecule to the substrate surface (pore wall surfaces) and takes a pair-
wise summation of all interaction forces between the fluid molecule and the solid atoms. Figure 10
illustrates that pore water resides on pore surface. The average LJ potential energy of the water film
on the substrate surface can be expressed as a function of the fluid thickness above the substrate
surface as [47]:
3 2
m e s
w
A A Au
hh h (9)
where Δuw is the LJ potential energy of the water film on substrate surface, and Am, Ae, and As are
three constants related to the nature of the interfacial interaction.
Figure 10. Water film adsorbed on a solid substrate.
On the other hand, the chemical potential change (the LJ potential energy) of the adsorbate fluids
on a substrate surface can also be evaluated using the Kelvin equation. Finally, the intrinsic pressure
of the adsorbed fluids on substrates can be expressed in terms of the following equation [43]:
0 exp( )w
d g w w
w u v
wm
u up p p p
V RT
(10)
where pw is the average intrinsic pressure of the water on the surface, wu is the average intrinsic
molar potential change (the LJ potential energy) of the fluid of a thickness h, which is defined as
0
1( )
hz
w wu u z dzh
(or estimated by Equation (9)), where ( )z
wu z is the water molar molecule
potential change at position z above the substrate surface, and Vwm is the molar volume of the water
phase. R is the gas constant; T is the temperature, p0 is a normal pressure. The pw consists of two
components, w
d w
u
wm
up
V
is called the disjoining pressure [48], and 0 exp( )g w
v
up p
RT
is called the
gauge pressure which is equal to the pressure of the surrounding equilibrium vapour. Wang et al.
[45] suggested the use of the gauge pressure to describe the state of the fluids residing in porous
media at the pore scale. In unsaturated soils, it can be applied on the water and vapour phases
coexisting in pore space, respectively, in terms of water content [44]:
0 0
0 0 0exp exp exp expf
w w w w w
w w
u u S u up p p p S
RT RT RT
(11a)
0 0
0 0 0
(1 )exp( ) exp( ) exp exp 1
f
v v w w w
v w
u u S u up p p p S
RT RT RT
(11b)
Figure 10. Water film adsorbed on a solid substrate.
On the other hand, the chemical potential change (the LJ potential energy) of the adsorbate fluidson a substrate surface can also be evaluated using the Kelvin equation. Finally, the intrinsic pressure ofthe adsorbed fluids on substrates can be expressed in terms of the following equation [43]:
pw = pd∆uw
+ pgv =
∆uw
Vwm+ p0 exp(
∆uw
RT) (10)
where pw is the average intrinsic pressure of the water on the surface, ∆uw is the average intrinsicmolar potential change (the LJ potential energy) of the fluid of a thickness h, which is defined as∆uw = 1
h
∫ h0 ∆uz
w(z)dz (or estimated by Equation (9)), where ∆uzw(z) is the water molar molecule
potential change at position z above the substrate surface, and Vwm is the molar volume of the waterphase. R is the gas constant; T is the temperature, p0 is a normal pressure. The pw consists oftwo components, pd
∆uw= ∆uw
Vwmis called the disjoining pressure [48], and pg
v = p0 exp(∆uwRT ) is called the
gauge pressure which is equal to the pressure of the surrounding equilibrium vapour. Wang et al. [45]suggested the use of the gauge pressure to describe the state of the fluids residing in porous media atthe pore scale. In unsaturated soils, it can be applied on the water and vapour phases coexisting inpore space, respectively, in terms of water content [44]:
pw = p0 exp(
∆uw
RT
)= p0 exp
(∆u f
wSw + ∆u0w
RT
)= p0 exp
(∆u0
wRT
)exp(αSw) (11a)
pv = p0 exp(∆uv
RT) = p0 exp(
∆u fv(1− Sw) + ∆u0
wRT
) = p0 exp(
∆u0w
RT
)exp(β(1− Sw)) (11b)
where ∆uw and ∆uv are the average intrinsic molar potential change (the average LJ potential energy)of the water and vapour phases, respectively. ∆u f
w and ∆u fv are the average LJ potential energy of the
Appl. Sci. 2017, 7, 119 13 of 17
water and vapour phases at the two states when the soil is fully water saturated and when all the porewater has just been fully drained, respectively. They depend on the average pore size and the natureof the respective interfacial interaction of the pore water and vapour phases with the solid phase at
the pore wall surface. α = ∆u fw
RT and β = ∆u fv
RT . ∆u0w is the initial chemical potential change of the first
bulk water starting to fill the initially empty pore space under the effect of capillary condensation(i.e., the chemical potential change of the initial water molecular film on the totally empty pore surfacejust at the start filling pores (Wang 2010)). Sw is the degree of water saturation. Equation (11) definesthe water and vapour states at the pore scale. Introducing in the volume average theorem to upscalethe two state equations from pore scale to bulk material scale, the average pore pressure of the waterand vapour phases in unsaturated soils can be described as:
〈pw〉 = 1Vpore
∫ Vw0 pwdVw
= 1Vpore
∫ VporeSw0 p0 exp
(∆u0
wRT
)exp(αSw)d(VporeSw)
=∫ Sw
0 p0 exp(
∆u0w
RT
)exp(αSw)dSw
= λ 1α [exp(αSw)− 1]
(12a)
〈pv〉 = 1Vpore
∫ Vv0 pvdVv
= 1Vpore
∫ Vpore(1−Sw)0 p0 exp
(∆u0
wRT
)exp(β(1− Sw))d(Vpore(1− Sw))
=∫ (1−Sw)
0 p0 exp(
∆u0w
RT
)exp(β(1− Sw))d(1− Sw)
= λ 1β [exp(β(1− Sw))− 1]
(12b)
where 〈pw〉 and 〈pv〉 are the volume average pore pressure of the water and vapour phases in
unsaturated soils, respectively. λ = p0 exp(
∆u0w
RT
)is a redefined constant. The Equation (12) can
be used to describe the water retention characteristic of unsaturated soils, the constitutive relationbetween the matrix suction, or capillary pressure and the water content. In conventional, matric suctionis taken as the pressure different between the pore air (vapour) and pore water phases coexisting insoils, i.e.,
〈s〉 = −〈pc〉 = −(〈pw〉 − 〈pv〉)= −
(λ 1α [exp(αSw)− 1]− λ 1
β [exp(β(1− Sw))− 1])
= λα −
λβ − λ
(1α exp(αSw)− 1
β exp(β(1− Sw))) (13)
where 〈s〉 is the matric suction, 〈pc〉 is called capillary pressure of bulk soils. At last, Equation (13) maybe rewritten in a simplified form as:
〈pc〉 = ϕ0 + P0[exp(αSw)− exp(β(1− Sw))] (14)
where ϕ0, P0, α, and β are four redefined parameters related to the pore structure and the nature of allthe material phases involved.
Equation (12) describes the state of the coexisting water and vapour phases in unsaturatedsoils in terms of their interaction with the solid phase at the interface. The derived Equation (14)has been successfully used to describe the water retention characteristic of unsaturated soils andbuilding materials [42,44,45]. It has been demonstrated that Equation (14) is able to represent the waterdistribution and the pore size distribution in porous media. Considering that the thermal conductivityof unsaturated soils is influenced by both the heat transfer at the interface between the soil particlesand the fluids retained in pores, which relates to the water distribution in the pore system, and with thenoticed resemblances between the variation of thermal conductivity against water content and water

Appl. Sci. 2017, 7, 119 14 of 17
retention characteristic curves, this paper applies Equation (14) for thermal conductivity modelling.To avoid confusion, Equation (14) is rewritten in the following form given by Equation (15) as
Ke f f = λ0 + K0[exp(αSw)− exp(β(1− Sw))] (15)
where Keff is called the effective thermal conductivity, λ0, K0, α, and β are four redefined parametersdepending on the pore structure and the material nature of all phases.
Figure 11 compares the modelling results using Equations (4) and (15) for the reported experimentdata of this paper, respectively. It can be seen that Equation (15) gives impressively close agreement tothe experiment data in comparison to Equation (4) in all of the four cases of different porosities. Table 3lists out the values of the four parameters defined in Equation (15). This suggests that Equation (15)can be used as a unified model for both the thermal conductivity and water retention characteristics ofunsaturated soils. However, a deeper understanding the underlying mechanisms of the model workingfor the two constitutive soil properties and verification on a large experimental data of different soilsstill need to be studied, and represent continuing research.
Table 3. The Fitting Parameter Results using Equation (15).
Porosity, n λ0 K0 α β
0.507 1.055 0.001064 5.495 6.6790.479 1.335 0.02028 1.649 4.0040.471 1.416 0.02598 1.469 3.8180.466 1.443 0.01697 2.323 4.256
Appl. Sci. 2017, 7, 119 14 of 17
where ϕ0, P0, α, and β are four redefined parameters related to the pore structure and the nature of
all the material phases involved.
Equation (12) describes the state of the coexisting water and vapour phases in unsaturated soils
in terms of their interaction with the solid phase at the interface. The derived Equation (14) has been
successfully used to describe the water retention characteristic of unsaturated soils and building
materials [42,44,45]. It has been demonstrated that Equation (14) is able to represent the water
distribution and the pore size distribution in porous media. Considering that the thermal
conductivity of unsaturated soils is influenced by both the heat transfer at the interface between the
soil particles and the fluids retained in pores, which relates to the water distribution in the pore
system, and with the noticed resemblances between the variation of thermal conductivity against
water content and water retention characteristic curves, this paper applies Equation (14) for thermal
conductivity modelling. To avoid confusion, Equation (14) is rewritten in the following form given
by Equation (15) as
0 0 exp( ) exp( (1 ))eff w wK K S S (15)
where Keff is called the effective thermal conductivity, λ0, K0, α, and β are four redefined parameters
depending on the pore structure and the material nature of all phases.
Figure 11 compares the modelling results using Equations (4) and (15) for the reported
experiment data of this paper, respectively. It can be seen that Equation (15) gives impressively close
agreement to the experiment data in comparison to Equation (4) in all of the four cases of different
porosities. Table 3 lists out the values of the four parameters defined in Equation (15). This suggests
that Equation (15) can be used as a unified model for both the thermal conductivity and water
retention characteristics of unsaturated soils. However, a deeper understanding the underlying
mechanisms of the model working for the two constitutive soil properties and verification on a large
experimental data of different soils still need to be studied, and represent continuing research.
Table 3. The Fitting Parameter Results using Equation (15).
Porosity, n λ0 K0 α β
0.507 1.055 0.001064 5.495 6.679
0.479 1.335 0.02028 1.649 4.004
0.471 1.416 0.02598 1.469 3.818
0.466 1.443 0.01697 2.323 4.256
(a) (b)
Appl. Sci. 2017, 7, 119 15 of 17
(c) (d)
Figure 11. The Modelling Results using Equations (4) and (15), (a) porosity n = 0.507; (b) porosity n =
0.479; (c) porosity n = 0.471; (d) porosity n = 0.466.
4. Conclusions
From the reported experimental work, modelling, and discussion, the following conclusions can
be drawn:
The needle probe method provides a convenient and accurate approach to measure unsaturated
soil thermal conductivity.
At a certain water content, the thermal conductivity of sandy soil decreases with increasing
porosity due the increase in the air content. At a certain porosity, the thermal conductivity of
sandy soil increases with the water content due to the decrease in the air content. Capillary
condensation plays an important role on the thermal conductivity at low water content and low
porosity with small pore sizes because the condensed water will affect the ratio of the water
volume to total pore surface area.
There are two major types of empirical model proposed, which can be generalised as
representing an exponential function and power function, respectively. The characterised
exponential function has showed a good result for the thermal conductivity of soils of a certain
porosity at varied water contents. However, the power function has showed a better
performance for the conditions of both varied water contents and porosities.
Intrinsically, the thermal conductivity at varied water content and porosity is related to the pore
size distribution. Due to the intrinsic relation and the dependence on similar factors, both the
thermal conductivity and water retention characteristics of unsaturated soils can be described
using a unified model, which has demonstrated good accuracy.
Acknowledgments: The experimental work was funded by the National Natural Science Foundation of China
(NSFC). Project No. 41372247.
Author Contributions: Hua Jin conceived and designed the experiments; Hua Jin, Qiang Zheng and Hu Liu
performed the experiments; Yu Wang and Hua Jin analyzed the data; Yu Wang did the modelling, analysis and
discussion; Yu Wang, Hua Jin and Edmund Chadwick wrote the paper.
Conflicts of Interest: The authors declare no conflict of interest.
References
1. Yuan, Y.; Jib, H.; Duc, Y.; Cheng, B. Semi-analytical solution of roof-on-grade attached underground
engineering envelope. Build. Environ. 2008, 43, 1138–1146.
2. Bai, Y.; Niedzwecki, J.M. Modeling deepwater seabed steady-state thermal fields around buried pipeline
including trenching and backfill effects. Comput. Geotech. 2014, 61, 221–222.
Figure 11. The Modelling Results using Equations (4) and (15), (a) porosity n = 0.507; (b) porosityn = 0.479; (c) porosity n = 0.471; (d) porosity n = 0.466.

Appl. Sci. 2017, 7, 119 15 of 17
4. Conclusions
From the reported experimental work, modelling, and discussion, the following conclusions canbe drawn:
• The needle probe method provides a convenient and accurate approach to measure unsaturatedsoil thermal conductivity.
• At a certain water content, the thermal conductivity of sandy soil decreases with increasingporosity due the increase in the air content. At a certain porosity, the thermal conductivity ofsandy soil increases with the water content due to the decrease in the air content. Capillarycondensation plays an important role on the thermal conductivity at low water content and lowporosity with small pore sizes because the condensed water will affect the ratio of the watervolume to total pore surface area.
• There are two major types of empirical model proposed, which can be generalised as representingan exponential function and power function, respectively. The characterised exponential functionhas showed a good result for the thermal conductivity of soils of a certain porosity at varied watercontents. However, the power function has showed a better performance for the conditions ofboth varied water contents and porosities.
• Intrinsically, the thermal conductivity at varied water content and porosity is related to the poresize distribution. Due to the intrinsic relation and the dependence on similar factors, both thethermal conductivity and water retention characteristics of unsaturated soils can be describedusing a unified model, which has demonstrated good accuracy.
Acknowledgments: The experimental work was funded by the National Natural Science Foundation of China(NSFC). Project No. 41372247.
Author Contributions: Hua Jin conceived and designed the experiments; Hua Jin, Qiang Zheng and Hu Liuperformed the experiments; Yu Wang and Hua Jin analyzed the data; Yu Wang did the modelling, analysis anddiscussion; Yu Wang, Hua Jin and Edmund Chadwick wrote the paper.
Conflicts of Interest: The authors declare no conflict of interest.
References
1. Yuan, Y.; Jib, H.; Duc, Y.; Cheng, B. Semi-analytical solution of roof-on-grade attached undergroundengineering envelope. Build. Environ. 2008, 43, 1138–1146. [CrossRef]
2. Bai, Y.; Niedzwecki, J.M. Modeling deepwater seabed steady-state thermal fields around buried pipelineincluding trenching and backfill effects. Comput. Geotech. 2014, 61, 221–222. [CrossRef]
3. Vipulanandan, C.; Kulkarni, S.P. Shear bonding and thermal properties of particle-filled polymer grout forpipe-in-pipe application. J. Mater. Civ. Eng. 2007, 19, 583–590. [CrossRef]
4. Vollaro, R.; Fontana, L.; Vallati, A. Experimental study of thermal field deriving from an undergroundelectrical power cable buried in non-homogeneous soils. Appl. Therm. Eng. 2014, 62, 390–397. [CrossRef]
5. Al-Saud, M.S.; El-Kady, M.A.; Findlay, R.D. A new approach to underground cable performance assessment.Electr. Power Syst. Res. 2008, 78, 907–918. [CrossRef]
6. Mimouni, T.; Dupray, F.; Laloui, L. Estimating the geothermal potential of heat-exchanger anchors onacut-and-cover tunnel. Geothermics 2014, 51, 380–387. [CrossRef]
7. García-Gil, A.; Vázquez-Suñe, E.; Alcaraz, M.M.; Juan, A.S.; Sánchez-Navarro, J.A.; Montlleó, M.;Rodríguez, G.; Lao, J. GIS-supported mapping of low-temperature geothermal potential taking groundwaterflow into account. Renew. Energy 2015, 77, 268–278. [CrossRef]
8. Tye-Gingras, M.; Gosselin, L. Generic ground response functions for ground exchangers in the presence ofgroundwater flow. Renew. Energy 2014, 72, 354–366. [CrossRef]
9. Mohamed, M.; El-Kezza, O.; Abdel-Aal, M.; Schellart, A.; Tait, S. Effects of coolant flow rate, groundwatertable fluctuations and infiltration of rainwater on the efficiency of heat recovery from near surface soil layers.Geothermics 2015, 53, 171–182. [CrossRef]
10. Nakhaei, M.; Šimunek, J. Parameter estimation of soil hydraulic and thermal property functions forunsaturated porous media using the HYDRUS-2D code. J. Hydrol. Hydromech. 2014, 62, 7–15.
Appl. Sci. 2017, 7, 119 16 of 17
11. Bozzoli, F.; Pagliarini, G.; Rainieri, S.; Schiavi, L. Estimation of soil and grout thermal properties through aTSPEP (two-step parameter estimation procedure) applied to TRT (thermal response test) data. Energy 2011,36, 839–846. [CrossRef]
12. Abuel-Naga, H.M.; Bergado, D.T.; Bouazza, A.; Pender, M.J. Thermal conductivity of soft Bangkok clay fromlaboratory and field measurements. Eng. Geol. 2009, 105, 211–219. [CrossRef]
13. O’Donnell, J.A.; Romanovsky, V.E.; Harden, J.W.; McGuire, D.A. The Effect of Moisture Content on theThermal Conductivity of Moss and Organic Soil Horizons from Black Spruce Ecosystems in Interior Alaska.Soil Sci. 2009, 174, 646–651. [CrossRef]
14. Tang, A.; Cui, Y.; Le, T. A study on the thermal conductivity of compacted bentonites. Appl. Clay Sci. 2008,41, 181–189. [CrossRef]
15. Loikos, W.J. Pore-scale model for thermal conductivity of unsaturated sands. Geotech. Geol. Eng. 2015, 33,179–192. [CrossRef]
16. Tarnawski, V.R.; McCombie, M.L.; Momose, T.; Sakaguchi, I.; Leong, W.H. Thermal Conductivity of StandardSands. Part III. Full Range of Saturation. Int. J. Thermophys. 2013, 34, 1130–1147. [CrossRef]
17. Smits, K.M.; Sakaki, T.; Limsuwat, A.; Illangasekare, T.H. Thermal Conductivity of Sands under VaryingMoisture and Porosity in Drainage–Wetting Cycles. Vadose Zone J. 2010, 9, 172–180. [CrossRef]
18. Chen, S. Thermal conductivity of sands. Heat Mass Transf. 2008, 44, 1241–1246. [CrossRef]19. Woodside, W.; Messmer, J.H. Thermal Conductivity of Porous Media. I. Unconsolidated Sands. J. Appl. Phys.
1961, 32, 1688. [CrossRef]20. De Vries, D.A. Thermal properties of soils. In Physics of Plant Environment; van Wijk, W.R., Ed.; North Holland
Publishing Company: Amsterdam, The Netherlands, 1963.21. Likos, W.J.; Olson, H.S.; Jaafar, R. Comparison of Laboratory Methods for Measuring Thermal Conductivity of
Unsaturated Soils. In Proceedings of the GeoCongress, Oakland, CA, USA, 25–29 March 2012; pp. 4366–4376.22. Low, J.E.; Loveridge, F.A.; Powrie, W. Measuring soil thermal properties for use in energy foundation design.
In Proceedings of the 18th International Conference on Soil Mechanics and Geotechnical Engineering, Paris,France, 2–6 September 2013; pp. 3375–3378.
23. Low, J.E.; Loveridge, F.; Powrie, W. Thermal conductivity of soils by the needle probe method, for energyfoundation applications. In Proceedings of the 32nd International Thermal Conductivity Conference and20th International Thermal Expansion Symposium, Lafeyette, IN, USA, 27 April–1 May 2014; p. 11.
24. Alrtimi, A.; Rouainia, M.; Manning, D.A.C. An improved steady-state apparatus for measuring thermalconductivity of soils. Int. J. Heat Mass Transf. 2014, 72, 630–636. [CrossRef]
25. Standard for Hydrogeological Investigation of Water-Supply (GB 50027–2001); China Planning Press: Beijing,China, 2001.
26. Dong, Y.; McCartney, J.S.; Lu, N. Critical Review of Thermal Conductivity Models for Unsaturated Soils.Geotech. Geol. Eng. 2015, 33, 207–221. [CrossRef]
27. Jougnot, D.; Revil, A. Thermal conductivity of unsaturated clay-rocks. Hydrol. Earth Syst. Sci. 2010, 14, 91–98.[CrossRef]
28. Tarnawski, V.R.; Leong, W.H. Advanced Geometric Mean Model for Predicting Thermal Conductivity ofUnsaturated Soils. Int. J. Thermophys. 2016, 37, 18. [CrossRef]
29. Ghanbarian, B.; Daigle, H. Thermal conductivity in porous media: Percolation-based effective-mediumapproximation. Water Resour. Res. 2016, 52, 295–314. [CrossRef]
30. Lehmann, P.; Stähli, M.; Papritz, A.; Gygi, A.; Flühler, H. A Fractal Approach to Model Soil Structure and toCalculate Thermal Conductivity of Soils. Transp. Porous Media 2003, 52, 313–332. [CrossRef]
31. Xiao, B.; Yang, Y.; Chen, L.X. Developing a novel form of thermal conductivity of nanofluids with Brownianmotion effect by means of fractal geometry. Powder Technol. 2013, 239, 409–414. [CrossRef]
32. Cai, G.; Zhang, T.; Puppala, A.J.; Liu, S. Thermal characterization and prediction model of typical soils inNanjing area of China. Eng. Geol. 2015, 191, 23–30. [CrossRef]
33. Nikiforova, T.; Savytskyi, M.; Limam, K.; Bosschaerts, W.; Belarbi, R. Methods and Results of ExperimentalResearches of Thermal Conductivity of Soils. Energy Procedia 2013, 42, 775–783. [CrossRef]
34. Farouki, O.T. Thermal Properties of Soils; Trans Tech Publications: Rockport, MA, USA, 1986.35. Misra, A.; Becker, B.R.; Fricke, B.A. A Theoretical Model of the Thermal Conductivity of Idealized Soil.
HVAC R Res. 1995, 1, 81–96. [CrossRef]
Appl. Sci. 2017, 7, 119 17 of 17
36. Kersten, M.S. Laboratory Research for the Determination of the Thermal Properties of Soils; Technical Report 23;Research Laboratory Investigations, Engineering Experiment Station, University of Minnesota: Minneapolis,MN, USA, 1949.
37. Johansen, O. Thermal Conductivity of Soils. N.H. CRREL Draft English Translation 637. Ph.D. Thesis,University of Trondheim, Trondheim, Norway, 1975.
38. Cote, J.; Konrad, J.M. A generalized thermal conductivity model for soils and construction materials.Can. Geotech. J. 2005, 42, 443–458. [CrossRef]
39. Lu, S.; Ren, T.; Gong, Y.; Horton, R. An improved model for predicting soil thermal conductivity from watercontent at room temperature. Soil Sci. Soc. Am. J. 2007, 71, 8–14. [CrossRef]
40. Ould-Lahoucine, C.; Sakashita, H.; Kumada, T. Measurement of thermal conductivity of buffer materialsand evaluation of existing correlations predicting it. Nucl. Eng. Des. 2002, 216, 1–11. [CrossRef]
41. Donazzi, F.; Occhini, E.; Seppi, A. Soil Thermal and hydrological characteristics in designing underground.Proc. Inst. Electr. Eng. 1979, 126, 506–516. [CrossRef]
42. Wang, Y.; Wu, G. Understanding and modelling of soil-water characteristic curves. Chin. J. Geotech. Eng.2008, 30, 1282–1290.
43. Wang, Y.; Grove, S.M.; Anderson, M.G. A physical-chemical model for the static water retention characteristicof unsaturated porous media. Adv. Water Resour. 2008, 31, 723–735. [CrossRef]
44. Wang, Y. Phase deterministic modelling of water retention in unsaturated porous media and its potential indynamic unsaturated flow application. J. Porous Media 2010, 13, 261–270. [CrossRef]
45. Wang, Y.; Wang, X.Y.; Scholz, M.; Ross, D.K. A physico-chemical model for the water vapour sorptionisotherm of hardened cementitious materials. Constr. Build. Mater. 2012, 35, 941–946. [CrossRef]
46. McCash, E.M. Surface Chemistry; Oxford University Press: Oxford, UK, 2001.47. Tuller, M.; Or, D.; Dudley, L.M. Adsorption and capillary condensation in porous media: Liquid retention
and interfacial configuration in angular pores. Water Resour. Res. 1999, 35, 1949–1964. [CrossRef]48. Derjaguin, B.; Obuchov, E. Acta Physicochimica U.R.S.S.; Academy of Sciences of the U.S.S.R.: Moskva,
Russia, 1936.
© 2017 by the authors; licensee MDPI, Basel, Switzerland. This article is an open accessarticle distributed under the terms and conditions of the Creative Commons Attribution(CC BY) license (http://creativecommons.org/licenses/by/4.0/).