experimental research on seismic behavior of...
TRANSCRIPT
1
EXPERIMENTAL RESEARCH ON SEISMIC BEHAVIOR
OF PRESTRESSED BRICK MASONRY BUILDINGS
Luo Wankang1, Xiang Hui2, and Li Xijun3
ABSTRACT
By testing two 1:2 prestressed and non-prestressed brick masonry building models with tie beams and tie columns under horizontal low-cycle loads, the appearance and development of cracks, stiffness, ductility, energy dissipation of the buildings were studied. Analysis of the test results indicates that prestressing on brick masonry not only can increases the anti-cracking ability to some extent, but also improves evidently the behavior of deformation and ductility. The results of this study can provide important theoretical and experimental foundation for application of the pretressed brick masonry buildings in seismic zones.
Key Words: Prestressed; low-cycle load; ductility; energy dissipation
1Professor, Civil Engineering Dep. Chongqing JianZhu University, Chongqing, 400045,
China. E-mail: [email protected] 2Student, Civil Engineering Dep. Chongqing JianZhu University, Chongqing, 400045,
China. E-mail: [email protected] 3Student, Civil Engineering Dep. Chongqing JianZhu University, Chongqing, 400045,
China. E-mail: [email protected]
2
INTRODUCTION
In order to research the seismic behavior of the prestressed brick masonry buildings,
another two three-story-double-room brick masonry building models under horizontal
low-cycle loads were tested based to extend the authors’ previous work. Same as the
experiments on the single brick walls (Li 2000) the steel bars were installed in the tie
columns and then pretressed, so the brick panels was prestressed through the
elastic-groundsill-beam-effects exerted by the ring beams. The aim was to
comprehensively promote seismic behave of the prestressed brick masonry buildings.
Additionally, the bend influence resulted from the increase of stories and heights shouldn’t
be ignored. The experiments will provide worthy inference resource for engineering
application of the prestressed brick masonry buildings.
DETAILS OF THE EXPERIMENT
Model Specimens
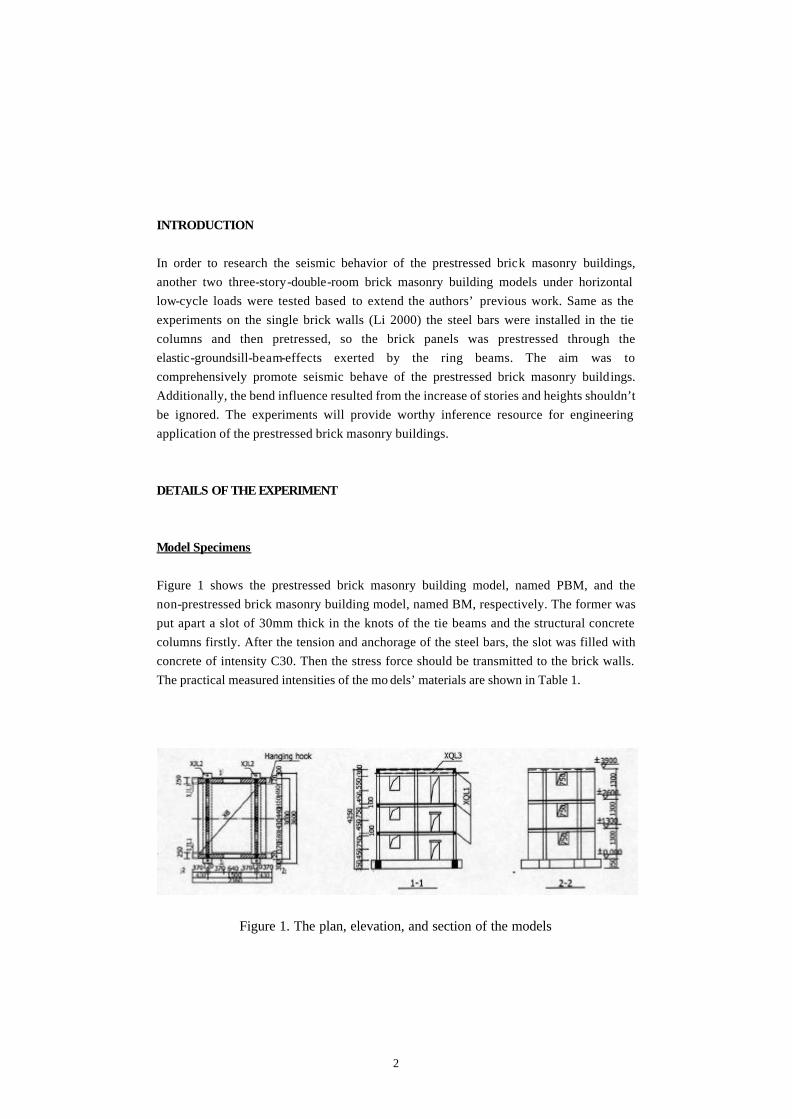
Figure 1 shows the prestressed brick masonry building model, named PBM, and the
non-prestressed brick masonry building model, named BM, respectively. The former was
put apart a slot of 30mm thick in the knots of the tie beams and the structural concrete
columns firstly. After the tension and anchorage of the steel bars, the slot was filled with
concrete of intensity C30. Then the stress force should be transmitted to the brick walls.
The practical measured intensities of the mo dels’ materials are shown in Table 1.
Figure 1. The plan, elevation, and section of the models

3
Table 1. The practical measured intensities of the models’ materials
Mortar (M) Concrete fcu,m Steels fy
Material Brick (MU) BM PBM Basement
beam BM PBM �4 �8 �L12
Intensity (N/mm2)
12.2 5.12 4.90 29.9 23.6 18.3 480 418 442
LOADING INSTRUMENTS AND LOADING SCHEME
The loading instruments used in the test can are shown in Figure 2.
Vertical loading. The vertical loads were exerted with weights. The weights of the first
and the second floor were both 1.26 ton
and that of the third floor was 4.41 ton.
Although only three stories had been
made in the model because of the
limitation of lifting capacity of the lab,
the walls of the fourth floor and roof
loads had been counted within the third
floor. Through computing and adjusting,
the location of the resultant force of
reversed triangle seismic action
approaches the gravity center of the ring
beam in the third floor, so it is regarded
as the point of horizontal loading. Figure 2. Loading instrument drawing Prestessing through post-tension method. Tension controlled stress was taken as�
con=0.6fpyk=265.2Mpa. After the anchorage of the prestessed steels, the slot was filled with
concrete of intensity C30. When PBM reached the required intensity, the horizontal loads
were loaded.
Horizontal loading. It was controlled with load before cracking and with displacement
after cracking, circulating three times each step of loading.
MEASUREMENT METHOD
The following quantities were measured with the strain pieces and displacement meters
shown in Figure 3 and Figure 4:
(1)The change of strains of the steels and brick walls measured with stain pieces to
determine the initial values and the loss values of the prestress;
(2) The distribution of the compressive stress caused by the elastic-groundsill-beam-effect

4
of the ring beams after prestressed; (3) V-� hysteretic curve;
(4) The stress change of measured points after loaded;
(5) The appearance, development of the cracks and the destruction process of the models.
Figure 3. Stain pieces Figure 4. Stain pieces
drawing of horizontal walls drawing of vertical walls
ANALYSIS OF THE RESULTS
Primary analysis of the experiment results
The experimental results are shown in Table 2.
Table 2. Primary analysis of the experimental results State of cracking
State of Ultimation
Vertical compression
Average shear
intensity Deforming pattern
crV / uV
crV / uV crV / uV
Mod
el
crV
(KN)
�cr
(mm) uV
(KN)
�u
(mm)
�o, �op
(N/mm2) crV /A
(N/mm2)
Pre- cracking
Post - cracking
BM 140 11.07 180 46.19 �o=0.360 0.194 Shearing
Type
Bend- Shearing
Type 0.78 1.43 1.31
PBM 160 10.12 235 55.41 �o=0.360 �op=0.307
0.222 0.68
The Process, state, and mechanism of the damage
For convenience, the models are described by four sides, east, south, west, and north,
among which the side nearing resistance wall is determined to be the east side. The states
of cracking and destruction of the models, shown in figure 5, are presented respectively as
follows:
5
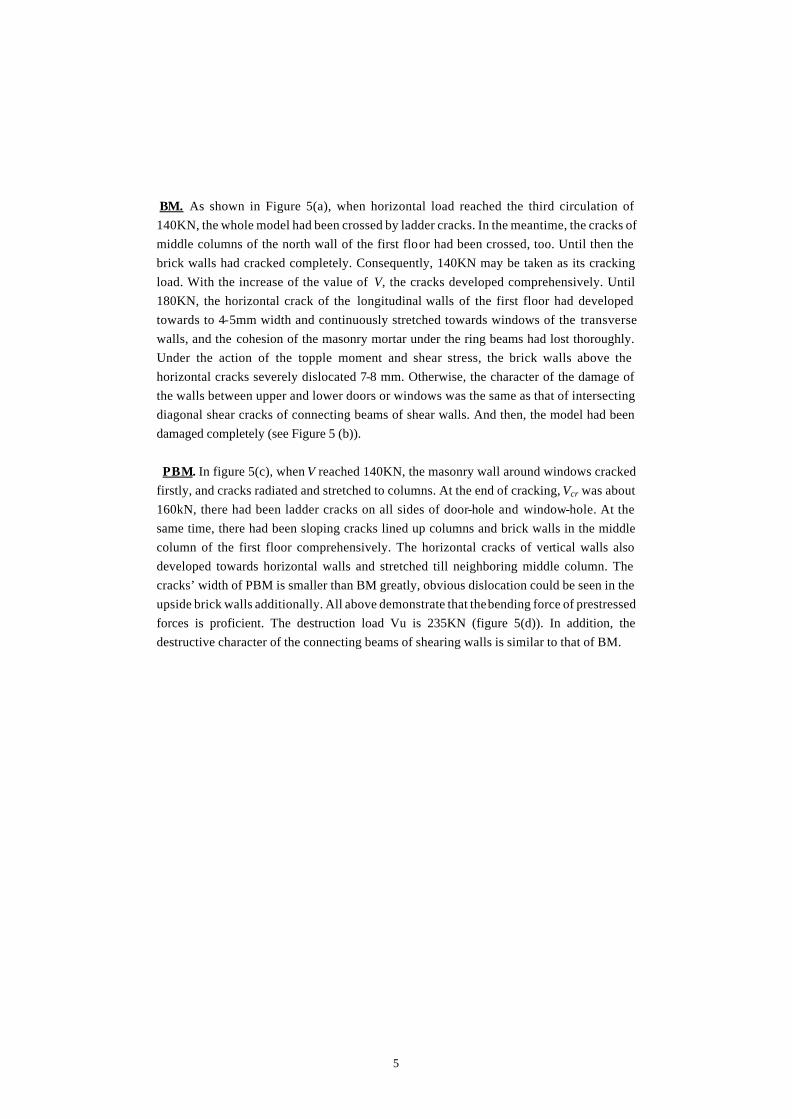
BM. As shown in Figure 5(a), when horizontal load reached the third circulation of
140KN, the whole model had been crossed by ladder cracks. In the meantime, the cracks of
middle columns of the north wall of the first floor had been crossed, too. Until then the
brick walls had cracked completely. Consequently, 140KN may be taken as its cracking
load. With the increase of the value of V, the cracks developed comprehensively. Until
180KN, the horizontal crack of the longitudinal walls of the first floor had developed
towards to 4-5mm width and continuously stretched towards windows of the transverse
walls, and the cohesion of the masonry mortar under the ring beams had lost thoroughly.
Under the action of the topple moment and shear stress, the brick walls above the
horizontal cracks severely dislocated 7-8 mm. Otherwise, the character of the damage of
the walls between upper and lower doors or windows was the same as that of intersecting
diagonal shear cracks of connecting beams of shear walls. And then, the model had been
damaged completely (see Figure 5 (b)).
PBM. In figure 5(c), when V reached 140KN, the masonry wall around windows cracked
firstly, and cracks radiated and stretched to columns. At the end of cracking, Vcr was about
160kN, there had been ladder cracks on all sides of door-hole and window-hole. At the
same time, there had been sloping cracks lined up columns and brick walls in the middle
column of the first floor comprehensively. The horizontal cracks of vertical walls also
developed towards horizontal walls and stretched till neighboring middle column. The
cracks’ width of PBM is smaller than BM greatly, obvious dislocation could be seen in the
upside brick walls additionally. All above demonstrate that the bending force of prestressed
forces is proficient. The destruction load Vu is 235KN (figure 5(d)). In addition, the
destructive character of the connecting beams of shearing walls is similar to that of BM.

6
(a) Drawing of BM’s horizontal walls after destruction
(b) Destruction drawing of PBM’s horizontal walls
(c) Destruction drawing of BM’s vertical walls
(d) Destruction drawing of PBM’s vertical walls
Figure5 Destruction figures of BM and PBM
THE INFLUENCE TO ANTI-SHEARING CAPABILITY BY TOPPLE MOMENT
In List 3 and List 4,we present a comparison of displacement, anti-cracking and
anti-shearing capabilities between models and sole-story-sole-piece-holed brick
walls [1][3] .We know that such properties above of model BM and model PBM are higher
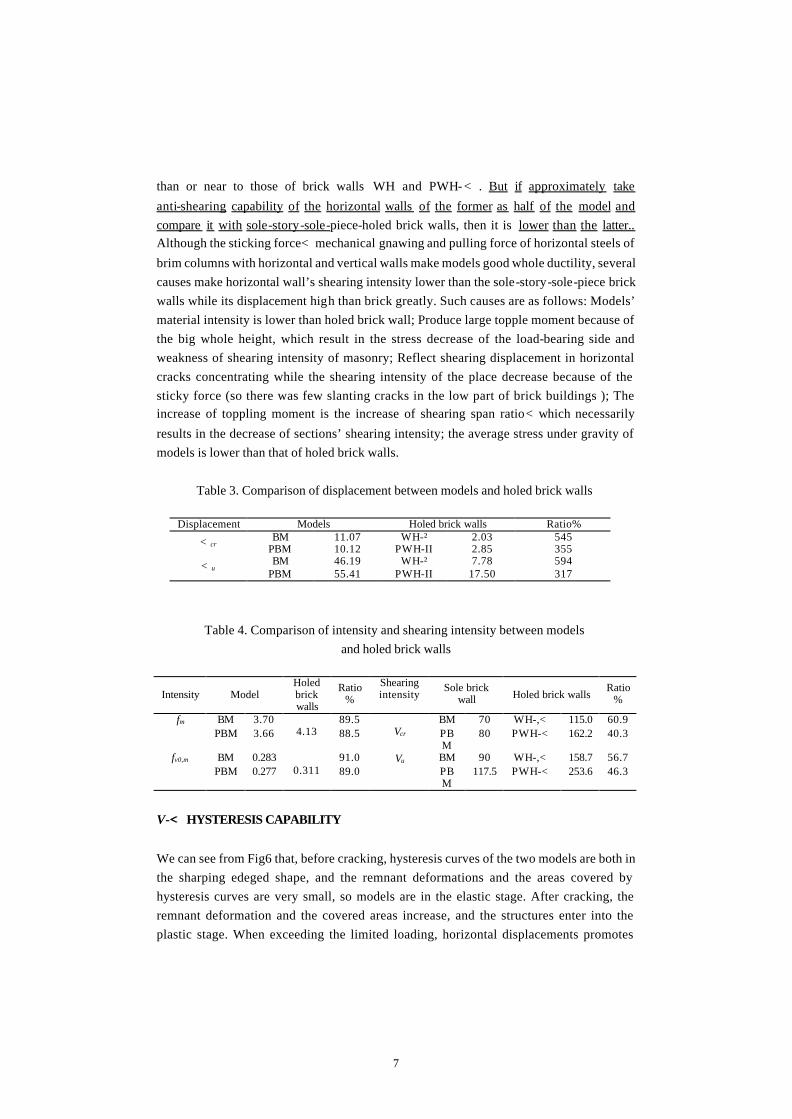
7
than or near to those of brick walls WH and PWH-� . But if approximately take
anti-shearing capability of the horizontal walls of the former as half of the model and
compare it with sole-story-sole-piece-holed brick walls, then it is lower than the latter.. Although the sticking force�mechanical gnawing and pulling force of horizontal steels of
brim columns with horizontal and vertical walls make models good whole ductility, several
causes make horizontal wall’s shearing intensity lower than the sole-story-sole-piece brick
walls while its displacement high than brick greatly. Such causes are as follows: Models’
material intensity is lower than holed brick wall; Produce large topple moment because of
the big whole height, which result in the stress decrease of the load-bearing side and
weakness of shearing intensity of masonry; Reflect shearing displacement in horizontal
cracks concentrating while the shearing intensity of the place decrease because of the
sticky force (so there was few slanting cracks in the low part of brick buildings ); The increase of toppling moment is the increase of shearing span ratio�which necessarily
results in the decrease of sections’ shearing intensity; the average stress under gravity of
models is lower than that of holed brick walls.
Table 3. Comparison of displacement between models and holed brick walls
Displacement Models Holed brick walls Ratio%
BM 11.07 WH-² 2.03 545 �cr PBM 10.12 PWH-II 2.85 355 BM 46.19 WH-² 7.78 594 �u
PBM 55.41 PWH-II 17.50 317
Table 4. Comparison of intensity and shearing intensity between models
and holed brick walls
Intensity Model Holed brick walls
Ratio%
Shearing intensity
Sole brick wall Holed brick walls
Ratio%
BM 3.70 89.5 BM 70 WH-,� 115.0 60.9 fm
PBM 3.66 4.13 88.5 Vcr PBM
80 PWH-� 162.2 40.3
fv0,m BM 0.283 91.0 Vu BM 90 WH-,� 158.7 56.7 PBM 0.277 0.311 89.0 PB
M 117.5 PWH-� 253.6 46.3
V-�� HYSTERESIS CAPABILITY
We can see from Fig6 that, before cracking, hysteresis curves of the two models are both in
the sharping edeged shape, and the remnant deformations and the areas covered by
hysteresis curves are very small, so models are in the elastic stage. After cracking, the
remnant deformation and the covered areas increase, and the structures enter into the
plastic stage. When exceeding the limited loading, horizontal displacements promotes
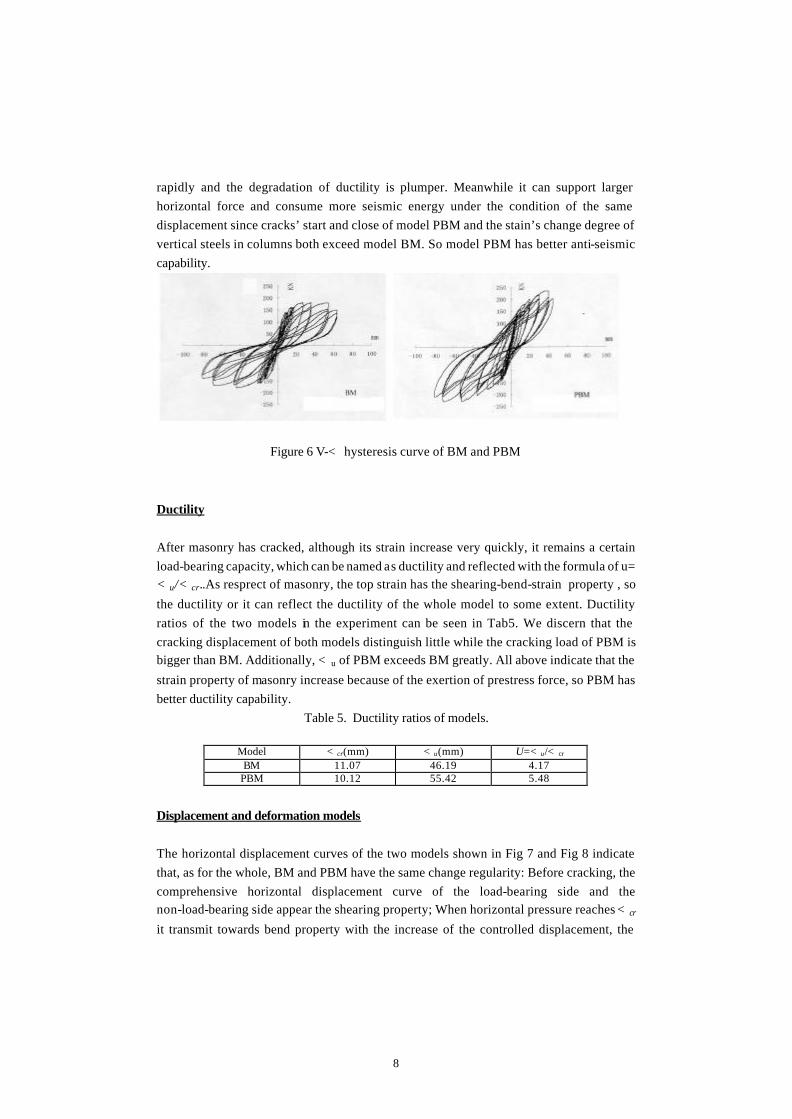
8
rapidly and the degradation of ductility is plumper. Meanwhile it can support larger
horizontal force and consume more seismic energy under the condition of the same
displacement since cracks’ start and close of model PBM and the stain’s change degree of
vertical steels in columns both exceed model BM. So model PBM has better anti-seismic
capability.
Figure 6 V-� hysteresis curve of BM and PBM
Ductility
After masonry has cracked, although its strain increase very quickly, it remains a certain
load-bearing capacity, which can be named as ductility and reflected with the formula of u=�u/�cr..As resprect of masonry, the top strain has the shearing-bend-strain property , so
the ductility or it can reflect the ductility of the whole model to some extent. Ductility
ratios of the two models in the experiment can be seen in Tab5. We discern that the
cracking displacement of both models distinguish little while the cracking load of PBM is bigger than BM. Additionally, �u of PBM exceeds BM greatly. All above indicate that the
strain property of masonry increase because of the exertion of prestress force, so PBM has
better ductility capability.
Table 5. Ductility ratios of models.
Model �cr(mm) �u(mm) U=�u/�cr
BM 11.07 46.19 4.17 PBM 10.12 55.42 5.48
Displacement and deformation models
The horizontal displacement curves of the two models shown in Fig 7 and Fig 8 indicate
that, as for the whole, BM and PBM have the same change regularity: Before cracking, the
comprehensive horizontal displacement curve of the load-bearing side and the non-load-bearing side appear the shearing property; When horizontal pressure reaches�cr
it transmit towards bend property with the increase of the controlled displacement, the
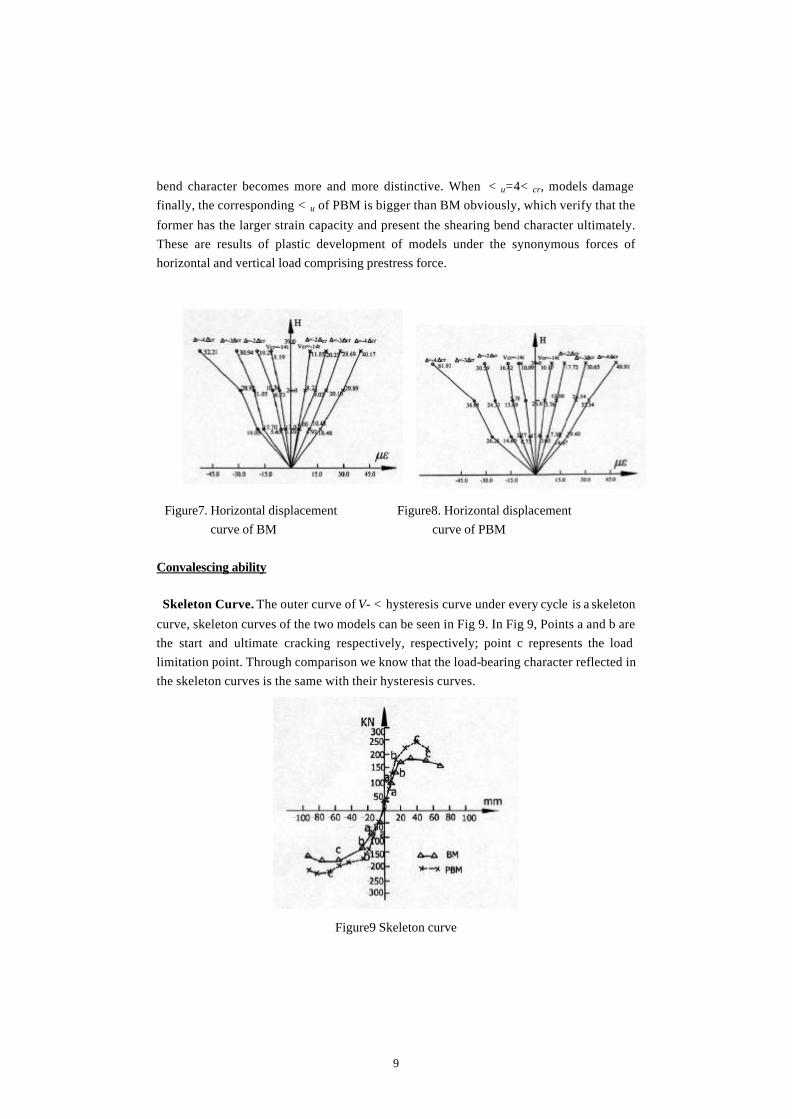
9
bend character becomes more and more distinctive. When �u=4�cr, models damage
finally, the corresponding �u of PBM is bigger than BM obviously, which verify that the
former has the larger strain capacity and present the shearing bend character ultimately.
These are results of plastic development of models under the synonymous forces of
horizontal and vertical load comprising prestress force.
Figure7. Horizontal displacement Figure8. Horizontal displacement
curve of BM curve of PBM
Convalescing ability
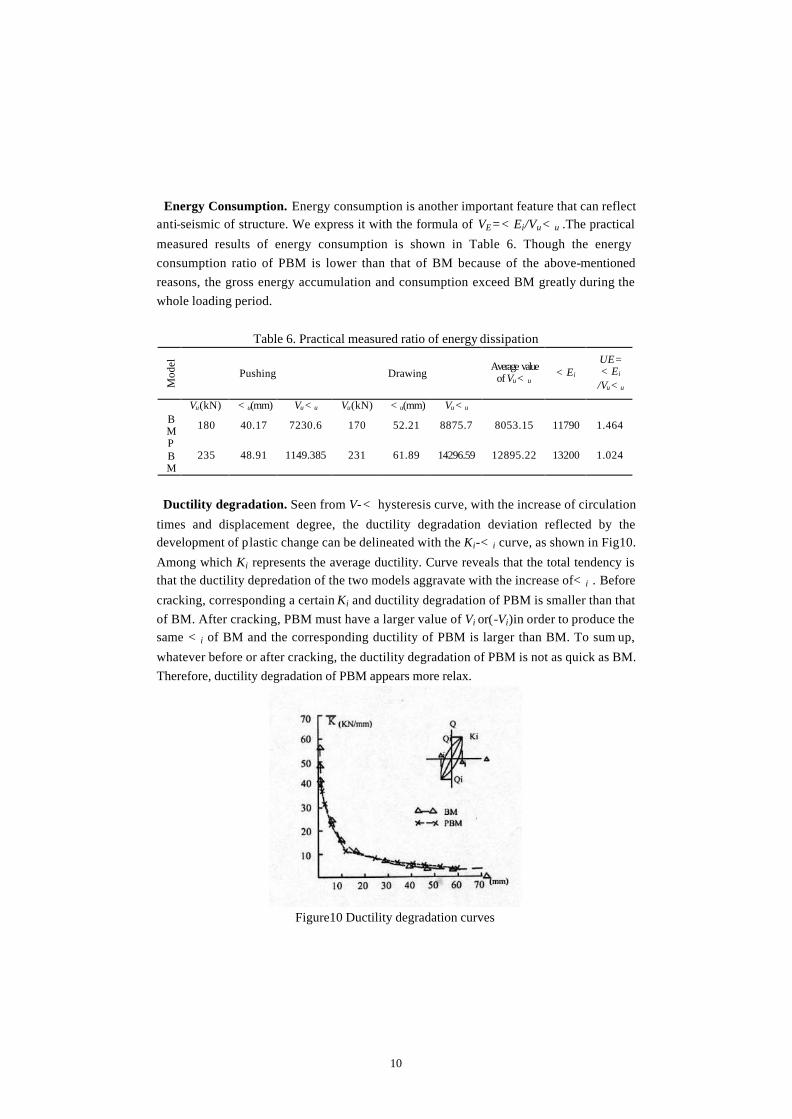
Skeleton Curve. The outer curve of V- �hysteresis curve under every cycle is a skeleton
curve, skeleton curves of the two models can be seen in Fig 9. In Fig 9, Points a and b are
the start and ultimate cracking respectively, respectively; point c represents the load
limitation point. Through comparison we know that the load-bearing character reflected in
the skeleton curves is the same with their hysteresis curves.
Figure9 Skeleton curve
10
Energy Consumption. Energy consumption is another important feature that can reflect anti-seismic of structure. We express it with the formula of VE=�Ei/Vu�u .The practical
measured results of energy consumption is shown in Table 6. Though the energy
consumption ratio of PBM is lower than that of BM because of the above-mentioned
reasons, the gross energy accumulation and consumption exceed BM greatly during the
whole loading period.
Table 6. Practical measured ratio of energy dissipation
Mod
el
Pushing Drawing Average value
of Vu�u �Ei
UE=�Ei
/Vu�u
Vu(kN) �u(mm) Vu�u Vu(kN) �u(mm) Vu�u BM 180 40.17 7230.6 170 52.21 8875.7 8053.15 11790 1.464
PBM
235 48.91 1149.385 231 61.89 14296.59 12895.22 13200 1.024
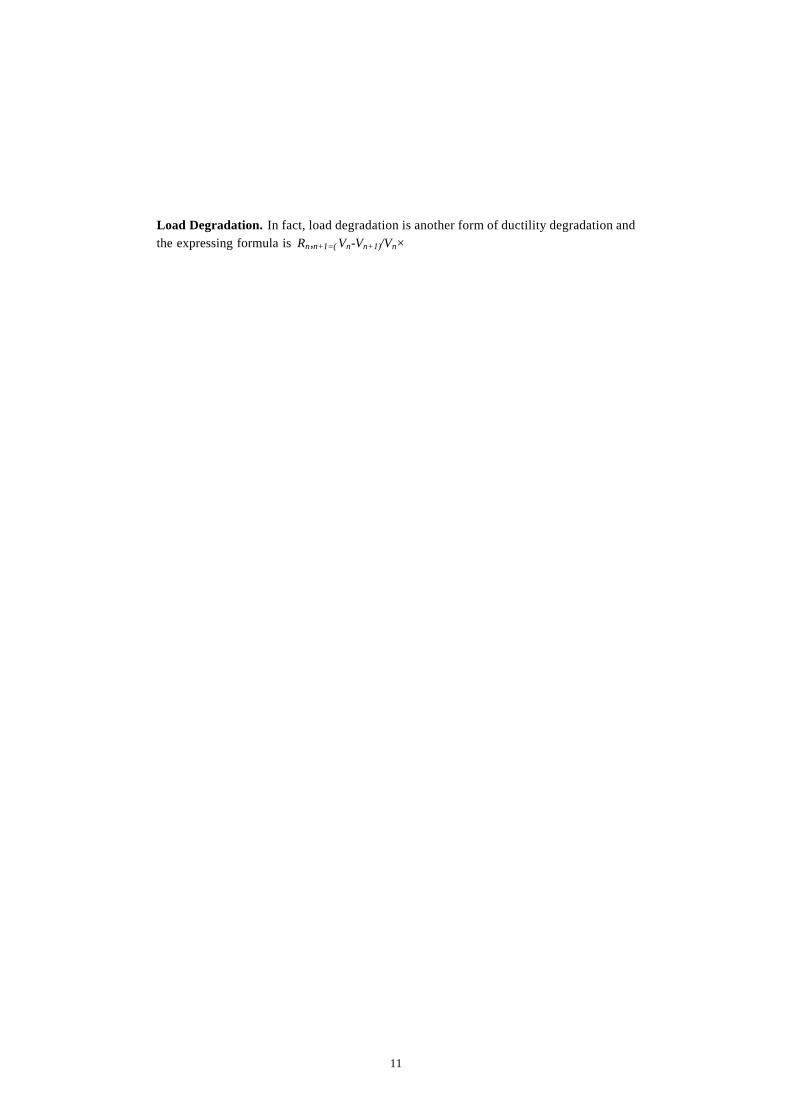
Ductility degradation. Seen from V-� hysteresis curve, with the increase of circulation
times and displacement degree, the ductility degradation deviation reflected by the development of plastic change can be delineated with the Ki-�i curve, as shown in Fig10.
Among which Ki represents the average ductility. Curve reveals that the total tendency is that the ductility depredation of the two models aggravate with the increase of�i . Before
cracking, corresponding a certain Ki and ductility degradation of PBM is smaller than that
of BM. After cracking, PBM must have a larger value of Vi or(-Vi)in order to produce the same �i of BM and the corresponding ductility of PBM is larger than BM. To sum up,
whatever before or after cracking, the ductility degradation of PBM is not as quick as BM.
Therefore, ductility degradation of PBM appears more relax.
Figure10 Ductility degradation curves
11
Load Degradation. In fact, load degradation is another form of ductility degradation and the expressing formula is Rn,n+1=( Vn-Vn+1)/Vn�100%=(1-�n,n+1)�100%, �n,n+1=Vn/Vn+1.
Among which n represents circulation circumference and Rn,n+1 is named load degradation
coefficient between the nth and the (n+1)th circulation. By comparison we know that the
load degradation of PBM and BM intensify with the increase of horizontal load. When
cracking, the load degradation value of PBM is 13.44%, which is lower than that of BM’s
20.79%, then the structure enter into the unstable plastic stage but remains a certain stain
ability. After cracking, the load degradation value of PBM is 11.49%, which is also lower
than 12.0% of BM. So the reciprocation load-bearing capability of PBM is more excellent
than BM.
CONCLUSIONS
Through research on the anti-seismic capability of prestressed brick buildings, we can
acquire such conclusion as follows:
(1) The cracking load and limitation load of PBM are both higher than BM. Under the
condition of this experiment, the cracking load increases about 14.3% and the Limitation
load increases 30.6% or so;
(2) The formation of hysteresis curves of PBM and BM are similar approximately, but
the covered area of the former is bigger than the latter. As the increase of V, the ductility
degradation of every circulation of PBM are all smaller than BM. So PBM has the better
load-bearing ability and potential strain capability;
(3) The ductility and energy consumption of the prestressed masonry are both better than
the non-prestressed masonry, which reveals that the prestressed masonry has the better
anti-seismic capability;
(4) Horizontal displacement forms of the two models are the same, that is, the
load-bearing side is of bend property and the total strain model is of bend-shearing
property which near to shearing model very much;
(5) Many-storied house has approximately the similar load-shearing property as the
sole-story-sole-piece brick wall under the same loading conditions. But the important
distinction lies in that building models can bring into play the space superiority. On the
other hand, the topple moment resulted from the increase of the whole height will
obviously weaken the anti-cracking and load-bearing capabilities of horizontal walls of
building models, and greatly increase their horizontal displacements. We should pay much
attention to such problems in the engineering design.

12
REFERENCES
Li Xi-jun (2000). Research on the Anti-seismic Capability of Prestresse Brick Building (in
Chinese), Master thesis, Chongqing Jianzhu University.
Luo Wan-kang, Wang Tan-xian (1995). Experimental Study on the Deformation, Ductility
and Dissipation Energy of Prestressed Brick Wall (in Chinese). World Earthquake
Engineering. No.2.
Luo Wan-kang, Wang Tan-xian, Liao chun-shen, Zhu Xi-chen, (1998). Survey on the
anti-seismic capability of prestressed-holed brick wall (in Chinese). Building Structure,
(4).
Tianjin University, Tongji University, South-East University, major compile, Qinghua
University major review. Chinese Building Institutional Publish, 1994.6 Concrete
Structure (in Chinese).
Wang Shan, (2000). Non-linear Simulation of Prestressed-Combined Brick Wall (in
Chinese), Master thesis, Chonging Jianzhu University.
Zhang Hai-feng etc. (1982). Research on the anti-seismic capability of brick walls in 2.8m
height and 6m width with Structural Columns (in Chinese), Sichuan Province Building
Scientific Research Institution.