experimental observation of collisions of … · envelope pulses in a left-handed transmission line...
TRANSCRIPT

Progress In Electromagnetics Research C, Vol. 26, 59–70, 2012
EXPERIMENTAL OBSERVATION OF COLLISIONS OFNONLINEAR ENVELOPE PULSES IN LEFT-HANDEDTRANSMISSION LINES PERIODICALLY LOADED WITHSCHOTTKY VARACTORS
K. Narahara* and Y. Yamane
Graduate School of Science and Engineering, Yamagata University, 4-3-16 Jonan, Yonezawa, Yamagata 992-8510, Japan
Abstract—We investigate experimentally the collisions of nonlinearenvelope pulses in a left-handed transmission line with regularly spacedSchottky varactors. By measuring the test line, we successfullyobserved that when two nonlinear envelope pulses traveling in oppositedirections collide, two new envelope pulses are developed. These newpulses satisfy the phase-matching condition, and their carrier wavefrequencies are the sum of the carrier wave frequencies of the originalpulses. This article describes the experimental observations, togetherwith the fundamental properties and numerical performance prospectsof the test line.
1. INTRODUCTION
Recently, it was found that the collision of two nonlinear envelopepulses in composite right- and left-handed (CRLH) transmission linesperiodically loaded with Schottky varactors leads to the developmentof a pair of envelope pulses (one traveling in the forward direction andthe other in the backward direction) [1]. CRLH lines [2] are able tomanage the dispersive properties of propagating waves [3, 4]. Theyhave also received attention as the platform for the development ofnonlinear envelope pulses [5–10]. The dispersion of CRLH lines can becompensated by the nonlinearity introduced by the varactors, resultingin a soliton-like envelope pulse. The collision-generated pulses canwiden the application of nonlinear pulses in microwave and millimeter-wave engineering.
It is well known [11] that the efficiency of harmonic-wavegeneration in two-wave mixing is maximized, when the phase-matching
Received 18 October 2011, Accepted 4 December 2011, Scheduled 11 December 2011* Corresponding author: Koichi Narahara ([email protected]).

60 Narahara and Yamane
condition is satisfied. This condition is given by
k3 ∼ m1k1 + m2k2, (1)
where k1 and k2 represent the wave numbers of incident waves, andk3 represents the wave number of the newly generated harmonic wave.Moreover, m1 and m2 are integers that are specified by the order ofthe generated harmonics. When the incident pulses have a commoncarrier frequency and are traveling in opposite directions, it resultsin the condition k1 = −k2. Hence, the maximal second harmonicgeneration can be observed when k3 ∼ 0. Consider the dispersionrelationship of CRLH lines. For left-handed waves, there exists anupper-most cut-off frequency, called ωl, which corresponds to a wavenumber of zero. Hence, nonlinear pulses having a carrier frequency of∼ ωl/2 can generate second harmonic pulses effectively using collisions.On the other hand, in the case when the carrier frequencies of twocolliding pulses become unequal, the second harmonic envelope pulsetravels mainly to the left (right) if k3 > (<)0. In addition, the carrierfrequency of the collision-generated pulses is the sum of the frequenciesof the original pulses.
The purpose of this paper is to experimentally validate thesecalculations in relation to the collision-generated pulses. It is desirablethat we can fix erroneous operations by reformation of the test circuitand detect easily voltages at any cells. We thus employed a standardbreadboard. As a penalty of the advantages, the experiments hadto be carried out at MHz frequencies, being much smaller thanthe frequencies at which the left-handed lines are utilized in free-space applications such as the new-type leaky-wave antenna discussedpreviously [1]. Moreover, we eliminated the series inductors from thetest line to minimize the wave attenuation caused by the parasiticresistors. As a result, the test line did not exhibit right-handedness atany frequency bands. On the other hand, we could observe clearly thefundamental properties of the collision-generated pulses including theefficiency of the phase-matching condition.
First, we describe the fundamental properties of the test lineused for the experiments, including the line structure, equivalentrepresentation, and dispersion relationship. We then describe severalresults obtained by the experiments. We observed the developmentof collision-generated pulses. Furthermore, the relationship betweenthe wave numbers and carrier frequencies for the colliding andnewly developed pulses was evaluated to examine whether the phase-matching condition determines the properties of the newly developedpulses.

Progress In Electromagnetics Research C, Vol. 26, 2012 61
2. FUNDAMENTAL PROPERTIES OF THE TESTLEFT-HANDED LINE
Figure 1(a) shows the representation of the unit cell for the test line weinvestigated experimentally. The series capacitor and shunt inductorare represented by CL and LL, respectively. Ri shows the parasiticresistance of the inductors. As mentioned above, the dispersionrelationship of the test line does not have the right-handed branch,which appears in the CRLH lines’ dispersion relationship. To introducethe nonlinearity, the shunt capacitor is replaced with a Schottkyvaractor CR, whose capacitance-voltage relationship is generally givenby
C(V ) =C0(
1− VVJ
)M, (2)
(a) (b)
(c)
Figure 1. Properties of the test left-handed line. (a) The unit-cellstructure, (b) the dispersion relationship, and (c) the photograph ofthe test line investigated experimentally. In Fig. 1(b) the wave numbercorresponding to the points A, B, and C is represented by kA, kB, andkC , respectively.

62 Narahara and Yamane
where V represents the terminal voltage and C0, VJ , and M arethe zero-bias junction capacitance, junction potential, and gradingcoefficient, respectively. We consider a situation where each Schottkyvaractor was biased at −V0(V0 > 0). For convenience, we define C
(0)R
as C(0)R ≡ C(−V0) = C0/(1 + V0/VJ)M .Using these variables, the long-wavelength dispersion relationship
ω = ω(k) is expressed as [12]
ω(k) =1√
CLLL
(C
(0)R
CL+ k2 − k4
12 + k6
360
) , (3)
where ω and k represent the angular frequency and wave number,respectively. Fig. 1(b) shows the sample dispersion relationshipobtained using the line parameters listed in Table 1 and setting V0
to 3.0V. The line has a cut-off frequency fu, which corresponds to thezero wave number, and exhibits a left-handed property. Presently, fu
is calculated to be 2.9 MHz.
3. EXPERIMENTS
Figure 1(c) shows the photo of a one-dimensional left-handed line usedfor the measurements. The circuit was built on a standard breadboard.The Schottky varactors used were TOSHIBA 1SV101 diodes. Shuntinductances and series capacitances were implemented using 100µHinductors (TDK EL0405) and 47 pF capacitors (TDK FK24C0G1),respectively. The values in Table 1 simulate the test line, which wasfed by pulse signals generated by an NF WF1974 two-channel arbitrarywaveform generator. An envelope pulse with a triangle waveform wereinput at both ends of the line, and the pulse widths were set to include20 cycles of the carrier sinusoidal wave. The pulse’s bandwidth wasin most cases 0.2 MHz for the frequencies we used. The signals alongthe test line were detected using Agilent 10073C passive probes andwere monitored in the time domain using an Agilent DSO90254Aoscilloscope. The test line was already validated to ensure that it
Table 1. Line parameters used for numerical evaluations of the testline.
CL 47 pF M 1.26LL 100µH VJ 3.6 VRi 20.0Ω C0 65 pF

Progress In Electromagnetics Research C, Vol. 26, 2012 63
has the expected dispersive properties [12]. As expected, the parasiticresistance of the inductors was significant; therefore, the attenuationconstant was estimated to be 1.5× 10⁻² nepers/cell. This attenuationresults in limited contribution of nonlinearity.
We first tried to detect the collision-generated pulses. We set V0
to 3.0 V. Envelope pulses having carrier frequencies of 1.25 MHz and1.40MHz were applied at the left and right ends, respectively. Hence,the right- and left-going pulses occupy the points A and B, respectively,in Fig. 1(b). The sum-frequency (= 2.65MHz) corresponds to pointC. The wave numbers kA, kB, and kC were calculated to be 1.98, 1.62,and 0.36 rad/cell, respectively. This means that the phase-matchingcondition was well satisfied, i.e., kA−kB ∼ kC . Moreover, the collision-generated pulse was supposed to travel to the right. The total cellnumber was set to 105. Although this cell number was sufficiently smallto avoid excessive wave attenuation which disables the nonlinearity,the small cell number made it difficult to secure the time windowto differentiate between the incident and collision-generated pulses.However, there was sufficient separation between these two pulses inthe frequency domain because the collision-generated pulses have asum-frequency carrier. We therefore performed the Fourier-transformoperation on the measured temporal waveforms and operate band-passfilters to separate the incident and collision-generated pulses in thefrequency domain. Then, the separated time-domain waveforms wereobtained by inverse Fourier transform.
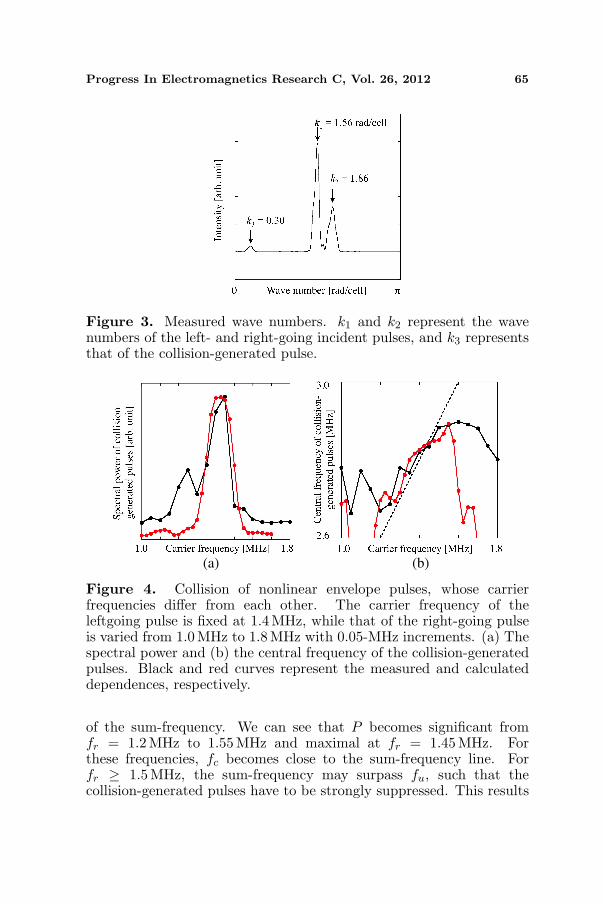
Figure 2 shows the measurement results. Six different spatialwaveforms are plotted with temporal increments of 2.0µs. The redand blue waveforms represent the incident and collision-generatedpulses, respectively. In Fig. 2(a), the right- and left-going incidentpulses start to collide. It was found that longer-wavelength pulsesare consistently generated by collisions and start to travel to theright, as we can see in Figs. 2(b)–(f), where arrows are attached tothe collision-generated pulses. We performed the Fourier-transformoperation on the measured spatial waveform and obtained Fig. 3.Three peaks in the spectrum corresponded to the carrier waves ofthe incident and collision generated pulses. The wave numbers of theleft- and right-going incident pulses were estimated to be 1.56 rad/celland 1.86 rad/cell, respectively. Moreover, the collision-generated pulsehad the wave number of 0.30 rad/cell, which was coincident withthe difference between the wave numbers of the left- and right-goingincident pulses.
We then varied the carrier frequency of the pulse applied to theleft end called fr, from 1.0 MHz to 1.8 MHz with 0.05 MHz increments,while the carrier frequency was kept fixed at 1.4 MHz for the pulse

64 Narahara and Yamane
(a)
(b)
(c)
(d)
(e)
(f)
Figure 2. Measured spatial waveforms. The red and blue waveformsrepresent the incident and collision-generated pulses, respectively. Thefigures are in order of increasing time with 2.0-µs increments.
applied to the right end. To characterize the collision-generatedpulses, we use two quantities: the spectral power and the centralfrequency. These two are respectively defined by P =
∫ ft
fb|S(f)|df and
fc =∫ ft
fbf |S(f)|df/P , where S(f) represents the Fourier amplitude of
the frequency f . In addition, fb and ft are respectively the lower andhigher cutoff frequencies of the band-pass filter used to extract theFourier components corresponding to the collision-generated pulses.The black curves in Figs. 4(a) and (b) represent P and fc, whichwere obtained by recording and Fourier-transforming the waveformsat n = 50. The dashed line in Fig. 4(b) represents the positions
Progress In Electromagnetics Research C, Vol. 26, 2012 65
Figure 3. Measured wave numbers. k1 and k2 represent the wavenumbers of the left- and right-going incident pulses, and k3 representsthat of the collision-generated pulse.
(a) (b)
Figure 4. Collision of nonlinear envelope pulses, whose carrierfrequencies differ from each other. The carrier frequency of theleftgoing pulse is fixed at 1.4MHz, while that of the right-going pulseis varied from 1.0 MHz to 1.8MHz with 0.05-MHz increments. (a) Thespectral power and (b) the central frequency of the collision-generatedpulses. Black and red curves represent the measured and calculateddependences, respectively.
of the sum-frequency. We can see that P becomes significant fromfr = 1.2MHz to 1.55 MHz and maximal at fr = 1.45MHz. Forthese frequencies, fc becomes close to the sum-frequency line. Forfr ≥ 1.5MHz, the sum-frequency may surpass fu, such that thecollision-generated pulses have to be strongly suppressed. This results

66 Narahara and Yamane
in an abrupt decrease in P between fc = 1.45 and 1.5 MHz. Onthe other hand, for fr < 1.2MHz, the corresponding wave numberbecomes much larger than that at fr = 1.4MHz. Therefore, the phase-matching condition cannot be satisfied, irrespective of what frequenciesare included in the pulse bandwidth.
The black curves in Fig. 5 represent another measured frequencydependence of P and fc. Presently, the carrier frequencies of theincident pulses frl are varied from 1.26 to 1.54 MHz with 0.01 MHzincrements such that both the right- and left-going pulses have anidentical frequency. As in Fig. 4, Figs. 5(a) and (b) show P and fc
that are obtained by recording and Fourier-transforming waveformsat n = 50. The dashed line in Fig. 5(b) corresponds to thesecond harmonic frequency. We can see that P becomes maximal atfrl = 1.43MHz, where fc coincides exactly with the second harmonicfrequency. Moreover, for frl < (>)1.43 MHz, fc becomes greater (less)than the second harmonic frequency. The small discrepancy between fc
and the second harmonic frequency suggests that the proper frequencycomponents of the incident pulses contribute to the generation ofsecond harmonic pulses. The black curves in Figs. 6(a) and (b) showthe measured dependence of P and fc on V0. Both the right- andleft-going incident pulses have a 1.4-MHz carrier frequency. We cansee that P becomes maximal at V0 = 3.0V, which suggests that atthis bias voltage, phase matching is mostly satisfied. For other biasvoltages, fu becomes varied. This alteration in dispersion results in theviolation of the phase matching condition and explains the decrease in
(a) (b)
Figure 5. Collision of nonlinear envelope pulses having identicalcarrier frequency. (a) The spectral power and (b) the central frequencyof the collision-generated pulses. Black and red curves represent themeasured and calculated dependences, respectively.

Progress In Electromagnetics Research C, Vol. 26, 2012 67
(a) (b)
Figure 6. Properties of collision-generated pulses for different biasvoltages. The carrier frequencies of left- and right-going pulses are bothset to 1.4 MHz. (a) The spectral power and (b) the central frequencyof the collision-generated pulses. Black and red curves represent themeasured and calculated dependences, respectively.
P for these bias voltages. In Fig. 6(b), fc increases as V0 increases. Thecarrier frequency of the collision-generated pulses can be managed bychanging V0.
4. DISCUSSION
To predict the behavior of collision-generated pulses, we numericallysolve the transmission equations given by
CLd
dt(Vn−1 − Vn) = In, (4)
LLd
dt
[C(Vn − V0)
dVn
dt
]= −RiC(Vn − V0)
dVn
dt− Vn
+(
LLd
dt+ Ri
)(In − In+1) , (5)
where Vn and In show the line voltage and current, respectively, at thenth cell. The setup of the input signals and biasing voltage is the sameas that of the measurements used to obtain Fig. 2.
That is, we use the values listed in Table 1 and set V0 to3.0V. Moreover, 1.25-MHz and 1.40-MHz envelope pulses are appliedat the left and right ends, respectively. Fig. 7 shows six spatialwaveforms with 2.0-µs increments. We separate the incident andcollision-generated pulses using the above-mentioned flow. The red and

68 Narahara and Yamane
(a)
(b)
(c)
(d)
(e)
(f)
Figure 7. Calculated spatial waveforms. The red and blue waveformsrepresent the incident and collision-generated pulses, respectively. Thefigures are in order of increasing time with 2.0-µs increments.
blue waveforms represent the incident and collision-generated pulses,respectively. We can clearly observe the development of a collision-generated longer-wavelength envelope pulse, which starts to travel tothe right. The properties of the calculated collision-generated pulsesare shown in Figs. 4 to 6 by the red curves. The similarity between themeasured and calculated properties of the collision-generated pulses inFigs. 2 to 7 is sufficient to consider the numerical model as reliablemodel for the prediction of the behavior of nonlinear pulses. Usingthis numerical model, we evaluated the phase-matching condition. Weset the total cell number and Ri to 1000 and 0.0 Ω, respectively. Weperformed the Fourier-transform operation on the calculated spatial

Progress In Electromagnetics Research C, Vol. 26, 2012 69
Figure 8. Phase-matching condition for the test lines. k1,2 and k3
represent the wave numbers of the incident and collision-generatedwaves, respectively.
waveforms. Fig. 8 shows the result. Red and black curves represent theseparation of the wave numbers corresponding to the incident carrierwaves and the wave number of the collision-generated carrier waves,respectively. It was clearly seen that k3 ∼ |k1 − k2|, so that the phase-matching condition governed the properties of the collision-generatedpulses.
5. CONCLUSION
We experimentally characterized the collision of nonlinear envelopepulses in left-handed transmission line that are periodically loadedwith Schottky varactors. We explicitly observe collision-generatedpulses whose carrier frequencies are given by the sum of the incidentpulses. It was also established that the phase-matching conditiondetermines the efficiency of obtaining large collision-generated pulses.Moreover, numerical calculations using a simplified model of the linewell simulated the measured results.
REFERENCES
1. Narahara, K., “Collision of nonlinear envelope pulses developed incomposite right- and left-handed transmission lines periodicallyloaded with Schottky varactors,” Progress In ElectromagneticsResearch C, Vol. 21, 1–12, 2011.
2. Caloz, C. and T. Itoh, Electromagnetic Metamaterials: Transmis-sion Line Theory and Microwave Applications, Wiley, 2006.

70 Narahara and Yamane
3. Monti, G. and L. Tarricone, “Signal reshaping in a transmissionline with negative group velocity behaviour,” Microwave OpticalTechnol. Lett., Vol. 51, 2627–2633, 2009.
4. Chi, P. and T. Itoh, “Dispersion engineering with CRLHmetamaterials,” Proc. IEEE International Symposium on Radio-Frequency Integration Technology, 128–131, 2009.
5. Kozyrev, A. B. and D. W. van der Weide, “Nonlinear wavepropagation phenomena in left-handed transmission-line media,”IEEE Trans. Microwave Theory and Techniques, Vol. 53, 238–245,2005.
6. Gupta, S. and C. Caloz, “Dark and bright solitons in left-handednonlinear transmission line metamaterials,” Proc. IEEE MTT-SInt’l. Microwave Symp., 979–982, Honolulu, 2007.
7. Kafaratzis, A. and Z. Hu, “Envelope solitons in nonlinear lefthanded transmission lines,” Proc. Metamaterials 2007, 22–24,771–773, 2007.
8. Simion, S., R. Marcelli, G. Bartolucci, G. Sajin, and F. Craci-unoiu, “Nonlinear composite right/left-handed transmission linefor frequency doubler and short pulse generation,” Proc. Metama-terials 2008, 492–494, 2008.
9. Gharakhili, F. G., M. Shahabadi, and M. Hakkak, “Bright andDark soliton generation in a left-handed nonlinear transmissionline with series nonlinear capacitors,” Progress In Electromagnet-ics Research, Vol. 96, 237–249, 2009.
10. Ogasawara, J. and K. Narahara, “Short envelope pulsepropagation in composite right- and left-handed transmissionlines with regularly spaced Schottky varactors,” IEICE Electron.Express, Vol. 6, 1576–1581, 2009.
11. Boyd, R. W., Nonlinear Optics, Academic Press, 2002.12. Ogasawara, J. and K. Narahara, “Experimental characterization
of left-handed transmission lines with regularly spaced Schottkyvaractors,” IEICE Electronics Express, Vol. 7, No. 4, 608–614,2010.